A Race to the Bottom? Employment Protection …web.williams.edu/Economics/seminars/olneyEP.pdfA Race...
44
A Race to the Bottom? Employment Protection and Foreign Direct Investment William W. Olney 1 First Draft: November 2010 Revised: April 2011 Abstract A common critique of globalization is that it leads to a race to the bottom. This hypothesis assumes that multinationals invest in countries with lower regulatory standards and that countries competitively undercut each others standards in response. This paper examines both assumptions and nds evidence of the rst but no support for the second. Specically, a reduction in employment protection rules leads to an increase in foreign direct investment (FDI). Not surprisingly, changes in employment protection legislation have a stronger impact on the relatively mobile types of FDI. However, there is no evidence that countries are competitively undercutting each others labor market standards, despite the fact that doing so would attract FDI. Keywords : foreign direct investment; employment protection; race to the bottom JEL Codes : F16; F23 1 Department of Economics, Williams College, Williamstown, MA 01267 (email: [email protected]).
Transcript of A Race to the Bottom? Employment Protection …web.williams.edu/Economics/seminars/olneyEP.pdfA Race...
A Race to the Bottom? Employment Protection and ForeignDirect Investment
William W. Olney1
First Draft: November 2010
Revised: April 2011
Abstract
A common critique of globalization is that it leads to a race to the bottom. This
hypothesis assumes that multinationals invest in countries with lower regulatory standards
and that countries competitively undercut each other’s standards in response. This paper
examines both assumptions and finds evidence of the first but no support for the second.
Specifically, a reduction in employment protection rules leads to an increase in foreign
direct investment (FDI). Not surprisingly, changes in employment protection legislation
have a stronger impact on the relatively mobile types of FDI. However, there is no evidence
that countries are competitively undercutting each other’s labor market standards, despite
the fact that doing so would attract FDI.
Keywords: foreign direct investment; employment protection; race to the bottom
JEL Codes: F16; F23
1Department of Economics, Williams College, Williamstown, MA 01267 (email:[email protected]).
1 Introduction
The race to the bottom hypothesis hinges on two important assumptions. First, it is
assumed that multinational enterprises (MNE) choose to invest in countries with less re-
strictive standards. Second, it is assumed that foreign countries competitively undercut
each other’s standards in order to attract FDI. While a common critique of globalization is
that it can lead to a race to the bottom, there is relatively little evidence supporting either
of these key assumptions. This paper tests these predictions by examining the impact of
employment protection legislation on FDI and by examining the impact of labor market
standards in other countries on the employment protection legislation in the foreign host
country.
The mobility of capital, and in particular FDI, has increased substantially in the last
twenty five years. U.S. direct investment abroad as a share of gross domestic product has
increased from 6% in 1982 to 25% in 2009. Advances in transportation and communica-
tion have allowed different production activities to be relocated abroad. However, labor
market regulations, such as hiring and firing restrictions, will increase the costs of doing
business in a particular foreign country. As employment protection rules become stricter in
one country, multinationals will shift production activities to another relatively less costly
location. Thus, according to the first assumption of the race to the bottom hypothesis,
labor market restrictions will reduce FDI. Furthermore, the response of multinationals to
employment restrictions likely depends on the type of FDI. Relatively more mobile types
of FDI will have a greater ability to respond to changes in labor market restrictions than
FDI that is tied to a specific location. For instance, vertical FDI, which is motivated by
the desire to take advantage of low foreign factor prices, can be relocated to less expensive
locations relatively easily. However, horizontal FDI, which is motivated by the desire to
access a foreign market, needs to be near the foreign consumers.
The second key assumption of the race to the bottom hypothesis is that countries lower
their labor standards in order to undercut their competitors and attract FDI. As the average
labor standards in other foreign countries decreases, the foreign host country will lower
their labor standards in response. Thus, the average employment restrictions in other
1

foreign countries should have a positive impact on the employment protection rules in
the host country. While the intuition of the race to the bottom hypothesis is relatively
straightforward, there is little empirical evidence to support either assumption.
This paper examines these predictions using data on FDI by U.S. multinationals and
data on employment restrictions in twenty six foreign countries which collectively account
for over three quarters of U.S. outward FDI. Focusing on U.S. FDI is appealing because
it fixes parent country characteristics that may influence FDI. In addition, using detailed
data from the Bureau of Economic Analysis (BEA) on foreign affi liate sales of U.S. multina-
tionals allows horizontal, export-platform, and vertical FDI to be separately identified. The
measure of employment protection used in this analysis is a composite index of hiring and
firing costs obtained from the Organisation for Economic Co-operation and Development
(OECD). This provides a consistent and objective measure of differences in employment
protection legislation across countries and over time. Spanning twenty six countries and
twenty three years, the data set provides the scale and scope necessary to examine both
assumptions of the race to the bottom hypothesis.
To test the first assumption, the empirical analysis controls for time and country fixed
effects and estimates the relationship between employment protection and FDI using or-
dinary least squares (OLS), dynamic panel generalized methods of moments (GMM), and
instrumental variables (IV). The results in all specifications indicate that employment pro-
tection has a significant, negative impact on the foreign affi liate sales of U.S. multinationals.
This is consistent with the prediction that labor market restrictions will increase the costs
of production in the host country and thus reduce U.S. FDI to that foreign country.
Even more compelling is that the impact of employment protection varies across differ-
ent types of FDI in the manner predicted. There is relatively little impact of employment
restrictions on affi liate sales to the local market (horizontal FDI) but a more significant im-
pact of employment restrictions on affi liate sales to other foreign countries (export-platform
FDI). Finally, there is a large, negative, and significant impact of employment restrictions
on affi liates sales back the U.S. (vertical FDI). These contrasting results, provide compelling
evidence that labor market restrictions have the largest effect on the relatively more mobile
types of FDI. Thus, there is evidence that FDI responds to labor market restrictions and
2
that this response is strongest among the most footloose types of FDI. This verifies the first
assumption of the race to the bottom hypothesis and provides a motivation for countries to
lower their employment protection rules.
The second key assumption of the race to the bottom hypothesis is that countries com-
petitively undercut each other’s labor market standards in order to attract FDI. To test this
proposition, this paper examines whether host country employment protection legislation
depends on changes in labor market standards in other foreign countries. Competitor’s
labor market standards are quantified as the average of employment protection in other
foreign countries, which is calculated as an unweighted average, a weighted average based
on distance, or a weighted average based on vertical and export-platform FDI. OLS, GMM,
and IV results indicate that host country employment protection legislation does not de-
pend on the employment restrictions in other foreign countries regardless of which weighting
system is used. There is no evidence that countries are competitively undercutting each
other’s labor market restrictions, despite the fact that doing so would attract foreign direct
investment. Thus, this paper finds evidence supporting the first assumption of the race to
the bottom hypothesis but no evidence of the second assumption.
Additional results examine the relationship between employment protection and verti-
cal FDI in greater detail. Specifically, findings indicate that employment protection rules
decrease sales to U.S. parents and to a lesser extent sales to unaffi liated U.S. parties. In
addition, sales of goods, rather than sales of services, are more responsive to employment
restrictions. There is also evidence that both firing and hiring restriction have an im-
portant affect on vertical FDI, with the former having a larger negative impact than the
latter. Finally, an alternate maximum likelihood estimation strategy is used to examine the
robustness of the results that test the second assumption of the race to the bottom.
Multinationals play a crucial role in the increasingly integrated global economy. For
instance, forty percent of all U.S. trade occurs within the boundaries of the firm (U.S.
Census 2010). Understanding how multinationals decide where to locate production facilities
is crucial in explaining trade flows and understanding the implications of globalization
more generally. The determinants of FDI have been studied extensively (Carr et al. 2001,
Markusen and Maskus 2002, Blonigen et al. 2007). These studies have convincingly shown
3

that foreign country characteristics such as GDP, skill level, trade costs, investment costs,
and distance are important determinants of FDI. While the idea that multinationals are
attracted to foreign countries with less restrictive labor standards is intuitive and is gaining
traction in the popular press, relatively little is actually known about whether this is an
important determinant of FDI. The results in this paper provide clear evidence that labor
market restrictions have a significant effect on FDI.
Research on labor market restrictions typically focuses on the implications for employ-
ment (Lazear 1990, Acemoglu and Angrist 2001, Di Tella and MacCulloch 2005, Boeri and
Jimeno 2005) and for output (Besley and Burgess 2004). An important contribution of many
of these studies, relative to earlier work, is to look at within country variation using panel
data rather than simply making cross country comparisons. In this paper, I also control
for unobserved country characteristics but look at the global ramifications of employment
protection. Given the increasingly integrated world economy and the growing importance
of multinationals, it is also important to consider how employment restrictions will affect
FDI.
The few studies that examine the link between employment protection and FDI generate
mixed results. For instance, Rodrik (1996) and OECD (2000) find evidence that a decrease
in labor standards reduces FDI, contrary to the predictions of the race to the bottom
hypothesis. Bhagwati (2007) also argues that there is no evidence that multinationals
are attracted to countries with lower labor standards. However, other studies find that less
restrictive employment protection rules increase FDI (Gorg 2005, Dewit et al. 2009, Javorcik
and Spatareanu 2005, Benassy-Quere et al. 2007). While similar in spirit, these papers
typically rely on more ad hoc and subjective measures of hiring and firing costs than the
employment protection measured used in this analysis. Furthermore, none of these papers
examine the impact of labor market restrictions on different types of FDI. An important
contribution of this paper is the finding that the impact of labor market restrictions on FDI
depends crucially on the type of FDI.
While Azemar and Desbordes (2010) also look at different types of FDI, their measure
of employment protection has no annual variation. In contrast, this paper exploits changes
in labor market restrictions within a country over time. The ability to control for country
4

and year fixed effects and the ability to identify a causal impact of employment protection
on FDI using the GMM and IV estimation strategies represent important contributions of
this paper.
Tests of the race to the bottom hypothesis tend to focus on whether multinationals
invest in countries with lower regulatory standards. As mentioned, the evidence regarding
this first assumption is far from conclusive. However, tests of the second assumption of the
race to the bottom hypothesis are even rarer. To the best of my knowledge, this is the only
paper to examine whether countries competitively undercut one another’s labor standards.
Thus, this is the first comprehensive empirical test of the race to the bottom hypothesis.
The remainder of the paper proceeds as follows. Section 2 discusses the assumptions of
the race to the bottom hypothesis. The estimation strategy is described in Section 3, while
the data and descriptive statistics are presented in Section 4. The results are discussed in
Section 5 and extensions are presented in Section 6. Finally, Section 7 concludes.
2 Race to the Bottom
2.1 Assumption 1
The first assumption of the race to the bottom hypothesis is that multinationals choose
where to invest based in part on the employment restrictions within the foreign country.
Fundamentally, stricter labor restrictions will impose additional costs on MNE and make
investing in that particular country less appealing. In addition, FDI that is relatively more
mobile, in the sense that it can be equally effective in a variety of different countries,
should be more responsive to labor restrictions. As the costs associated with FDI increase
due to employment protection legislation, the multinational will simply shift FDI to other
countries. Thus, the responsiveness of FDI to employment protection legislation will depend
crucially on the type of FDI.
Horizontal FDI occurs when a multinational invests in a country in order to access that
foreign market and avoid transport costs associated with exporting the good from home
(Markusen 1984). The MNE shifts the entire production process to the foreign country and
then sells the output to local consumers. Thus, the decision to pursue horizontal FDI de-
5
pends on a "proximity-concentration trade-off" between the home and foreign country in
which the benefits associated with being close to the foreign market need to be weighed
against the costs associated with setting up production activities abroad (Brainard 1997).
With horizontal FDI, the choice set facing the multinational is producing at home or produc-
ing in the foreign country whose market they want to access. Since other foreign countries
are not a viable destination for FDI, horizontal FDI will be the least sensitive to employment
protection legislation in the foreign country.
Export-platform FDI occurs when a multinational accesses a foreign market by setting
up an affi liate in a neighboring country and exporting to the desired country (Ekholm,
Forslid, and Markusen 2003, Yeaple 2003). The motivation is still to access a foreign market
but now one foreign affi liate can export to a variety of neighboring countries. Thus, the
multinational can access multiple markets with one well placed foreign affi liate. Under
export-platform FDI, the relevant choice set facing the MNE is to produce at home and
export or to produce in one of many potential host countries and export to multiple markets
within a region. Since there are more options available to the MNE, export-platform FDI
will be more sensitive to employment protection legislation than horizontal FDI.
Finally, vertical FDI occurs when multinationals invest in a country in order to take
advantage of low foreign factor prices and minimize costs (Helpman 1984). The MNE shifts
a part of the production activities to the foreign affi liate and then ships the output back
to the home country for further processing or for final sales. Unlike horizontal and export-
platform FDI which need to be near a specific foreign market, vertical FDI can be located
in any foreign country regardless of location. The MNE simply chooses to invest in the
country that generates the greatest cost savings. If the costs associated with operating in
one foreign country increase, the MNE can shift these production activities to any other
foreign country. Given that the motivation for vertical FDI is to take advantage of low
foreign factor prices, vertical FDI will be especially sensitive to changes in the cost of
production. Thus, relative to horizontal and export-platform FDI, vertical FDI will be the
most responsive to employment protection legislation.
The key prediction is that the more footloose the FDI, the more sensitive FDI will be to
increases in labor restrictions in the foreign country. As employment protection increases in
6

the foreign country, multinational will be reluctant to shift horizontal FDI elsewhere since
that would defeat the main motivation of accessing that foreign market. However, with
export-platform FDI the multinational has the ability to shift production to neighboring
countries as labor restrictions increase. Finally, with vertical FDI the multinational has the
ability to shift production to any other foreign country, regardless of location. The empirical
analysis that follows examines whether FDI responds to employment protection legislation
in this manner.
2.2 Assumption 2
The second assumption of the race to the bottom hypothesis is that countries competi-
tively undercut each other’s labor market standards in order to attract foreign investment.
Given that FDI is often associated with increases in production, capital stock, infrastruc-
ture, and knowledge spillovers, attracting foreign investment is particularly appealing for
foreign countries. If, according to assumption one, multinationals are attracted to coun-
tries with less restrictive labor standards, then each country has an incentive to lower their
employment protection rules slightly below that of other countries. By undercutting the
employment standards in other foreign countries, each host country has the ability to lure
FDI away from its competitors. Thus, the second assumption of the race to the bottom
hypothesis predicts that employment restrictions in a foreign country and the average labor
standards in other countries are positively related. Specifically, as the weighted average of
employment protection rules among a countries competitors falls the foreign country will
reduce its own employment protections in response. The analysis that follows discusses
how this weighted average is constructed and examines whether countries competitively
undercut each other’s labor standards.
3 Specification
3.1 Testing Assumption 1
The analysis begins by examining whether FDI is sensitive to changes in employment pro-
tection in the foreign host country. To test this first assumption of the race to the bottom
7

hypothesis, the following equation will be estimated using ordinary least squares (OLS):
(1) FDIc,t = α1EPc,t−1 +Xc,t−1α2 + λc + θt + εc,t.
where FDIc,t is U.S. foreign direct investment into country c in year t. The variable
EPc,t−1 is employment protection in foreign country c and Xc,t−1 is a vector of control
variables that includes host country characteristics such as GDP, population, trade costs,
skill level, tax rate, and investment costs. These variables are lagged to account for the
fact that multinationals cannot immediately adjust FDI in response to these host country
characteristics.2 The natural log of all variables is used in the empirical analysis which
allows for a more intuitive interpretation of the results. Finally, λc and θt are country and
year fixed effects respectively.
A second empirical strategy is to estimate a dynamic panel model, where current FDI
depends on the lagged value of FDI. This accounts for the possibility that FDI is persistent
over time. Thus, adding lagged FDI to equation (1) and first differencing leads to the
following estimation equation:
(2) ∆FDIc,t = β1∆EPc,t−1 + ∆Xc,t−1β2 + β3∆FDIc,t−1 + ∆θt + ∆εc,t.
where the country fixed effects are subsumed by the annual differences. The issue with
estimating this equation is that the differenced residual, ∆εc,t, is by construction corre-
lated with the lagged dependent variables, ∆FDIc,t−1, since both are functions of εc,t−1.
Similarly, ∆EPc,t−1 and the control variables ∆Xc,t−1 may also be correlated with ∆εc,t.
Therefore, OLS regressions of equation (2) can produce inconsistent estimates. To avoid this
problem and to address potential endogeneity concerns, equation (2) will be estimated using
the Arellano-Bond GMM estimator. This estimation strategy instruments the differenced
variables that are not exogenous with their respective lagged levels (Holtz-Eakin, Newey,
2The results are similar if these variables are not lagged.
8
and Rosen 1988, Arellano and Bond 1991). This allows a causal impact of employment
protection legislation on foreign direct investment to be identified.
Despite the inclusion of country and year fixed effects, lagging all the independent
variables, and using the Arellano-Bond GMM estimation strategy, there may be lingering
endogeneity concerns.3 To address these concerns, it is possible to estimate equation (1)
using the instrumental variable (IV) estimation strategy. This third empirical strategy uses
the unionization density and the political ideology and strength of the ruling party as in-
struments for employment protection legislation in the foreign host country. A country with
a declining union presence may, as a result, see an increase in governmental employment
restrictions. Thus, changes in union density will be an important predictor of the employ-
ment protection legislation implemented in the foreign host country. In addition, a country
with a more liberal ruling party will be more likely to implement labor market restrictions.
Thus, changes in the ruling party and its relative strength will be an important predictor
of employment protection. These instruments will identify an exogenous source of variation
in labor market restrictions which is unrelated to FDI. This mitigates endogeneity concerns
and allows the impact of employment protection on FDI to be identified. The construction
of both instrumental variables will be discussed in greater detail in Section 4.4.
Given the theoretical motivation discussed in Section 2, we would expect α1 < 0 and
β1 < 0. As employment protection increases, the costs of operating a foreign affi liate in-
crease, and thus FDI decreases as the multinational shifts these production activities else-
where. In addition, the magnitude of α1 and β1 will depend crucially on the type of FDI.
Thus, all three empirical strategies will be separately estimated using total FDI, horizontal
FDI, export-platform FDI, and vertical FDI as the dependent variables. The coeffi cients
on employment protection should be more negative as the degree of mobility exhibited by
each type of FDI increases. Specifically, α1 and β1 will be most negative in the vertical FDI
regression, it will be least negative in the horizontal FDI regression, and it will fall between
these extremes in the export-platform FDI regression.
3The race to the bottom hypothesis assumes that country’s employment protection legislation repondsto other countries standards not one’s own level of FDI. Furthermore, it is not entirely clear how FDI wouldaffect employment protection legislation. Perhaps an increase in FDI encourages host countries to increaseemployment restrictions to protect local workers from being exploited by foreign multinationals or maybeincreases in FDI encourage host countries to decrease employment restrictions to attract more FDI.
9

3.2 Testing Assumption 2
To test the second assumption of the race to the bottom hypothesis, this paper examines
whether employment protection legislation is a function of employment protection in other
foreign countries. Specifically, the following equation is estimated:
(3) EPc,t = φ1Competitor_EPc,t−1 +Xc,t−1φ2 + φ3EPc,t−1 + λc + θt + εc,t.
where the dependent variable, EPc,t, is employment protection in foreign country c.
Competitor_EPc,t−1 is the weighted average of employment protection in other foreign
countries. This variable is constructed using three different weighting techniques which will
be discussed in greater detail in the section that follows. Xc,t−1 is a vector of control variables
and the lagged value of employment protection is included as a regressor to account for the
fact that employment protection rules are persistent over time. λc and θt are country and
year fixed effects respectively. Finally, all variables are in natural logs and the independent
variables are lagged to account for the fact that changes in employment protection legislation
take time to implement.
Equation 3 will be estimated using the OLS, Arellano-Bond GMM, and IV estimation
strategies. The weighted average of the unionization and political ideology variables will be
used as instruments in the IV regressions. If the race to the bottom theory is important, then
φ1 > 0. As other foreign countries lower their employment protection rules, country c will
respond by reducing its own employment protections it order to undercut it’s competitors.
4 Data
4.1 Foreign Direct Investment
Foreign direct investment is measured as U.S. direct investment abroad using data from
the Bureau of Economic Analysis (BEA). Focusing on multinationals from one country is
appealing because it minimizes parent country characteristics that may influence outward
FDI. In addition, data on U.S. multinational companies is more comprehensive and detailed
10

than FDI data from other countries. There is little reason to believe that the determinants
of U.S. FDI are fundamentally different from the decisions facing multinationals in other
countries.
Another especially appealing aspect of the BEA data is that the measure of FDI used
in this analysis (i.e. affi liate sales) allows for horizontal, export-platform, and vertical FDI
to be separately examined. Specifically, the BEA identifies the ultimate destination of the
sales by U.S. foreign affi liates. Affi liate sales to the local market measures horizontal FDI,
affi liate sales to other foreign countries measures export-platform FDI, and affi liate sales
back to the U.S. measures vertical FDI.4 As mentioned before, the impact of employment
protection on FDI should become more negative as the type of FDI becomes relatively more
mobile. Finally, these FDI measures are converted into real dollars using the chain-type
price index for gross domestic investment.5
4.2 Employment Protection
Data on employment protection comes from the Organisation for Economic Co-operation
and Development (OECD). The OECD constructs a composite index of employment pro-
tection from seventeen individual measures of hiring and firing costs. These seventeen basic
measures can be grouped into two broad categories, restrictions against firing workers and
restrictions on hiring temporary workers. The firing restrictions include measures such as
the notification process and timing of dismissals, the severance pay required, and the pro-
cedures for contesting an unfair dismissal. The hiring restrictions include measures such as
the allowable number and duration of fixed term contracts, the type of work that tempo-
rary workers can do, and whether regular and temporary workers are treated equally.6 The
employment protection index is measured on a scale of zero to six with six representing the
most restrictive rules.
While this composite index certainly does not capture all relevant factors that influence
4There are many other types of ’complex’FDI that are variations of these three basic components (Yeaple2003). While these three categories may include more complex types of FDI, this will not fundamentallychange the basic ordering of these types of FDI from less-mobile to more-mobile.
5This price deflator is found in the Economic Report of the President(http://www.gpoaccess.gov/eop/tables10.html).
6For further details on the components of these measures and how they are calculated, see the methodologysection of the OECD Indicators of Employment Protection website at www.oecd.org/employment/protection.
11

labor market flexibility, it does have some appealing aspects. First and foremost, it is an
objective and consistent estimate of employment protection regulations in a wide variety
of countries. Changes in this measure of employment protection represent legislative and
policy changes in the host country that are more likely exogenous to foreign affi liate sales.7
Second, while this measure may not explicitly include all relevant labor market restrictions,
it represents a useful proxy for the overall employment conditions in the host country. Third,
it is possible to separate this index into its hiring and firing sub-categories which proves
useful in the analysis that follows. Finally, this employment protection measure is available
for thirty countries and twenty four years (1985-2008). The scale and scope of this variable
represents an important improvement over other measures.8
4.3 Control Variables
The estimation strategy implemented in this analysis controls for both country and year
fixed effects. To account for factors that may vary within a country over time, a variety
of additional control variables are included that are likely to influence the decision of a
multinational to pursue FDI. Perhaps most important is the host countries real GDP which
is obtained from the OECD. The population of the host country also comes from the OECD.
Following Blonigen et al. (2007), I measure host country trade costs as the inverse of the
openness measure reported by the Penn World Tables (PWT).
Data on the host country skill level is obtained from the Barro and Lee (2010) Edu-
cational Attainment Dataset. They report the average year of schooling for those over 25
years old every five years from 1950-2010. The intervening years are calculated using linear
interpolation. Host country corporate income tax rates come from the OECD. Investment
costs in the host country are measured using data from the Business Environment Risk
Intelligence (BERI). Investment costs are calculated as the inverse of the composite index
which includes the operations risk index, the political risk index, and the remittance and
7While changes in employment protection legislation is infrequent in some countries, when these changesoccur they represent an important shift in labor market restrictions.
8Other authors (Gorg 2005, Dewit et al. 2009, Di Tella and MacCulloch 2005) have used data from theGlobal Competitiveness Report (GCR) produced by the World Economic Forum. This measure of hiringand firing costs is obtained from surveying local business managers about the hiring and firing practices intheir country. This is relatively subjective and noisy measure which may not necessarily reflect changes inlabor market legislation in the foreign host country.
12
repatriation factor index. Together, these control variables represent the factors that have
been generally identified as important determinants of FDI.
4.4 Instruments
The IV analysis uses the unionization density and the political ideology of the ruling party
as instruments for employment protection. Data on the unionization rate in the foreign
host country comes from the OECD and is calculated as the share of total wage and salary
earners that are trade union members. As discussed previously, a lower unionization density
increases the need for labor market regulations.
Data used to construct the political ideology variable comes from the Political Constraint
Index (POLCON) Dataset (Henisz 2002). First, the political ideology of the political party
that controls the executive branch of the government is identified. Each ruling political party
is identified as liberal, neutral, or conservative. Then this ideology variable is interacted
with a measure of political constraint which reflects the relative strength of the ruling party.
Specifically, the political constraint variable takes into account the number of branches
within the government that have veto power over policy changes, the party alignment across
the branches of government, and the party heterogeneity within the legislative branches of
government. This modified political ideology variable takes on values between one and
three. Values close to three indicate that a relatively powerful liberal party is in control,
values close to two indicate a relatively weak or neutral party is in control, and values
close to one indicate that a relatively powerful conservative party is in control. A ruling
party that is more liberal and powerful is more likely to implement employment protection
legislation.
4.5 Competitor Employment Protection
The employment protection measure from the OECD is used to construct the average of em-
ployment protection in other foreign countries. Specifically, for country c the Competitor_EP
variable is calculated as the weighted average of employment protection in all other foreign
countries in the sample, not including country c itself. There are three different methods
used to construct this average.
13
First, this variable is constructed as the unweighted average of employment protection in
the other foreign countries. This method weights equally all other foreign countries. Second,
Competitor_EP is constructed using the inverse of distance between country c and the
other foreign host countries as weights. The weights are normalized to one to account for
the fact that the sample of countries changes over this period.9 The employment protection
legislation in countries that are closer in proximity to country c are weighted more heavily.
Using the inverse of distance as weights is a common method for calculating spatial variables.
Rather than weighting countries that are closer in proximity more heavily, the third
method weights more heavily those countries that are likely competing with country c for
FDI. Specifically, the average vertical and export-platform FDI sales in each foreign country
is used as a weight. The weights are normalized so that employment protection in those
countries that have a greater share of vertical and export platform FDI sales are weighted
more heavily. If these types of FDI are more mobile, then country c will be more responsive
to changes in employment protection rules in countries that have a larger share of this type
of FDI. In other words, these foreign countries will be the ones that country c is competing
against to attract these relatively mobile types of FDI.
4.6 Descriptive Statistics
Combining these various measures, generates an unbalanced panel data set that spans
twenty six countries and twenty three years (1985-2007).10 The twenty six countries in this
sample accounted for 78% of U.S. FDI in 2000. Table 1 reports the summary statistics
of the variables used in this analysis. While the sample includes only OECD countries,
Table 1 indicates there is substantial variation in all of these measures. For instance, real
affi liate sales varied from $1,165 million in Turkey in 1985 to $586,295 million in the United
Kingdom in 2007. On a scale of zero to six with six being the most restrictive, employment
protection ranges from 0.6 in the United Kingdom in the 1990s to 4.2 in Portugal in the
9The results that follow are similar if the sample is restricted to countries that have data for the entireperiod.10The countries include Australia, Austria, Belgium, Canada, Czech Republic, Denmark, Finland, France,
Germany, Greece, Hungary, Ireland, Italy, Japan, Korea, Mexico, New Zealand, Netherlands, Norway,Poland, Portugal, Spain, Sweden, Switzerland, Turkey, and the United Kingdom.
14
late 1980s.
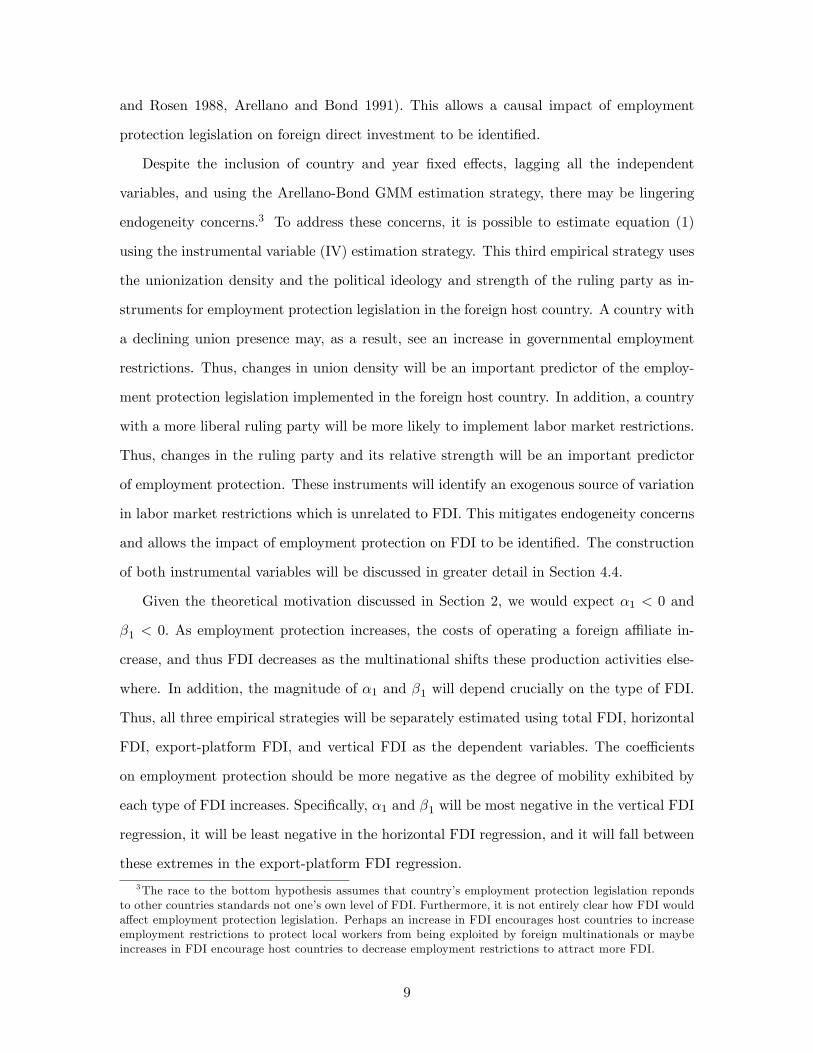
Figure 1 plots the annual average of employment protection against the annual average
of real affi liate sales. A significant negative relationship between employment protection
and affi liate sales is evident in Figure 1. Over time there has been a rough trend towards a
decrease in employment protection rules and an increase in U.S. foreign affi liate sales.
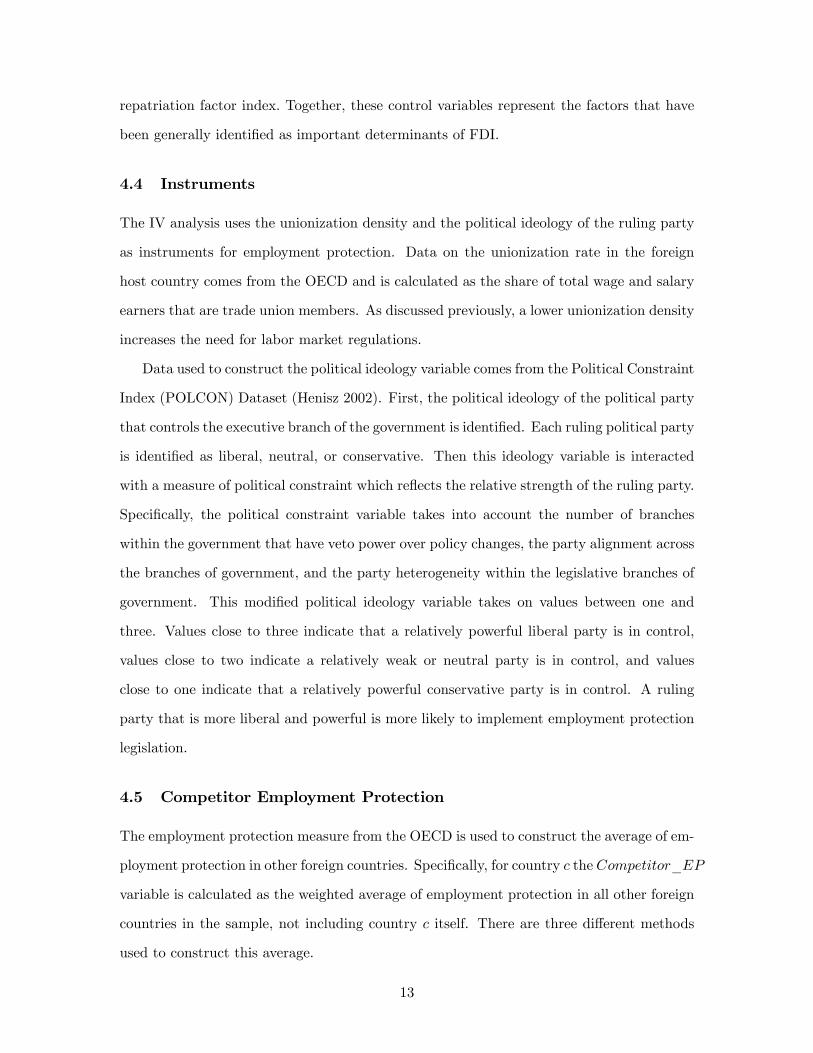
Figure 2 plots the country average of employment protection against the country average
of real affi liate sales. The U.K. and Canada have relatively lax employment protection rules
and have high foreign affi liate sales. However, countries such as Portugal, Turkey and
Greece have had strict employment protection rules and low levels of U.S. foreign affi liate
sales. Perhaps not surprisingly, France and Germany have strict employment protection
rules but high levels of affi liate sales. Again, there is a strong negative relationship between
employment protection and affi liate sales. Countries that have strict employment protection
rules typically have less U.S. foreign affi liate sales.
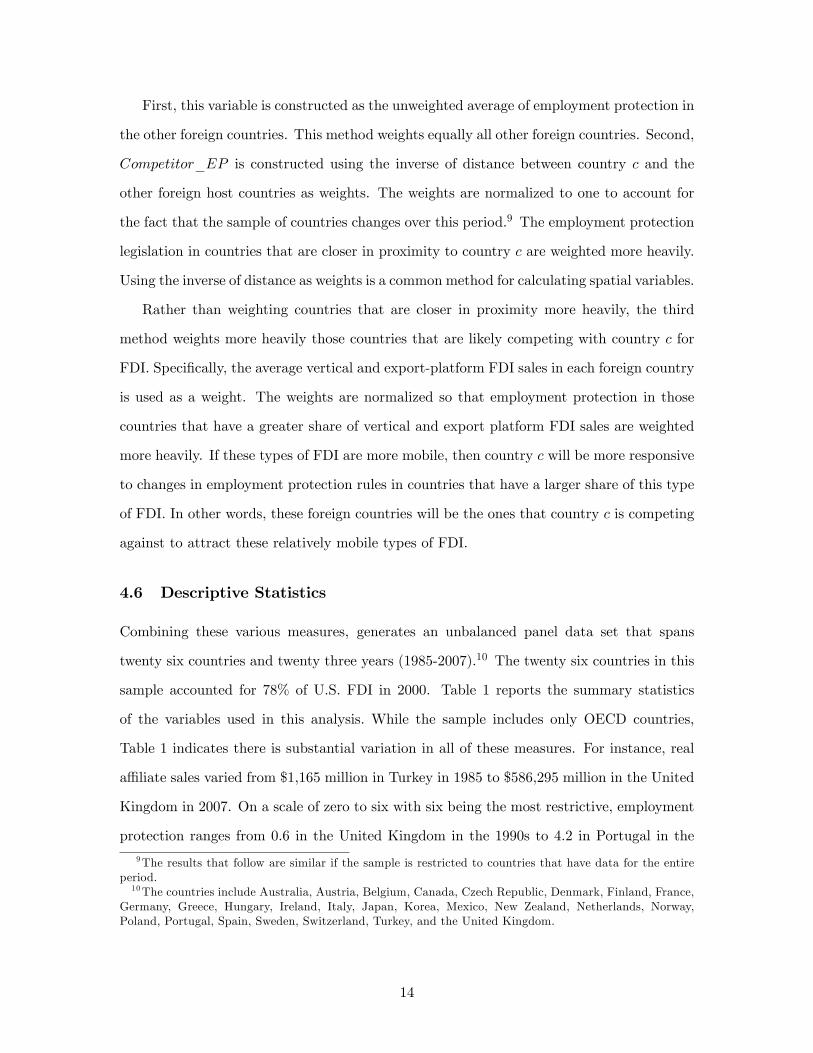
Figure 3 plots the country average of employment protection against the country average
of different types of real affi liate sales. Two observations are worth noting. First, there is
interesting variation across countries in terms of which type of FDI is most important. Not
surprisingly, Japan and Australia have relatively large shares of horizontal FDI, Ireland and
Switzerland have relatively large shares of export-platform FDI, and Mexico has a relatively
large share of vertical FDI. Second, a negative relationship between employment protection
and all three types of FDI is evident in Figure 3. However, it appears that the relationship
between employment protection and vertical FDI is most negative, which is consistent with
the intuition from Section 2.
Figures 1-3 provide insight into the dimensions and characteristics of the data set used
in this analysis. It is interesting that such a strong negative relationship emerges in these
basic scatter-plots. However, there are some important limitations of these scatter-plots
which the empirical analysis that follows is able to overcome. First, the country and year
fixed effects will capture much of the variation evident in these figures. The analysis that
follows exploits country variation over time to examine the impact of employment protection
on foreign affi liate sales. Second, these figure do not account for other factors that are
changing over time and may be affecting both affi liate sales and employment protection.
15

As discussed previously, a wide array of control variables will be included in the empirical
analysis. Third, this negative correlation does not imply causation. Fortunately, the GMM
and IV estimation strategies will identify a causal impact of employment protection on
foreign affi liate sales. With these caveats in mind, it is surprising that such a consistently
negative relationship emerges in Figures 1-3. The section that follows examines whether
this relationship is robust to a more careful and rigorous analysis.
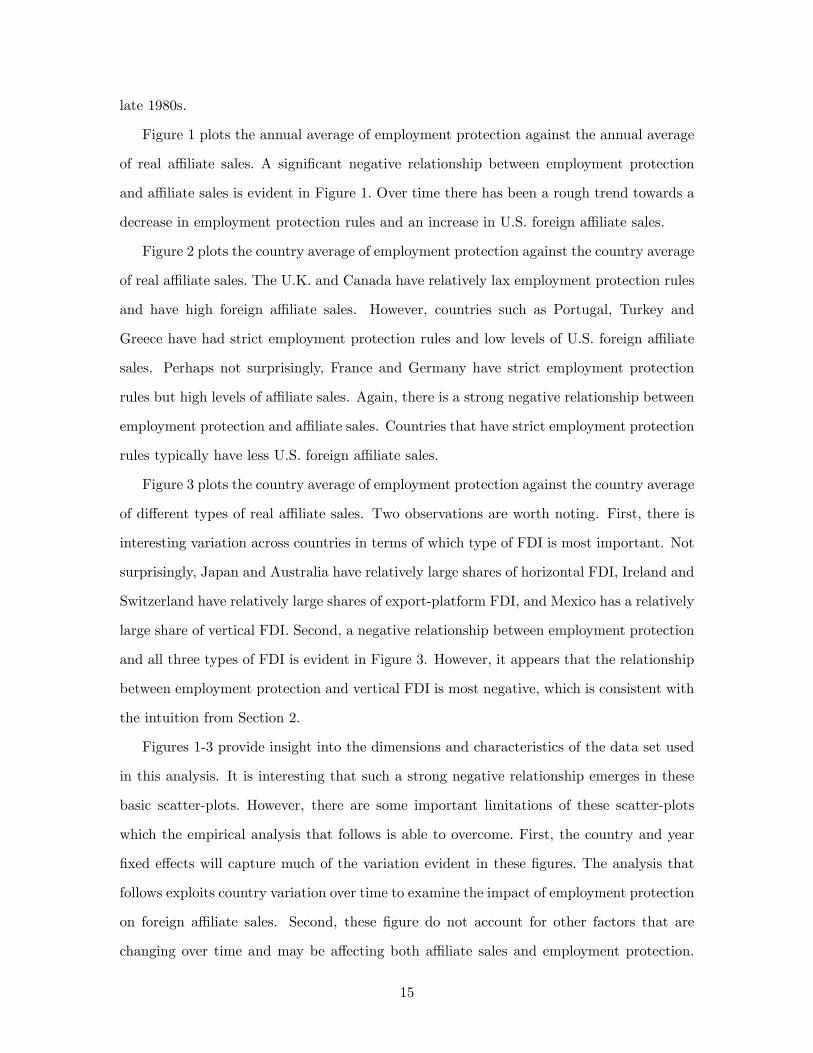
Finally, Figure 4 reports the annual average of employment protection (solid line) and
the 95% confidence intervals (dashed lines). The average employment protection in this
sample of twenty six countries fell from 2.45 in 1985 to 2.00 in 2008, a reduction of 18%. In
addition, the 95% confidence intervals converged over this time period which indicates that
the variation in employment protection across countries decreased from 1985 to 2008. Both
of these stylized facts are consistent with the second assumption of the race to the bottom
hypothesis. However, this does not imply causation nor is it the only plausible explanation.
The analysis that follows, identifies to what extent this reduction is driven by countries
competitively undercutting each others labor standards.
5 Results
The goal of this analysis is to examine whether FDI responds to employment protection leg-
islation and whether countries competitively undercut each other’s labor standards. This
section tests these two predictions of the race to the bottom hypothesis. First, the im-
pact of employment protection restrictions on foreign affi liate sales to different locations
is examined. Second, I examine whether countries competitively reduce their employment
restrictions in response to changes in employment restrictions in other foreign countries.
5.1 Assumption 1 Results
The first assumption of the race to the bottom hypothesis is tested using the OLS, Arellano-
Bond GMM, and IV estimation strategies. The OLS results obtained from estimating
equation (1) are reported in Table 2. The results in column 1 indicate that more restrictive
employment protection rules lead to a significant reduction in foreign affi liate sales. Given
16

the log-log specification, a 1 percent increase in employment protection leads to a 0.2 per-
cent decrease in foreign affi liate sales. This is consistent with the idea that employment
protection legislation increases the costs of operating in the host country and thus reduces
U.S. FDI to that foreign country.
Columns 2-4 of Table 2 separate foreign affi liate sales by the ultimate destination of
these sales. The results in column 2 indicate that employment protection reduces foreign
affi liate sales to the local host country (horizontal FDI). The results in column 3 indicate
that employment protection does not have a significant impact on foreign affi liate sales to
other foreign countries (export-platform FDI). Finally, the results in column 4 indicate that
employment protection has a large, negative impact on foreign affi liate sales back to the
U.S. (vertical FDI). These findings provide preliminary support for the intuition discussed in
section 2. Specifically, employment protection legislation has the strongest negative impact
on the most mobile type of FDI. However, the GMM and IV estimation strategies will be
better at identifying a causal impact of employment protection on FDI.
The coeffi cients on GDP, trade costs, skill, and investment costs are all significant and of
the expected sign. Foreign direct investment increases with the size of the foreign economy,
with reductions in trade costs, with reductions in the average skill level, and with reductions
in investment costs. Consistent with other studies, GDP has a stronger positive impact on
horizontal FDI while trade costs, skill, and investment costs have a stronger negative impact
on vertical FDI. While the population and tax rate are typically thought to be important
determinants of foreign direct investment, the coeffi cients on these variables are found to
be insignificant. This may be because the country fixed effects and year fixed effects are
capturing the variation in these control variable.
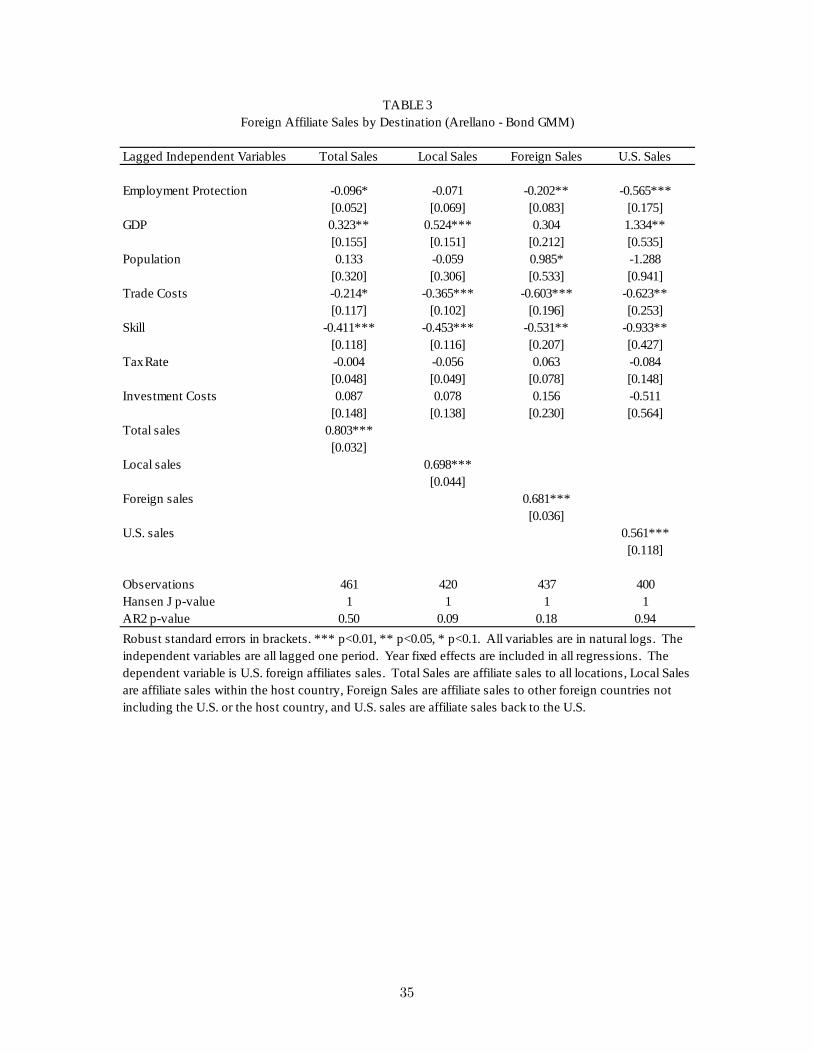
The Arellano-Bond GMM results obtained from estimating equation (2) are reported in
Table 3. Employment protection has a negative impact on total foreign affi liate sales, but
this relationship is only significant at the ten percent level (see column 1). More importantly,
the impact of employment protection on different types of affi liate sales is consistent with the
predictions from section 2. In column 2, employment protection does not have a significant
impact on sales to the local market (horizontal FDI). This is consistent with the idea that
horizontal FDI is not sensitive to host country employment protection restrictions. U.S.
17
multinationals want to access this foreign market and are thus relatively unresponsive to
changes in employment protections in the host country.
In column 3, employment protection has a negative and significant effect on affi liate sales
to other foreign countries (export-platform FDI). With export-platform FDI, U.S. multi-
nationals can access a foreign market through a variety of different neighboring countries.
Thus, as the employment protections become stricter in one host country, U.S. multination-
als shift their affi liate production to another foreign country in that region.
In column 4, employment protection has large, negative, and significant impact on affi l-
iate sales back to the U.S. (vertical FDI). Specifically, a 1 percent increase in employment
protection leads to a 0.6 percent decrease in foreign affi liate sales to the U.S. With vertical
FDI, U.S. multinationals are not constrained geographically by the need to access a foreign
market. Thus, if the costs of operating foreign affi liates increase due to employment pro-
tection restrictions, the U.S. multinational simply relocates affi liate production to another
cheaper foreign location. Finally, the lagged sales coeffi cients in all regression in Table 3
are positive and significant which indicates that sales are persistent over time. The high
p-values on the Hansen J and second order autocorrelation (AR2) tests indicate that the
lags of the dependent variables are in fact exogenous and are thus good instruments.11
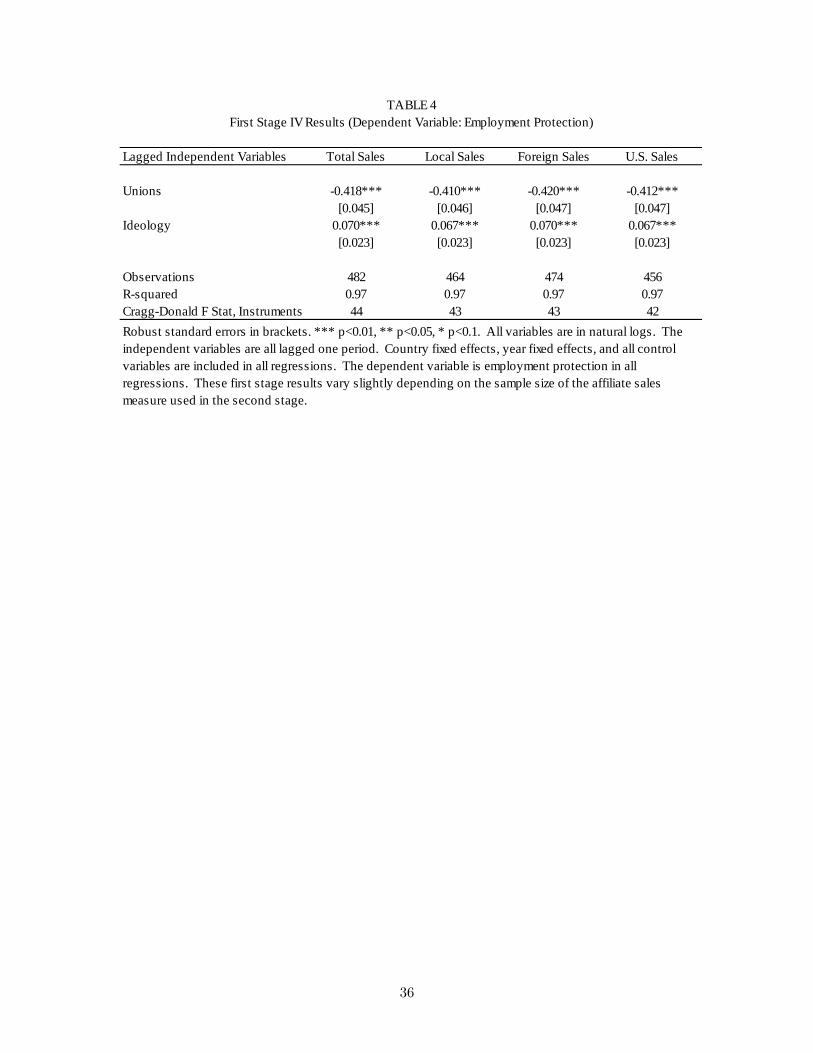
Finally, equation (1) is estimated using the IV estimation strategy. Table 4 reports the
first stage IV results for all four sales regressions.12 As expected, the unionization rate has
a negative affect on employment protection. As the prevalence of unions decreases, there is
more need to protect workers through government imposed labor market restrictions. Also
consistent with expectations, the political ideology variable has a positive impact on em-
ployment protection. A strong liberal government is more likely to implement labor market
restrictions. The F-stat on the excluded instruments is above 40 in all the regressions, which
indicates relatively strong instruments.
11However, the Hansen J test can be weakened when, as a rule of thumb, the number of instrumentsexceeds the number of groups (i.e. countries). This is the case in this analysis because there are a relativelylarge number of years which increases the instrument matrix. However, this does not affect the coeffi cientestimates (Roodman 2006) and the results in Table 3 are not sensitive to reducing the number of laggedinstruments used in the GMM estimation strategy.12Although similar, the first stage results are not the same for the different IV regressions because the
sample size changes depending on which foreign affi liate sales dependent variables is used in the secondstage.
18
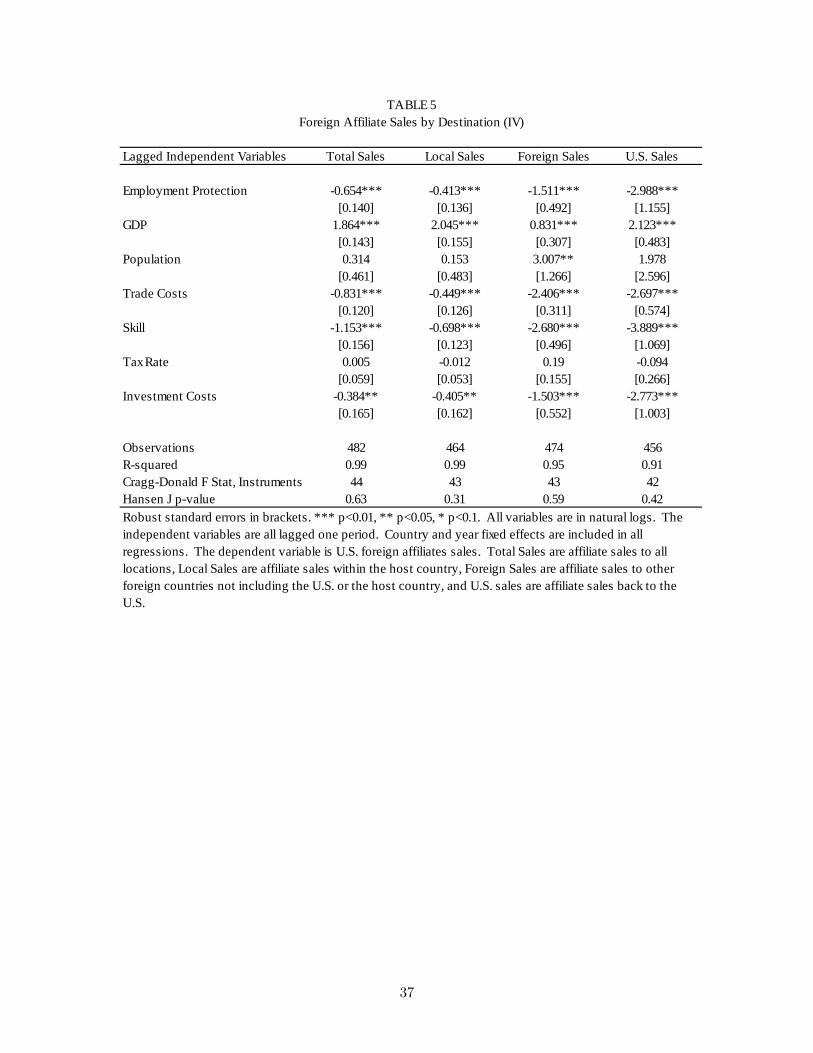
The second stage IV results are reported in Table 5. Once again, employment protection
decreases foreign affi liate sales. Furthermore, consistent with expectations, employment
protection has a progressively more negative impact on local sales, foreign sales, and U.S.
sales. Not surprisingly, employment protection legislation has the most negative impact on
the relatively more mobile types of FDI. In addition, the magnitudes are large. A 1 percent
increase in employment protection leads to a 3 percent decrease in affi liates sales back to the
U.S. Vertical FDI is most sensitive to labor costs in foreign countries and thus labor market
restrictions have the largest impact on this type of FDI. Finally, the overidentification test
(i.e. the Hansen J p-value) indicates that the instruments are uncorrelated with the error
term and are thus valid instruments. The results in Table 5 provide clear and convincing
evidence that FDI decreases with employment protection legislation in the foreign host
country.
Overall, the results in Tables 2-5 support the first assumption of the race to the bot-
tom hypothesis. As employment protection legislation decreases, foreign direct investment
increases. In addition, as the type of FDI becomes more mobile, the relationship between
employment protection and foreign affi liate sales becomes larger in magnitude and more
significant. This is an important result and indicates that the multinational response to
employment protection depends crucially on the type of FDI. Furthermore, these key results
are robust across the OLS, GMM, and IV estimation strategies.
5.2 Assumption 2 Results
The results so far indicate that FDI, particularly export-platform and vertical FDI, increases
as employment restrictions are relaxed. This provides a motivation for foreign host countries
to competitively undercut each other’s labor standards. To test this second key assumption
of the race to the bottom hypothesis, equation 3 estimates the impact of employment
protection rules in competing foreign countries on the host country’s own employment
protection legislation. The results of this analysis are reported in Tables 6, 7, and 8.
Table 6 reports the results when Competitor_EP is constructed as an unweighted
average of other foreign country’s employment protection rules. Column 1 reports the
OLS results, column 2 reports the Arellano-Bond GMM results, and column 3 reports the
19
IV results using the unweighted average of union and ideology as instruments.13 In all
regressions, the coeffi cient on lagged Competitor_EP is insignificant. If the race to the
bottom theory was important we would expect this coeffi cient to be positive and significant.
A reduction in their competitor’s labor standards would lead to a reduction in the foreign
host countries employment restrictions. The lack of significant findings casts doubt on the
assumption that countries are competitively undercutting each other’s labor standards.
Table 7 shows the estimation results when Competitor_EP is constructed as a weighted
average using the inverse of distance between the two foreign countries as the weights. This
places more emphasis on employment protection rules in foreign countries that are in close
proximity to the foreign host country. The results in Table 7 once again indicate that,
regardless of the estimation strategy used, Competitor_EP has no significant impact on
employment protection in the host country. However, the strong positive impact of lagged
host country employment protection on current employment protection indicates that these
labor standards are persistent over time.14
As discussed in section 4.5, it is also possible to construct Competitor_EP using the
share of average vertical and export-platform sales as weights. The first part of this paper
finds that these types of FDI are most sensitive to changes in employment protection legis-
lation. Rather than weighting countries based on geographic distance, this method weights
more heavily employment protection in those foreign countries that have a larger share of
these relatively mobile types of FDI. Presumably these are the foreign countries that the
foreign host country is competing against for U.S. FDI. Table 8 reports the results using
Competitor_EP constructed in this manner. Again, the coeffi cient on Competitor_EP is
insignificant in the OLS and GMM specifications. However, it is significant and negative
in the IV regression. This suggests that as the employment protection legislation in other
foreign countries decreases, the employment protection rules in the host country increase.
Thus, if anything, this finding works against the second assumption of the race to the
bottom hypothesis.
13The first stage F-stat and the overidentification test in this IV regression indicates that these instrumentsare relatively weak.14 In addition, it is important to include the lagged host country employment protection as an additional
control because the host country’s EP level is not included in the calculation of Competitor_EP.
20

Overall, there is no evidence that countries competitively undercut each other’s labor
standards, despite the fact that doing so would increase inward FDI. Perhaps changing
economy wide labor standards is too blunt a tool to attract foreign investment. This key
finding is robust to three different methods of constructing the competitor’s employment
protection variable and to three different estimation strategies. While there is evidence
supporting the first assumption of the race to the bottom hypothesis, there is no evidence
supporting the second assumption.
6 Extensions
The following extensions provide additional insight into the relationships between FDI, host
country employment protection, and competitor’s employment protection rules. Specifically,
different components of affi liate sales to the U.S. and employment protection rules are
examined. In addition, an alternate specification is used to test the second assumption of
the race to the bottom hypothesis.
6.1 Affi liate Sales to the U.S.
Employment protection regulations have the strongest impact on foreign affi liate sales back
the U.S. It is possible, given the BEA data, to take a closer look at the type of affi liate sales
back to the U.S. most affected. Specifically, affi liate sales can be separated into those going
to the U.S. parent and those going to unaffi liated U.S. parties. In addition, affi liate sales
are separated into the sale of goods and the sale of services back to the U.S. The results
using the IV estimation strategy are reported in Table 9.
The results using foreign affi liate sales to the U.S. parent as the independent variable are
reported in column 2 and the results using foreign affi liate sales to unaffi liated U.S. parties
as the independent variable are reported in column 3. The coeffi cients on employment
protection are negative, significant, and similar in magnitude in both specifications. A 1
percent increase in employment protection leads to a 3.0 percent decrease in sales to the
U.S. parent and a 2.6 percent decrease in sales to unaffi liated U.S. parties. If anything,
employment protection has a slightly more negative impact on affi liate sales back to the
21
U.S. parent. This suggests that FDI whose output is shipped back to the U.S. parent for
further processing is more mobile than FDI whose output is sold to U.S. consumers.
Columns 4 and 5 of Table 6 compare affi liate sales of goods and services back to the U.S.
The results indicate that the sale of goods decreases in response to employment protection
but there is no significant impact on the sale of services. While this points to an interesting
distinction between affi liate sales of goods and services, these results should be interpreted
with caution since data on affi liate sales of services is notoriously diffi cult to measure.
6.2 Employment Protection Components
Having taken a closer look at the dependent variable of interest, we now turn to the key
independent variable (employment protection). As discussed previously, the employment
protection measure from the OECD is an average of firing and hiring costs assembled from
seventeen individual components. It is possible to separately examine the impact of firing
restrictions and hiring restrictions on the foreign affi liate sales to the U.S. By definition
these firing and hiring components have less variation than the composite index. However,
no change in these employment restriction measures within a country still represents an
important source of variation or counterfactual in this analysis.
Table 10 reports the IV estimation results from regressing U.S. sales on the firing and
hiring components of employment protection. The results in columns 2 and 3 indicate that
both firing and hiring costs decrease vertical FDI. A 1 percent increase in firing restrictions
decreases affi liate sales to the U.S. by 4.3% and a 1 percent increase in restrictions on
hiring temporary workers decrease affi liate sales to the U.S. by 2.3%. The slight difference
in the size of the coeffi cients suggests that firing restrictions are a greater deterrent for
FDI than restrictions on hiring temporary workers. However, overall, the additional costs
associated with both firing and hiring workers leads U.S. multinationals to relocate their
affi liate production activities elsewhere.
6.3 Contemporaneous Competitor Employment Protection
The results reported in Tables 6-8 assumed that there is a lag in the response of host coun-
tries employment protection rules to changes in their competitor’s employment protection
22
rules. It is assumed that it takes time for countries to respond to their competitor’s ac-
tions and to implement these changes. However, if the host country can anticipate changes
in labor standards in other foreign countries, then the host country can respond quickly
by lowering its own standards within the given year. While somewhat less plausible, this
section examines this possibility in greater detail.
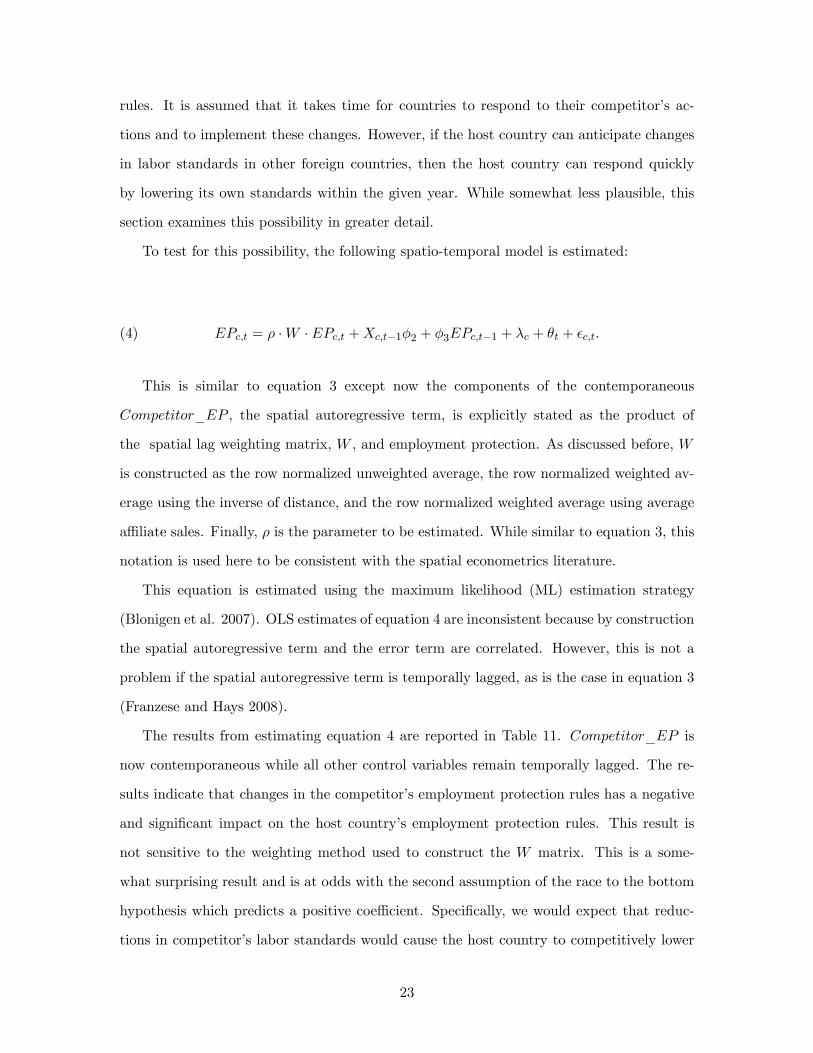
To test for this possibility, the following spatio-temporal model is estimated:
(4) EPc,t = ρ ·W · EPc,t +Xc,t−1φ2 + φ3EPc,t−1 + λc + θt + εc,t.
This is similar to equation 3 except now the components of the contemporaneous
Competitor_EP , the spatial autoregressive term, is explicitly stated as the product of
the spatial lag weighting matrix, W , and employment protection. As discussed before, W
is constructed as the row normalized unweighted average, the row normalized weighted av-
erage using the inverse of distance, and the row normalized weighted average using average
affi liate sales. Finally, ρ is the parameter to be estimated. While similar to equation 3, this
notation is used here to be consistent with the spatial econometrics literature.
This equation is estimated using the maximum likelihood (ML) estimation strategy
(Blonigen et al. 2007). OLS estimates of equation 4 are inconsistent because by construction
the spatial autoregressive term and the error term are correlated. However, this is not a
problem if the spatial autoregressive term is temporally lagged, as is the case in equation 3
(Franzese and Hays 2008).
The results from estimating equation 4 are reported in Table 11. Competitor_EP is
now contemporaneous while all other control variables remain temporally lagged. The re-
sults indicate that changes in the competitor’s employment protection rules has a negative
and significant impact on the host country’s employment protection rules. This result is
not sensitive to the weighting method used to construct the W matrix. This is a some-
what surprising result and is at odds with the second assumption of the race to the bottom
hypothesis which predicts a positive coeffi cient. Specifically, we would expect that reduc-
tions in competitor’s labor standards would cause the host country to competitively lower
23
their own labor standards in response. Instead, the results in Table 11 indicate the exact
opposite. The host country raises their labor standards in response to lower competitor
labor standards. This interesting result warrants further examination which is left to future
research. For the purposes of this paper, these results confirm earlier findings and once
again indicate that there is no evidence that countries are competitively undercutting one
another’s labor standards.
7 Conclusion
There are two implicit assumptions in the race to the bottom hypothesis. The first assump-
tion is that multinationals will increase their foreign investment in response to reductions
in employment protection in the host country. Furthermore, the relatively mobile types of
FDI will be most responsive to employment protection rules. The second assumption is
that countries competitively undercut each other’s labor standards in order to attract FDI.
The empirical results presented in this paper confirm the first assumption. Specifically,
there is a significant negative impact of employment protection on FDI. A reduction in
employment protection rules leads to an increase in foreign affi liate sales. In addition,
this negative relationship is strongest among the most mobile types of FDI. Employment
protection legislation in the host country has limited impact on horizontal FDI, a more
substantial negative impact on export-platform FDI, and a large, negative impact on vertical
FDI.
Despite the fact that lowering employment restrictions increases FDI, there is no evi-
dence that countries are competitively undercutting each other’s labor standards to attract
foreign investment. Specifically, this paper examines whether labor standards in other for-
eign countries affect the employment restrictions in the foreign host country. Regardless of
the weighting method used to construct the foreign countries’labor standards or the esti-
mation strategy, there is no significant impact on the host country’s employment protection
rules. Overall, this paper finds support for the first proposition of the race to the bottom
hypothesis but no evidence of the second assumption.
Whether this is a desirable outcome depends on one’s view of employment protection.
24

If labor market restrictions are necessary to protect the rights of workers, then this is a
encouraging result. Although multinationals are investing in countries with the least re-
strictive regulatory conditions, there is no evidence that this is promoting a race to the
bottom. However, if labor market restrictions are undesirable and hinder economic flexibil-
ity and growth, then the finding that countries are not competitively lowering employment
restrictions is discouraging. Although attracting foreign investment provides an incentive
for countries to liberalize their labor markets, to date countries are not competing with
one another to do so. Regardless of ones perspective on labor market restrictions, this pa-
per provides important evidence that FDI does respond to regulatory standards but that
countries are not competitively lowering standards to attract FDI.
25
References
Acemoglu, Daron and Joshua D. Angrist. 2001. "Consequences of Employment Protection?
The Case of the Americans with Disabilities Act." Journal of Political Economy, 109(5):
915-957.
Angrist, Joshua D. and Jorn-Steffen Pischke. 2009. "Mostly Harmless Econometrics: An
Empiricist’s Companion." Princeton University Press.
Arellano, Manuel and Stephen Bond. 1991. "Some Tests of Specification for Panel Data:
Monte Carlo Evidence and an Application to Employment Equations." The Review of
Economic Studies, 58(2): 277-297.
Azemar, Celine and Rodolphe Desbordes. 2010. "Short-Run Strategies for Attracting For-
eign Direct Investment." The World Economy, 33(7): 928-957.
Barro, Robert J. and Jong-Wha Lee. 2010. “A New Data Set of Educational Attainment in
the World, 1950-2010.”NBER Working Paper No. 15902.
Benassy-Quere, Agnes, Maylis Coupet, and Thierry Mayer. 2007. "Institutional Determi-
nants of Foreign Direct Investment." The World Economy, 30(5): 764-782.
Besley, Timothy and Robin Burgess. 2004. "Can Labor Regulation Hinder Economic Per-
formance? Evidence from India." The Quarterly Journal of Economics, 119(1): 91-134.
Bhawati, Jagdish N. 2007. "In Defense of Globalization." Oxford University Press.
Blonigen, Bruce A., Ronald B. Davies, Glen R. Waddell, and Helen T. Naughton. 2007. "FDI
in Space: Spatial Autoregressive Relationships in Foreign Direct Investment." European
Economic Review, 51: 1303-1325.
Blundell, Richard, and Stephen Bond. 1998. "Initial Conditions and Moment Restrictions
in Dynamic Panel Data Models." Journal of Econometrics, 87(1): 115-143.
Boeri, Tito and Juan F. Jimeno. 2005. "The Effects of Employment Protection: Learning
from Variable Enforcement." European Economic Review, 49(8): 2057-2077.
26
Brainard, S. Lael. 1997. "An Empirical Assessment of the Proximity-Concentration Trade-
OffBetween Multinational Sales and Trade." American Economic Review, 87(4): 520-544.
Carr, David L., James R. Markusen, and Keith E. Maskus. 2001. “Estimating the
Knowledge-Capital Model of the Multinational Enterprise.”American Economic Review,
91(3): 693-708.
Dewit, Gerda, Holger Gorg, Catia Montagna. 2009. "Should I Stay or Should I Go? Foreign
Direct Investment, Employment Protection and Domestic Anchorage." Review of World
Economics, 145: 93-110.
Di Tella, Rafael and Robert MacCulloch. 2005. "The Consequences of Labor Market Flex-
ibility: Panel Evidence Based on Survey Data." European Economic Review, 49(5):
1225-1259.
Ekholm, Karolina, Rikard Forslid, and James R. Markusen. 2007. "Export-Platform Foreign
Direct Investment" Journal of the European Economic Association, 5(4): 776-795.
Franzese, Robert J. Jr. and Jude C. Hays. 2008. "Interdependence in Comparative Politics:
Substance, Theory, Empirics, Substance." Comparative Political Studies, 41(4/5): 742-
780.
Gorg, Holger. 2005. "Fancy a Stay at the ’Hotel California’? The Role of Easy Entry and
Exit for FDI." Kyklos, 58(4): 519-535.
Helpman, Elhanan. 1984. "A Simple Theory of International Trade with Multinational
Corporations." Journal of Political Economy, 92(3): 451-471.
Henisz, Witold J. 2002. "The Institutional Environment for Infrastructure Investment."
Industrial and Corporate Change, 11(2): 355-389.
Holtz-Eakin, Douglas, Whitney Newey, and Harvey S. Rosen. 1988. "Estimating Vector
Autoregressions with Panel Data." Econometrica, 56: 1371-1395.
Javorcik, Beata Smarzynska and Mariana Spatareanu. 2005. "Do Foreign Investors Care
about Labor Market Regulations?" Review of World Economics, 141(3): 375-403.
27
Lazear, Edward P. 1990. "Job Security Provisions and Employment." The Quarterly Journal
of Economics, 105(3): 699-726.
MacMillan, William D., Robert J. Franzese Jr. and Jude C. Hays. 2009. SPREG: Mod-
els with Spatio-temporal Interdpendence (Stata version). Version 1.0. Ann Arbor, MI:
University of Michigan. http://www-personal.umich.edu/~wmacmill/
Markusen, James R. 1984. "Multinationals, Multiplant Economies, and the Gains from
Trade." Journal of International Economics, 16(3-4): 205-226.
Markusen, James R. and Keith E. Maskus. 2002. "Discriminating Among Alternative Theo-
ries of the Multinational Enterprise." Review of International Economics, 10(4): 694-707.
Organisation for Economic Cooperation and Development. 2000. "International Trade and
Core Labour Standards." Paris.
Rodrik, Dani. 1996. "Labor Standards in International Trade: Do They Matter and What
Do We Do About Them?" In R.Z. Lawrence, D. Rodrik, & J. Whalley (Eds.) Emerging
Agenda for Global Trade: High Stakes for Developing Countries, Overseas Development
Council, Washington DC, Johns Hopkins University Press.
Roodman, David. 2006. "How to Do xtabond2: An Introduction to ’Difference’and ’System’
GMM in Stata." Center for Global Development Working Paper Number 103.
Roodman, David. 2008. "A Note on the Theme of Too Many Instruments." Center for
Global Development Working Paper Number 125.
U.S. Census. 2010. "U.S. Goods Trade: Imports & Exports by Related-Parties 2009." U.S.
Census Bureau News. U.S. Department of Commerce.
Yeaple, Stephen R. 2003. "The Complex Integration Strategies of Multinationals and Cross
Country Dependencies in the Structure of Foreign Direct Investment." Journal of Inter-
national Economics, 60(2): 293-314.
28

Variable Observations Mean Standard Deviation Minimum Maximum
Total Affiliate Sales ($m) 556 71,364 96,918 1,165 586,295Employment Protection 560 2.204 0.971 0.600 4.190GDP ($m) 582 627,057 709,352 43,425 3,618,565Population (thousands) 598 31,543 31,937 3,272 127,787Trade Costs 593 0.021 0.011 0.006 0.068Skill 598 9.4 1.9 4.0 13.1Tax Rate 549 33 10 9 56Investment Costs 590 0.018 0.003 0.012 0.027Union 558 35 20 7 84Ideology 590 2.1 0.5 1.2 3.0
TABLE 1
Summary Statistics
The sample includes 26 OECD countries and 23 years (19852007).
29
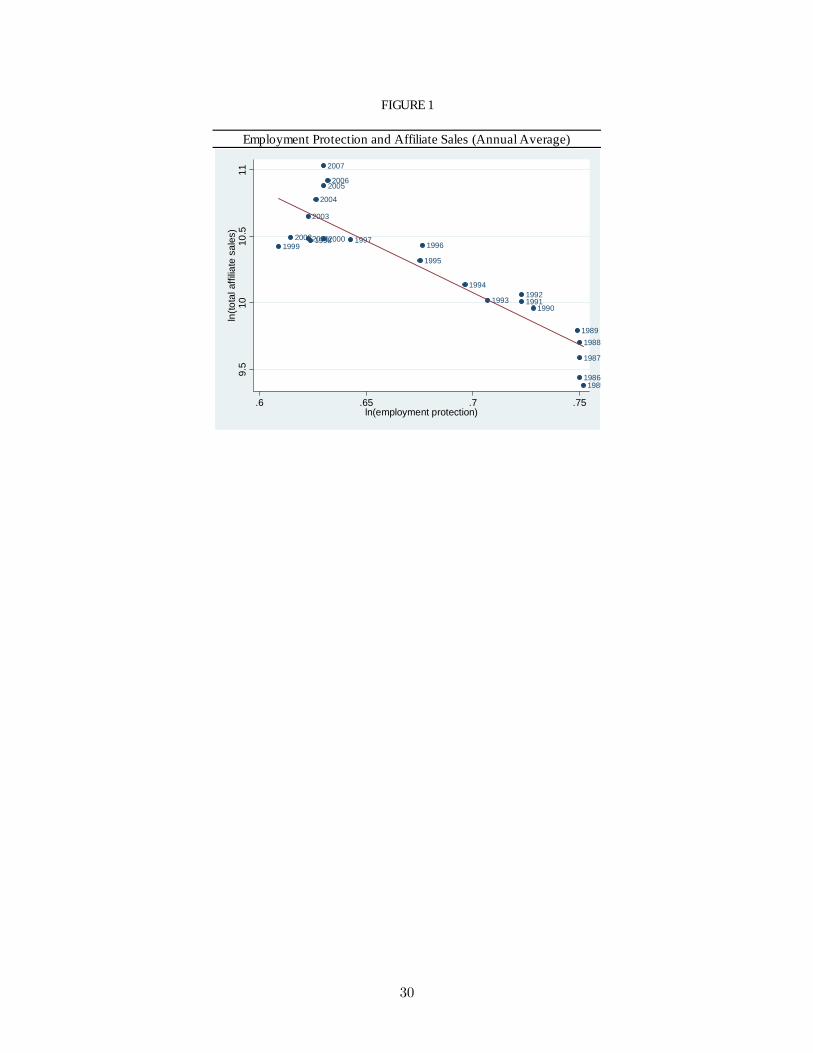
FIGURE 1
Employment Protection and Affiliate Sales (Annual Average)
19851986
1987
19881989
199019911992
1993
1994
1995
199619971998
1999200020012002
2003
2004
20052006
2007
9.5
1010
.511
ln(to
tal a
ffilia
te s
ales
)
.6 .65 .7 .75ln(employment protection)
30
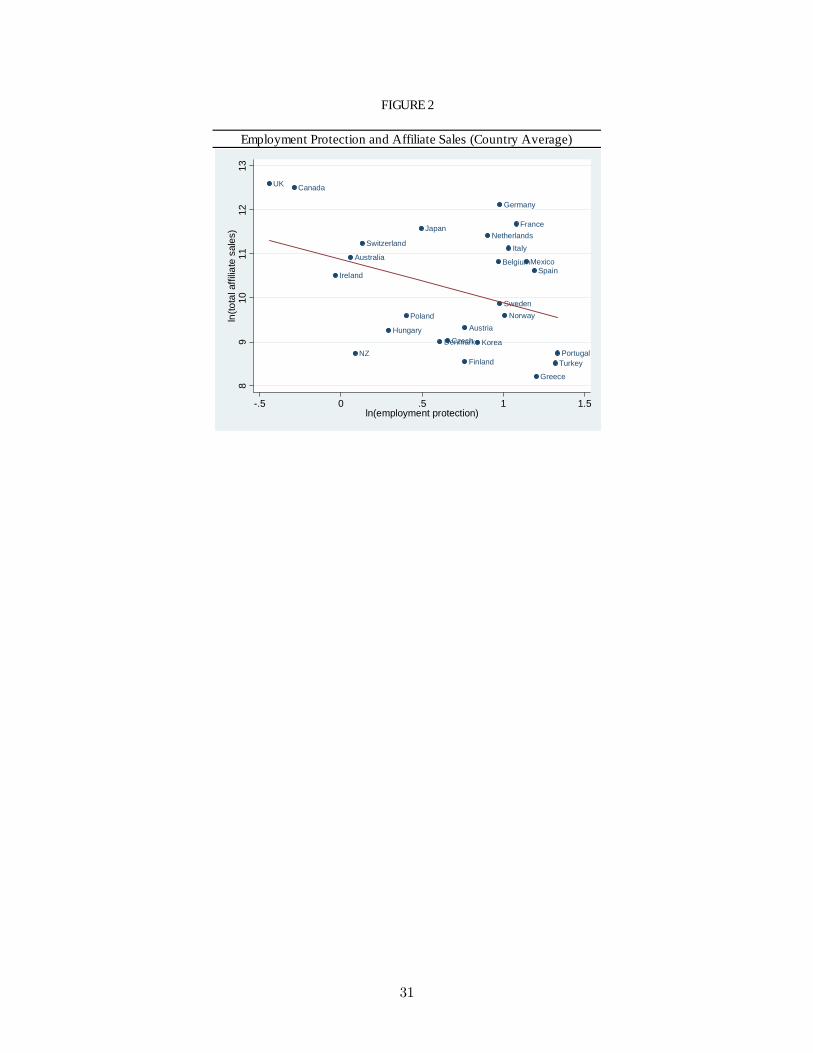
FIGURE 2
Employment Protection and Affiliate Sales (Country Average)
Australia
Austria
Belgium
Canada
CzechDenmark
Finland
France
Germany
Greece
Hungary
Ireland
Italy
Japan
Korea
Mexico
NZ
Netherlands
NorwayPoland
Portugal
Spain
Sweden
Switzerland
Turkey
UK
89
1011
1213
ln(to
tal a
ffilia
te s
ales
)
.5 0 .5 1 1.5ln(employment protection)
31

FIGURE 3
Horizontal FDI (Country Average)
ExportPlatform FDI (Country Average)
Vertical FDI (Country Average)
Australia
Austria
Belgium
Canada
CzechDenmarkFinland
FranceGermany
GreeceHungary
Ireland
ItalyJapan
Korea
Mexico
NZ
Netherlands
NorwayPolandPortugal
Spain
SwedenSwitzerland
Turkey
UK
24
68
1012
14ln
(affi
liate
sal
es to
hos
t cou
ntry
)
.5 0 .5 1 1.5ln(employment protection)
Australia
Austria
Belgium
Canada
CzechDenmark
Finland
FranceGermany
Greece
Hungary
IrelandItaly
Japan
Korea
Mexico
NZ
Netherlands
NorwayPoland
Portugal
Spain
Sweden
Switzerland
Turkey
UK
24
68
1012
14ln
(affi
liate
sal
es to
oth
er fo
reig
n co
untri
es)
.5 0 .5 1 1.5ln(employment protection)
Australia
Austria
Belgium
Canada
CzechDenmark
Finland
FranceGermany
Greece
Hungary
Ireland
Italy
Japan
Korea
Mexico
NZ
Netherlands
Norway
Poland
Portugal
SpainSweden
Switzerland
Turkey
UK
24
68
1012
14ln
(affi
liate
sal
es b
ack
to th
e U
.S.)
.5 0 .5 1 1.5ln(employment protection)
32

FIGURE 4
Average Employment Protection Over Time
The solid line represents the mean of Employment Protection by year.The 26 OECD countries are included in this mean, although not allcountries span the entire sample. The dotted lines represent the 95%confidence intervals.
01
23
45
Em
ploy
men
t Pro
tect
ion
1985 1990 1995 2000 2005 2010Year
33

Lagged Independent Variables Total Sales Local Sales Foreign Sales U.S. Sales
Employment Protection 0.178*** 0.186*** 0.099 0.638***[0.056] [0.049] [0.133] [0.220]
GDP 1.567*** 1.887*** 0.025 0.894[0.130] [0.137] [0.337] [0.674]
Population 0.284 0.015 1.083 2.008[0.424] [0.443] [0.866] [1.233]
Trade Costs 0.838*** 0.500*** 2.350*** 2.278***[0.119] [0.122] [0.279] [0.481]
Skill 0.923*** 0.574*** 2.022*** 2.855***[0.136] [0.122] [0.356] [0.696]
Tax Rate 0.087 0.046 0.102 0.591**[0.061] [0.053] [0.136] [0.247]
Investment Costs 0.397** 0.331** 1.846*** 3.747***[0.160] [0.167] [0.598] [1.203]
Observations 490 472 482 464Rsquared 0.99 0.99 0.96 0.92
TABLE 2Foreign Affiliate Sales by Destination (OLS)
Robust standard errors in brackets. *** p<0.01, ** p<0.05, * p<0.1. All variables are in natural logs. Theindependent variables are all lagged one period. Country and year fixed effects are included in allregressions. The dependent variable is U.S. foreign affiliates sales. Total Sales are affiliate sales to alllocations, Local Sales are affiliate sales within the host country, Foreign Sales are affiliate sales to otherforeign countries not including the U.S. or the host country, and U.S. sales are affiliate sales back to theU.S.
34
Lagged Independent Variables Total Sales Local Sales Foreign Sales U.S. Sales
Employment Protection 0.096* 0.071 0.202** 0.565***[0.052] [0.069] [0.083] [0.175]
GDP 0.323** 0.524*** 0.304 1.334**[0.155] [0.151] [0.212] [0.535]
Population 0.133 0.059 0.985* 1.288[0.320] [0.306] [0.533] [0.941]
Trade Costs 0.214* 0.365*** 0.603*** 0.623**[0.117] [0.102] [0.196] [0.253]
Skill 0.411*** 0.453*** 0.531** 0.933**[0.118] [0.116] [0.207] [0.427]
Tax Rate 0.004 0.056 0.063 0.084[0.048] [0.049] [0.078] [0.148]
Investment Costs 0.087 0.078 0.156 0.511[0.148] [0.138] [0.230] [0.564]
Total sales 0.803***[0.032]
Local sales 0.698***[0.044]
Foreign sales 0.681***[0.036]
U.S. sales 0.561***[0.118]
Observations 461 420 437 400Hansen J pvalue 1 1 1 1AR2 pvalue 0.50 0.09 0.18 0.94
TABLE 3Foreign Affiliate Sales by Destination (Arellano Bond GMM)
Robust standard errors in brackets. *** p<0.01, ** p<0.05, * p<0.1. All variables are in natural logs. Theindependent variables are all lagged one period. Year fixed effects are included in all regressions. Thedependent variable is U.S. foreign affiliates sales. Total Sales are affiliate sales to all locations, Local Salesare affiliate sales within the host country, Foreign Sales are affiliate sales to other foreign countries notincluding the U.S. or the host country, and U.S. sales are affiliate sales back to the U.S.
35
Lagged Independent Variables Total Sales Local Sales Foreign Sales U.S. Sales
Unions 0.418*** 0.410*** 0.420*** 0.412***[0.045] [0.046] [0.047] [0.047]
Ideology 0.070*** 0.067*** 0.070*** 0.067***[0.023] [0.023] [0.023] [0.023]
Observations 482 464 474 456Rsquared 0.97 0.97 0.97 0.97CraggDonald F Stat, Instruments 44 43 43 42
TABLE 4First Stage IV Results (Dependent Variable: Employment Protection)
Robust standard errors in brackets. *** p<0.01, ** p<0.05, * p<0.1. All variables are in natural logs. Theindependent variables are all lagged one period. Country fixed effects, year fixed effects, and all controlvariables are included in all regressions. The dependent variable is employment protection in allregressions. These first stage results vary slightly depending on the sample size of the affiliate salesmeasure used in the second stage.
36
Lagged Independent Variables Total Sales Local Sales Foreign Sales U.S. Sales
Employment Protection 0.654*** 0.413*** 1.511*** 2.988***[0.140] [0.136] [0.492] [1.155]
GDP 1.864*** 2.045*** 0.831*** 2.123***[0.143] [0.155] [0.307] [0.483]
Population 0.314 0.153 3.007** 1.978[0.461] [0.483] [1.266] [2.596]
Trade Costs 0.831*** 0.449*** 2.406*** 2.697***[0.120] [0.126] [0.311] [0.574]
Skill 1.153*** 0.698*** 2.680*** 3.889***[0.156] [0.123] [0.496] [1.069]
Tax Rate 0.005 0.012 0.19 0.094[0.059] [0.053] [0.155] [0.266]
Investment Costs 0.384** 0.405** 1.503*** 2.773***[0.165] [0.162] [0.552] [1.003]
Observations 482 464 474 456Rsquared 0.99 0.99 0.95 0.91CraggDonald F Stat, Instruments 44 43 43 42Hansen J pvalue 0.63 0.31 0.59 0.42
TABLE 5Foreign Affiliate Sales by Destination (IV)
Robust standard errors in brackets. *** p<0.01, ** p<0.05, * p<0.1. All variables are in natural logs. Theindependent variables are all lagged one period. Country and year fixed effects are included in allregressions. The dependent variable is U.S. foreign affiliates sales. Total Sales are affiliate sales to alllocations, Local Sales are affiliate sales within the host country, Foreign Sales are affiliate sales to otherforeign countries not including the U.S. or the host country, and U.S. sales are affiliate sales back to theU.S.
37

Lagged Independent Variables OLS GMM IV
Competitor's EP 0.887 0.831 6.276[0.938] [0.754] [4.803]
Host EP 0.792*** 0.792*** 0.597***[0.070] [0.034] [0.192]
Observations 494 468 494Rsquared 0.99 0.99CraggDonald F Stat, Instruments 7Hansen J pvalue 1 0.02AR2 pvalue 0.053
TABLE 6Host Employment Protection, Unweighted Average of Competitor's EP
Robust standard errors in brackets. *** p<0.01, ** p<0.05, * p<0.1. All variables are in naturallogs. The independent variables are all lagged one period. Country fixed effects, year fixedeffects, and all control variables (including unions and ideology) are included in all regressions.The dependent variable is employment protection in the host country. The competitor'semployment protection variable is the unweighted average of employment protection in otherforeign countries.
38

Lagged Independent Variables OLS GMM IV
Competitor's EP 0.002 0.01 0.191[0.100] [0.139] [0.374]
Host EP 0.825*** 0.821*** 0.818***[0.051] [0.030] [0.052]
Observations 494 468 494Rsquared 0.99 0.99CraggDonald F Stat, Instruments 19Hansen J pvalue 1 0.64AR2 pvalue 0.054Robust standard errors in brackets. *** p<0.01, ** p<0.05, * p<0.1. All variables are in naturallogs. The independent variables are all lagged one period. Country fixed effects, year fixedeffects, and all control variables (including unions and ideology) are included in all regressions.The dependent variable is employment protection in the host country. The competitor'semployment protection variable is the weighted average of employment protection in other foreigncountries using the inverse of distance between the host and foreign country as weights.
TABLE 7Host Employment Protection, Distance Weighted Average of Competitor's EP
39
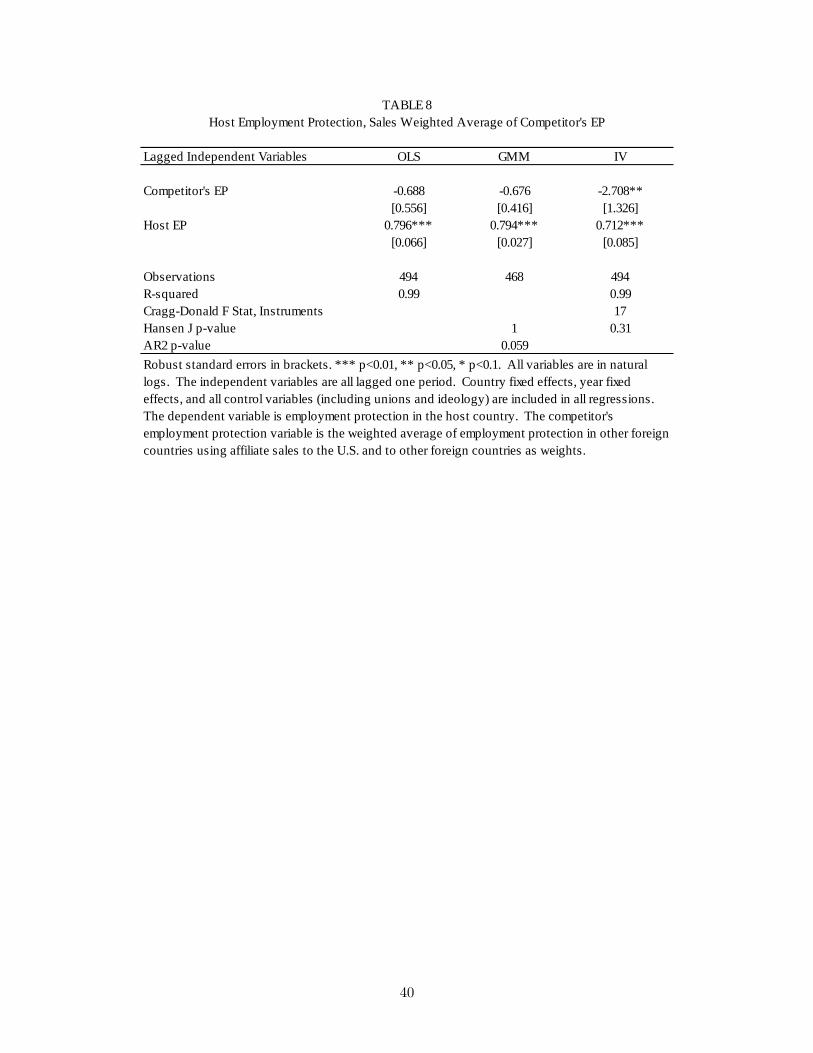
Lagged Independent Variables OLS GMM IV
Competitor's EP 0.688 0.676 2.708**[0.556] [0.416] [1.326]
Host EP 0.796*** 0.794*** 0.712***[0.066] [0.027] [0.085]
Observations 494 468 494Rsquared 0.99 0.99CraggDonald F Stat, Instruments 17Hansen J pvalue 1 0.31AR2 pvalue 0.059
TABLE 8Host Employment Protection, Sales Weighted Average of Competitor's EP
Robust standard errors in brackets. *** p<0.01, ** p<0.05, * p<0.1. All variables are in naturallogs. The independent variables are all lagged one period. Country fixed effects, year fixedeffects, and all control variables (including unions and ideology) are included in all regressions.The dependent variable is employment protection in the host country. The competitor'semployment protection variable is the weighted average of employment protection in other foreigncountries using affiliate sales to the U.S. and to other foreign countries as weights.
40
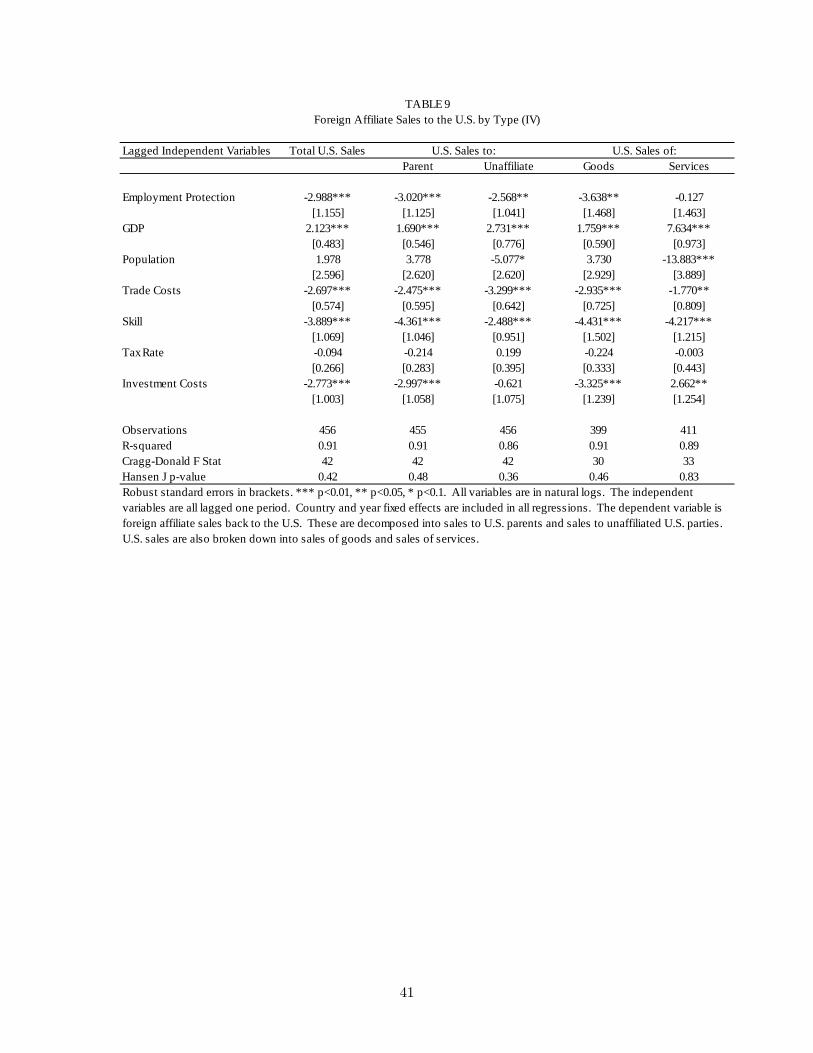
Lagged Independent Variables Total U.S. SalesParent Unaffiliate Goods Services
Employment Protection 2.988*** 3.020*** 2.568** 3.638** 0.127[1.155] [1.125] [1.041] [1.468] [1.463]
GDP 2.123*** 1.690*** 2.731*** 1.759*** 7.634***[0.483] [0.546] [0.776] [0.590] [0.973]
Population 1.978 3.778 5.077* 3.730 13.883***[2.596] [2.620] [2.620] [2.929] [3.889]
Trade Costs 2.697*** 2.475*** 3.299*** 2.935*** 1.770**[0.574] [0.595] [0.642] [0.725] [0.809]
Skill 3.889*** 4.361*** 2.488*** 4.431*** 4.217***[1.069] [1.046] [0.951] [1.502] [1.215]
Tax Rate 0.094 0.214 0.199 0.224 0.003[0.266] [0.283] [0.395] [0.333] [0.443]
Investment Costs 2.773*** 2.997*** 0.621 3.325*** 2.662**[1.003] [1.058] [1.075] [1.239] [1.254]
Observations 456 455 456 399 411Rsquared 0.91 0.91 0.86 0.91 0.89CraggDonald F Stat 42 42 42 30 33Hansen J pvalue 0.42 0.48 0.36 0.46 0.83
TABLE 9Foreign Affiliate Sales to the U.S. by Type (IV)
U.S. Sales to: U.S. Sales of:
Robust standard errors in brackets. *** p<0.01, ** p<0.05, * p<0.1. All variables are in natural logs. The independentvariables are all lagged one period. Country and year fixed effects are included in all regressions. The dependent variable isforeign affiliate sales back to the U.S. These are decomposed into sales to U.S. parents and sales to unaffiliated U.S. parties.U.S. sales are also broken down into sales of goods and sales of services.
41

Lagged Independent Variables
EP Total 2.988***[1.155]
EP Firing 4.285***[1.480]
EP Hiring 2.331**[1.100]
GDP 2.123*** 0.837 3.776***[0.483] [0.534] [1.271]
Population 1.978 0.507 2.112[2.596] [1.748] [3.196]
Trade Costs 2.697*** 1.260*** 2.791***[0.574] [0.434] [0.706]
Skill 3.889*** 3.840*** 3.850***[1.069] [1.000] [1.213]
Tax Rate 0.094 0.899*** 0.004[0.266] [0.245] [0.374]
Investment Costs 2.773*** 0.77 3.675***[1.003] [0.972] [1.350]
Observations 456 456 456Rsquared 0.91 0.92 0.88CraggDonald F Stat 42 58 11Hansen J pvalue 0.42 0.82 0.11
Robust standard errors in brackets. *** p<0.01, ** p<0.05, * p<0.1. All variables are in natural logs. Theindependent variables are all lagged one period. Country and year fixed effects are included in allregressions. The dependent variable is foreign affiliate sales back to the U.S. Different regressionsinclude different measures of employment protection. Total employment protection is an average of"firing" which includes restrictions on individual dismissals and "hiring" which includes restrictions onthe hiring of temporary workers.
TABLE 10Impact of Different Types of Employment Protection on Foreign Affiliate Sales to the U.S. (IV)
U.S. Sales
42

Lagged Independent Variables Unweighted Distance Sales
Competitor's EP 3.572*** 0.174*** 0.922***[0.421] [0.056] [0.160]
Host EP 0.704*** 0.820*** 0.791***[0.053] [0.048] [0.049]
Observations 494 494 494Robust standard errors in brackets. *** p<0.01, ** p<0.05, * p<0.1. All variables are in natural logs. Allindependent variables, expect Competitor's EP, are lagged one period. Country fixed effects, year fixedeffects, and all control variables (including unions and ideology) are included in all regressions. Thedependent variable is employment protection in the host country. The competitor's employmentprotection variable is the average of employment protection in other foreign countries, which iscalculated as an unweighted average, a weighted average using distance, and a weighted average usingaffiliate sales.
Host Employment Protection, Contemporaneous Average of Competitor's EP (ML Estimation)TABLE 11
43