A Quick Look at the 2012 Corn & Soybean Crops...Microsoft PowerPoint -...
20
A Quick Look at the 2012 Corn & Soybean Crops Terry Roggensack – [email protected] Ken Smithmier – [email protected] The Hightower Report July 16 th , 2012
Transcript of A Quick Look at the 2012 Corn & Soybean Crops...Microsoft PowerPoint -...

A Quick Look at the 2012 Corn & Soybean Crops
Terry Roggensack – [email protected] Smithmier – [email protected]
The Hightower ReportJuly 16th, 2012

DisclaimerThis report includes information from sources believed to be
reliable and accurate as of the date of this publication, but noindependent verification has been made and we do not
guarantee its accuracy or completeness. Opinions expressed are subject to change without notice. This report should not beconstrued as a request to engage in any transaction involving the purchase or sale of a futures contract and/or commodity
option thereon. The risk of loss in trading futures contracts or commodity options can be substantial, and investors should
carefully consider the inherent risks of such an investment in light of their financial condition. Any reproduction or
retransmission of this report without the express written consent of The Hightower Report is strictly prohibited.

2nd Worst Corn Ratings on Record for Week Ending July 15
30
35
40
45
50
55
60
65
70
75
80
May-16 Jun-2 Jun-19 Jul-6 Jul-23 Aug-9 Aug-26 Sep-12 Sep-29 Oct-16
10 Yr. Avg. Last Yr. Current
Corn Conditions - Good / Excellent - Select States
Most Recent Value: 31% on 7.15.2012Source: USDA

Iowa Corn Good / Excellent 36% vs. 20-year average of 71%
35
40
45
50
55
60
65
70
75
80
85
May-16 Jun-2 Jun-19 Jul-6 Jul-23 Aug-9 Aug-26 Sep-12 Sep-29 Oct-16
10 Yr. Avg. Last Yr. Current
Corn Conditions - Good / Excellent - Iowa
Most Recent Value: 36% on 7.15.2012Source: USDA

Corn - US Actual vs. 10 Year Trend Analysis
Year Yield10 Year
Trend % vs Actual2012 Yield Equivilant
1970 72.33 87.35 -17.19% 131.711974 71.85 96.23 -25.33% 118.771980 90.97 102.88 -11.57% 140.651983 81.09 113.71 -28.68% 113.431988 84.60 118.04 -28.33% 114.001993 100.69 124.61 -19.20% 128.52
2012* 146.00 159.06 -8.21%*2012 Yield based on July 2012 WASDE Report.
Actual (bu/acre) Trend (bu/acre)
Corn Yield: 113.5 to 140.6???

USDA SUPPLY/DEMANDUS CORN
Jul Jul JulUSDA USDA USDA
05-06 06-07 08-09 09-10 10-11 11-12 12-13 Low current HighPlanted Area (M Acres) 81.8 78.3 86.0 86.4 88.2 91.9 96.4 96.4 96.4 96.4Harvested Area (Acres) 75.1159 70.636 78.6 79.5 81.4 84.0 88.9 87.9 87.9 87.9Yield (Bu/Acre) 147.9 149.1 153.9 164.7 152.8 147.2 146.0 134.0 139.0 142.0
Beginning Stocks (M Bu) 2,114 1,967 1,624 1,673 1,708 1,128 903 851 851 851Production 11,112 10,531 12,092 13,092 12,447 12,358 12,970 11,779 12,218 12,482Imports 9 12 14 8 28 20 30 15 15 15 Supply, Total 13,235 12,510 13,729 14,774 14,182 13,508 13,903 12,645 13,084 13,348
Feed & Residual 6,115 5,540 5,182 5,125 4,793 4,550 4,800 4,800 4,800 4,800Food, Seed & Industry 3,019 3,541 5,025 5,961 6,428 6,455 6,320 6,320 6,320 6,320 Ethanol for Fuel 1,603 2,119 3,709 4,591 5,021 5,050 4,900 4,900 4,900 4,900 Domestic Total 9,134 9,081 10,207 11,086 11,220 11,005 11,120 11,120 11,120 11,120Total Exports 2,134 2,125 1,849 1,980 1,835 1,600 1,600 1,600 1,600 1,600 Use, Total 11,268 11,207 12,056 13,066 13,055 12,605 12,720 12,720 12,720 12,720Ending Stocks 1,967 1,304 1,673 1,708 1,128 903 1,183 -75 364 628
Stocks/Use Ratio 17.5% 11.6% 13.9% 13.1% 8.6% 7.2% 9.3% -0.6% 2.9% 4.9%
Various Yields
2012-13 Outlook

December Corn 1983 38% Rally From(July 5, 1983 to
August 25, 1983)
Weather / Supply Driven Rally
2012 CZ Equivalent 6.98
255
270
285
300
315
330
345
360
375
390
Dec-82 Feb-83 Apr-83 Jun-83 Aug-83 Oct-83 Dec-83
DEC 1983 Corn
The Hightower Report Max: 376.5 (8/25/1983) - Min: 262.25 (12/3/1982)
Cents per Bushel

December Corn 198866% rally
(May 13, 1988 to June 28, 1988)
Weather/Supply Driven Rally
2012 CZ Equivalent 8.39
180200220
240260280300320
340360380
Dec-87 Feb-88 Apr-88 Jun-88 Aug-88 Oct-88 Dec-88
DEC 1988 Corn
The Hightower Report Max: 370 (7/5/1988) - Min: 192 (12/7/1987)
Cents per Bushel

Corn Strategies • Buy August 770/820 bull call at 18 cents looking for
the spread to move to maximum 50 cents in next 10 days. Aggressive traders can sell an August 700 put for 12 ½ which cheapens net outlay to just 5 ½ cents but adds risk.
• Buy Sept 770/900 bull call at 34 cents looking for the spread to move to 92 cents on a run to 900 in the next few weeks. Aggressive traders can sell an Sept 700 put for 14 which cheapens net outlay to just 20 cents but adds risk.

Soybean Good / Excellent34% vs. 20-year Average of 62%
30
35
40
45
50
55
60
65
70
75
May-27 Jun-10 Jun-24 Jul-8 Jul-22 Aug-5 Aug-19 Sep-2 Sep-16 Sep-30
10 Yr. Avg. Last Yr. Current
Soybeans Conditions - Good / Excellent - Select States
Most Recent Value: 34% on 7.15.2012Source: USDA

IL Soybean Good / Excellent17% vs. 1988 Rating of 9% on July 15th
10
20
30
40
50
60
70
May-27 Jun-10 Jun-24 Jul-8 Jul-22 Aug-5 Aug-19 Sep-2 Sep-16 Sep-30
10 Yr. Avg. Last Yr. Current
Soybeans Conditions - Good / Excellent - Illinois
Most Recent Value: 17% on 7.15.2012Source: USDA

Soybeans - US Actual vs. 10 Year Trend Analysis
Year Yield10 Year
Trend % vs Actual2012 Yield Equivilant
1974 23.69 28.99 -18.28% 36.181980 26.51 30.57 -13.30% 38.381983 26.16 31.44 -16.79% 36.831988 27.00 33.05 -18.31% 36.161993 32.63 36.61 -10.89% 39.452003 33.86 39.28 -13.81% 38.162012 40.50 44.27 -8.51%
*2012 Yield based on July 2012 WASDE Report.
Actual (bu/acre) Trend (bu/acre)
Soybean Yield: 36.2 to 39.4???

USDA SUPPLY/DEMANDUS SOYBEANS
Jul Jul JulUSDA USDA USDA
05-06 06-07 07-08 09-10 10-11 11-12 12-13 Low Trend HighPlanted Area (M Acres) 72.0 75.5 64.7 77.5 77.4 75.0 76.1 76.1 76.1 76.1Harvested Area (Acres) 71.2 74.6 64.1 76.4 76.6 73.6 75.3 75.3 75.3 75.3Yield (Bu/Acre) 43.1 42.9 41.7 44.0 43.5 41.5 40.5 38.0 39.5 40.5
Beginning Stocks (M Bu) 256 449 574 138 151 215 170 175 175 175Production 3,068 3,197 2,677 3,359 3,329 3,056 3,050 2,861 2,974 3,050Imports 3 9 10 15 14 15 15 15 15 15 Supply,Total 3,327 3,655 3,261 3,512 3,495 3,286 3,235 3,051 3,164 3,240
Crushings 1,739 1,808 1,803 1,752 1,648 1,675 1,610 1,610 1,610 1,610Exports 940 1,116 1,159 1,499 1,501 1,340 1,370 1,370 1,370 1,370Seed 93 80 89 90 87 88 89 89 89 89Residual 101 77 5 20 43 13 35 36 36 36 Use, Total 2,878 3,081 3,056 3,361 3,280 3,116 3,105 3,105 3,105 3,105Ending Stocks 449 574 205 151 215 170 130 -54 59 135
Stocks/Use Ratio 15.6% 18.6% 6.7% 4.5% 6.6% 5.5% 4.2% -1.7% 1.9% 4.3%
Various YieldsNew Acreage and2012-13 Outlook

November Soybeans 198362% rally
(June 29th, 1983 to September 13th, 1983)
2012 SX Equivalent 20.16
550
600
650
700
750
800
850
900
950
1000
Nov-82 Jan-83 Mar-83 May-83 Jul-83 Sep-83 Nov-83
NOV 1983 Soybeans
The Hightower Report Max: 968.5 (9/13/1983) - Min: 570.5 (11/1/1982)
Cents per Bushel

November Soybeans 198849% rally (April 11, 1988
to June 23th)
2012 SX Equivalent 18.54
500
600
700
800
900
1000
1100
Nov-87 Jan-88 Mar-88 May-88 Jul-88 Sep-88 Nov-88
NOV 1988 Soybeans
The Hightower Report Max: 1046 (6/23/1988) - Min: 532.5 (11/4/1987)
Cents per Bushel

Soybean strategies: • Buy August 1640/1720 bull call at 20 cents looking
for the spread to move to maximum 80 cents in next 10 days. Aggressive traders can sell an August 1560 put for 14 which cheapens net outlay to just 6 cents but adds risk.
• Buy Nov 1600/1840 bull call spread for 58 cents. On a run to 1855 in the next 30 days, the spread should be near 147. Aggressive Traders could sell a Nov 1420 put for 30 but adds to risk.

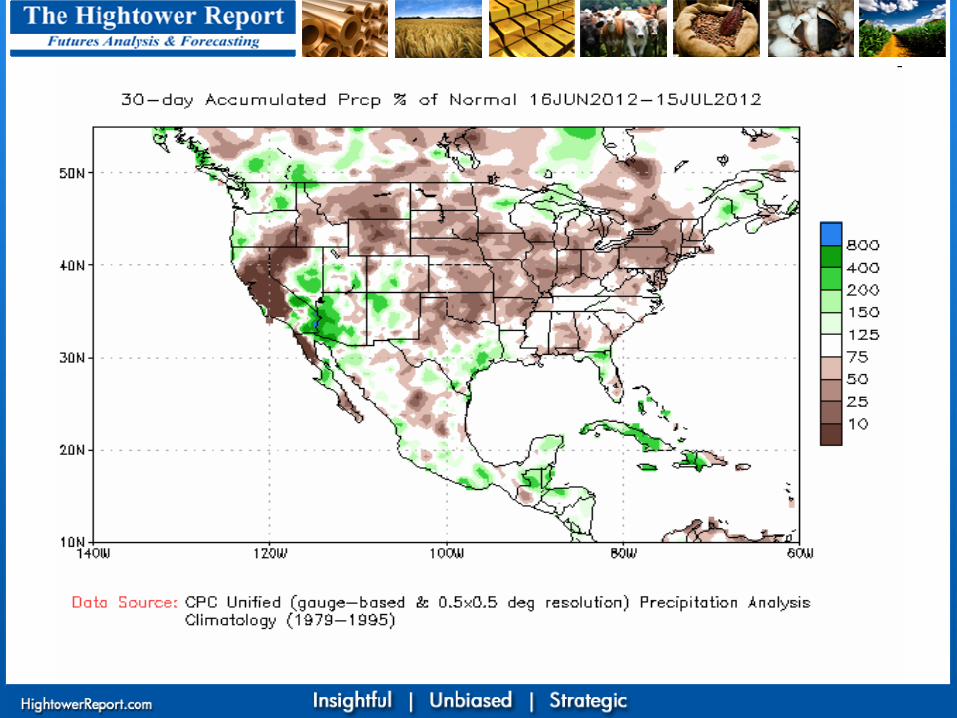
1-week Rain Totals – Light Blue is Less Than ¼ inch

Topsoil Ratings vs. 5-yr Mean

NOAA Outlook