
Case Study: Facebook campaign for Reliance Trends Independence Day Offer
A question of independence
A call for action to improve sight losssupport services across the UK
Barbara McLaughlan, Anita Lightstone, Steve Winyard
A question of independence
2
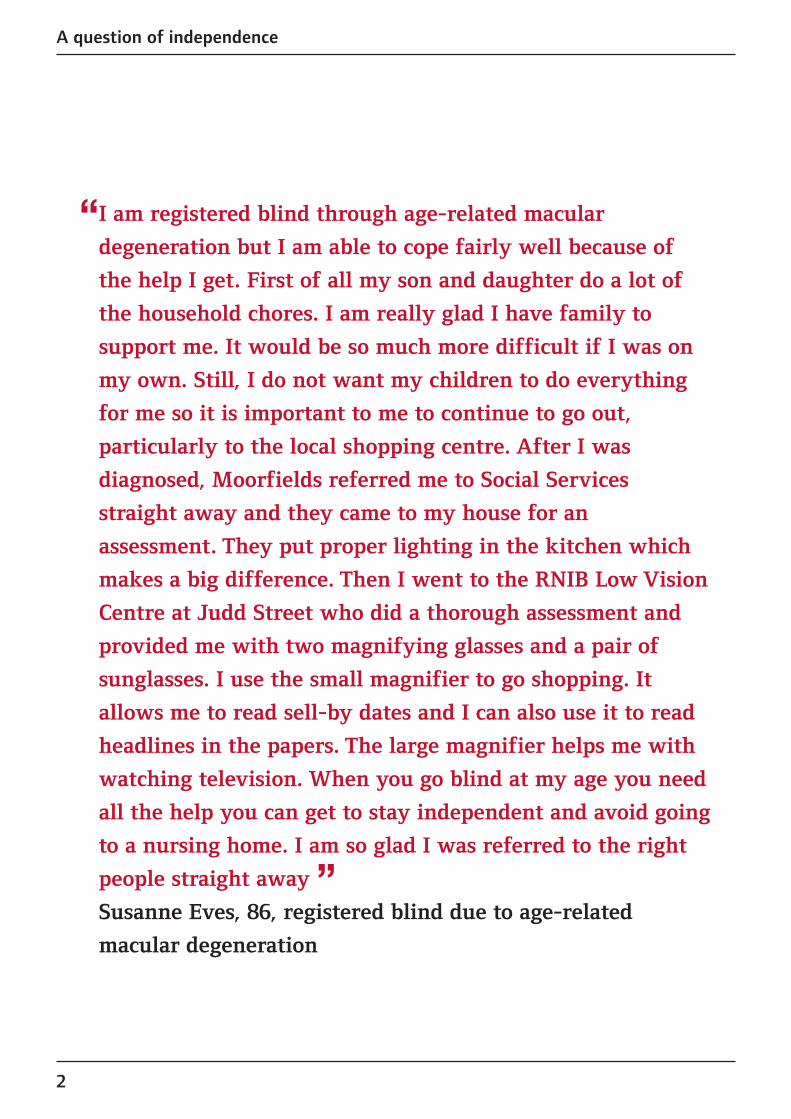
“I am registered blind through age-related macular
degeneration but I am able to cope fairly well because of
the help I get. First of all my son and daughter do a lot of
the household chores. I am really glad I have family to
support me. It would be so much more difficult if I was on
my own. Still, I do not want my children to do everything
for me so it is important to me to continue to go out,
particularly to the local shopping centre. After I was
diagnosed, Moorfields referred me to Social Services
straight away and they came to my house for an
assessment. They put proper lighting in the kitchen which
makes a big difference. Then I went to the RNIB Low Vision
Centre at Judd Street who did a thorough assessment and
provided me with two magnifying glasses and a pair of
sunglasses. I use the small magnifier to go shopping. It
allows me to read sell-by dates and I can also use it to read
headlines in the papers. The large magnifier helps me with
watching television. When you go blind at my age you need
all the help you can get to stay independent and avoid going
to a nursing home. I am so glad I was referred to the right
people straight away ”Susanne Eves, 86, registered blind due to age-related
macular degeneration

A question of independence
3
ContentsExecutive summary 4
1. The sight loss challenge 7
2. The RNIB/AMD Alliance UK low vision services survey 8
a. Background to the survey 8
b. Methodology 10
3. Survey results 13
a. Profile of service providers 13
b. Types of services provided 14
c. Reasons for not providing services 14
d. Multi-disciplinary and multi-professional working – the importance of an holisticapproach to low vision support services 16
e. The role of Low Vision Services Committees 19
f. Information about existing services 21
g. Waiting times 22
h. Specialised training and frequency of appointments 24
i. Funding 25
j. Quality of services 27
4. Conclusions and calls for action 30
Notes and references 32
Appendix: Template letter to GP practices to encourage the dissemination of information about available sight loss support services 34
Acknowledgements 35

A question of independence
4
Executive summary
BackgroundTwo million people in the UK are living with sight loss. This can range from difficultiesreading a newspaper, driving and recognising a friend across the room, to blindness thatmakes it difficult to cook, look after personal hygiene or leave the house without assistance.Even with major action on eliminating avoidable sight loss the number of people with sightloss is likely to increase significantly within the next 25 years, primarily because of theageing of the population.
Current health and social care agendas flag up the importance and value of preventativeapproaches. Good quality, integrated low vision services enable people with sight problemsto retain or regain their independence and avoid the depression and dependency that sooften accompany this disability. At the same time quality low vision support contributes totheir general health and wellbeing. However, it is widely recognised that services in the UKare fragmented, difficult to access and lacking an holistic, multidisciplinary approach. Stepshave been taken to remedy this situation with Scotland, Wales, Northern Ireland andEngland pursuing their own paths towards improving services.
Report findings and calls for actionThis report describes the findings of a survey of low vision service providers and primarycare organisations in the UK conducted in 2004/5 on behalf of AMD Alliance UK and RNIB.The results show that efforts to improve services need to continue, particularly in relation tothe level of funding, the degree of multi-disciplinary working, channels used to raiseawareness of existing services to the general public and the quality of services.
The survey provides a wealth of information that is being discussed in detail in the body ofthe report. For this executive summary we would like to focus on four issues where we feelthat action is most important.
1. Funding
It is clear that we will need more services to meet the needs of the growing number of olderpeople with sight loss. Yet the funding for low vision and rehabilitation services allocated bylocal government and local and regional health commissioning bodies appears to beinadequate, since 30 per cent of respondents who do not provide a service said thatfunding was the reason.

A question of independence
5
n We call on central and devolved governments to increase the funding for low visionservices and for PCTs and social services departments to carry out audits of low visionand rehabilitation services in their area, identify funding gaps and commission serviceswith a multi-disciplinary, holistic approach.
2. Multi-disciplinary and multi-professional working
The importance of an integrated approach to low vision rehabilitation is widely recognised.Such an approach allows patients to benefit from the expertise of ophthalmic professionals,social workers and rehabilitation specialists to ensure that they receive the best helpavailable. The survey shows that many of the respondents have relationships with otheragencies. However, the number of links varies considerably and the results indicate that aparticular area of concern is that of emotional support. With less than 20 per cent ofrespondents reporting links with counsellors and only 28 per cent of providers stating thatthey provide counselling services it is fair to assume a serious gap in service provision in thisarea.
n We call on commissioners to ensure that the services they commission cover the aspectof emotional support. Where service level agreements do not include an obligation toprovide such support, commissioners need to check that formal links with other agenciesare in place to ensure adequate provision.
3. Information about existing services
Whilst most service providers make an effort to raise awareness of their services in hospitaleye clinics, give advice during consultations or provide posters and leaflets in their ownwaiting rooms, only a minority (less than one in five) provide information about theirservices via GP surgeries. This means that people usually have to be “in the system” to learnabout available services and little effort is being made to reach those who do not realisethat their eye condition may be treatable or are not aware of the support they can get tohelp them live with sight loss.
n We call on service providers to use the template letter in the Appendix to contact GPsabout providing information to patients regarding low vision services in their area.
4. Quality of services
Service providers and PCTs were asked how they perceived the quality of service in theirarea. The responses were very varied and reflect the persistent variability in services acrossthe country. One third of providers and PCTs felt that services in their area were very goodor good, another third felt they were satisfactory whereas a quarter of providers and onesixth of PCTs said they were unsatisfactory. 12 per cent of providers did not reply to thisquestion and 20 per cent of PCTs did not know the answer.

A question of independence
6
n We call on central and devolved governments to require service providers to audit theirservices on a regular basis, involving users, voluntary organisations, Low Vision ServicesCommittees and local optical committees to cover all angles of service provision. Theseaudits should use established benchmarks and clear procedures for enforcing theimplementation of any resulting recommendations should be put in place.
These are essential steps to provide all people with sight loss with adequate, high qualityservices as and when they need them. However, at present there is no clear mechanism inplace to ensure that this objective is achieved across the country. The devolved nature ofhealth and social care and the multitude of agencies providing services is both an essentialelement of and an impediment to progress. Devolved services ensure that local structuresand needs are taken into account, yet the reliance on local decision-taking has created asystem that lacks accountability and perpetuates the postcode lottery in the provision ofservices.
n We call on the Government to appoint a Chief Vision Officer to provide clear benchmarksfor the quality of eye care services to be achieved across the country, monitor theimplementation of forthcoming recommendations on low vision pathways and serve as afocus point for stakeholder discussions about the future of low vision services.
Given the projected increase in the number of people with sight loss due to the ageing ofthe population, such an appointment would give a clear signal that the Government istaking seriously the sight loss challenge that is facing our health and social care systems inthe coming years.

A question of independence
7
1. The sight loss challengeTwo million people in the UK are living with sight loss. This can range from difficultiesreading a newspaper, driving and recognising a friend across the room to blindness thatmakes it difficult to cook, look after personal hygiene or leave the house without assistance.Of the two million people with sight loss approximately 380,000 are registered blind orpartially sighted, including 315,000 people in England, 20,000 in Wales, 38,000 in Scotlandand 5,000 in Northern Ireland. In addition, up to 76,000 people who are eligible to beregistered are not registered either because they have chosen not to or because they arenot known to social services or the medical profession [1]. Given the predicted increase inthe number of elderly people over the next 25 years the number of people at risk of sightloss will increase significantly. We may be able to limit the increase in the number of peoplewho will need sight loss support services through the provision of high quality eye careservices and appropriate preventative measures. However, the fact remains that the numberof elderly visually impaired people who need help to remain independent will increase. Thiswill not only put further pressure on already struggling sight loss support services across thecountry but also raise NHS costs due to sight loss related falls and other related issues.
A question of independence
8
2. The RNIB/AMD Alliance UK low visionservices survey
2.a Background to the surveyIn 2004 the AMD Alliance UK and RNIB decided to carry out a survey of low vision servicesin the UK to obtain an up-to-date view of the type and range of services provided, the levelof inter-agency working and the overall quality of services as perceived by service providersand PCTs.
The survey was conducted against the background of research carried out in 1997/8 [2] [3]which showed that low vision services in the UK were fragmented, difficult to access andlacking a holistic, multi-disciplinary approach. This general assessment was largely confirmedin subsequent reports by the Low Vision Services Consensus Group [4] and the AMDAlliance International. The AMD Alliance International concluded in 2003:
“The receipt of low vision services in the UK remains a postcode lottery.Some areas have excellent, easily accessible services and others have none atall. Much work is being done by various agencies but there is much still to bedone. With adequate funding and commitment from relevant professionals,community-based low vision services need to be established that respond tolocal need and which are easily accessed by those people needing them andnot just those who meet the criteria for registering as severely sightimpaired/blind or sight impaired/partially sighted. There also need to bemechanisms by which an individual can re-refer themselves back into thesystem as and when they feel they need to. Additionally, awareness must beraised within the community of the availability and benefits of low visionservices.” AMD Alliance International (2003) [5]
Since the problems in low vision services provision were highlighted in 1999, efforts havecontinued to improve services. With responsibility for health and social care being devolvedto national level, England, Scotland, Wales and Northern Ireland have formulated their ownproposals for improving services for people with sight loss and are at different stages ofimplementation.
In 2002, the Welsh Assembly allocated £1 million per year for the implementation of theLow Vision Scheme as part of the Wales Eye Care Initiative. Optometrists are being trainedand accredited to provide low vision services in the community at no cost to the recipient.Around 120 optometrists have been accredited since the introduction of the scheme. Thisnumber is likely to remain constant as optometrists leave the scheme due to retirement andnew optometrists join from time to time. It is hoped that waiting times for the receipt of lowvision devices will be cut from up to 18 months in hospital based low vision clinics to five

A question of independence
9
weeks under the new scheme. However, issues regarding the provision of rehabilitationservices still have to be resolved.
In Northern Ireland where low vision services used to only be available in the large hospitalsof Belfast and Londonderry, services are being established in local hospitals province-wide,making them much more accessible to people outside the major cities. Accessibility is alsobeing improved through the establishment of a wide variety of referral sources as well asoutreach activities that benefit from close cooperation between optometrists andrehabilitation specialists.
In England and Scotland there has been a number of promising policy initiatives. TheScottish Executive acknowledges the appropriateness of the multi-disciplinary, communitylevel approach advocated by the Low Vision Consensus Group. It has consulted widely onthe current difficulties with services for people with visual/sensory impairment and hasproposed the establishment of various working groups to consider how best to meet theneeds of people with a sensory impairment. An evidence-based approach is being used toidentify what changes need to be made to community care services. This work is ongoing toaddress the major problems in service provision identified by RNIB Scotland in its 2005report Buy Your Own White Cane [6].
In England the Department of Health published the First Report of the National Eye CareServices Steering Group which outlined proposals for a number of new eye care pathways inMay 2004. These included new pathways on age-related macular degeneration, glaucomaand low vision and a number of recommendations relating to service delivery, funding,regulatory issues and key outcomes. Low vision pathway pilots were set up in Gateshead,Barking and Dagenham and Havering, Sutton and Merton with Wandsworth. Later, pilotsites were extended to include Brighton, Hartlepool, Northumberland, Waltham Forest,Morecambe Bay, Hampshire (New Forest) and Mid and East Devon and South Worcester.The challenge will be to provide an evidence base of best practice examples that can thenbe used to roll out the pathways across England. It is hoped that their implementation willnot only improve referral processes but will also help service providers to achieve sustainableimprovements to the quality of their services.
Recognition of the problems faced by people with sight loss has lead to the development ofProgress in Sight [7], a set of national standards of social care for visually impaired adults.In addition, 75 Low Vision Services Committees have been established in England toimprove inter-agency working. The impact of the Progress in Sight standards and of the lowvision services committees will be discussed in the context of our survey presented below.
The efforts described above are all the more important when we look at research into theeffects of insufficient support on the quality of life for people with sight loss [8] [9].The picture is one of loneliness, social and economic deprivation and poor health amongsignificant numbers of people with sight loss. To highlight just the key findings:
A question of independence
10
n In 2003, 73 per cent of older people with sight loss surveyed by RNIB lived in poverty(which, in line with the Government’s definition of poverty equated to £195 per week).This compares with 27 per cent of all pensioners.
n Economic deprivation is equally a major factor for those of employment age due to thehigh levels of unemployment amongst people with sight loss. Three out of four blind andpartially sighted people of working age are not in paid employment with many of themliving close to the poverty line.
n Isolation due to lack of mobility is a major problem with 76 per cent of people with sightloss saying that they get out of the house never, rarely or less than before they lost theirsight.
n This inability to leave the house is not necessarily compensated by people visiting to helpsince 64 per cent of people with sight loss do not receive a daily visit from someone theytrust, and 29 per cent are visited less than once a week or even less than once a month.
n Those with poor vision or registered blind or partially sighted are three times more likelyto report their health as poor or fair than people with good vision.
n All of these problems are particularly acute in ethnic minority communities [10].
These findings suggest that more efforts are needed to improve the quality of life forpeople with sight loss. The question is: what is the most effective way to help people withsight loss overcome the challenges they face? Recognising the paucity of scientific evidenceabout the impact of low vision services on the quality of life of patients [11] [12] we havedecided to base our own study on what appears to be a general consensus amongstpractitioners in the field: low vision services are most effective if they focus on earlyintervention, particularly in terms of emotional support, and adopt a holistic approachfacilitated by multi-agency working. This consensus has informed the compilation of ourquestionnaires and the analysis of the survey results and provides the background againstwhich the findings of the low vision services survey should be read.
2.b MethodologyThe survey consisted of two questionnaires, a general questionnaire and a questionnaire forprimary care organisations.
General questionnaire
The research was conducted via a postal questionnaire, which was sent to a range ofpotential providers of low vision services. The questionnaire was sent out with a coveringletter and a return Freepost envelope. Prior to its distribution the questionnaire was sent tokey stakeholders for their comments and it was also piloted with a small sample ofrespondents before the main mailing. The pilot was carried out in November and December2004 and the main mailing was conducted from December 2004 onwards. This was followed

A question of independence
11
up by a series of reminder mailings and phone calls in 2005. Respondents were also giventhe option to complete the survey online. The majority of replies were obtained via a self-completion postal response.
Table 1: Total sample
In addition three out of five universities providing courses for optometrists responded to thesurvey. However, because of the small sample size they are not included as a separatecategory in the analysis.
For a postal questionnaire these are excellent response rates. The response rate from socialservices departments is particularly noteworthy and due in large part to the efforts of AnneBristow, Chair of the Sensory Impairment Working Group of the Association of Directors ofSocial Services (ADSS). However, we should note that the overall response rate did notreach the high level of the Culham/Ryan survey. We believe that the main reason for thiswas our decision not to use a shortened questionnaire to elicit responses over the phone.We used the phone follow-up merely to encourage recipients to return the survey.
Primary care organisations questionnaire
A separate questionnaire was mailed to 285 primary care organisations across the UK. Thedata collection procedure was the same as with the general questionnaire: the questionnairewas sent with a covering letter and a Freepost envelope to directors of commissioning andwas followed up with a second mailing and a telephone reminder. Again, respondents hadthe option of filling in the questionnaire online but this option was chosen by very few.
Unfortunately, we did not receive responses from any primary care organisations outsideEngland so that the information provided does not cover Scotland, Wales and NorthernIreland. In total, 94 Primary Care Trusts (PCTs) completed and returned the questionnaires (a response rate of 32 per cent). For a copy of both questionnaires please visit the AMDAlliance UK section of the RNIB website at www.rnib.org.uk.
Mailed Returned Response rate
Hospital 280 208 74%
Local society 188 94 50%
Opticians/optometry practice 1,667 915 55%
Social services departments 172 152 88%
Teachers 222 126 57%
Total 2,534 1,498 59%
A question of independence
12
Non-responder questionnaire
A short questionnaire with five key questions for each of the groups (general or PCT) wasused for a non-responder survey that was conducted by phone. The results established thatthere was no non-responder bias. We therefore believe our survey results to berepresentative of all respondents.
Survey results are reported at the 95 per cent confidence interval level.

A question of independence
13
3. Survey resultsThe survey was conducted with two main objectives in mind:
n To ascertain the current level of low vision services provision across the UK. The mainfocus was on the type and range of services provided.
n To assess the level of cooperation between different low vision services agencies.
In addition the survey results shed light on important areas of concern:
n waiting times and frequency of appointments
n the issue of funding
n the issue of access to services, primarily in relation to information provided to potential users
n the quality of services as perceived by service providers and PCTs.
3.a Profile of service providersOut of the 1,498 respondents the majority (873 or 58 per cent) were based inoptometry/opticians practices, 285 (19 per cent) were hospital based, 130 (9 per cent) were based at social services offices/facilities, and 113 (8 per cent) were based at resource centres. In addition, 79 respondents (5 per cent) were based in voluntary sectororganisations, 59 (4 per cent) were based at schools, 61 (4 per cent) provided domiciliarycare only, 25 (2 per cent) worked from nursing care homes and 20 (1 per cent) were basedat universities.
Table 2: Where respondent is based (base: all respondents: 1,498)
Location
Resource centre 8%
Social services office/facility 9%
Domiciliary 4%
Nursing/care home 2%
Opticians/optometry practice 58%
Hospital 19%
School 4%
University 1%
Voluntary sector 5%

A question of independence
14
For most types of agency covered by the survey, the provision of low vision services is partof their remit. 88 per cent of social services provide low vision services against 79 per centof hospitals, 75 per cent of local societies and 71 per cent of specialist teachers. The onlytype of agency that is less involved in the provision of services are optometry/opticianspractices. With just over half of these not providing a service, optometry/opticians practicesare the largest group of non-providers against 12 per cent of social services departments,one in five hospitals, one in four local societies and almost one in three specialist teachers.
3.b Types of services providedIn our survey we made a distinction between service providers who sell and/or provideoptical devices and home adaptations/daily living aids, and those who provide otherservices such as mobility training, assessment for home adaptations, emotional support andfinancial advice. The results show that – with the exception of opticians/optometrypractices – a large majority of services providers do more than just selling or providingequipment. 77 per cent of social services provide additional services, followed by 65 percent of hospitals, and 61 per cent each of local societies and specialist teachers. Alluniversities that responded (three out of five) also provide additional services. The categoryof providers least involved in low vision services other than selling or providing low visionequipment are opticians/optometry practices. Out of those providing services only a quarterprovide additional services.
Table 3: Type of service provided (base: all respondents: 1,498)
3.c Reasons for not providing servicesThe main reason why potential providers do not deliver services is that they believesomeone else is already providing an adequate service in the area. 40 per cent ofrespondents gave this reason. This essentially matches their response to the question as tohow they assess the quality of services in their area: 84 per cent believe that the quality isgood or satisfactory.
NoneSell/provide
equipment onlyother services
Hospital 21% 14% 65%
Local society 25% 14% 61%
Opticians/optometry practice 51% 24% 25%
Social services 12% 11% 77%
Universities 100%
Teachers 29% 10% 61%

A question of independence
15
Lack of funding is given as a reason for not providing services by 30 per cent ofrespondents, not sufficient need by 25 per cent, lack of trained staff by 24 per cent andlack of space by 14 per cent. However, this overall picture hides large variations amongstdifferent agencies and is biased towards the views of optometry/opticians practices becauseof this group’s large sample size.
If we compare the individual providers it becomes clear that lack of funding is much more ofan issue for optometrists than for local societies and hospitals (34 per cent, 21 per cent and18 per cent respectively named funding as a reason for not providing services). Only 19social services departments gave this reason. By contrast, lack of space is a bigger problemfor local societies since one in four gave this reason for not providing services. Lack oftrained staff is another important problem for local societies with 30 per cent naming this asa reason followed by opticians with 27 percent whereas specialist teachers, hospitals andsocial services appear to have less of a problem recruiting staff. For 17 per cent of specialistteachers, 16 per cent of hospitals and as few as six per cent of social service departmentsthis was an issue.
Table 4: Reasons for not providing a low vision service (base: all saying they do notoffer one: 589)
Most importantly, opticians/optometrists appear to be much less confident than otherpotential providers that there are other adequate services in their area. Only 36 per centgave this as a reason for not providing services against 61 per cent of hospitals, 58 per centof specialist teachers and 46 per cent of local societies that were non-providers of services.
Reason
Other adequate service in area 40%
Lack of funding 30%
Not sufficient need 25%
Lack of trained staff 24%
Lack of space 14%

A question of independence
16
3.d Multi-disciplinary and multi-professional working – the importance of an holistic approach to low visionsupport services
A multi-disciplinary or integrated approach with an emphasis on multi-professional workingis generally accepted as a key element of improving the delivery of low vision services. Forsome this simply means that the provision of low vision devices is combined with training intheir use [13]. But more often integrated, multi-disciplinary services are seen as serviceswhere ophthalmic and optical practitioners, social workers, and rehabilitation officers carryout joint assessments with patients and carers to decide on the best course of action foreach individual patient [14] [15] [16]. Cooperation with other agencies to reach and informpeople who have just been diagnosed with sight loss is an objective under standard 8 of thenational standards of social care for visually impaired adults (Progress in Sight). These alsoinclude standards on providing emotional support (standard 13), training for independence(standard 14) and the provision of equipment (standard 15) all of which are part of anholistic approach to sight loss support [17].
Since the move towards more integrated working is an ongoing topic we asked respondentsto indicate the external agencies or professionals with whom they and/or a member of theirlow vision team have links. In addition, we asked whether these links were formal orinformal.
Table 5 shows the results for all respondents that offer some kind of low vision service (even if it is only selling/providing aids and devices). Amongst these respondents, threequarters have a link of some kind with ophthalmologists and two thirds have links withoptometrists/opticians. At the other end of the spectrum, just one fifth has a link withmedical social workers, counsellors or other disability services (such as Sense, Deafblind UKand physiotherapists). Given the increasing recognition of the need for emotional support toprevent depression and maximise the likelihood of successful rehabilitation [18] [19] thelack of links with counsellors is particularly worrying.

A question of independence
17
Table 5: Links to external agencies (base: all offering some service: 905)
Overall, there are slight increases in the proportion of respondents who have contact withexternal agencies in comparison with the Ryan/Culham survey. Links with ophthalmologistsseem to have increased particularly strongly (from 58 per cent to 79 per cent).
Table 6 compares both surveys where figures for the same professional categories areavailable. Links with optometrists are not included since they are not listed separately in theRyan/Culham survey.
Table 6: Proportion of respondents who have contacts with other agencies
Service 1997/98 2004/05
Ophthalmologists 58% 79%
Local societies 52% 60%
GPs 49% 55%
Social workers 41% 48%
Rehabilitation workers 31% 43%
Specialist teachers 31% 36%
Counsellors 12% 18%
ServiceRespondents with links to
relevant external professionals
Ophthalmologists 79%
Opticians 62%
Local societies 60%
GPs 55%
Social workers 48%
Rehabilitation workers 43%
Specialist teachers 36%
LV Services Committee 27%
Employment advisors 23%
Medical social worker 19%
Counsellors 18%
Other disability service providers 18%

A question of independence
18
Similar to the data on reasons why respondents do not provide services, the average hideslarge variations among services providers. When we look at the individual providers, socialservices have the highest number of external links, with a vast majority reporting links withophthalmologists, opticians, local societies, GPs, rehabilitation workers, specialist teachersand employment advisers. The one area where social services’ inter-agency working appearsinadequate is in the important area of emotional support. Only 39 per cent of social serviceshave links with counsellors. Even if we link this with the number of social services thatprovide emotional support as part of their own services (51 per cent) there are still 37 percent that do not provide counselling services and do not have any links with counsellors. Itis likely that patients covered by these services do not receive the emotional support theyneed unless they have been signposted to counselling services by other agencies, such astheir GP. However, the picture does not look any better for hospitals, the other mainprovider of services. Out of 164 hospitals only 63 (or 29 per cent) offer counselling, and outof the 101 hospitals that do not offer counselling 84 (or 83 per cent) have no links withcounsellors. With only 41 per cent of local societies having links with counsellors it isreasonable to assume that there is a serious gap in service provision in this area, whichshould be of major concern to service providers.
The survey also indicates that it will be a challenge to increase the role played byoptometry/optician practices in the provision of multi-disciplinary services since they areleast likely to have links with other agencies and tend to focus on selling low vision devices.

A question of independence
19
3.e The role of Low Vision Services Committees (LVSCs)In the context of multi-agency working it is worth looking at the role of the Low VisionServices Committees which have been set up across England to improve low vision services,primarily as a forum to promote inter-agency working and patient involvement in theplanning of services.
If we look at Table 7 it becomes clear that the ability of LVSCs to generate links with serviceproviders varies considerably. Whereas 84 per cent of local societies and 75 per cent ofsocial services report links with their LVSC the figure is 64 per cent for hospitals, 48 per cent for specialist teachers and goes down to a mere 22 per cent for opticians. In themajority of cases these links are formal.
Table 7: Links to other agencies: (base: all offering a service: 905)
HospitalLocal
societyOpticians
SocialServices
Teachers
Base: all offering some service:
n=163 n=70 n=448 n=131 n=90
Ophthalmologists 91% 71% 73% 89% 83%
Opticians/optometrypractices
83% 70% 44% 83% 73%
Local societies 84% 61% 40% 89% 76%
GPs 55% 56% 55% 73% 34%
Social workers 61% 76% 24% 84% 66%
Rehabilitationworkers
71% 79% 15% 75% 57%
Specialist teachers 56% 44% 9% 76% 71%
LVSC(if know about localcommittee)
44%(64%)
57%(84%)
13%(22%)
44%(75%)
20%(48%)
Employment advisors 21% 51% 3% 77% 27%
Medical social worker 26% 29% 7% 47% 19%
Counsellors 29% 41% 6% 39% 9%
Other disabilityservices
16% 36% 2% 61% 27%

A question of independence
20
This variability was also flagged up in an evaluation of Low Vision Services Committeesconducted by Warwick University in 2005 [20]. Whilst 92 per cent of Low Vision ServicesCommittees report links with social services, 86 per cent work with hospital services and 70 per cent with the voluntary sector, only 51 per cent work witheducation services.
So how do these agencies perceive the impact of the establishment of a Low Vision ServicesCommittee on the provision of low vision services in their area?
Table 8 (overleaf) is based on the respondents who know they have a committee andexpressed an opinion about its impact (443 service providers and 51 PCTs). The surveyresults show a somewhat divided picture. Whereas just over half of respondents stated thatthe committee had made a positive or very positive impact, just under half of allrespondents felt that it had made no difference. However, there was quite strong variationbetween the different agencies. Social services and specialist teachers were particularly likelyto have noticed a positive impact (63 per cent and 68 per cent respectively) whereas only40 per cent of optometry/optician practices took this view against 60 per cent who felt thatthe Committee had made no difference.
Among local societies 27 (62 per cent) felt the committee had made a positive impact, 15(34 per cent) thought that it had made no difference and two local societies (4 per cent)felt that the impact had been negative.
When we asked primary care trusts the same question a similar picture emerged. Out of 51PCTs who were aware of a Low Vision Services Committee in their area 30 (or 59 per cent)felt that the committee had a positive or very positive impact on the provision of low visionservices in their area. By contrast, 16 (or 31 per cent) stated that it had made no differenceand 4 (8 per cent) did not know. None of the PCTs stated that the committee had made anegative impact.
This picture should encourage Low Vision Services Committees to continue their efforts andimprove in areas that have been identified as weaknesses by the Warwick evaluationincluding:
n promotion of communication and good practice
n service user involvement
n dealing with specialist needs
n multi-agency working
n improving services.

A question of independence
21
Table 8: Impact of Low Vision Services Committee (base: all offering other servicesand excluding no replies/no committee: 441)
3.f Information about existing servicesLinks between agencies are clearly an important aspect of the provision of services and lowvision services committees can play an important role in this area. However, any effortsmade towards a more holistic, multi-agency approach are of limited benefit if potentialclients are not aware of the existence of these services.
We asked how respondents provide information about their services to people with sightloss. The results shows that providers use a variety of channels, including PCT patientprospectuses, posters and leaflets in their own waiting rooms and advice duringconsultations. What is striking is that only a small minority of providers (18 per cent)provide information about their services through GP surgeries. This means that peoplegenerally need to be already “in the system” to find out about available services. There is alarge number of people who would benefit from help but may not yet have reached a levelof sight loss that would entitle them to being registered as blind or partially sighted. Somepeople may not have seen an eye health professional in years because they were told bytheir ophthalmologist at some point that they had, for instance, dry AMD and that nothingmore could be done for them. Providing information about available services via GPpractices would raise awareness amongst the general public and would filter down to thosein need of support.
Very positive positive No difference Negative
Hospital 20% 42% 38%
Local society 21% 41% 34% 4%
Optician/Optom 11% 29% 60%
Social services 27% 38% 35%
Teachers 32% 36% 32%
Total of the above 18% 35% 47%
PCTs 22% 43% 34%

A question of independence
22
Table 9: How respondents promote services (base: all offering other services: 615)
We would encourage service providers to use GPs as a key channel to raise awareness oftheir services. The Appendix contains a template letter that could be used for this purpose.
The most effective approach would be for a list of all available services to be provided toGPs rather than each provider approaching GPs individually. In areas with a Low VisionServices Committee, the committee could co-ordinate such an approach.
3.g Waiting timesThe Culham/Ryan survey found that 84 per cent of respondents had waiting times of lessthan two months and three per cent had waiting times over six months [15]. In our survey79 per cent had waiting times of less than two months for optical devices assessments and62 per cent for home adaptations/daily living aids. 10 per cent waited two to six months foroptical devices and 12 per cent waited the same length of time for home adaptations/dailyliving aids.
There are also interesting variations between the agencies. Hospitals and social servicesseem to struggle most. 20 per cent of hospitals and social services reported that patientswaited between two and six months to be assessed for optical devices and 2.5 per cent ofhospitals reported waiting times of six to 12 months. By contrast 65 per cent ofoptometry/opticians practices reported waiting times of less than two weeks and 24 percent said that patients waited between two weeks and two months. Local societies also dowell with one third reporting waiting times of less than two weeks and well over a halfbetween two weeks and two months (although this is based on a numerically small sample –27 respondents).
Information channel
PCT/PCO prospectus 9%
Poster/leaflet in own waiting room 24%
Poster/leaflet in GP’s practice 18%
Hospital eye clinic 50%
Advice during consultations 61%
A question of independence
23
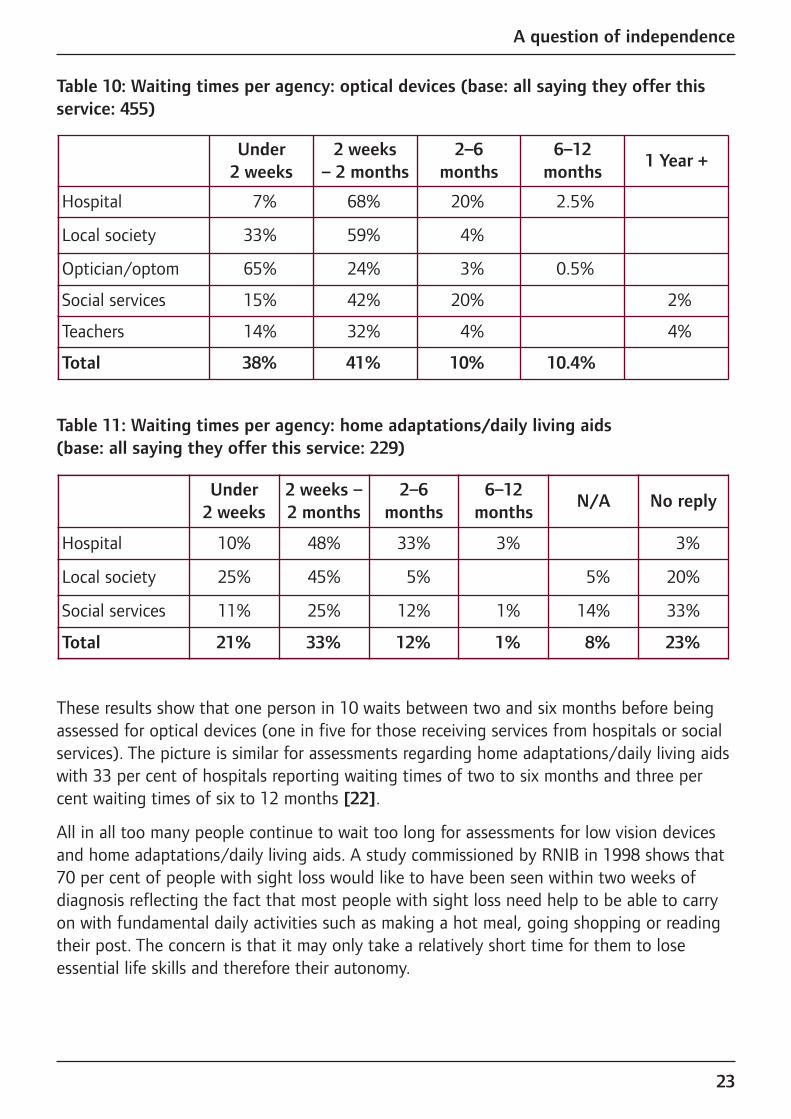
Table 10: Waiting times per agency: optical devices (base: all saying they offer thisservice: 455)
Table 11: Waiting times per agency: home adaptations/daily living aids (base: all saying they offer this service: 229)
These results show that one person in 10 waits between two and six months before beingassessed for optical devices (one in five for those receiving services from hospitals or socialservices). The picture is similar for assessments regarding home adaptations/daily living aidswith 33 per cent of hospitals reporting waiting times of two to six months and three percent waiting times of six to 12 months [22].
All in all too many people continue to wait too long for assessments for low vision devicesand home adaptations/daily living aids. A study commissioned by RNIB in 1998 shows that70 per cent of people with sight loss would like to have been seen within two weeks ofdiagnosis reflecting the fact that most people with sight loss need help to be able to carryon with fundamental daily activities such as making a hot meal, going shopping or readingtheir post. The concern is that it may only take a relatively short time for them to loseessential life skills and therefore their autonomy.
Under 2 weeks
2 weeks –2 months
2–6 months
6–12months
N/A No reply
Hospital 10% 48% 33% 3% 3%
Local society 25% 45% 5% 5% 20%
Social services 11% 25% 12% 1% 14% 33%
Total 21% 33% 12% 1% 8% 23%
Under2 weeks
2 weeks – 2 months
2–6 months
6–12months
1 Year +
Hospital 7% 68% 20% 2.5%
Local society 33% 59% 4%
Optician/optom 65% 24% 3% 0.5%
Social services 15% 42% 20% 2%
Teachers 14% 32% 4% 4%
Total 38% 41% 10% 10.4%

A question of independence
24
3.h Specialised training and frequency of appointmentsWe asked respondents whether their clients received specialised low vision training – if appropriate – in the use of their low vision devices and in the use of homeadaptations/daily living aids .
At first sight the results were positive. 84 per cent of providers of low vision devices saidthat they provided training in their use, either always or usually. The proportion for homeadaptations/daily living aids was 86 per cent.
Table 12: Training in use of optical devices and home adaptations (base: 438 providersof optical devices and 191 providers of home adaptations.)
When we look further into the number of training appointments given we can see onepossible reason why a large number of low vision devices are no longer being used within amonth or two of issue. 40 per cent of providers of low vision devices offer only one trainingappointment. Whilst 20 per cent of providers offer two or three appointments, only 27 percent offer as many appointments as needed. Encouragingly the picture is more positive inthe area of home adaptations/daily living aids. Here 47 per cent of providers offer as manytraining appointments as necessary and only 21 per cent offer one appointment only.
Table 13: Number of training appointments provided by respondents (base: all thoseoffering services and training: 390 for optical devices and 169 for homeadaptations/daily living aids)
As in other areas, there is considerable variation between the different categories ofproviders. Social services are most likely to offer as many appointments as needed (50 percent for optical devices and 59 per cent for home adaptations). Opticians are at the otherend of the spectrum. Only one in ten offer as many appointments as needed for training inoptical devices whereas well over half offer just one training appointment.
One TwoThree to five
As many as needed
No reply
Optical devices 40% 14% 3% 27% 8%
Home adaptations 21% 10% 4% 47% 11%
Always UsuallyRarely or
neverNo reply
Optical devices 62% 22% 6% 9%
Home adaptations 65% 21% 3% 9%

A question of independence
25
It may be unrealistic to expect all service providers to offer as many appointments asneeded and this may also relate to funding issues. There will always be a conflict betweenthe demands for an increased number of new assessments and lower waiting times and theneeds of people who have been assessed and still need help with the use of devices.However, it is clear that more needs to be done to come closer to this ideal, possibly bybuilding closer inter-disciplinary links.
Such links enable services to be truly centred around the needs of each service user withflexible and innovative approaches to the delivery of services to ensure best use ofresources, both financial and human. By developing relationships and sharing informationbetween service providers the needs of each individual with sight loss are met mosteffectively.
3.i FundingFor those providers who do not feel that someone else is providing an adequate service in their area, funding is the main reason why they do not offer services themselves. We looked at the way current providers are funded. The answers show a wide range offunders with hospitals and social services providing more than half of the funding. Despitethe White Paper “Our health, our care, our say” (2006) [23] calling for more services to bemoved out of hospitals into the community, we believe that large hospitals should continueto provide low vision services as this may be the most convenient location for somepatients. Most importantly, large hospitals hold highly specialised expertise needed by somepeople with sight loss. At the same time outside providers should be encouraged to improveand increase access and choice, and become the providers for the majority of people withsight loss.

A question of independence
26
Table 14: Which authority/agency is the main funder - by sample (base: all offering some services: 905)
It is interesting to see the relatively minor role played by PCTs. This may be linked the lowlevel of priority given to low vision services by PCTs. Only 11 per cent of PCTs saw lowvision services as a high priority, 43 per cent gave them medium priority whereas 46 percent of PCTs either saw low vision services as a low priority or they did not answer thequestion. PCT engagement clearly needs to increase significantly to address the growingneed for low vision services. However, despite moves to strengthen the commissioning roleof PCTs, the current outlook is rather discouraging. Only 21 per cent of PCTs asked whetherthey were planning to commission more services said yes, just over half said no and one infour did not know.
Hospitals
NHS hospital contract 67%
PCT/PCO 14%
Local authority/NHS combined 9%
Local societies
Voluntary sector 39%
Social services 20%
PCT/PCO 17%
Opticians/optoms
Private 45%
PCT/PCO 17%
NHS hospital contract 14%
Social services
Social services 57%
NHS hospital contract 23%
Teachers
Dept of education 53%
School 13%

A question of independence
27
Table 15: Intention to commission new low vision services. (base: all responents: 94)
Not surprisingly out of the 28 PCTs who said that low vision was a low priority, 19 did notplan to commission new services and four did not know whether they would commissionnew services. By contrast, seven out of 10 of the PCTs that give low vision services a highpriority also said that they would commission more services.
Partly, the lack of PCT involvement reflects the reality of low vision services being “hidden”within the overall budgets for ophthalmology contracts. Low vision services are not includedas a separate item in these contracts making it difficult for PCTs to audit the level of serviceprovided. The Government White Paper for England “Our health, our care, our say”promotes a preventative approach that allows people to stay in their own environments withthe necessary help for as long as possible. Low vision services help people with sight lossachieve this objective and PCTs should include their delivery in their strategy towardsreaching the goals set down in the White paper. Policy announcements such as the WhitePaper represent an important steer for PCTs to take low vision services seriously. In addition,an increase in funding is essential to improve low vision services across the country. The £73million allocated through Action on Cataracts (a government programme to reduce waitingtimes for cataract operations) has been used very successfully to reduce waiting times forcataract operations. According to the National Eye Care Services Steering Groupapproximately £40 million per year is required to address the problems in low vision servicesprovision in England alone and provide a comprehensive low vision service (includingassessment, examination, rehabilitation and low vision aids and assuming the need to carryout 200,000 low vision assessments per year) [24].
3.j Quality of servicesHow do service providers perceive the quality of low vision services in their area? We askedservice providers and PCTs to rate the services in their area on a scale from 1 (very good) to5 (unsatisfactory). We did not give a yardstick as to what represents a good or a poorservice and did not define the area in question. Our main purpose was to get a broadpicture of the quality of service provision through the eyes of service providers.
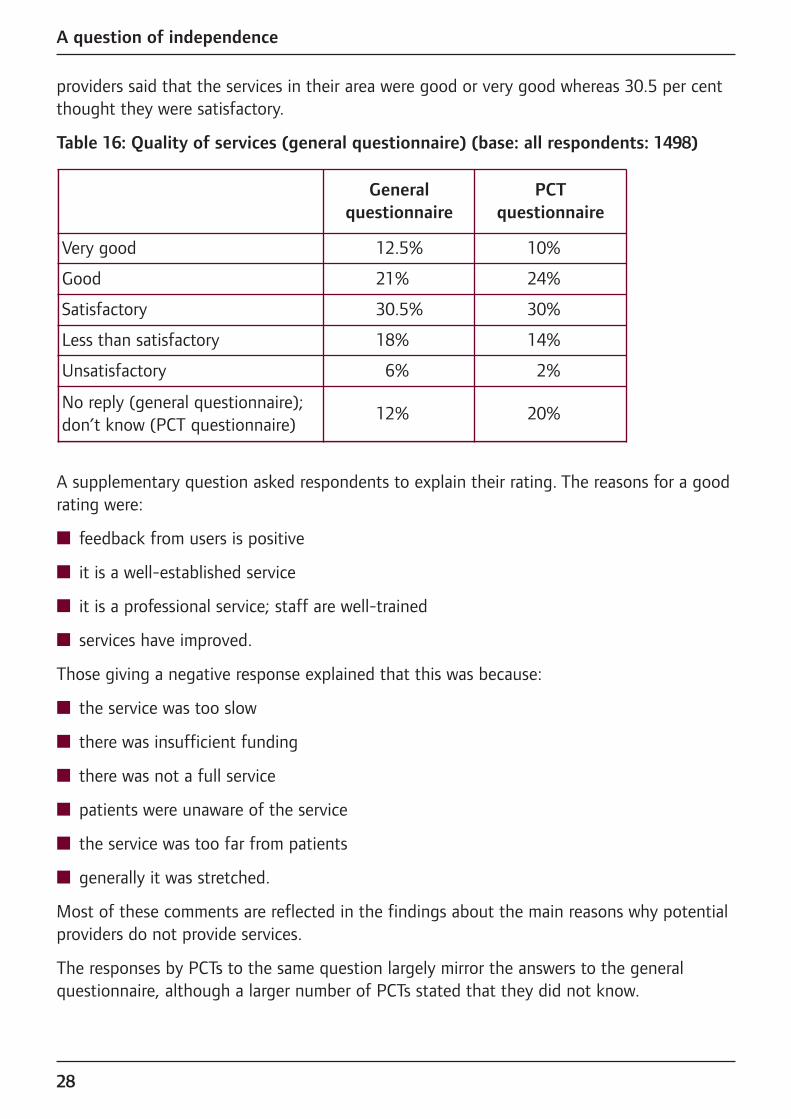
Table 16 is based only on respondents who answered the question (88% of the serviceproviders, and all PCTs). The responses provide a mixed picture, but the balance of opinionwas positive rather than negative. Overall, one service provider in four feels that services intheir area are less than satisfactory or unsatisfactory. By contrast 33.5 per cent of services
Yes 21%
No 51%
Don’t know 25%
A question of independence
28
providers said that the services in their area were good or very good whereas 30.5 per centthought they were satisfactory.
Table 16: Quality of services (general questionnaire) (base: all respondents: 1498)
A supplementary question asked respondents to explain their rating. The reasons for a goodrating were:
n feedback from users is positive
n it is a well-established service
n it is a professional service; staff are well-trained
n services have improved.
Those giving a negative response explained that this was because:
n the service was too slow
n there was insufficient funding
n there was not a full service
n patients were unaware of the service
n the service was too far from patients
n generally it was stretched.
Most of these comments are reflected in the findings about the main reasons why potentialproviders do not provide services.
The responses by PCTs to the same question largely mirror the answers to the generalquestionnaire, although a larger number of PCTs stated that they did not know.
Generalquestionnaire
PCT questionnaire
Very good 12.5% 10%
Good 21% 24%
Satisfactory 30.5% 30%
Less than satisfactory 18% 14%
Unsatisfactory 6% 2%
No reply (general questionnaire);don’t know (PCT questionnaire)
12% 20%

A question of independence
29
The responses to the question on quality are inevitably influenced by the way providers see the quality of their own services and, for PCTs (20 per cent compared to 12 per cent ofservice providers), whether they are involved in commissioning services and what level ofpriority they give to these. Proper audits, involving providers, funders and service users andusing a fixed set of criteria would be required to obtain a more objective picture. This would reveal why services are unsatisfactory, for example. whether there is an issue of sub-standard quality because of lack of cooperation between agencies, lack of staff,underestimated need, or whether it is merely a funding problem, in that service providersare competent but need more funding to improve their reach. Modernisation techniques andprocedures should then be applied to bring the services to a good standard.
At present auditing is a weakness in the system as illustrated by the answers provided to aquestion as to what funders expect in terms of accountability. It is surprising, to say theleast, that 40 per cent of respondents stated that their funders expect nothing from them interms of accountability. Only 16 per cent require yearly audits, 14 per cent ask for accountsand 11 per cent measure accountability in a variety of different ways (ranging from sixmonthly monitoring to quarterly returns and monthly statistics).

A question of independence
30
4. Conclusions and calls for actionThe low vision services survey flags up a number of issues that should inform thediscussions about the implementation of new pathways for low vision service provision aswell as efforts across the countries to improve access to and the quality of services. Multi-disciplinary working, advertising of existing services, waiting times and frequency ofappointments, training in the use of low vision devices and home adaptations/daily livingaids, funding and quality of services all remain areas of concern.
Positive action needs to be taken to ensure the successful implementation of new low visionpathway in England and of new schemes for the provision of low vision services in Scotland,Northern Ireland and Wales if they are to lead to the necessary improvements. This includesthe training of professional staff to work in the services based on a multi-disciplinaryapproach.
Above all, the survey results suggest that the following actions are essential to ensure thatthe health and social care systems in the UK can cope with the sight loss challenges theyare facing:
Action 1: FundingFor those service providers who do not think that low vision services in their area areadequately provided by other agencies, lack of funding is the main reason why they do notprovide services themselves. As a key commissioner of community services PCTs need totake a stronger interest in low vision support services to identify areas of under-funding andlook at innovative and effective ways of commissioning these, particularly in a communitysetting.
n We call on central and devolved governments to increase the funding for low visionservices and for PCTs and social services to carry out audits of low vision andrehabilitation services in their area, identify funding gaps and commission services with amulti-disciplinary, holistic approach.
Action 2: Multi-disciplinary and multi-professional workingThe importance of an integrated approach to low vision rehabilitation is widely recognised.Such an approach allows patients to benefit from the expertise of ophthalmic professionals,social workers and rehabilitation specialists to ensure that they receive the best helpavailable. The survey shows that many of the respondents have relationships with otheragencies. However, the number of links varies considerably and the results indicate that aparticular area of concern is that of emotional support. With less than 20 per cent ofrespondents reporting links with counsellors and only 28 per cent of providers stating thatthey provide counselling services it is fair to assume a serious gap in service provision in this area.

A question of independence
31
n We call on commissioners to ensure that the services they commission cover the aspectof emotional support. Where service level agreements do not include an obligation toprovide such support, commissioners need to check that formal links with other agenciesare in place to ensure adequate provision.
Action 3: Information about existing servicesIt is a considerable weakness of low vision services provision that people generally need tobe “in the system” to gain knowledge of available services.
n We call on service providers to use the template letter in the Appendix to contact GPsabout providing information to patients regarding low vision services in their area.
Action 4: Quality of servicesWhilst it is encouraging to see that one third of respondents to the survey feel that theservices in their area are good or very good this leaves two thirds of providers judging theservices in their area as merely satisfactory, less than satisfactory or even unsatisfactory.
n We call on central and devolved governments to require service providers to audit theirservices on a regular basis involving users, voluntary organisations, low vision servicescommittees and local optical committees to cover all angles of service provision. Theseaudits should use established benchmarks such as Progress in Sight. Whateverbenchmarks are used – it is essential that governments accept responsibility for enforcing their implementation.
These are essential steps to provide all people with sight loss with adequate, high qualityservices as and when they need them. However, at present there is no clear mechanism inplace to ensure that this objective is achieved across the country. The devolved nature ofhealth and social care and the multitude of agencies providing services is both an essentialelement of and an impediment to progress. Devolved services ensure that local structuresand needs are taken into account, yet the reliance on local decision-taking has created asystem that lacks accountability and perpetuates the post-code lottery in the provision ofservices.
n We call on the Government to appoint a Chief Vision Officer to provide clear benchmarksfor the quality of eye care services to be achieved across the country, monitor theimplementation of forthcoming recommendations on low vision pathways and serve as afocus point for stakeholder discussions about the future of low vision services.
Given the projected increase in the number of people with sight loss due to the ageing ofthe population such an appointment would give a clear signal that the Government is takingseriously the sight loss challenge that is facing our health and social care systems in thecoming years.
A question of independence
32
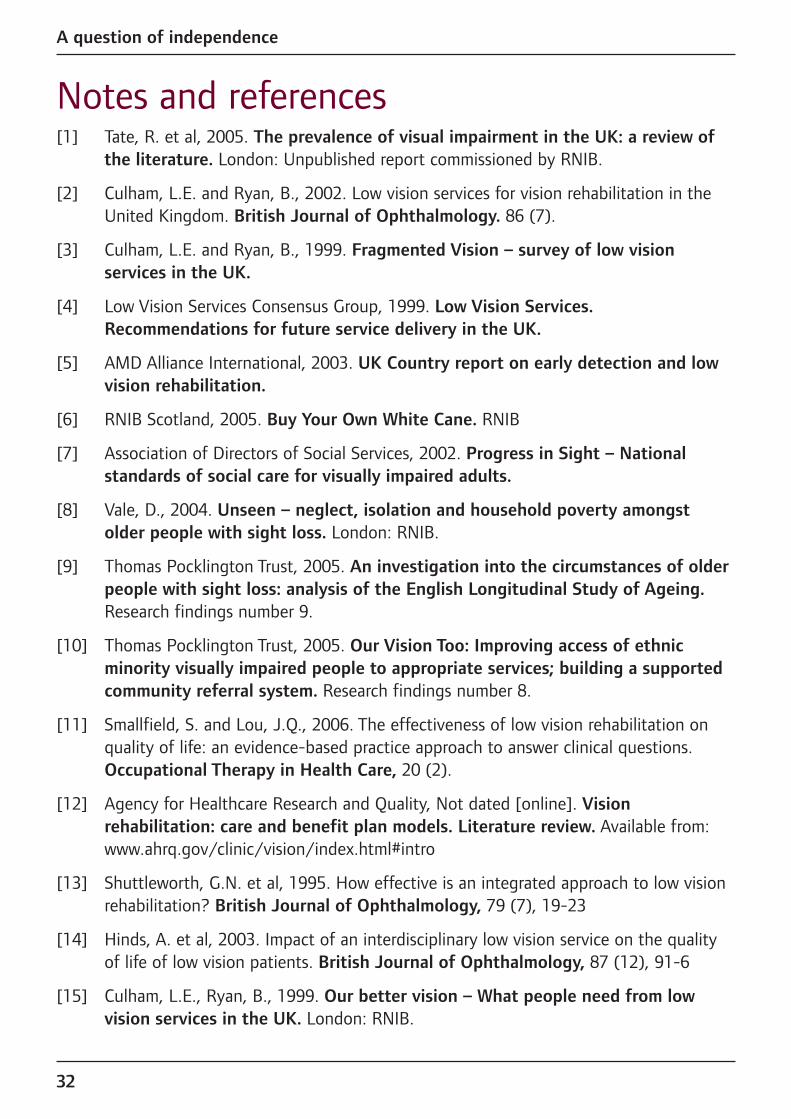
Notes and references[1] Tate, R. et al, 2005. The prevalence of visual impairment in the UK: a review of
the literature. London: Unpublished report commissioned by RNIB.
[2] Culham, L.E. and Ryan, B., 2002. Low vision services for vision rehabilitation in theUnited Kingdom. British Journal of Ophthalmology. 86 (7).
[3] Culham, L.E. and Ryan, B., 1999. Fragmented Vision – survey of low visionservices in the UK.
[4] Low Vision Services Consensus Group, 1999. Low Vision Services.Recommendations for future service delivery in the UK.
[5] AMD Alliance International, 2003. UK Country report on early detection and lowvision rehabilitation.
[6] RNIB Scotland, 2005. Buy Your Own White Cane. RNIB
[7] Association of Directors of Social Services, 2002. Progress in Sight – Nationalstandards of social care for visually impaired adults.
[8] Vale, D., 2004. Unseen – neglect, isolation and household poverty amongstolder people with sight loss. London: RNIB.
[9] Thomas Pocklington Trust, 2005. An investigation into the circumstances of olderpeople with sight loss: analysis of the English Longitudinal Study of Ageing.Research findings number 9.
[10] Thomas Pocklington Trust, 2005. Our Vision Too: Improving access of ethnicminority visually impaired people to appropriate services; building a supportedcommunity referral system. Research findings number 8.
[11] Smallfield, S. and Lou, J.Q., 2006. The effectiveness of low vision rehabilitation onquality of life: an evidence-based practice approach to answer clinical questions.Occupational Therapy in Health Care, 20 (2).
[12] Agency for Healthcare Research and Quality, Not dated [online]. Visionrehabilitation: care and benefit plan models. Literature review. Available from:www.ahrq.gov/clinic/vision/index.html#intro
[13] Shuttleworth, G.N. et al, 1995. How effective is an integrated approach to low visionrehabilitation? British Journal of Ophthalmology, 79 (7), 19-23
[14] Hinds, A. et al, 2003. Impact of an interdisciplinary low vision service on the qualityof life of low vision patients. British Journal of Ophthalmology, 87 (12), 91-6
[15] Culham, L.E., Ryan, B., 1999. Our better vision – What people need from lowvision services in the UK. London: RNIB.
A question of independence
33
[16] Rughani, S., 2005. Uniting vision – advances in low vision care. New Beacon, 89.Number 1040
[17] The Association of Directors of Social Services, 2002. Progress in sight: nationalstandards of social care for visually impaired adults.
[18] AMD Alliance International, not dated. Vision loss and depression – literaturereview [online]. Available from:http://www.amdalliance.org/information/depression/literaturereview.php
[19] Horowitz, A., Reinhardt, J. P., and Boerner, K., 2005. The effect of rehabilitation ondepression among disabled elders. Aging and Mental Health, 9 (6), 563-570
[20] Gibson, A., Hundt, G. and Stuttaford, M., not dated. Low Vision Project NationalEvaluation Report. The University of Warwick.
[22] Please note that we have included “no reply” responses in the table on waiting timesfor home adaptations/daily living aids because of the high number of teachers, localsocieties and social services who did not reply to this question (70 per cent, 20 percent and 33 per cent respectively). Also, because of the small numerical sample wehave excluded universities and teachers (1 and 10 responses respectively) from thechart on home adaptations and daily living aids. The number of “no reply” responsesfor the question on low vision devices was 13.3 per cent for social services and 39.3per cent for specialist teachers.
[23] Department of Health, 2006. Our health, our care, our say: a new direction forcommunity services. Department of Health, White Paper
[24] NHS Modernisation Agency, 2004. National Eye Care Services Steering Group.First report. NHS

A question of independence
34
Appendix
Template letter to GP practices to encourage the disseminationof information about available sight loss support services
Ideally, this letter should be sent to GPs with a list of all major service providers toensure that the information provided is not seen as indirect advertising of individualservices. In areas with Low Vision Services Committees, these could aim to co-ordinate efforts to send this letter to GPs.
Dear [GP],
Two million people in the UK live with a level of sight loss that makes it difficult for them toundertake everyday tasks such as reading bills, letters or newspapers, driving or cooking. Asa result of an ageing population, the number of people with sight loss is set to grow.
Recent government announcements place a great deal of emphasis on the importance ofearly intervention and prevention in health and care policies. Low vision services can offeradvice and information on the type of help and support available to aid safe andindependent living for people with sight loss.
If one of your patients has problems with their sight that cannot be remedied throughmedical intervention, a low vision assessment will determine what help they need to makeuse of their remaining vision to live independently and safely. Many people with sight lossare at an increased risk from falls and they are more likely than people with normal vision torequire medical attention as a result. Low vision services include advice to help prevent fallsfrom happening.
In addition, some low vision services can also provide much needed emotional support tohelp someone through the often difficult period of adjusting to sight loss, and the effectsthis will inevitably have on their life and that of their family.
Please find attached a list of low vision services available in your area. We would like you tomake this list available in your waiting room and to refer patients with sight problems tothese services even if their level of sight loss has not reached the threshold for beingregistered partially sighted or blind.
For further information please contact: [insert list of major service providers]
A question of independence
35
Acknowledgements We would like to thank all respondents for taking the time to provide information on thedifferent areas covered by the survey. Without their co-operation we would not have beenable to paint an accurate picture of the current provision of low vision services in the UK.
In addition, we would like to thank Suzanne O’Neill from RNIB for managing the mailing of the questionnaires and the necessary follow-up, Liz Batten from Crossbow Research forher advice on the survey methodology and for analysing the data as well as Mary Bairstowand Mike Brace (Vision 2020), Tom Bremridge (Macular Disease Society), Vanda Brown (Age Concern England), Nigel Charles, Bruce Evans (City University), Andy Fisher and Marek Karas (RNIB), Carl Freeman (Guide Dogs for the Blind), Janet Marsden (ManchesterMetropolitan University), Barbara Ryan (Cardiff University) and James Wolffsohn (Aston University) for their input on methodology and the drafting of the questionnaires.
Barbara McLaughlan, Anita Lightstone, Steve Winyard
UK members of the AMD Alliance InternationalThe AMD Alliance UK is an informal alliance of the UK members of the AMD AllianceInternational, a global organisation that aims to raise awareness of AMD, as well asimproving prevention, early detection and access to treatment, rehabilitation and low visionservices. For more information please visit www.amdalliance.org.
Age Concern England1268 London RoadLondon SW16 4ERTelephone: 020 8765 7701www.ageconcern.org.uk
Fight for Sight1st Floor, 36 – 38 Botolph LaneLondon EC3R 8DETelephone: 020 7929 7755www.fightforsight.org.uk
Macular Disease SocietyPO Box 1870, AndoverHampshire SP10 9ADHelpline: 0845 241 2041Telephone: 01264 350 551www.maculardisease.org
Royal National Institute of the Blind(RNIB)105 Judd StreetLondon WC1H 9NETelephone: 0207 391 2082Helpline: 0845 766 9999 www.rnib.org.uk
Wales Council for the Blind3rd Floor, Shand House 20 Newport RoadCardiff CF24 ODBTelephone: 029 2047 3954www.wcb-ccd.org.uk
© RNIB November 2006Registered charity number 226227
“Sight is the sense we most fear losing. Imagine a
diagnosis of irretrievable sight loss combined with the
realisation that you have to be lucky to get the whole
range of services that might make the difference between
independent living on the one hand and depression
and dependency on the other. Urgent action is needed
to ensure that people with sight loss are given all the
support they need as and when they need it.”Steve Winyard, Head of Policy and Campaigning RNIB
and Chair of the AMD Alliance UK
This report is available in large print, braille and audio. To request yourcopy please contact Barbara McLaughlan, RNIB on +44 (0)20 7391 2302 or email [email protected]