A Quantitative Study Exploring the Difference between ...
23
University of Central Florida University of Central Florida STARS STARS Rosen Faculty Scholarship and Creative Works Rosen College of Hospitality Management 4-1-2013 A Quantitative Study Exploring the Difference between Gaming A Quantitative Study Exploring the Difference between Gaming Genre Preferences Genre Preferences Anil Bilgihan Cihan Cobanoglu Khaldoon Nusair University of Central Florida, [email protected] Fevzi Okumus University of Central Florida, [email protected] Milos Bujisic Part of the Hospitality Administration and Management Commons, and the Tourism and Travel Commons Find similar works at: https://stars.library.ucf.edu/rosenscholar University of Central Florida Libraries http://library.ucf.edu This Paper is brought to you for free and open access by the Rosen College of Hospitality Management at STARS. It has been accepted for inclusion in Rosen Faculty Scholarship and Creative Works by an authorized administrator of STARS. For more information, please contact [email protected]. Original Citation Original Citation Bilgihan, A., Cobanoglu, C., Nusair, K., Okumus, F. & Bujisic, M. (2013). A Quantitative Study Exploring the Difference between Gaming Genre Preferences. Computer Games Journal, 2 (1), 19-40.
Transcript of A Quantitative Study Exploring the Difference between ...
University of Central Florida University of Central Florida
STARS STARS
Rosen Faculty Scholarship and Creative Works Rosen College of Hospitality Management
4-1-2013
A Quantitative Study Exploring the Difference between Gaming A Quantitative Study Exploring the Difference between Gaming
Genre Preferences Genre Preferences
Anil Bilgihan
Cihan Cobanoglu
Khaldoon Nusair University of Central Florida, [email protected]
Fevzi Okumus University of Central Florida, [email protected]
Milos Bujisic
Part of the Hospitality Administration and Management Commons, and the Tourism and Travel
Commons
Find similar works at: https://stars.library.ucf.edu/rosenscholar
University of Central Florida Libraries http://library.ucf.edu
This Paper is brought to you for free and open access by the Rosen College of Hospitality Management at STARS. It
has been accepted for inclusion in Rosen Faculty Scholarship and Creative Works by an authorized administrator of
STARS. For more information, please contact [email protected].
Original Citation Original Citation Bilgihan, A., Cobanoglu, C., Nusair, K., Okumus, F. & Bujisic, M. (2013). A Quantitative Study Exploring the Difference between Gaming Genre Preferences. Computer Games Journal, 2 (1), 19-40.
The Computer Games Journal 2(1) Candlemas 2013
Copyright of the author ©2013 Reproduction rights owned by The Computer Games Journal Ltd ©2013-14 www.computergamesjournal.com
19
A quantitative study exploring the difference between gaming genre preferences
Anil Bilgihan1, Cihan Cobanoglu2, Khaldoon Nusair3, Fevzi Okumus4, Milos Bujisic5
1 The Ohio State University, USA (email: [email protected])
2 University of South Florida, Florida, USA (email: [email protected])
3 University of Central Florida, USA (email: [email protected])
4 University of Central Florida, USA (email: [email protected])
5 University of Central Florida, USA (email: [email protected])
Abstract Although gaming technologies have been in use for more than thirty years, there is a lack of academic research in this area. Specifically, the purpose of this study is to identify the difference between age and gender in gaming genre preferences. A cross sectional online survey was administered with a sample size of 408. It was found that there is a statistical difference between age groups and their gaming preferences with the older generation focusing more on strategic gaming offerings while the younger generation tended to side more with action games. The findings of this study provide insights for game developers. Key words: age differences; gender differences; video game; video game genre; leisure activities Article Information Received: September 2012 Accepted: November 2012 Available: online April 2013
Copyright of the authors ©2013 • Reproduction rights owned by The Computer Games Journal Ltd ©2013-14
1: Introduction Video games have been in use for over thirty years. The tennis game Pong first made its way onto TV sets in the mid-1970s, and since then the fad for video games has turned into an industry worth almost ten billion dollars (in US$). Early video gaming machines had a limited number of games and thus were replaced by more versatile and computationally powerful machines. Some examples of such machines include the Nintendo NES (1986), Nintendo Gameboy (1989), and Sega Genesis (1989), as well as PlayStation (1995) and the Nintendo 64 (1996). More recent additions to the spectrum of available game consoles have included the PlayStation 2 (2000), X-Box (2001), X-Box 360 (2005), PlayStation 3 (2006), and most recently the Nintendo Wii (2006), and the X-Box 360 Kinect (2010). 1,2 The most recent generation of game systems (X-Box 360, PS3, and Wii) has enhanced interactivity and realism to previously unachieved heights, using processing speeds, graphics, sound, and interface devices far more sophisticated than earlier game systems. Further, unlike earlier generations of game consoles, more recent platforms have tremendously increased the libraries of games. For example, Sony claimed that more than 1,500 games have been created for the PlayStation since the first release of the original platform in September 1995; and the Imagine Games Network has reviewed over 30,000 games between 1996 and 2005 alone. Recently, a wide variety of

The Computer Games Journal 2(1) Candlemas 2013
Copyright of the author ©2013 Reproduction rights owned by The Computer Games Journal Ltd ©2013-14 www.computergamesjournal.com
20
game genres have been developed. For example, Doom, a first-person shooter game, has been used to train military personnel to kill. Table 1 identifies and describes the game genres, and gives some example games in each category. 3-5 The Entertainment Software Association, a professional organization for the U.S. video game industry, recently reported that 67% of Americans now play video games and that the average age of the American game player is 34 years. Similar numbers of players exist in Europe and gaming is even more popular in Asian countries (e.g. Japan and Korea). 41% of Americans have either purchased or planned to purchase one or more games in 2010. Accordingly, both the number of gaming technologies and the number of people playing video games increased significantly over the last thirty years. However the academic research that examines them is less well developed. Furthermore, it is important to note that the video game industry is growing as IT develops and interest in video games is rising. Consequently, the economic contribution of the video game industry in US is large. 1,2,6,7
Table 1: Video Game Genres and Descriptions 8
Genre
Description
Examples
Strategy
Games that use strategic planning skills
Command & Conquer, Civilization, Age of Empires
Puzzle Games that can be solved, no element of chance
Tetris, Free Cell
Fantasy/role playing Games that let you assume a character role
Final Fantasy, Legend of Zelda
Action/adventure Games where you go on an adventure
Resident Evil, Tomb Raider, Assassins’ Creed
Sports Games based on athletic teams and events
NBA Live, FIFA, Pro Evaluation Soccer
Simulation Games where you create a simulation
SimCity, Sims
Racing/speed Games that focus on going fast Need for Speed, Grand Turismo, Forza, Mario Kart
Shooter Games where you shoot other characters
Call of Duty, BioShock
Fighter Games that focus on martial arts or hand to hand combat
Street fighter, Mortal Combat
Arcade Games based on original arcade games
Pac Man, Pinball
Card/dice Games that have an element of chance
Solitaire
Quiz/trivia Games that test your knowledge Who wants to be a millionaire Classic board games Video game versions of old-time
favourites
Monopoly
The demographic profile for video gaming is diverse and transcends the teenage male stereotype as increasing numbers of women are entering the video game market. This paper is a response to De Schutter’s (2011) call for more quantitative research solving sampling issues in regards to gaming genre studies. Therefore, the purpose of this study is to explore video game preference among different age groups and gender types. Consistent with this purpose, the research question is: are there any significant differences in a respondent’s choice of gaming genre according to age and gender? If so, what are the differences in terms of age and gender preferences?” 7,9

The Computer Games Journal 2(1) Candlemas 2013
Copyright of the author ©2013 Reproduction rights owned by The Computer Games Journal Ltd ©2013-14 www.computergamesjournal.com
21
2: Literature Review 2.1: Gender Differences Several previous studies have addressed the issue of difference between genders in terms of selection of video games. Sherry and Lucas (2003) found that college males spent more time playing video games than females. As Wilder, Mackie, and Cooper (1985) revealed, at a young age children attribute certain video games as more appropriate for boys than for girls. Livingstone (2002), in a survey of British teenagers, found that about three-quarters of the male respondents had a game system at home, compared to about half the females, indicating that game play may be more popular among males across several age levels. 10-18 As such we hypothesize that:
- Hypothesis 1 (H1): Males will spend more time playing video games than females; - Hypothesis 2 (H2): Males will be multi-console users whereas females will be single console
users. Funk and Buchman (1996) noted that “the origin of gender differences in game-playing habits has not yet been established (p. 27).” Lucas and Sherry (2004) found that most video games paralleled the types of games that boys typically play and highlighted game contexts that appealed more to boys because of the rules and structure of those games. Therefore we hypothesize that: 8,19
- Hypothesis 3 (H3): Video game genre preferences will differ between males and females. 2.2: Age Differences Gender differences have received significant academic attention in gaming research. However, very few studies have addressed whether individuals of different ages demonstrate differences in time spent playing video games. Given well-documented developmental differences across different-age ranges, it seems critical to explore age differences to best inform game producers and designers.
- Hypothesis 4 (H4): Video game playing time will differ among age groups, with younger individuals giving more time to video games than older individuals;
- Hypothesis 5 (H5): Video game genre preferences will differ by age. Finally since female and males developmental stages differ throughout the aging process (Geary, 1998; Hayward, 2003), it is beneficial to explore the interaction between age and gender on playing time and genre preference. As a result, we hypothesize that: 20,21
- Hypothesis 6 (H6): There will be an interaction effect of gender and age on video game playing time and genre preference.
3: Methodology 3.1: Questionnaire A self-administered questionnaire was created based on the information obtained from the literature review. Furthermore, a pilot study of the questionnaire was conducted among gamers to test the

The Computer Games Journal 2(1) Candlemas 2013
Copyright of the author ©2013 Reproduction rights owned by The Computer Games Journal Ltd ©2013-14 www.computergamesjournal.com
22
efficacy and clarity of the questionnaire. Revisions of the questionnaire were made based on the recommendations of the respondents in the pilot study:
- The first section consisted of questions related to technology usage at home and business. - The second section listed attributes related to video games such as behaviors toward gaming,
preference of different game genres, average time spent for video games, and gaming consoles
- The third and final section of the survey consisted of demographic questions of gender, marital status, age, educational background, and job title. This study employed online survey methodology. The variables that were used in this study were gender, age, number of gaming consoles, game genre preferences as measured by strategy, racing, role playing, action/adventure, shooter, fighting, puzzles/cards, and sports video games. For hypotheses H1 & H2 the dependent variable was frequency of play and number of consoles respectfully while the independent variable was gender. For hypotheses H3-H6, the dependent variables were genre preferences as measured by questions such as, “How often do you play strategy video games (1=never, 7=daily).” The independent variables for these hypotheses were age and gender.
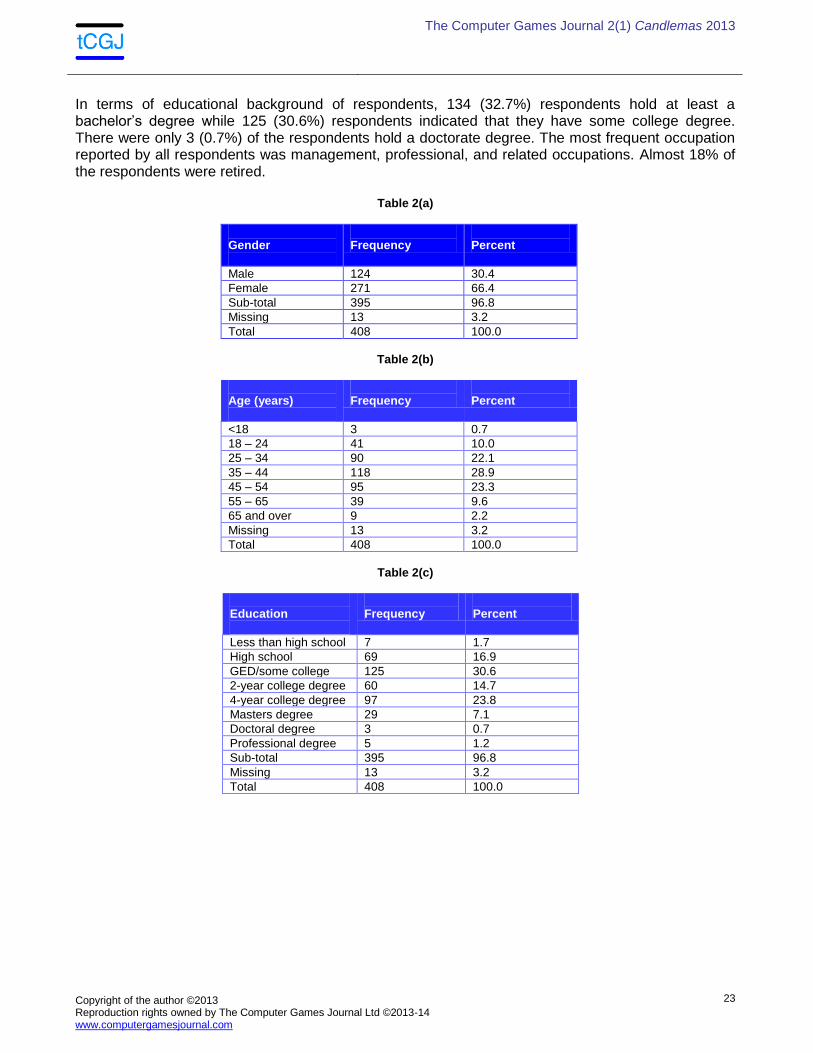
3.2: Sampling Plan The target population consisted of US residents. An important and complex issue in sampling is to determine the appropriate sample size to be used. This determination largely depends on the statistical estimating precision needed by the researcher and the number of variables. Although larger sample sizes are preferred, a number of respondents of between 300 and 500 is usually recommended and accepted as the critical sample size for multivariate analysis (Pedhazur, 1997). The sample of 2500 Americans was drawn randomly from a national database by rent-a-list.com company. 22 3.3: Data Analysis Data was coded and analyzed using the Statistical Packages for Social Sciences 18. The first part of the data analysis involved a demographic profile of respondents. Demographic data obtained from the questionnaires was tabulated using frequency tables, means, and percentages. Data analysis was conducted from 408 completed surveys. There were 655 surveys that were initiated but which were not completed. Lastly, net response rate was 16.3%. 23 3.4: Demographic Information of Sample The demographic characteristics of the research sample are described in Table 2 (which is divided into sub-tables 2a to 2e). About 30 percent of the respondents were male while 66.4% were female respondents. The remaining did not specify their gender. The majority of the male respondents were married with children (40.0%) while only 21.3 percent of the female were single. Almost 30 percent of the respondents were between 35 and 44 years old. More than 20 percent of respondents were between 45 and 54 years old. There were few respondents younger than 25 (10.7%) or older than 65 (2.2%).
The Computer Games Journal 2(1) Candlemas 2013
Copyright of the author ©2013 Reproduction rights owned by The Computer Games Journal Ltd ©2013-14 www.computergamesjournal.com
23
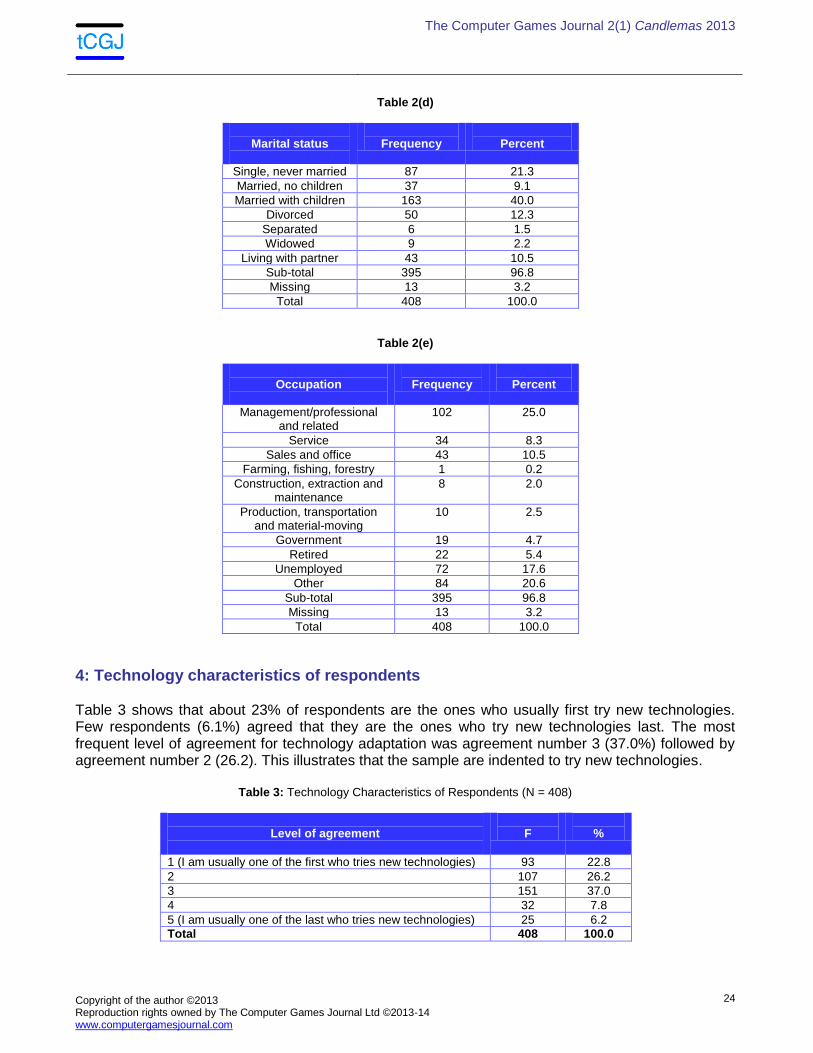
In terms of educational background of respondents, 134 (32.7%) respondents hold at least a bachelor’s degree while 125 (30.6%) respondents indicated that they have some college degree. There were only 3 (0.7%) of the respondents hold a doctorate degree. The most frequent occupation reported by all respondents was management, professional, and related occupations. Almost 18% of the respondents were retired.
Table 2(a)
Gender
Frequency
Percent
Male 124 30.4
Female 271 66.4
Sub-total 395 96.8
Missing 13 3.2
Total 408 100.0
Table 2(b)
Age (years)
Frequency
Percent
<18 3 0.7
18 – 24 41 10.0
25 – 34 90 22.1
35 – 44 118 28.9
45 – 54 95 23.3
55 – 65 39 9.6
65 and over 9 2.2
Missing 13 3.2
Total 408 100.0
Table 2(c)
Education
Frequency
Percent
Less than high school 7 1.7
High school 69 16.9
GED/some college 125 30.6
2-year college degree 60 14.7
4-year college degree 97 23.8
Masters degree 29 7.1
Doctoral degree 3 0.7
Professional degree 5 1.2
Sub-total 395 96.8
Missing 13 3.2
Total 408 100.0
The Computer Games Journal 2(1) Candlemas 2013
Copyright of the author ©2013 Reproduction rights owned by The Computer Games Journal Ltd ©2013-14 www.computergamesjournal.com
24
Table 2(d)
Marital status
Frequency
Percent
Single, never married 87 21.3
Married, no children 37 9.1
Married with children 163 40.0
Divorced 50 12.3
Separated 6 1.5
Widowed 9 2.2
Living with partner 43 10.5
Sub-total 395 96.8
Missing 13 3.2
Total 408 100.0
Table 2(e)
Occupation
Frequency
Percent
Management/professional and related
102 25.0
Service 34 8.3
Sales and office 43 10.5
Farming, fishing, forestry 1 0.2
Construction, extraction and maintenance
8 2.0
Production, transportation and material-moving
10 2.5
Government 19 4.7
Retired 22 5.4
Unemployed 72 17.6
Other 84 20.6
Sub-total 395 96.8
Missing 13 3.2
Total 408 100.0
4: Technology characteristics of respondents
Table 3 shows that about 23% of respondents are the ones who usually first try new technologies. Few respondents (6.1%) agreed that they are the ones who try new technologies last. The most frequent level of agreement for technology adaptation was agreement number 3 (37.0%) followed by agreement number 2 (26.2). This illustrates that the sample are indented to try new technologies.
Table 3: Technology Characteristics of Respondents (N = 408)
Level of agreement
F
%
1 (I am usually one of the first who tries new technologies) 93 22.8
2 107 26.2
3 151 37.0
4 32 7.8
5 (I am usually one of the last who tries new technologies) 25 6.2
Total 408 100.0
The Computer Games Journal 2(1) Candlemas 2013
Copyright of the author ©2013 Reproduction rights owned by The Computer Games Journal Ltd ©2013-14 www.computergamesjournal.com
25
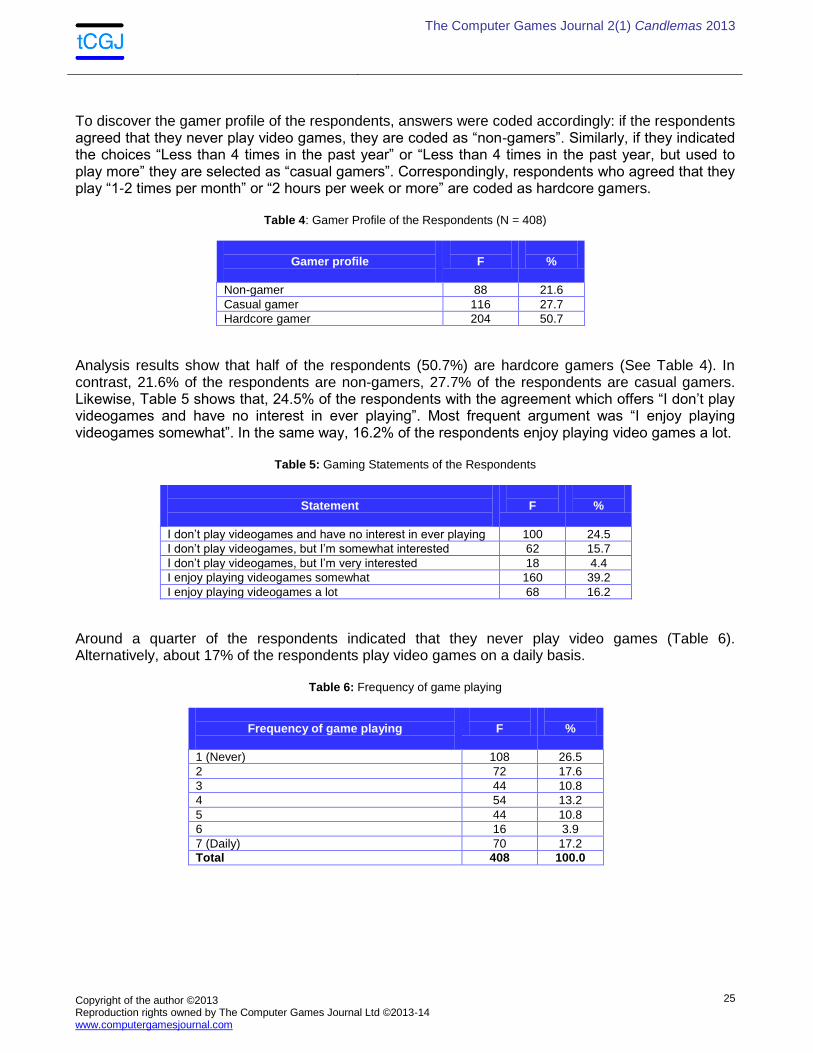
To discover the gamer profile of the respondents, answers were coded accordingly: if the respondents agreed that they never play video games, they are coded as “non-gamers”. Similarly, if they indicated the choices “Less than 4 times in the past year” or “Less than 4 times in the past year, but used to play more” they are selected as “casual gamers”. Correspondingly, respondents who agreed that they play “1-2 times per month” or “2 hours per week or more” are coded as hardcore gamers.
Table 4: Gamer Profile of the Respondents (N = 408)
Gamer profile
F
%
Non-gamer 88 21.6
Casual gamer 116 27.7
Hardcore gamer 204 50.7
Analysis results show that half of the respondents (50.7%) are hardcore gamers (See Table 4). In contrast, 21.6% of the respondents are non-gamers, 27.7% of the respondents are casual gamers. Likewise, Table 5 shows that, 24.5% of the respondents with the agreement which offers “I don’t play videogames and have no interest in ever playing”. Most frequent argument was “I enjoy playing videogames somewhat”. In the same way, 16.2% of the respondents enjoy playing video games a lot.
Table 5: Gaming Statements of the Respondents
Statement
F
%
I don’t play videogames and have no interest in ever playing 100 24.5
I don’t play videogames, but I’m somewhat interested 62 15.7
I don’t play videogames, but I’m very interested 18 4.4
I enjoy playing videogames somewhat 160 39.2
I enjoy playing videogames a lot 68 16.2
Around a quarter of the respondents indicated that they never play video games (Table 6). Alternatively, about 17% of the respondents play video games on a daily basis.
Table 6: Frequency of game playing
Frequency of game playing
F
%
1 (Never) 108 26.5
2 72 17.6
3 44 10.8
4 54 13.2
5 44 10.8
6 16 3.9
7 (Daily) 70 17.2
Total 408 100.0

The Computer Games Journal 2(1) Candlemas 2013
Copyright of the author ©2013 Reproduction rights owned by The Computer Games Journal Ltd ©2013-14 www.computergamesjournal.com
26
5: Results Hypothesis H1 stated that males spend more time playing video games than females. Independent t-tests were used to examine the differences among males and females. Table 7 illustrates that there is no statistical difference between males (M=3.06, SD=1.632) and females (M=3.21, SD 1.474) in terms of the length of time playing video games (p>.1, t= -.828, df=218.117). Therefore, the authors conclude that hypothesis 1 can be rejected.
Table 7: Independent samples test between males and females: “how often do you play video games?” (Hypothesis 1)
(Upper cells: equal variances assumed; Lower cells: equal variances not assumed)
Levene’s Test for Equality of Variance (F)
t-test for Equality of Means
Significance
t
df
Signif. (2-tailed)
Mean difference
Standard error difference
95% confidence interval of the difference
(lower) (upper)
5.352 0.021 -0.860 393 0.391 -0.142 0.165 -0.467 0.183
-0.828 218.117 0.409 -0.142 0.172 -0.481 0.196
Hypothesis H2 stated that males are multi-console users whereas females are single console users. In order to test the differences between males and females in terms of number of consoles, an independent t-test was used. The results (Table 8) indicate that there is a significant difference between the number of consoles men and women (p>.01, t=267.049, df=267.049) owned with women (M=1.8667, SD=1.79342) owning more consoles on average than men (M=1.3710, SD=1.58995). Therefore in terms of hypothesis 2, the authors found statistical significance in the difference between males and females but not in the direction that the literature supported. Therefore hypothesis H2 was rejected with a note that a significant difference in number of consoles owned exists between genders.
Table 8: Independent samples test between males and females: % of consoles owned (Hypothesis 2)
(Upper cells: equal variances assumed; Lower cells: equal variances not assumed)
Levene’s Test for Equality of Variance (F)
t-test for Equality of Means
Significance
t
df
Signif. (2-tailed)
Mean difference
Standard error difference
95% confidence interval of the difference
(lower) (upper)
6.623 0.010 -2.638 392.000
0.009 -0.49570 0.18791 -0.86513 -0.12627
-2.758 267.049
0.006 -0.49570 0.17972 -0.84955 -0.14185
Hypothesis 3 stated that video game genre preferences differ between males and females. In order to evaluate the effects of gender and age on gaming genre preferences we considered conducting a multivariate analysis of variance test (MANOVA). After checking the assumptions for multivariate
The Computer Games Journal 2(1) Candlemas 2013
Copyright of the author ©2013 Reproduction rights owned by The Computer Games Journal Ltd ©2013-14 www.computergamesjournal.com
27
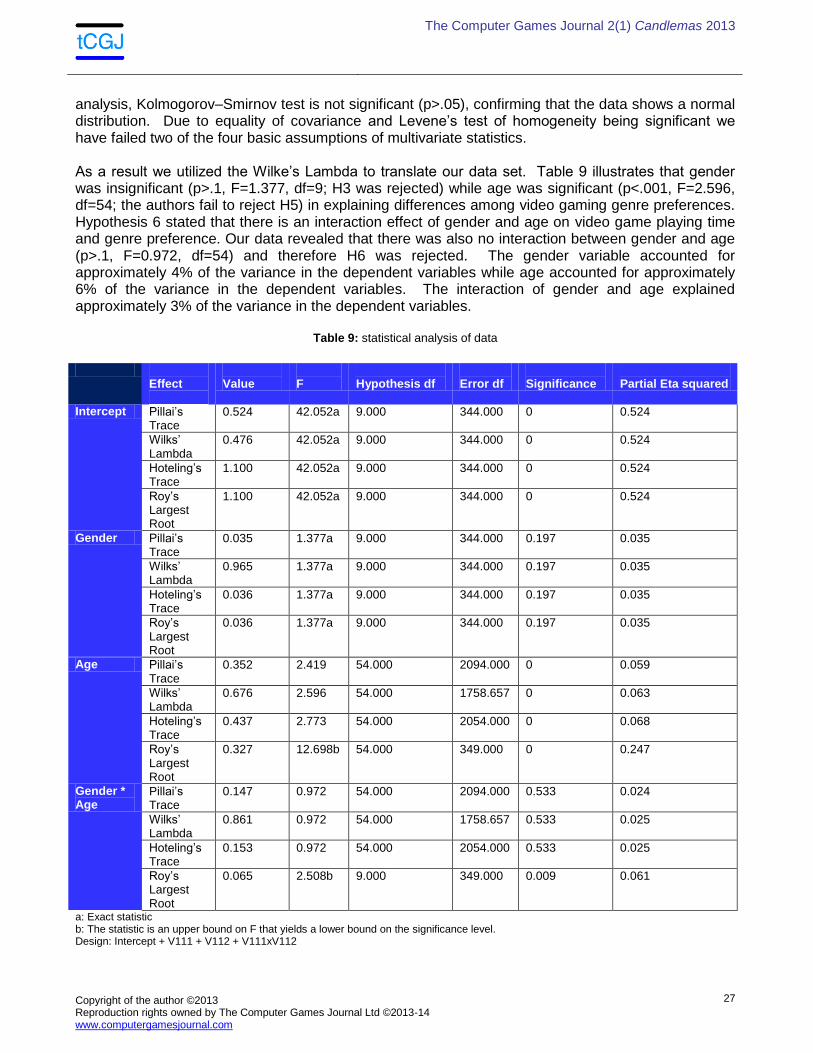
analysis, Kolmogorov–Smirnov test is not significant (p>.05), confirming that the data shows a normal distribution. Due to equality of covariance and Levene’s test of homogeneity being significant we have failed two of the four basic assumptions of multivariate statistics. As a result we utilized the Wilke’s Lambda to translate our data set. Table 9 illustrates that gender was insignificant (p>.1, F=1.377, df=9; H3 was rejected) while age was significant (p<.001, F=2.596, df=54; the authors fail to reject H5) in explaining differences among video gaming genre preferences. Hypothesis 6 stated that there is an interaction effect of gender and age on video game playing time and genre preference. Our data revealed that there was also no interaction between gender and age (p>.1, F=0.972, df=54) and therefore H6 was rejected. The gender variable accounted for approximately 4% of the variance in the dependent variables while age accounted for approximately 6% of the variance in the dependent variables. The interaction of gender and age explained approximately 3% of the variance in the dependent variables.
Table 9: statistical analysis of data
Effect
Value
F
Hypothesis df
Error df
Significance
Partial Eta squared
Intercept Pillai’s Trace
0.524 42.052a 9.000 344.000 0 0.524
Wilks’ Lambda
0.476 42.052a 9.000 344.000 0 0.524
Hoteling’s Trace
1.100 42.052a 9.000 344.000 0 0.524
Roy’s Largest Root
1.100 42.052a 9.000 344.000 0 0.524
Gender Pillai’s Trace
0.035 1.377a 9.000 344.000 0.197 0.035
Wilks’ Lambda
0.965 1.377a 9.000 344.000 0.197 0.035
Hoteling’s Trace
0.036 1.377a 9.000 344.000 0.197 0.035
Roy’s Largest Root
0.036 1.377a 9.000 344.000 0.197 0.035
Age Pillai’s Trace
0.352 2.419 54.000 2094.000 0 0.059
Wilks’ Lambda
0.676 2.596 54.000 1758.657 0 0.063
Hoteling’s Trace
0.437 2.773 54.000 2054.000 0 0.068
Roy’s Largest Root
0.327 12.698b 54.000 349.000 0 0.247
Gender * Age
Pillai’s Trace
0.147 0.972 54.000 2094.000 0.533 0.024
Wilks’ Lambda
0.861 0.972 54.000 1758.657 0.533 0.025
Hoteling’s Trace
0.153 0.972 54.000 2054.000 0.533 0.025
Roy’s Largest Root
0.065 2.508b 9.000 349.000 0.009 0.061
a: Exact statistic b: The statistic is an upper bound on F that yields a lower bound on the significance level. Design: Intercept + V111 + V112 + V111xV112

The Computer Games Journal 2(1) Candlemas 2013
Copyright of the author ©2013 Reproduction rights owned by The Computer Games Journal Ltd ©2013-14 www.computergamesjournal.com
28
Hypothesis 4 stated that video game playing time differs among age groups, with younger individuals giving more time to video games than older individuals. Our results indicate that there is a significant difference in time spent playing video games between 18-24 years of age and 55-64 years of age (M=1.72, SD=.332), 25-34 years of age and 55-64 years of age (M=1.57, SD=.288), 35-44 years of age and 55-64 years of age (M=1.15, SD=.277). These results provided support for hypothesis H4. Hypothesis 5 stated that video game genre preferences differ by age. As for video gaming genre preference, our survey indicates there are significant differences between:
- 18-24 and 45-54 years of age (M=1.32, SD=.360), 18-24 and 55-64 years of age (M=2.07, SD=.431), 25-34 and 55-64 years of age (M=1.76, .SD=373), 35-44 and 55-64 years of age (M=1.52, SD=.359) when exploring strategy video games;
- 18-24 and 45-54 years of age (M=1.14, SD=.280), 18-24 and 55-64 years of age (M=1.46, SD
.335), 25-34 and 45-54 years of age (M=.82, SD=.225), 25-34 and 55-64 years of age (M=1.15, SD =.290) in terms of racing video games; between 18-24 and 45-54 years of age (M=1.20, SD=.335), 25-34 to 45-54 years of age (M=1.27, SD=.269), 25-34 to 55-64 years of age (M=1.44, SD=.348) in terms of role playing video games;
- 18-24 and 45-54 years of age (M=1.25, SD=.337), 18-24 and 55-64 (M=1.59, SD=.403), 25-34
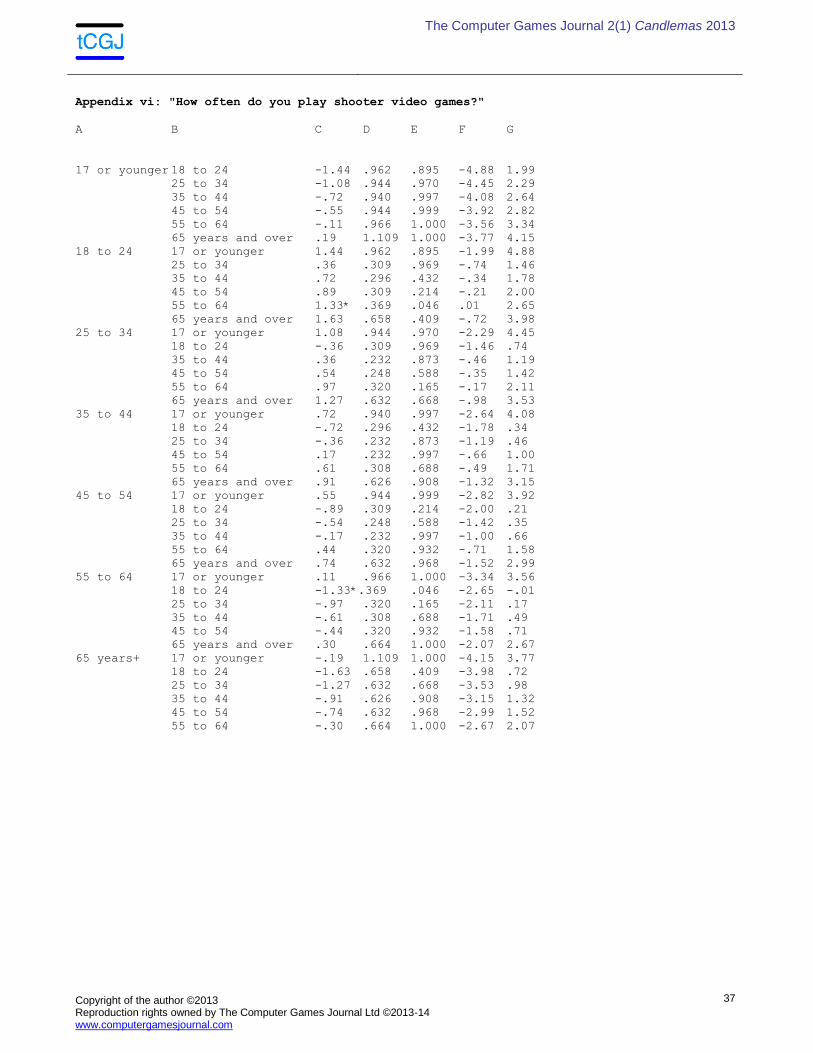
and 55-64 years of age (M=1.26, SD=.350) in terms of action/adventure video games; 18-24 and 55-64 years of age (M=1.33, SD=.369) in terms of shooter video games;
- 18-24 and 45-54 years of age (M=1.36, SD=.282), 18-24 and 55-64 years of age (M=1.60,
SD=.337), 25-34 and 45-54 years of age (M=.93, SD=.227), 25-34 and 55-64 years of age (M=1.17, SD=.293) in terms of fighting video games; and,
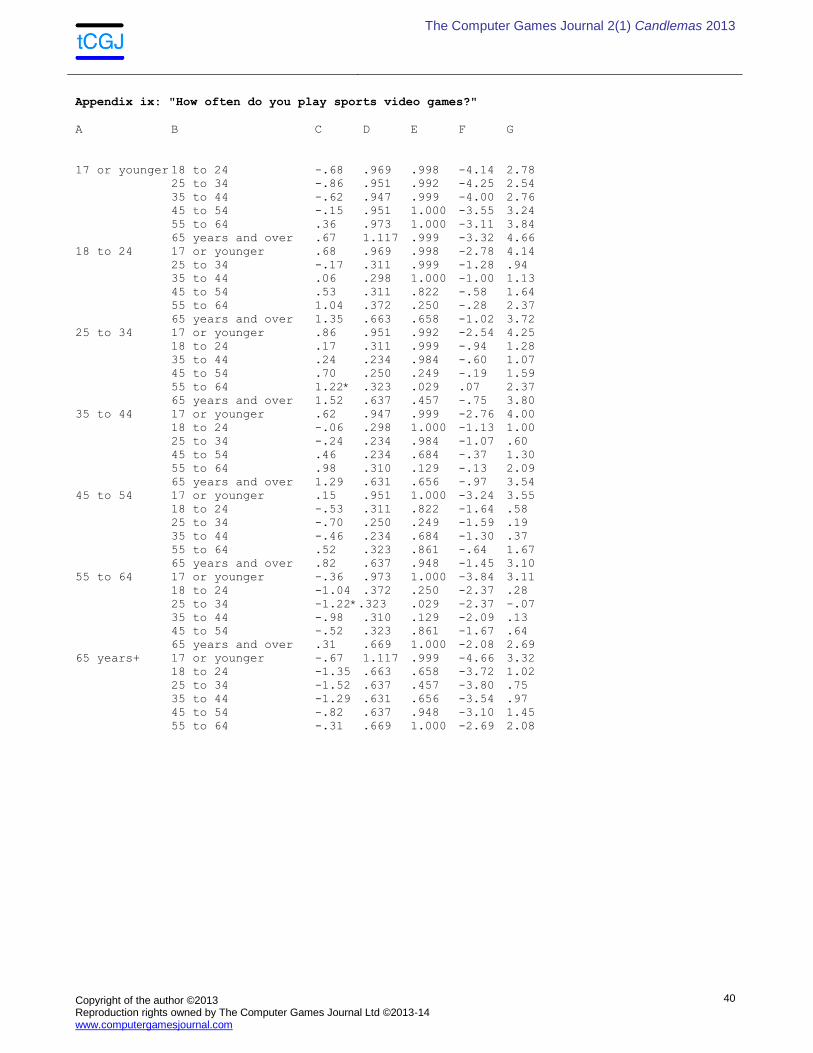
- 25-34 and 55-64 years of age (M=1.22, SD=3.23) in terms of sports video games.
Therefore, based on the above results (refer to the appendices at end of paper) Hypothesis H5 was also supported.
6: Conclusion and implications Through this study the authors have shown that on average there is no statistically significant difference between the amount of time men and women spend playing video games. This implies that video game producers should shift their gaze away from just males and focus more on both male and female gaming software. There was a statistically significant difference between the number of gaming consoles owned between men and women; however, this was not in the direction that prior literature indicates. This study showed that women owned more gaming consoles than men. This provides an opportunity for console producers to create designs more appealing to the female demographic. It was also indicated that there is no statistically significant difference between video gaming preferences of men and women. This would lend support to the Entertainment Software Associations 2010 report indicating that gender does not matter as everyone is simply looking to join the party and begin playing. The authors supported their claim that there was a statistically significant difference between age groups in terms of playing time with the younger generation playing more than the older generation. The divide appeared to occur between the ages of 34 and 35. This offers an opportunity for video game console and software makers to switch the paradigm by specifically targeting this

The Computer Games Journal 2(1) Candlemas 2013
Copyright of the author ©2013 Reproduction rights owned by The Computer Games Journal Ltd ©2013-14 www.computergamesjournal.com
29
particular segment. While the reasons for this drop off are unknown, one can possibly assume that it has to do with family obligations offering an opportunity to make family oriented games. Further, the authors found statistical support that there is a difference between age groups and their gaming preferences with the older generation focusing more on strategic gaming offerings while the younger generation tended to side more with action games. Combining this notion with the previous statement, one can make the assumption that at the age of 35, if they are continuing to play games, the games played are more strategic in nature. Video game creators have an opportunity to create action games that contain a significant amount of strategy that would appeal to the 35 and older crowd.
7: Limitations and future research Because the phenomenon studied is a developing medium, a portion of this work is time-bound, as is any survey, to the period when data were collected. Furthermore the sample was drawn from rent-a-list.com company. Therefore, the findings cannot be generalized beyond that target population. In addition, it was assumed that respondents completed the questionnaire objectively. As the medium of video games undergoes continuing significant changes, there is need to replicate such work over time and to continue to address the many significant issues that remain unexamined, much as the course of television research has progressed over 50 years. New innovative technologies such as motion capture cameras (see Xbox Kinect) and faster processors will continue to change gaming; the research challenge is to explain better the underlying processes of game use. The findings of this study indicated that women own more gaming devices than men. There is a need for research to explore and explain this paradigm change. In addition, the impact of this change on social life of both men and women would make interesting research areas to study. Finally, there is a growing segment of mobile phone and tablet games. Future studies are advised to conduct studies in this growing market. References 1 Bryce, J., & Rutter, J. (2003). The gendering of computer gaming: Experience and space. Leisure
Cultures: Investigations in Sports, Media and Technology, Leisure Studies Association, LSA PUBLICATION, 79, 3-22.
2 Entertainment Software Association (2010). Sales, Demographic and Usage Data. Essential Facts about
the Computer and Video Game Industry. Retrieved April 14, 2011, from http:// www.theesa.com/facts/pdfs/ESA_Essential_Facts_2010.PDF
3 Sony Computer Entertainment America. (2011). PlayStation History. Retrieved April 11, 2011, from
http://us.playstation.com/corporate/about/theplaystationstory/
4 IGN Staff. (2005). 30,000 game milestone. Retrieved April 11, 2011, from
http://games.ign.com/articles/592/592856p1.html
5 Anderson, C.A., Ihori, N., Bushman, B.J., Rothstein, H.R., Shibuya, A., Swing, E.L., & Saleem, M. (2010).
Violent video game effects on aggression, empathy, and prosocial behavior in eastern and western countries: A meta-analytic review. Psychological Bulletin, 136, 151-173. doi:10.1037/a0018251
6 Ha, I., Yoon, Y., & Choi, M. (2007). Determinants of adoption of mobile games under mobile broadband
wireless access environment. Information & Management, 44(3), 276-286. doi: 10.1016/j.im.2007.01.001

The Computer Games Journal 2(1) Candlemas 2013
Copyright of the author ©2013 Reproduction rights owned by The Computer Games Journal Ltd ©2013-14 www.computergamesjournal.com
30
7 Crandall, R., & Sidak, J. (2007). Video games: Serious business for America's economy. Entertainment
Software Association Report, 2006. Available at SSRN: http://ssrn.com/abstract=969728
8 Lucas, K., & Sherry, J. L. (2004). Sex differences in video game play. Communication Research, 31(5),
499 - 523.
9 De Schutter, B. (2011). Never Too Old to Play: The Appeal of Digital Games to an Older Audience.
Games and Culture, 6(2), 155-170.
10 Gailey, C. (1993). Mediated Messages: Gender, Class, and Cosmos in Home Video Games. Journal of
Popular Culture, 27(1), 81–97.
11 Goldstein, J. 1994. Sex Differences in Toy Use and Video Game Play. In J. H. Goldstein, ed., Toys, Play
and Child Development. New York: Cambridge University Press, 110–129
12 Hartmann, T., & Klimmt, C. (2006). Gender and computer games: Exploring females’ dislikes. Journal of
Computer-mediated Communication, 11(4), 910-931.
13 Ivory, J. (2006). Still a Man's Game: Gender Representation in Online Reviews of Video Games, Mass
Communication and Society, 9(1), 103-114.
14 Kafai, Y. (1996). Gender Differences in Children’s Constructions of Video Games. In P. M. Greenfield and
R. R. Cocking, eds., Interacting with Video. Norwood, N.J.: Ablex Publishing
15 Okagaki, L. & French, P. (1994). Effects of Video Game Playing on Measures of Spatial Performance:
Gender Effects in Late Adolescence. Journal of Applied Developmental Psychology, 15(1), 33–58
16 Subrahmanyam, K. & Greenfield, P. M. (1994). Effects of Video Game Practice on Spatial Skills in Girls
and Boys. Journal of Applied Developmental Psychology, 15(1), 13–32
17 Wilder, G., Mackie, D., & Cooper, J. (1985). Gender and computers: Two surveys of computer-related
attitudes. Sex Roles, 13 (3), 215-228.
18 Livingstone, S. (2002) Young people and new media: Childhood and the changing media environment.
London: Sage.
19 Funk, J. B., & Buchman, D. (1996). Children’s perceptions of gender differences in social approval for
playing electronic games. Sex Roles, 35(3), 219-231.
20 Geary, D. C. (1998). Male, female: The evolution of human sex differences, American Psychological
Association.
21 Hayward, C., (2003). Gender differences at puberty. Cambridge : Cambridge university press
22 Pedhazur, E. J. (1997). Multiple Regression in Behavioral Research. (3rd Ed.). Harcourt Brace College
Publishers: Forth Worth, TX.
23 SPSS (2011). Statistical Package for Social Sciences.

The Computer Games Journal 2(1) Candlemas 2013
Copyright of the author ©2013 Reproduction rights owned by The Computer Games Journal Ltd ©2013-14 www.computergamesjournal.com
31
APPENDICES Tables: Scheffe Dependent Variable results
Column A: Age
Column B: other Age group
Column C: Mean Difference (the subtraction of age of individuals in
Column A, from age of individuals in Column B)
Column D: Std. Error
Column E: Significance
Columns F, G: 95% Confidence Interval (F = lower-bound; G = upper-bound)
Based on observed means.
The error term is Mean Square (Error) = 2.622.
*. The mean difference is significant at the .05 level.

The Computer Games Journal 2(1) Candlemas 2013
Copyright of the author ©2013 Reproduction rights owned by The Computer Games Journal Ltd ©2013-14 www.computergamesjournal.com
32
APPENDIX i: "How often do you play video games?"
A B C D E F G
17 or young 18 to 24 -1.47 .865 .824 -4.55 1.62
25 to 34 -1.32 .849 .876 -4.35 1.71
35 to 44 -.90 .845 .980 -3.92 2.12
45 to 54 -.70 .849 .995 -3.73 2.33
55 to 64 .25 .868 1.000 -2.85 3.35
65 years and over .62 .997 .999 -2.94 4.18
18 to 24 17 or younger 1.47 .865 .824 -1.62 4.55
25 to 34 .15 .278 1.000 -.85 1.14
35 to 44 .57 .266 .603 -.38 1.52
45 to 54 .76 .278 .274 -.23 1.76
55 to 64 1.72* .332 .000 .53 2.90
65 years and over 2.09 .592 .056 -.03 4.20
25 to 34 17 or younger 1.32 .849 .876 -1.71 4.35
18 to 24 -.15 .278 1.000 -1.14 .85
35 to 44 .42 .209 .662 -.32 1.17
45 to 54 .62 .223 .263 -.18 1.42
55 to 64 1.57* .288 .000 .54 2.60
65 years and over 1.94 .568 .073 -.09 3.97
35 to 44 17 or younger .90 .845 .980 -2.12 3.92
18 to 24 -.57 .266 .603 -1.52 .38
25 to 34 -.42 .209 .662 -1.17 .32
45 to 54 .20 .209 .989 -.55 .94
55 to 64 1.15* .277 .010 .16 2.14
65 years and over 1.52 .563 .300 -.49 3.53
45 to 54 17 or younger .70 .849 .995 -2.33 3.73
18 to 24 -.76 .278 .274 -1.76 .23
25 to 34 -.62 .223 .263 -1.42 .18
35 to 44 -.20 .209 .989 -.94 .55
55 to 64 .95 .288 .093 -.08 1.98
65 years and over 1.32 .568 .495 -.71 3.35
55 to 64 17 or younger -.25 .868 1.000 -3.35 2.85
18 to 24 -1.72*.332 .000 -2.90 -.53
25 to 34 -1.57*.288 .000 -2.60 -.54
35 to 44 -1.15*.277 .010 -2.14 -.16
45 to 54 -.95 .288 .093 -1.98 .08
65 years and over .37 .597 .999 -1.76 2.50
65 years+ 17 or younger -.62 .997 .999 -4.18 2.94
18 to 24 -2.09 .592 .056 -4.20 .03
25 to 34 -1.94 .568 .073 -3.97 .09
35 to 44 -1.52 .563 .300 -3.53 .49
45 to 54 -1.32 .568 .495 -3.35 .71
55 to 64 -.37 .597 .999 -2.50 1.76

The Computer Games Journal 2(1) Candlemas 2013
Copyright of the author ©2013 Reproduction rights owned by The Computer Games Journal Ltd ©2013-14 www.computergamesjournal.com
33
Appendix ii: "How often do you play strategy video games?"
A B C D E F G
17 or younge 18 to 24 -.91 1.122 .995 -4.91 3.10
25 to 34 -.60 1.101 1.000 -4.53 3.34
35 to 44 -.35 1.097 1.000 -4.27 3.56
45 to 54 .42 1.101 1.000 -3.52 4.35
55 to 64 1.17 1.126 .983 -2.85 5.19
65 years and over 1.38 1.293 .980 -3.24 6.00
18 to 24 17 or younger .91 1.122 .995 -3.10 4.91
25 to 34 .31 .360 .993 -.97 1.60
35 to 44 .56 .345 .856 -.68 1.79
45 to 54 1.32* .360 .038 .04 2.61
55 to 64 2.07* .431 .001 .54 3.61
65 years and over 2.29 .768 .184 -.45 5.03
25 to 34 17 or younger .60 1.101 1.000 -3.34 4.53
18 to 24 -.31 .360 .993 -1.60 .97
35 to 44 .24 .271 .992 -.72 1.21
45 to 54 1.01 .289 .060 -.02 2.04
55 to 64 1.76* .373 .001 .43 3.09
65 years and over 1.98 .737 .307 -.66 4.61
35 to 44 17 or younger .35 1.097 1.000 -3.56 4.27
18 to 24 -.56 .345 .856 -1.79 .68
25 to 34 -.24 .271 .992 -1.21 .72
45 to 54 .77 .271 .237 -.20 1.73
55 to 64 1.52* .359 .008 .24 2.80
65 years and over 1.73 .730 .468 -.87 4.34
45 to 54 17 or younger -.42 1.101 1.000 -4.35 3.52
18 to 24 -1.32*.360 .038 -2.61 -.04
25 to 34 -1.01 .289 .060 -2.04 .02
35 to 44 -.77 .271 .237 -1.73 .20
55 to 64 .75 .373 .672 -.58 2.08
65 years and over .96 .737 .944 -1.67 3.60
55 to 64 17 or younger -1.17 1.126 .983 -5.19 2.85
18 to 24 -2.07*.431 .001 -3.61 -.54
25 to 34 -1.76*.373 .001 -3.09 -.43
35 to 44 -1.52*.359 .008 -2.80 -.24
45 to 54 -.75 .373 .672 -2.08 .58
65 years and over .21 .774 1.000 -2.55 2.98
65 years+ 17 or younger -1.38 1.293 .980 -6.00 3.24
18 to 24 -2.29 .768 .184 -5.03 .45
25 to 34 -1.98 .737 .307 -4.61 .66
35 to 44 -1.73 .730 .468 -4.34 .87
45 to 54 -.96 .737 .944 -3.60 1.67
55 to 64 -.21 .774 1.000 -2.98 2.55

The Computer Games Journal 2(1) Candlemas 2013
Copyright of the author ©2013 Reproduction rights owned by The Computer Games Journal Ltd ©2013-14 www.computergamesjournal.com
34
Appendix iii: "How often do you play racing video games?"
A B C D E F G
17 or younger 18 to 24 -.18 .872 1.000 -3.30 2.93
25 to 34 .13 .856 1.000 -2.92 3.19
35 to 44 .44 .852 1.000 -2.60 3.49
45 to 54 .95 .856 .975 -2.10 4.01
55 to 64 1.28 .875 .907 -1.85 4.40
65 years and over 1.67 1.005 .839 -1.92 5.26
18 to 24 17 or younger .18 .872 1.000 -2.93 3.30
25 to 34 .31 .280 .973 -.68 1.31
35 to 44 .63 .268 .488 -.33 1.58
45 to 54 1.14* .280 .013 .14 2.13
55 to 64 1.46* .335 .005 .27 2.66
65 years and over 1.85 .597 .146 -.28 3.98
25 to 34 17 or younger -.13 .856 1.000 -3.19 2.92
18 to 24 -.31 .280 .973 -1.31 .68
35 to 44 .31 .210 .899 -.44 1.06
45 to 54 .82* .225 .040 .02 1.62
55 to 64 1.15* .290 .018 .11 2.18
65 years and over 1.54 .573 .307 -.51 3.58
35 to 44 17 or younger -.44 .852 1.000 -3.49 2.60
18 to 24 -.63 .268 .488 -1.58 .33
25 to 34 -.31 .210 .899 -1.06 .44
45 to 54 .51 .210 .441 -.24 1.26
55 to 64 .83 .279 .181 -.16 1.83
65 years and over 1.22 .568 .591 -.80 3.25
45 to 54 17 or younger -.95 .856 .975 -4.01 2.10
18 to 24 -1.14*.280 .013 -2.13 -.14
25 to 34 -.82* .225 .040 -1.62 -.02
35 to 44 -.51 .210 .441 -1.26 .24
55 to 64 .33 .290 .974 -.71 1.36
65 years and over .71 .573 .955 -1.33 2.76
55 to 64 17 or younger -1.28 .875 .907 -4.40 1.85
18 to 24 -1.46*.335 .005 -2.66 -.27
25 to 34 -1.15*.290 .018 -2.18 -.11
35 to 44 -.83 .279 .181 -1.83 .16
45 to 54 -.33 .290 .974 -1.36 .71
65 years and over .39 .602 .999 -1.76 2.54
65 years+ 17 or younger -1.67 1.005 .839 -5.26 1.92
18 to 24 -1.85 .597 .146 -3.98 .28
25 to 34 -1.54 .573 .307 -3.58 .51
35 to 44 -1.22 .568 .591 -3.25 .80
45 to 54 -.71 .573 .955 -2.76 1.33
55 to 64 -.39 .602 .999 -2.54 1.76

The Computer Games Journal 2(1) Candlemas 2013
Copyright of the author ©2013 Reproduction rights owned by The Computer Games Journal Ltd ©2013-14 www.computergamesjournal.com
35
Appendix iv: "How often do you play role playing video games?"
A B C D E F G
17 or younger 18 to 24 -1.73 1.045 .842 -5.46 2.01
25 to 34 -1.80 1.026 .799 -5.46 1.86
35 to 44 -1.22 1.021 .963 -4.87 2.42
45 to 54 -.52 1.026 1.000 -4.19 3.14
55 to 64 -.36 1.049 1.000 -4.11 3.38
65 years and over .00 1.205 1.000 -4.30 4.30
18 to 24 17 or younger 1.73 1.045 .842 -2.01 5.46
25 to 34 -.07 .335 1.000 -1.27 1.12
35 to 44 .50 .322 .875 -.65 1.65
45 to 54 1.20* .335 .049 .00 2.40
55 to 64 1.36 .401 .076 -.07 2.80
65 years and over 1.73 .715 .446 -.83 4.28
25 to 34 17 or younger 1.80 1.026 .799 -1.86 5.46
18 to 24 .07 .335 1.000 -1.12 1.27
35 to 44 .57 .252 .520 -.33 1.47
45 to 54 1.27* .269 .001 .31 2.24
55 to 64 1.44* .348 .010 .19 2.68
65 years and over 1.80 .687 .337 -.65 4.25
35 to 44 17 or younger 1.22 1.021 .963 -2.42 4.87
18 to 24 -.50 .322 .875 -1.65 .65
25 to 34 -.57 .252 .520 -1.47 .33
45 to 54 .70 .252 .264 -.20 1.60
55 to 64 .86 .334 .358 -.33 2.06
65 years and over 1.22 .680 .778 -1.21 3.65
45 to 54 17 or younger .52 1.026 1.000 -3.14 4.19
18 to 24 -1.20*.335 .049 -2.40 .00
25 to 34 -1.27*.269 .001 -2.24 -.31
35 to 44 -.70 .252 .264 -1.60 .20
55 to 64 .16 .348 1.000 -1.08 1.40
65 years and over .52 .687 .997 -1.93 2.98
55 to 64 17 or younger .36 1.049 1.000 -3.38 4.11
18 to 24 -1.36 .401 .076 -2.80 .07
25 to 34 -1.44*.348 .010 -2.68 -.19
35 to 44 -.86 .334 .358 -2.06 .33
45 to 54 -.16 .348 1.000 -1.40 1.08
65 years and over .36 .721 1.000 -2.21 2.94
65 years+ 17 or younger .00 1.205 1.000 -4.30 4.30
18 to 24 -1.73 .715 .446 -4.28 .83
25 to 34 -1.80 .687 .337 -4.25 .65
35 to 44 -1.22 .680 .778 -3.65 1.21
45 to 54 -.52 .687 .997 -2.98 1.93
55 to 64 -.36 .721 1.000 -2.94 2.21

The Computer Games Journal 2(1) Candlemas 2013
Copyright of the author ©2013 Reproduction rights owned by The Computer Games Journal Ltd ©2013-14 www.computergamesjournal.com
36
Appendix v: "How often do you play action/adventure video games?"
A B C D E F G
17 or younger 18 to 24 -1.84 1.051 .800 -5.60 1.91
25 to 34 -1.51 1.032 .905 -5.20 2.17
35 to 44 -1.16 1.028 .973 -4.83 2.51
45 to 54 -.60 1.032 .999 -4.28 3.09
55 to 64 -.25 1.055 1.000 -4.02 3.52
65 years and over -.10 1.212 1.000 -4.42 4.23
18 to 24 17 or younger 1.84 1.051 .800 -1.91 5.60
25 to 34 .33 .337 .987 -.87 1.53
35 to 44 .68 .324 .614 -.47 1.84
45 to 54 1.25* .337 .036 .04 2.45
55 to 64 1.59* .403 .018 .15 3.03
65 years and over 1.75 .720 .437 -.82 4.32
25 to 34 17 or younger 1.51 1.032 .905 -2.17 5.20
18 to 24 -.33 .337 .987 -1.53 .87
35 to 44 .35 .254 .924 -.55 1.26
45 to 54 .92 .271 .079 -.05 1.88
55 to 64 1.26* .350 .046 .01 2.51
65 years and over 1.42 .691 .649 -1.05 3.88
35 to 44 17 or younger 1.16 1.028 .973 -2.51 4.83
18 to 24 -.68 .324 .614 -1.84 .47
25 to 34 -.35 .254 .924 -1.26 .55
45 to 54 .56 .254 .555 -.34 1.47
55 to 64 .91 .336 .299 -.29 2.11
65 years and over 1.06 .684 .878 -1.38 3.51
45 to 54 17 or younger .60 1.032 .999 -3.09 4.28
18 to 24 -1.25*.337 .036 -2.45 -.04
25 to 34 -.92 .271 .079 -1.88 .05
35 to 44 -.56 .254 .555 -1.47 .34
55 to 64 .35 .350 .986 -.90 1.59
65 years and over .50 .691 .998 -1.97 2.97
55 to 64 17 or younger .25 1.055 1.000 -3.52 4.02
18 to 24 -1.59*.403 .018 -3.03 -.15
25 to 34 -1.26*.350 .046 -2.51 -.01
35 to 44 -.91 .336 .299 -2.11 .29
45 to 54 -.35 .350 .986 -1.59 .90
65 years and over .15 .726 1.000 -2.44 2.74
65 years+ 17 or younger .10 1.212 1.000 -4.23 4.42
18 to 24 -1.75 .720 .437 -4.32 .82
25 to 34 -1.42 .691 .649 -3.88 1.05
35 to 44 -1.06 .684 .878 -3.51 1.38
45 to 54 -.50 .691 .998 -2.97 1.97
55 to 64 -.15 .726 1.000 -2.74 2.44
The Computer Games Journal 2(1) Candlemas 2013
Copyright of the author ©2013 Reproduction rights owned by The Computer Games Journal Ltd ©2013-14 www.computergamesjournal.com
37
Appendix vi: "How often do you play shooter video games?"
A B C D E F G
17 or younger 18 to 24 -1.44 .962 .895 -4.88 1.99
25 to 34 -1.08 .944 .970 -4.45 2.29
35 to 44 -.72 .940 .997 -4.08 2.64
45 to 54 -.55 .944 .999 -3.92 2.82
55 to 64 -.11 .966 1.000 -3.56 3.34
65 years and over .19 1.109 1.000 -3.77 4.15
18 to 24 17 or younger 1.44 .962 .895 -1.99 4.88
25 to 34 .36 .309 .969 -.74 1.46
35 to 44 .72 .296 .432 -.34 1.78
45 to 54 .89 .309 .214 -.21 2.00
55 to 64 1.33* .369 .046 .01 2.65
65 years and over 1.63 .658 .409 -.72 3.98
25 to 34 17 or younger 1.08 .944 .970 -2.29 4.45
18 to 24 -.36 .309 .969 -1.46 .74
35 to 44 .36 .232 .873 -.46 1.19
45 to 54 .54 .248 .588 -.35 1.42
55 to 64 .97 .320 .165 -.17 2.11
65 years and over 1.27 .632 .668 -.98 3.53
35 to 44 17 or younger .72 .940 .997 -2.64 4.08
18 to 24 -.72 .296 .432 -1.78 .34
25 to 34 -.36 .232 .873 -1.19 .46
45 to 54 .17 .232 .997 -.66 1.00
55 to 64 .61 .308 .688 -.49 1.71
65 years and over .91 .626 .908 -1.32 3.15
45 to 54 17 or younger .55 .944 .999 -2.82 3.92
18 to 24 -.89 .309 .214 -2.00 .21
25 to 34 -.54 .248 .588 -1.42 .35
35 to 44 -.17 .232 .997 -1.00 .66
55 to 64 .44 .320 .932 -.71 1.58
65 years and over .74 .632 .968 -1.52 2.99
55 to 64 17 or younger .11 .966 1.000 -3.34 3.56
18 to 24 -1.33*.369 .046 -2.65 -.01
25 to 34 -.97 .320 .165 -2.11 .17
35 to 44 -.61 .308 .688 -1.71 .49
45 to 54 -.44 .320 .932 -1.58 .71
65 years and over .30 .664 1.000 -2.07 2.67
65 years+ 17 or younger -.19 1.109 1.000 -4.15 3.77
18 to 24 -1.63 .658 .409 -3.98 .72
25 to 34 -1.27 .632 .668 -3.53 .98
35 to 44 -.91 .626 .908 -3.15 1.32
45 to 54 -.74 .632 .968 -2.99 1.52
55 to 64 -.30 .664 1.000 -2.67 2.07

The Computer Games Journal 2(1) Candlemas 2013
Copyright of the author ©2013 Reproduction rights owned by The Computer Games Journal Ltd ©2013-14 www.computergamesjournal.com
38
Appendix vii: "How often do you play fighting video games?"
A B C D E F G
17 or younger 18 to 24 -1.83 .879 .635 -4.96 1.31
25 to 34 -1.39 .863 .856 -4.47 1.69
35 to 44 -.88 .859 .983 -3.95 2.18
45 to 54 -.46 .863 1.000 -3.55 2.62
55 to 64 -.22 .883 1.000 -3.37 2.93
65 years and over .00 1.014 1.000 -3.62 3.62
18 to 24 17 or younger 1.83 .879 .635 -1.31 4.96
25 to 34 .43 .282 .885 -.58 1.44
35 to 44 .94 .271 .063 -.02 1.91
45 to 54 1.36* .282 .001 .35 2.37
55 to 64 1.60* .337 .001 .40 2.81
65 years and over 1.83 .602 .166 -.32 3.97
25 to 34 17 or younger 1.39 .863 .856 -1.69 4.47
18 to 24 -.43 .282 .885 -1.44 .58
35 to 44 .51 .212 .452 -.25 1.27
45 to 54 .93* .227 .011 .12 1.74
55 to 64 1.17* .293 .015 .13 2.22
65 years and over 1.39 .578 .447 -.67 3.46
35 to 44 17 or younger .88 .859 .983 -2.18 3.95
18 to 24 -.94 .271 .063 -1.91 .02
25 to 34 -.51 .212 .452 -1.27 .25
45 to 54 .42 .212 .688 -.34 1.18
55 to 64 .66 .281 .480 -.34 1.67
65 years and over .88 .572 .880 -1.16 2.93
45 to 54 17 or younger .46 .863 1.000 -2.62 3.55
18 to 24 -1.36*.282 .001 -2.37 -.35
25 to 34 -.93* .227 .011 -1.74 -.12
35 to 44 -.42 .212 .688 -1.18 .34
55 to 64 .24 .293 .995 -.80 1.29
65 years and over .46 .578 .996 -1.60 2.53
55 to 64 17 or younger .22 .883 1.000 -2.93 3.37
18 to 24 -1.60*.337 .001 -2.81 -.40
25 to 34 -1.17*.293 .015 -2.22 -.13
35 to 44 -.66 .281 .480 -1.67 .34
45 to 54 -.24 .293 .995 -1.29 .80
65 years and over .22 .607 1.000 -1.94 2.39
65 years+ 17 or younger .00 1.014 1.000 -3.62 3.62
18 to 24 -1.83 .602 .166 -3.97 .32
25 to 34 -1.39 .578 .447 -3.46 .67
35 to 44 -.88 .572 .880 -2.93 1.16
45 to 54 -.46 .578 .996 -2.53 1.60
55 to 64 -.22 .607 1.000 -2.39 1.94

The Computer Games Journal 2(1) Candlemas 2013
Copyright of the author ©2013 Reproduction rights owned by The Computer Games Journal Ltd ©2013-14 www.computergamesjournal.com
39
Appendix viii: "How often do you play puzzles or cards video games?"
A B C D E F G
17 or younger 18 to 24 -1.64 1.248 .942 -6.10 2.81
25 to 34 -2.61 1.225 .606 -6.98 1.77
35 to 44 -2.26 1.220 .750 -6.62 2.09
45 to 54 -1.89 1.225 .880 -6.27 2.48
55 to 64 -1.22 1.253 .987 -5.70 3.25
65 years and over -.24 1.439 1.000 -5.37 4.90
18 to 24 17 or younger 1.64 1.248 .942 -2.81 6.10
25 to 34 -.97 .401 .446 -2.40 .46
35 to 44 -.62 .384 .853 -1.99 .75
45 to 54 -.25 .401 .999 -1.68 1.18
55 to 64 .42 .479 .993 -1.29 2.13
65 years and over 1.40 .854 .845 -1.65 4.45
25 to 34 17 or younger 2.61 1.225 .606 -1.77 6.98
18 to 24 .97 .401 .446 -.46 2.40
35 to 44 .34 .301 .972 -.73 1.42
45 to 54 .71 .322 .554 -.43 1.86
55 to 64 1.38 .415 .088 -.10 2.87
65 years and over 2.37 .820 .217 -.56 5.30
35 to 44 17 or younger 2.26 1.220 .750 -2.09 6.62
18 to 24 .62 .384 .853 -.75 1.99
25 to 34 -.34 .301 .972 -1.42 .73
45 to 54 .37 .301 .957 -.70 1.45
55 to 64 1.04 .399 .341 -.38 2.47
65 years and over 2.03 .812 .400 -.87 4.93
45 to 54 17 or younger 1.89 1.225 .880 -2.48 6.27
18 to 24 .25 .401 .999 -1.18 1.68
25 to 34 -.71 .322 .554 -1.86 .43
35 to 44 -.37 .301 .957 -1.45 .70
55 to 64 .67 .415 .856 -.81 2.15
65 years and over 1.65 .820 .667 -1.27 4.58
55 to 64 17 or younger 1.22 1.253 .987 -3.25 5.70
18 to 24 -.42 .479 .993 -2.13 1.29
25 to 34 -1.38 .415 .088 -2.87 .10
35 to 44 -1.04 .399 .341 -2.47 .38
45 to 54 -.67 .415 .856 -2.15 .81
65 years and over .98 .861 .971 -2.09 4.06
65 years+ 17 or younger .24 1.439 1.000 -4.90 5.37
18 to 24 -1.40 .854 .845 -4.45 1.65
25 to 34 -2.37 .820 .217 -5.30 .56
35 to 44 -2.03 .812 .400 -4.93 .87
45 to 54 -1.65 .820 .667 -4.58 1.27
55 to 64 -.98 .861 .971 -4.06 2.09
The Computer Games Journal 2(1) Candlemas 2013
Copyright of the author ©2013 Reproduction rights owned by The Computer Games Journal Ltd ©2013-14 www.computergamesjournal.com
40
Appendix ix: "How often do you play sports video games?"
A B C D E F G
17 or younger 18 to 24 -.68 .969 .998 -4.14 2.78
25 to 34 -.86 .951 .992 -4.25 2.54
35 to 44 -.62 .947 .999 -4.00 2.76
45 to 54 -.15 .951 1.000 -3.55 3.24
55 to 64 .36 .973 1.000 -3.11 3.84
65 years and over .67 1.117 .999 -3.32 4.66
18 to 24 17 or younger .68 .969 .998 -2.78 4.14
25 to 34 -.17 .311 .999 -1.28 .94
35 to 44 .06 .298 1.000 -1.00 1.13
45 to 54 .53 .311 .822 -.58 1.64
55 to 64 1.04 .372 .250 -.28 2.37
65 years and over 1.35 .663 .658 -1.02 3.72
25 to 34 17 or younger .86 .951 .992 -2.54 4.25
18 to 24 .17 .311 .999 -.94 1.28
35 to 44 .24 .234 .984 -.60 1.07
45 to 54 .70 .250 .249 -.19 1.59
55 to 64 1.22* .323 .029 .07 2.37
65 years and over 1.52 .637 .457 -.75 3.80
35 to 44 17 or younger .62 .947 .999 -2.76 4.00
18 to 24 -.06 .298 1.000 -1.13 1.00
25 to 34 -.24 .234 .984 -1.07 .60
45 to 54 .46 .234 .684 -.37 1.30
55 to 64 .98 .310 .129 -.13 2.09
65 years and over 1.29 .631 .656 -.97 3.54
45 to 54 17 or younger .15 .951 1.000 -3.24 3.55
18 to 24 -.53 .311 .822 -1.64 .58
25 to 34 -.70 .250 .249 -1.59 .19
35 to 44 -.46 .234 .684 -1.30 .37
55 to 64 .52 .323 .861 -.64 1.67
65 years and over .82 .637 .948 -1.45 3.10
55 to 64 17 or younger -.36 .973 1.000 -3.84 3.11
18 to 24 -1.04 .372 .250 -2.37 .28
25 to 34 -1.22*.323 .029 -2.37 -.07
35 to 44 -.98 .310 .129 -2.09 .13
45 to 54 -.52 .323 .861 -1.67 .64
65 years and over .31 .669 1.000 -2.08 2.69
65 years+ 17 or younger -.67 1.117 .999 -4.66 3.32
18 to 24 -1.35 .663 .658 -3.72 1.02
25 to 34 -1.52 .637 .457 -3.80 .75
35 to 44 -1.29 .631 .656 -3.54 .97
45 to 54 -.82 .637 .948 -3.10 1.45
55 to 64 -.31 .669 1.000 -2.69 2.08