A Quantitative Investigation into the Impacts of 1:1 iPads ... · PDF fileA quantitative...
25
Journal of Information Technology Education: Innovations in Practice Volume 14, 2015 Cite as: Bebell, D., & Pedulla, J. (2015). A quantitative investigation into the impacts of 1:1 iPads on early learner’s ELA and math achievement. Journal of Information Technology Education: Innovations in Practice, 14, 191-215. Re- trieved from http://www.jite.org/documents/Vol14/JITEv14IIPp191-215Bebell1720.pdf Editor: Kathryn MacCallum Submission Date: February 9. 2015; Revisions: April 15, May 29, 2015; Accepted June 4, 2015 A Quantitative Investigation into the Impacts of 1:1 iPads on Early Learners’ ELA and Math Achievement Damian Bebell and Joseph Pedulla Lynch School of Education, Boston College, Chestnut Hill, Massachusetts, USA [email protected] [email protected] Abstract Many parents, educators, and policy makers see great potential for leveraging tools like laptop computers, tablets, and smartphones in the classrooms of the world. Although increasing stu- dents’ technology access may be associated with increased student achievement, there is little research directly investigating objective measures of student achievement. This study addresses the short-term and long-term quantitative impacts of one of the world’s first school efforts to pro- vide Kindergarten through 3 rd grade classrooms with 1:1 iPad access and a range of English Lan- guage Arts (ELA) and math Apps. This report summarizes two investigations conducted during this iPad implementation. First, a 9-week pre/post randomized control trial was conducted in which 8 Kindergarten classes used literacy and numeracy apps while another 8 Kindergarten clas- ses used their traditional (non-iPad) resources. At the end of this short implementation period, slightly stronger literacy performance gains were observed in the iPad settings. In a second longi- tudinal study, three years of assessment data were explored before and after the 1:1 iPad imple- mentation in grades K to 2. Results from the longitudinal study provide emerging evidence of potential increases in ELA achievement, but no consistent results in math achievement. This pa- per adds to the sparse literature in this area and provides a springboard for further research. Keywords: tablet computers, iPads, early education, Kindergarten, student achievement, random- ized control trial, early literacy, 1:1 computing Introduction “For want of records, much useful knowledge is continually lost. Though many individ- uals have derived advantages to themselves from experiments, but few have recorded them. Even those who make experiments [are] liable to forget them, so as to give incor- rect representations of them when they try to relate them.” (Lathrop, 1826} The invention and subsequent prolifera- tion of new technologies across informal and formal educational systems dates back thousands of years. Cuneiforms, abacuses, writing slates, paper, books, chalkboards, and even transparency pro- jectors all represent technologies that have been adapted and used for advanc- Material published as part of this publication, either on-line or in print, is copyrighted by the Informing Science Institute. Permission to make digital or paper copy of part or all of these works for personal or classroom use is granted without fee provided that the copies are not made or distributed for profit or commercial advantage AND that copies 1) bear this notice in full and 2) give the full citation on the first page. It is per- missible to abstract these works so long as credit is given. To copy in all other cases or to republish or to post on a server or to redistribute to lists requires specific permission and payment of a fee. Contact [email protected] to request redistribution permission.
Transcript of A Quantitative Investigation into the Impacts of 1:1 iPads ... · PDF fileA quantitative...

Journal of Information Technology Education: Innovations in Practice Volume 14, 2015 Cite as: Bebell, D., & Pedulla, J. (2015). A quantitative investigation into the impacts of 1:1 iPads on early learner’s ELA and math achievement. Journal of Information Technology Education: Innovations in Practice, 14, 191-215. Re-trieved from http://www.jite.org/documents/Vol14/JITEv14IIPp191-215Bebell1720.pdf
Editor: Kathryn MacCallum Submission Date: February 9. 2015; Revisions: April 15, May 29, 2015; Accepted June 4, 2015
A Quantitative Investigation into the Impacts of 1:1 iPads on Early Learners’ ELA
and Math Achievement Damian Bebell and Joseph Pedulla
Lynch School of Education, Boston College, Chestnut Hill, Massachusetts, USA
[email protected] [email protected]
Abstract Many parents, educators, and policy makers see great potential for leveraging tools like laptop computers, tablets, and smartphones in the classrooms of the world. Although increasing stu-dents’ technology access may be associated with increased student achievement, there is little research directly investigating objective measures of student achievement. This study addresses the short-term and long-term quantitative impacts of one of the world’s first school efforts to pro-vide Kindergarten through 3rd grade classrooms with 1:1 iPad access and a range of English Lan-guage Arts (ELA) and math Apps. This report summarizes two investigations conducted during this iPad implementation. First, a 9-week pre/post randomized control trial was conducted in which 8 Kindergarten classes used literacy and numeracy apps while another 8 Kindergarten clas-ses used their traditional (non-iPad) resources. At the end of this short implementation period, slightly stronger literacy performance gains were observed in the iPad settings. In a second longi-tudinal study, three years of assessment data were explored before and after the 1:1 iPad imple-mentation in grades K to 2. Results from the longitudinal study provide emerging evidence of potential increases in ELA achievement, but no consistent results in math achievement. This pa-per adds to the sparse literature in this area and provides a springboard for further research.
Keywords: tablet computers, iPads, early education, Kindergarten, student achievement, random-ized control trial, early literacy, 1:1 computing
Introduction “For want of records, much useful knowledge is continually lost. Though many individ-uals have derived advantages to themselves from experiments, but few have recorded them. Even those who make experiments [are] liable to forget them, so as to give incor-
rect representations of them when they try to relate them.” (Lathrop, 1826}
The invention and subsequent prolifera-tion of new technologies across informal and formal educational systems dates back thousands of years. Cuneiforms, abacuses, writing slates, paper, books, chalkboards, and even transparency pro-jectors all represent technologies that have been adapted and used for advanc-
Material published as part of this publication, either on-line or in print, is copyrighted by the Informing Science Institute. Permission to make digital or paper copy of part or all of these works for personal or classroom use is granted without fee provided that the copies are not made or distributed for profit or commercial advantage AND that copies 1) bear this notice in full and 2) give the full citation on the first page. It is per-missible to abstract these works so long as credit is given. To copy in all other cases or to republish or to post on a server or to redistribute to lists requires specific permission and payment of a fee. Contact [email protected] to request redistribution permission.

Impacts of 1:1 iPads
192
ing schooling and education. In just the last few decades, computer-based technologies have transformed the personal and professional lives for large segments of the world’s population. Similarly, the integration of computer technologies into traditional school settings has been wide-spread and far-reaching. Many parents, educators, and policy makers see great potential in lever-aging tools like laptops, tablets, and smartphones in the classrooms of the world. At the same time, critics have decried the lack of evidence from investments on costly educational technology expenditures, particularly evidence on increasing student achievement (Richtel, 2011; Weston & Bain, 2010).
Whereas computer access had been a sporadic, shared, and localized event for most students even a generation ago, mobile devices beginning with laptops have moved digital technology out of the computer labs and into the classrooms. As early as 1989, K12 schools experimented with formal-ly providing all of their students access to technology at a 1:1 ratio, meaning that each student has a personal computing device throughout the school day (and typically taken home). Since these early efforts, school leaders and policy makers have sought to keep pace with constantly evolving hardware and network advances while navigating the management and support of these tools in creating a relevant range of educational opportunities for their students (Bebell & O’Dwyer, 2010). This paper explores the short-term and long-term quantitative impacts of the Auburn Pub-lic Schools (ME) Advantage Program, one of the world’s first district-wide efforts to provide and support Kindergarten through second grade classrooms with 1:1 iPad access and a range of Eng-lish Language Arts (ELA) and Math apps focused on foundational knowledge. English Language Arts (ELA) is a generic subject categorization used in the US that typically includes reading, writ-ing, speaking, listening, and visual literacy. Specifically, two related investigations, including a 9-week randomized control trial and a 3-year longitudinal analysis of student achievement patterns, compared iPad-equipped student assessment patterns to historic patterns of achievement for pre-iPad and non-participating students in the school district.
Literature Review Announced on January 27, 2010, and released to the public in April 2010, the Apple iPad sig-naled a new type of personal computing device combining features and an operating system of the already popular iPhone with those of a tablet computer. Since then, the iPad has become ex-tremely popular with over 15 million iPads sold within its first production year (Ritchie, 2014) and 26 million sold in the last quarter of 2013 (Apple, 2014). Like the public, educators and school leadership have quickly found promise in the iPad such that by the third quarter of 2013, the device had garnered 43% of the K-12 US market share across all brands and types of compu-ting devices (Winkler, 2014).
Researchers, school leaders, and policy makers have posited a number of specific attributes that make the iPad uniquely suited for students in a formal educational setting. Proponents report that the design features of the device itself (mobility, touchscreen, lack of moving parts) make it par-ticularly intuitive and conducive to early learning applications (Cubelic & Larwin, 2014; Jaffari-an, 2012). A day-long summit of Canadian school policy makers concluded that “there is also strong recognition that iPads excel in three areas – improving engagement, supporting multiple ways to access the curriculum (Universal Design for Learning) and enhancing assessment prac-tices” (Alberta Education, 2012, p. 5).
Like most prior educational technology devices, the objectives and the actual usage of the iPad in school settings has ranged widely and must be first fully understood before evaluating its poten-tial impacts. Indeed, summarizing the range of why and how schools have employed iPads pre-sents one of the first challenges for empirical research in this field. As of September 2014, Apple offered a staggering 675,000 native iPad Apps (Costello, 2014) in addition to the Internet, pho-to/video/audio, and GPS functions of the device. In this short history, thousands of schools

Bebell & Pedulla
193
across the globe have adopted and implemented iPad programs to serve their own unique objec-tives often targeted at different grade levels, across different subject areas, and even for specific sub-groups of the student population. Part of the challenge for an impartial researcher in catego-rizing these school efforts has been the wide-ranging objectives espoused by such early adopting school programs, or simply a lack of any pre-defined objectives associated with a given school’s iPad initiative. In addition, most schools experimenting with iPad programs have rarely engaged in any formal research or evaluation efforts and fewer have published such accounts.
Given that the iPad did not exist five years ago, the wide range of its potential application and use, as well as the fact that most iPad programs in schools are not studied, the available published research and accounts of 1:1 iPad programs are limited. As previously stated, 1:1 laptop pro-grams date back earlier and have often employed similar objectives and implementation models; however, it is largely unknown how generalizable such results may be towards 1:1 iPad pro-grams. Despite the massive investments and expectations associated with 1:1 laptop programs, it still remains challenging to summarize the impacts across different initiatives. By definition, 1:1 programs only describe the access ratio of technology to students and say nothing about the actual teaching and learning practices. Most theorists and educators hold a general presumption that 1:1 access creates better opportunities for more constructivist pedagogies and student centered class-room environments, but truly the only unifying feature of any 1:1 program is the ubiquity of the student device, not a specific application or use. As such, different 1:1 programs can be initiated for vastly different purposes and have vastly different expectations for student outcomes.
With increased pressure for more quantitative outcomes, a number of studies have focused on the relationship between student achievement and participation in 1:1 laptop programs. In 2010, the Journal of Technology, Learning and Assessment published a special issue on empirical research from 1:1 technology settings and included three papers exploring student achievement outcomes. Studies from Massachusetts (Bebell & Kay, 2010), Texas (Shapley, Sheehan, Maloney, & Caranikas-Walker, 2010) and California (Suhr, Hernandez, Grimes, & Warschauer, 2010), each of which examined the impact of 1:1 participation and practices on measures of student achieve-ment and reported modest, yet statistically significant, impacts on English Language Arts perfor-mance.
Academic research focusing on 1:1 iPad implementations is still scarce, but there are numerous early adopters who have shared their objectives, experiences, and outcomes to date. Although all early efforts are to be applauded, from a purely research perspective the majority of currently available iPad research suffers from one or more methodological limitations, such as lack of con-trol groups or pre-iPad measures, small sample sizes, limited implementation periods, and a lack of objective outcome measures. Despite these limitations, there is still much to learn from past initiatives’ research models and emerging outcomes through a review of published academic re-search. Note that space restrictions do not allow for a summary of the emerging research address-ing the efficacy of specifically tailored iPad applications for special needs student populations (i.e., cortical visual impairment treatment) or studies conducted in post-secondary educational settings.
Considering the wide range of program objectives, implementation approaches, and uses, much of the first generation of iPad educational research varies widely in its scope, study design, and subsequent results. In our review we found no examples of true experimental design studies and few employing any objective outcome measures. Case studies and survey-based research are more plentiful and provide insights from those settings and individuals on the “cutting edge” of this new technology.
Despite a lack of pre-iPad measures or any a comparison group data, a case study of an iPad pro-gram at the Longfield Academy in Kent , England (NAACE, 2012) highlights how new technolo-

Impacts of 1:1 iPads
194
gies can be integrated into a wide range of teacher and student practices across the curriculum. Both students and teachers reported via surveys the most frequent student use of iPads occurred in English classes while 80% of participating teachers reported that their students “major use” of the iPads in class was researching topics online. Although the study did not employ quantifiable external assessment data, the vast majority of students and teachers reported strong positive feel-ings towards the efficacy of iPads for improving student achievement. As summarized in the conclusion of their 2012 report: “There has been a significant and very positive impact on learn-ing and teaching which, in time, should be reflected in achievement and attainment, thanks to both pedagogical changes and new ways of learning engendered by ‘any time anywhere’ access to information and learning tools.” Similarly, Henderson and Yeow (2012) offer an early explora-tion of the potential of iPads focused on early education using a case study methodology to demonstrate how shared iPads were employed at one early-adopting New Zealand school.
For an example of a study employing a more objective quantitative outcome measure, a 2010 mobile learning study conducted by US public broadcaster and television program distributor Public Broadcasting System (PBS) Kids and Rockman et al. investigated the impact of a 2-week implementation program where children played two PBS Apps using an iPod Touch under parent supervision (Chiong & Shuler, 2010). Although there was no comparison group and a short study duration, the researchers observed notable pre/post vocabulary and literacy gains for the 3 to 7 year old students with the “Martha Speaks: Dog Party” and “SuperWhy” Apps, respectively (Chiong & Shuler, 2010). Striating the gain scores by student age, the researchers reported, “5-year olds seemed to benefit most. They were less likely than the older children to know the words at pretest and more likely than the younger children to be developmentally ready to acquire profi-cient understanding of these new words and their meaning” (Chiong & Shuler, 2010, p. 18).
Similarly, a year-long Northwest PA quasi-experimental study investigated the impacts of iPad literacy-Apps on Kindergarteners’ acquisition of early literary skills (Cubelic & Larwin, 2014). In this study, 144 students used iPads through shared learning stations in their Kindergarten class-room to access a series of Apps targeting first sound fluency, phoneme segmentation fluency, and nonsense word fluency for approximately 50 minutes per week. Over the yearlong study period, students’ pre and post-iPad performance on the Dynamic Indicators of Basic Early Learning (DIBELS) Next assessment was compared to student results in comparison classrooms. Although not subscribing to the formal 1:1 student computing model, Cubelic and Larwin (2014) reported “promising” results, using objective pre/post assessment data to show that students in the iPad setting experienced “greater gains on higher learning skills of phoneme segmentation and non-sense word fluency” (p. 47). However, achievement gains in the iPad setting were not universal, with the 147 control group students demonstrating increased score gains on other assessment are-as (first sound and letter naming fluency).
As Cubelic and Larwin summarized in early 2014, “Despite commonly accepted indicators of positive potential, there exists a paucity of concrete evidence of the impact of technology, and specifically the use of iPad technology, on early student achievement” (p. 50). To complement and augment the early iPad research focused on describing the implementation and use of the de-vices, the current study instead focuses exclusively on exploring the potential academic outcomes of an iPad implementation program by exploring students’ ELA and Math achievement patterns. This paper describes two complementary quantitative studies that were undertaken from Fall 2011 to Spring 2014 when all of Auburn Maine Public School’s Kindergarten through second grade classrooms transitioned to a 1:1 iPad program featuring a range of ELA and Math apps. Both investigations, consisting of a 9-week randomized control trial and a 3-year longitudinal analysis of student achievement patterns, compare iPad-equipped student assessment patterns in ELA and math to previous historic patterns for early learners. Prior research indicates the poten-tial efficacy of such an implementation in that ELA (Cubelic & Larwin, 2014; NAACE, 2012)

Bebell & Pedulla
195
and early learners (Chiong & Shuler, 2010) have been associated with some of the greatest re-ported benefits from those studies examining different facets of their program’s impacts.
Setting and Conditions Auburn Public Schools encompasses six elementary, one middle school, and one high school serving approximately 3,660 PK-12 students from the small city of Auburn in central Maine. Across the school district, 54% of students receive free/reduced lunch and the annual per-pupil expenditure reported for the 2010/2011 school year was $8,052. In the 2010 census, over 93% of Auburn residents identified themselves as White.
Academic performance in the Auburn Pubic Schools is measured using a variety of district and state assessments across different grade levels and subject areas. According to the district’s NE-CAP (New England Common Assessment) scores, over half of all Auburn students demonstrated mastery of state literacy (63%) and math (60%) standards in the year prior to iPad implementa-tion. Indeed, such student assessment results actually sparked the district’s interest with 1:1 tech-nology in an effort to bolster performance amongst their earliest students. As detailed below, the Auburn iPad program was conceived and implemented with a uniquely focused goal of increasing students’ early literacy and numeracy achievement.
One of the challenges of any educational technology study is clearly defining (and accurately measuring) the outcome measure(s) or dependent variable(s) for a given implementation. Schools are unlike for-profit businesses where there is often a single, universal indicator of suc-cess (e.g., earnings or increased sales). Indeed, most elementary schools in the United States have a wide variety of aims, goals, and purposes within their community (Stemler & Bebell, 2012). As such, when considering the potential impacts or efficacy of a 1:1 iPad program, there are numerous outcome measures that can be potentially considered (Bebell & O’Dywer, 2010).
In April 2011, as one of the world’s first schools publicly to announce a 1:1 iPad program, Au-burn Public Schools initiated not only a local conversation, but a worldwide debate about the effi-cacy of educational technology for such young learners. Many responses were visceral without much consideration for the actual details of the program implementation. For example, an April 10, 2011 Twitter post from Diane Ravitch broadcast, “Kindergarten kids should be playing with blocks, sand, water, butterflies, musical instruments, not doing it all virtually” (Ravitch, 2011). The media coverage and international attention reached a zenith by mid-April when the Auburn Kindergarten iPad program was even spoofed on “The Tonight Show with Jay Leno” (Washuk, 2011). As summarized in an April 20, 2011 blog post, district administrator Mike Muir reported the district had been “pummeled by folks who think we’re wasting our money, and damaging our students” (Muir, 2011).
Facing such a wide range of criticism, the district responded through print and online sources with a very focused message defining the objectives and strategies behind their “iPad program”. Moreover, officials often cited the programs origins as part of a wider-district level initiative to increase historically lagging ELA and Math achievement in Auburn’s early elementary grades. Specifically, student performance as measured through annual district-wide ELA and Math achievement testing provided the indicators by which the initiative’s success was to be judged. In this sense, Auburn is unique amongst early iPad adopters in that leadership provided such a clear definition of their expected outcomes from their 1:1 implementation.
Throughout the Spring 2011, pilot Kindergarten teachers across the district experimented with implementing 1:1 iPad sets in their classes and formally evaluated different Apps targeting litera-cy and numeracy acquisition. Based on the positive internal feedback from this Spring 2011 pi-lot, the district moved forward with their plan to deploy 1:1 iPads across all of the district’s 16 Kindergarten classes for the 2011/2012 school year. As shown in Figure 1, over the next two

Impacts of 1:1 iPads
196
years a staggered grade-by-grade deployment occurred across the district such that by the 2013/2014 school year all Kindergarten, first grade, and second grade classrooms had 1:1 iPad access.
Figure 1: iPad implementation schedule by grade level and school year
The staggered 1:1 iPad implementation across grade levels and school year brought a saturation of new technology into these early learning classrooms. Given the district’s focus on student achievement outcomes, and the numerous published accounts and case studies exploring the im-plementation details of 1:1 iPad programs, the current research focuses almost exclusively on ex-ploring student outcomes and academic performance across the 1:1 iPad settings.
At the time of this report (and shown in Table 1) Kindergarten classes had three years of 1:1 iPad experience while second grade teachers had only completed their first year of implementation. As researchers, we recognize and expect variations in the fidelity and approach to using iPads across classrooms in the district, but had no available means for reliably controlling for such variations in the current investigation. As such, the study designs and data reported here present an admit-tedly narrow perspective, but do add empirical results, something that is lacking in most of the current literature.
Space constraints and more ample coverage in prior literature limit the detail and richness with which we describe how teachers and students incorporated and used iPads throughout our study setting. At minimum we offer a simple summary of the context and types of Apps that were ac-tively in use by teachers and students in this study. However, like much of the prior iPad litera-ture, this study suffers from having no independent variable measures to quantify the extent and variety of students’ and teachers’ practices. So, throughout both of the studies reported here, stu-dent experiences and learning conditions are simply categorized by their having 1:1 iPad access or not. Similarly, it is important to convey that students increased technology access may only have been the most outwardly visible component of the Auburn initiative. As district leader Mike Muir stated during the first full year of the Kindergarten implementation, “The objective has to be learning, not just getting the technology out there. We are paying attention to app selection and focused on continuous improvement — we aren’t just handing equipment to teachers” (Stokes, 2012). Recognizing the investments of the district in finding and aligning Apps to the curriculum, Table 1 provides an example of the most frequently used iPad Apps in Auburn Kindergarten clas-ses aligned to their Kindergarten Literacy targets.

Bebell & Pedulla
197
Table 1: Aligned Kindergarten Literacy targets and most frequently used iPad Apps in Auburn Kindergarten classes
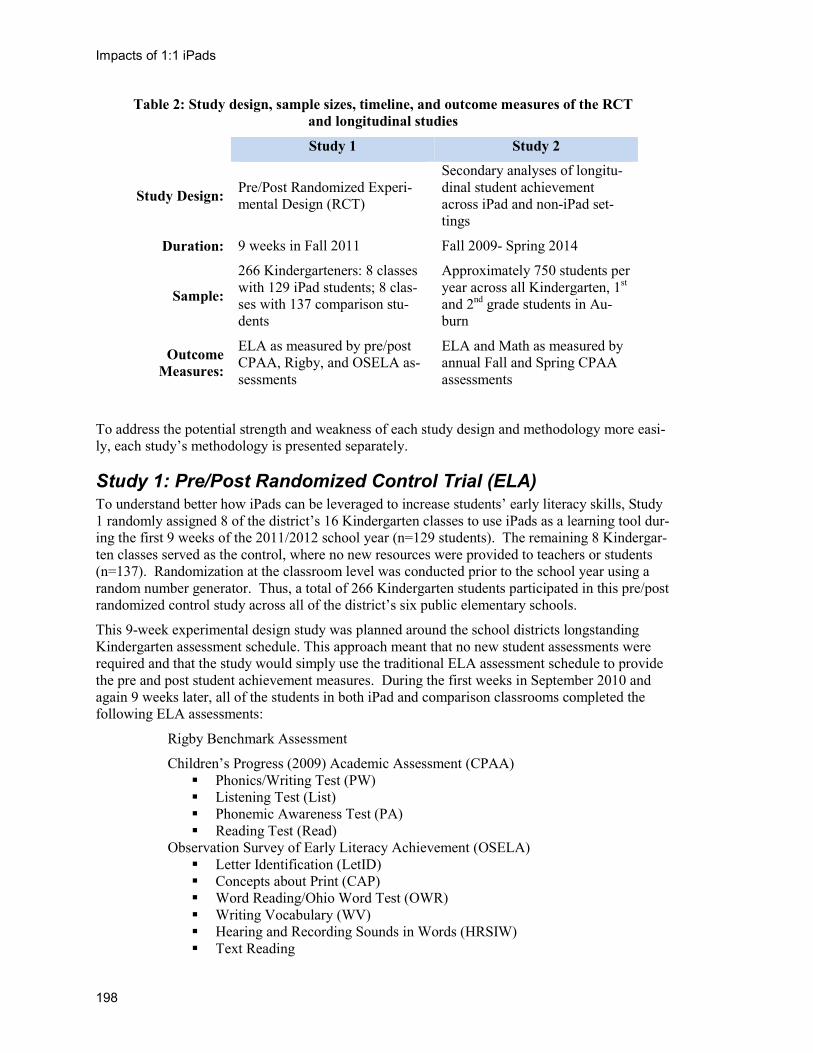
Methodology and Study Design Two related studies were undertaken using secondary analyses of student-level 2009-2014 ELA and Math achievement scores. Results were collected from Auburn students participating in the 1:1 iPad initiative (see Table 1) as well as from non-participants. Both studies examine the im-pact of early learners’ achievement in iPad and non-iPad settings and use the staggered deploy-ment schedule across grade levels to provide comparison opportunities. First, a 9-week pre/post randomized control trial investigating the impacts of 1:1 iPad access on Auburn Kindergarteners’ ELA achievement is presented, followed by a summary of a longitudinal analysis of Auburn’s K-2 students’ ELA and Math achievement since 2009. Table 2 summarizes the study design, sample sizes, timeline, and outcome measures across both of the studies presented here.
Impacts of 1:1 iPads
198
Table 2: Study design, sample sizes, timeline, and outcome measures of the RCT and longitudinal studies
Study 1 Study 2
Study Design: Pre/Post Randomized Experi-mental Design (RCT)
Secondary analyses of longitu-dinal student achievement across iPad and non-iPad set-tings
Duration: 9 weeks in Fall 2011 Fall 2009- Spring 2014
Sample:
266 Kindergarteners: 8 classes with 129 iPad students; 8 clas-ses with 137 comparison stu-dents
Approximately 750 students per year across all Kindergarten, 1st and 2nd grade students in Au-burn
Outcome Measures:
ELA as measured by pre/post CPAA, Rigby, and OSELA as-sessments
ELA and Math as measured by annual Fall and Spring CPAA assessments
To address the potential strength and weakness of each study design and methodology more easi-ly, each study’s methodology is presented separately.
Study 1: Pre/Post Randomized Control Trial (ELA) To understand better how iPads can be leveraged to increase students’ early literacy skills, Study 1 randomly assigned 8 of the district’s 16 Kindergarten classes to use iPads as a learning tool dur-ing the first 9 weeks of the 2011/2012 school year (n=129 students). The remaining 8 Kindergar-ten classes served as the control, where no new resources were provided to teachers or students (n=137). Randomization at the classroom level was conducted prior to the school year using a random number generator. Thus, a total of 266 Kindergarten students participated in this pre/post randomized control study across all of the district’s six public elementary schools.
This 9-week experimental design study was planned around the school districts longstanding Kindergarten assessment schedule. This approach meant that no new student assessments were required and that the study would simply use the traditional ELA assessment schedule to provide the pre and post student achievement measures. During the first weeks in September 2010 and again 9 weeks later, all of the students in both iPad and comparison classrooms completed the following ELA assessments:
Rigby Benchmark Assessment
Children’s Progress (2009) Academic Assessment (CPAA) Phonics/Writing Test (PW) Listening Test (List) Phonemic Awareness Test (PA) Reading Test (Read)
Observation Survey of Early Literacy Achievement (OSELA) Letter Identification (LetID) Concepts about Print (CAP) Word Reading/Ohio Word Test (OWR) Writing Vocabulary (WV) Hearing and Recording Sounds in Words (HRSIW) Text Reading
Bebell & Pedulla
199
Despite the obvious challenges of defining and measuring literacy in largely pre-literate children, the district’s assessment battery available for use here as dependent measures provides a spectrum of emerging literacy data. The CPAA is a commonly used assessment of early childhood learning in the United States developed by Northwest Evaluation Association (NWEA). There are few published accounts of using such assessments as outcome measures in educational technology studies, but the assessments are generally highly regarded and commonly employed by schools across the globe. For example, the Observation Survey of Early Literacy Achievement (OSELA) has been found to be both a reliable and valid measure of early literacy development (Clay, 2002; Denton, Ciancio, & Fletcher, 2006), and positively correlated with the Iowa Test of Basic Skills (Tang & Gómez-Bellengé, 2007).
Maintaining the same approach and customs as prior years, teachers and school aides facilitated all of the student assessments used in this study. Anonymous student level data from the pre and post assessments were provided by the school district to the researchers who cleaned and merged the data using MS Excel and SPSS. Analyses were performed using SPSS and results (Tables and Figures) were created in MS Excel.
Study 2: Longitudinal ELA and Math Achievement Trends The purpose of Study 2 was to explore potential trends in students ELA and Math achievement over the first three years of the iPad implementation period. Given the central role that the dis-trict placed on its early learners’ literacy and math achievement, student-level results from annual CPAA assessments provide an empirical, albeit limited, indication of the potential impacts from iPad adoption and implementation across the district’s early grade levels.
At the conclusion of the 9-week study period described in Study 1 (early December 2011), all of the districts’ comparison Kindergarten classrooms were provided with 1:1 iPad access for the re-mainder of the school year. Thus, 2011/2012 represented the first full year of district-wide iPad implementation. Since the district did not measure students’ frequency of iPad use, only compari-sons of students’ general level of access to iPads can be addressed. In other words, since there are no available measures of the frequency or duration that individual students engaged with dif-ferent ELA and Math APPs, we can only address the potential impacts of student access to iPads. Given that the student implementation was staggered across grade levels over three years and that the district has used the same assessments prior to the iPad initiative, comparisons in students’ ELA and Math performance over time in both iPad and non-iPad learning conditions provide some indication of potential impacts on student achievement. With no formal comparison groups available, trends for student performance with iPad access are simply compared to those students in grade levels that had not yet had access to iPads or to past achievement trends in pre-iPad con-ditions.
Thus, we can explore trends across student achievement before and during the staggered iPad de-ployment period using previously collected student assessment data from the district. To this end, all available K-3 student-level CPAA results from Fall 2009 to Spring 2014 were merged to allow analyses of performance trends across the district in the years prior to and during the iPad imple-mentation in:
ELA Reading ELA Phonics/Writing ELA Phonemic Awareness ELA Listening (Kindergarten only) Math Measurement Math Numeracy Math Operations Math Patterns
Impacts of 1:1 iPads
200
The CPAA is a widely used formative assessment for Kindergarten to second grade students’ ear-ly literacy and mathematics skills. As an adaptive assessment, readers should be aware that the CPAA assessment adjusts to student’s ability level and increases in difficulty over time such that test gets more challenging as students mature. As such, students could actually have greater liter-acy and math skills on a later assessment but be given a lower assessment score. The test is tradi-tionally administered three times annually (Fall, Winter, and Spring), but the current study only examines Fall and Spring results.
For each given grade level and year, we examined all of the district’s potential Kindergarten through second grade data whereby all study eligible students must have both a Fall and Spring assessment for each year. Thus, student sample sizes ranged from 249 to 334 across the different grades and years, representing the vast majority of the districts student population. Across all of our longitudinal analyses reported in Study 2, the mean number of students for a grade level was 285 with a standard deviation of 21.7.
Using the CPAA data, we examined the student achievement growth during each year (K, 1, 2) for each subtest. This involved calculating effect sizes to represent the average student growth from Fall to Spring each year. This allowed us to compare the effect sizes across iPad and non-iPad implementation years for patterns. In terms of credibility, the CPAA is widely used by many districts and generally exhibits high reliabilities for use with Kindergarten through second grade students.
Results We present the results of the 9-week randomized control trial first, followed by the results from the longitudinal analyses of ELA and math student performance in the district since 2009.
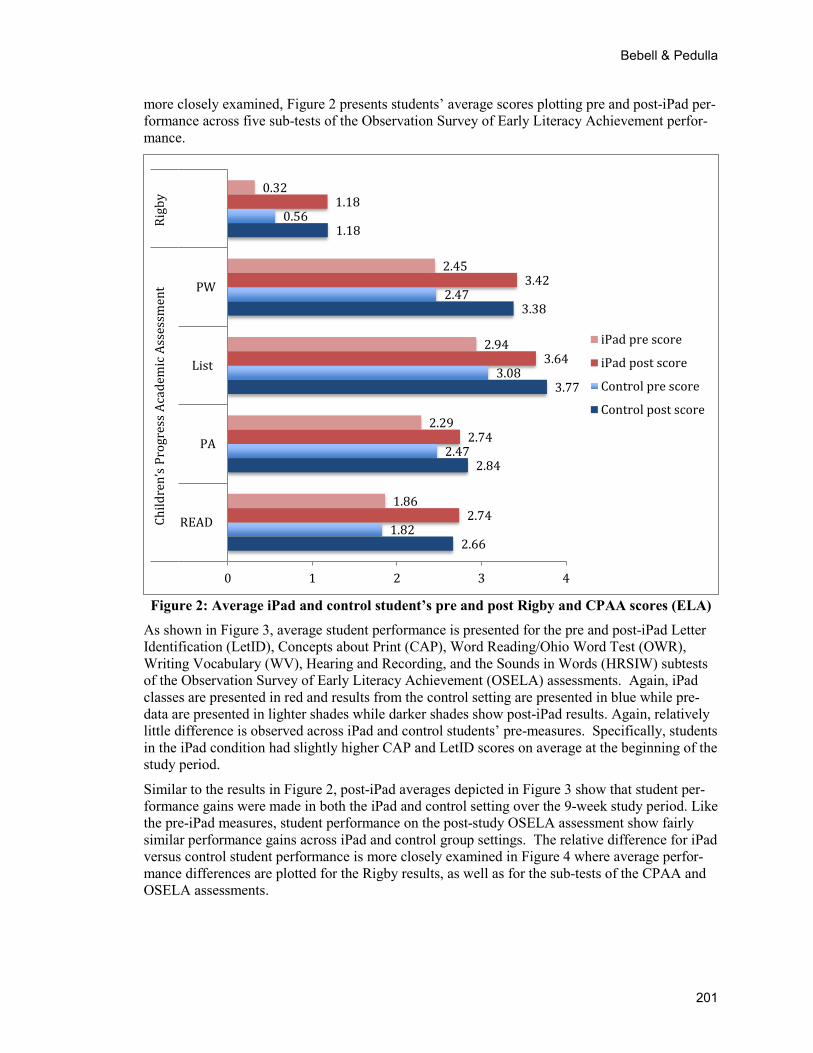
Study 1: Pre/Post Randomized Control Trial (ELA): To understand better how iPads can be leveraged to increase students’ early literacy skills, Study 1 summarizes a randomized control trial whereby students emerging ELA performance was ex-amined for 8 Kindergarten classes where iPads were provided for the first 12 weeks of the 2011/2012 school year. Pre and post assessment scores from the various literacy assessments were collected from both iPad and comparison settings to determine if students in the iPad set-tings performed any differently than students in the traditional (i.e., comparison/control) settings. Figure 1 shows both iPad and control students pre and post Rigby and CPAA scores in ELA dur-ing their first nine weeks of Kindergarten.
As shown in Figure 2, average student performance is presented for the pre and post-iPad Rigby and Phonics/Writing (PW), Listening (List), Phonemic Awareness (PA), and the Reading (Read) subtests of the CPAA assessments. Results for students randomly assigned to the iPad setting are presented in red while results from the control setting are presented in blue. Pre-iPad averages collected in the first weeks of the year are presented in a lighter shade while darker shaded results show the assessment averages from nine weeks later (post-measure). As expected in the pre-measure, there is relatively little difference across iPad and control student averages in pre-iPad conditions. If anything, students in the control settings scored slightly higher, on average, than the students in iPad settings, notably on the Rigby.
Post-scores from approximately nine weeks later show that across all subtests and assessments, student performance gains were made in both the iPad and control settings. Such results indicate that during the first months of Kindergarten students across all settings improved their relative CPAA and Rigby performance. Like the pre-iPad measures, student performance in the post-iPad setting on the Rigby and CPAA assessments show fairly similar performance patterns across iPad and non-iPad settings. Before the relative difference of iPad and control group performance is
Bebell & Pedulla
201
more closely examined, Figure 2 presents students’ average scores plotting pre and post-iPad per-formance across five sub-tests of the Observation Survey of Early Literacy Achievement perfor-mance.
Figure 2: Average iPad and control student’s pre and post Rigby and CPAA scores (ELA)
As shown in Figure 3, average student performance is presented for the pre and post-iPad Letter Identification (LetID), Concepts about Print (CAP), Word Reading/Ohio Word Test (OWR), Writing Vocabulary (WV), Hearing and Recording, and the Sounds in Words (HRSIW) subtests of the Observation Survey of Early Literacy Achievement (OSELA) assessments. Again, iPad classes are presented in red and results from the control setting are presented in blue while pre-data are presented in lighter shades while darker shades show post-iPad results. Again, relatively little difference is observed across iPad and control students’ pre-measures. Specifically, students in the iPad condition had slightly higher CAP and LetID scores on average at the beginning of the study period.
Similar to the results in Figure 2, post-iPad averages depicted in Figure 3 show that student per-formance gains were made in both the iPad and control setting over the 9-week study period. Like the pre-iPad measures, student performance on the post-study OSELA assessment show fairly similar performance gains across iPad and control group settings. The relative difference for iPad versus control student performance is more closely examined in Figure 4 where average perfor-mance differences are plotted for the Rigby results, as well as for the sub-tests of the CPAA and OSELA assessments.
2.66
2.84
3.77
3.38
1.18
1.82
2.47
3.08
2.47
0.56
2.74
2.74
3.64
3.42
1.18
1.86
2.29
2.94
2.45
0.32
0 1 2 3 4
READ
PA
List
PW
Child
ren’
s Pr
ogre
ss A
cade
mic
Ass
essm
ent
Rigb
y
iPad pre score
iPad post score
Control pre score
Control post score

Impacts of 1:1 iPads
202
Figure 3: Average iPad and control student’s pre and post Observation Survey of Early
Literacy Achievement performance
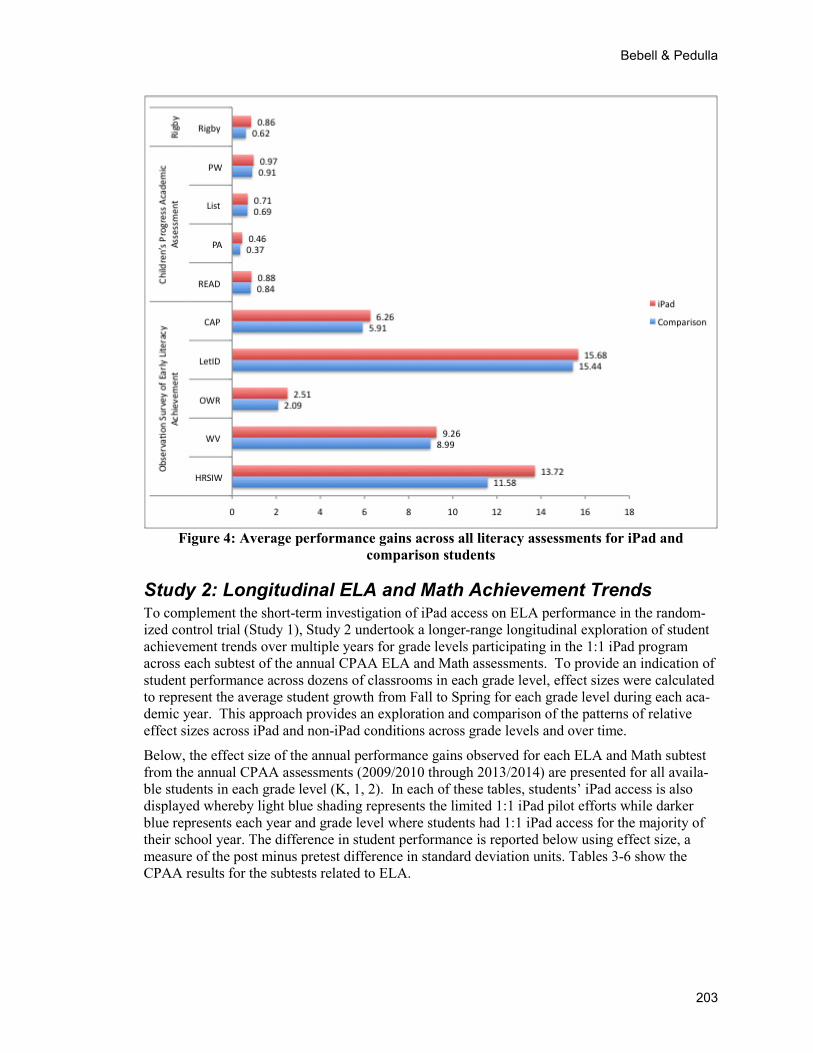
Figure 4 shows the average improvement across literacy assessments for iPad (in red) and com-parison students (in blue) during the Fall 2011 study period. Again, the results show that students in both settings made improvements in their Rigby, CPAA, and OSELA performance during their first months of Kindergarten. Comparing the RIGBY and CPAA gains from the iPad and com-parison settings, average gain scores were consistently greater for the iPad students than observed in the comparison settings. However, the differences in RIGBY and CPAA performance across the two groups were not large enough to be considered statistically significant.
The largest gains in student literacy were observed from the OSELA, where students in both set-tings showed marked improvement. However, comparing the OSELA gains from the iPad and comparison settings, gain scores were again consistently greater for the iPad students than were observed in the comparison settings. Most notably, students in the iPad setting exhibited a sub-stantial increase in their performance on the Hearing and Recording Sounds in Words (HRSIW) subtest, which asks children to identify letters that correspond to sounds making up words in a dictated sentence. Subsequent statistical analyses showed that, after controlling for student's in-coming Fall 2011 (pre-iPad) scores, the impact of being in an iPad classroom had a statistically significant relationship with students post-HRSIW scores (t= 2.36, p.<.05). After controlling for other variables, the 9-week impact was equivalent to a 2.1 point increase on the HRSIW subtest, on average, for the iPad cohort
16.93
11.91
2.93
45.72
13.53
5.36
2.92
0.84
30.28
7.61
19.09
11.56
3.26
47.17
14.44
5.36
2.30
0.74
31.49
8.18
0 10 20 30 40 50
HRSIW
WV
OWR
LetID
CAP
Obse
rvat
ion
Surv
ey o
f Ear
ly L
itera
cy A
chie
vem
ent
iPad pre score
iPad post score
Control pre score
Control post score
Bebell & Pedulla
203
Figure 4: Average performance gains across all literacy assessments for iPad and comparison students
Study 2: Longitudinal ELA and Math Achievement Trends To complement the short-term investigation of iPad access on ELA performance in the random-ized control trial (Study 1), Study 2 undertook a longer-range longitudinal exploration of student achievement trends over multiple years for grade levels participating in the 1:1 iPad program across each subtest of the annual CPAA ELA and Math assessments. To provide an indication of student performance across dozens of classrooms in each grade level, effect sizes were calculated to represent the average student growth from Fall to Spring for each grade level during each aca-demic year. This approach provides an exploration and comparison of the patterns of relative effect sizes across iPad and non-iPad conditions across grade levels and over time.
Below, the effect size of the annual performance gains observed for each ELA and Math subtest from the annual CPAA assessments (2009/2010 through 2013/2014) are presented for all availa-ble students in each grade level (K, 1, 2). In each of these tables, students’ iPad access is also displayed whereby light blue shading represents the limited 1:1 iPad pilot efforts while darker blue represents each year and grade level where students had 1:1 iPad access for the majority of their school year. The difference in student performance is reported below using effect size, a measure of the post minus pretest difference in standard deviation units. Tables 3-6 show the CPAA results for the subtests related to ELA.
Impacts of 1:1 iPads
204
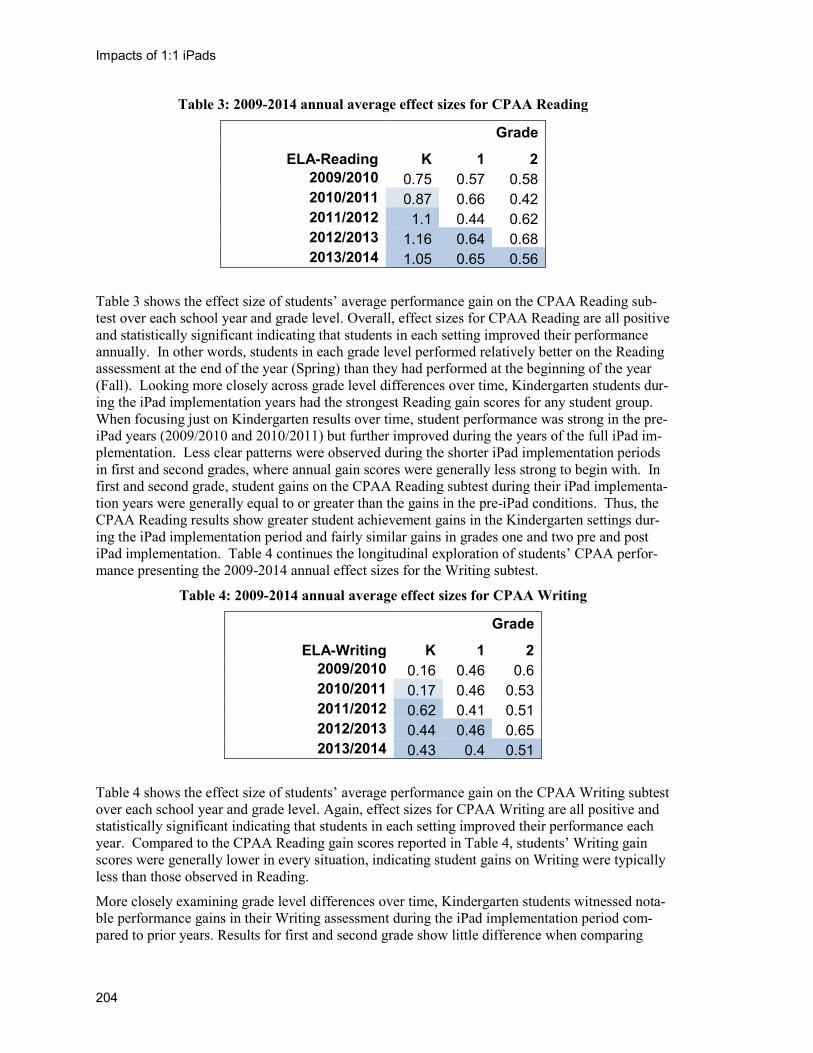
Table 3: 2009-2014 annual average effect sizes for CPAA Reading
Grade
ELA-Reading K 1 2 2009/2010 0.75 0.57 0.58 2010/2011 0.87 0.66 0.42 2011/2012 1.1 0.44 0.62 2012/2013 1.16 0.64 0.68 2013/2014 1.05 0.65 0.56
Table 3 shows the effect size of students’ average performance gain on the CPAA Reading sub-test over each school year and grade level. Overall, effect sizes for CPAA Reading are all positive and statistically significant indicating that students in each setting improved their performance annually. In other words, students in each grade level performed relatively better on the Reading assessment at the end of the year (Spring) than they had performed at the beginning of the year (Fall). Looking more closely across grade level differences over time, Kindergarten students dur-ing the iPad implementation years had the strongest Reading gain scores for any student group. When focusing just on Kindergarten results over time, student performance was strong in the pre-iPad years (2009/2010 and 2010/2011) but further improved during the years of the full iPad im-plementation. Less clear patterns were observed during the shorter iPad implementation periods in first and second grades, where annual gain scores were generally less strong to begin with. In first and second grade, student gains on the CPAA Reading subtest during their iPad implementa-tion years were generally equal to or greater than the gains in the pre-iPad conditions. Thus, the CPAA Reading results show greater student achievement gains in the Kindergarten settings dur-ing the iPad implementation period and fairly similar gains in grades one and two pre and post iPad implementation. Table 4 continues the longitudinal exploration of students’ CPAA perfor-mance presenting the 2009-2014 annual effect sizes for the Writing subtest.
Table 4: 2009-2014 annual average effect sizes for CPAA Writing
Grade
ELA-Writing K 1 2 2009/2010 0.16 0.46 0.6 2010/2011 0.17 0.46 0.53 2011/2012 0.62 0.41 0.51 2012/2013 0.44 0.46 0.65 2013/2014 0.43 0.4 0.51
Table 4 shows the effect size of students’ average performance gain on the CPAA Writing subtest over each school year and grade level. Again, effect sizes for CPAA Writing are all positive and statistically significant indicating that students in each setting improved their performance each year. Compared to the CPAA Reading gain scores reported in Table 4, students’ Writing gain scores were generally lower in every situation, indicating student gains on Writing were typically less than those observed in Reading.
More closely examining grade level differences over time, Kindergarten students witnessed nota-ble performance gains in their Writing assessment during the iPad implementation period com-pared to prior years. Results for first and second grade show little difference when comparing

Bebell & Pedulla
205
iPad and non-iPad years. In these grades, student performance on the CPAA Writing subtest dur-ing their iPad implementation years was quite similar to the range of gain scores reported in their pre-iPad conditions. In summary, the CPAA Writing results show stronger student achievement in the Kindergarten settings during the iPad implementation period and similar performance re-sults in grades one and two. Table 5 continues the longitudinal exploration of students’ CPAA performance by plotting the 2009-2014 annual effect sizes for the Phonemic Awareness subtest.
Table 5: 2009-2014 annual average effect sizes for CPAA Phonemic Awareness
Grade
ELA-Phonemic K 1 2 2009/2010 0.23 0.12 0.74 2010/2011 0.46 NS 0.32 2011/2012 0.41 0.16 0.31 2012/2013 0.56 NS 0.42 2013/2014 0.41 NS 0.34
NS=Non-significant (i.e., gain score change no different than that expected by chance)
Table 5 shows the student performance gains on the CPAA Phonemic Awareness subtest over each school year and grade level. Here, effect sizes for are mostly positive and statistically signif-icant, indicating that students in each setting improved their performance each year. However, first grade gains in three of the years were so small that they were no statistically significant. These non-significant effect sizes are indicated by “NS” in Table 5 and all subsequent tables.
Looking more closely across the grade level differences over time in Table 5, we see that Kinder-garten students show notable gains in Phonemic Awareness during the iPad implementation peri-od, gains that exceed those in the pre-implementation year. Similar to the Reading and Writing subtests, first and second grade results show little change when comparing iPad and non-iPad years. In other words, grade one and two performance on the CPAA Phonemic Awareness subtest over the iPad implementation years was fairly similar to the range of gain scores reported in their pre-iPad conditions. In summary, the Phonemic Awareness results show stronger student achievement gains in Kindergarten during the iPad implementation period and little difference in grades one and two performance results pre- and post-iPad implementation. Table 6 concludes the longitudinal exploration of students’ CPAA ELA performance by presenting the 2009-2014 an-nual effect sizes for the Listening subtest, which was only administered in Kindergarten.
Table 6: 2009-2014 annual average effect sizes for CPAA Listening
Grade
ELA-Listening K 2009/2010 NS 2010/2011 0.15 2011/2012 0.39 2012/2013 0.35 2013/2014 0.25
NS=Non-significant (i.e., gain score change no different than that expected by chance)
The effect sizes for the CPAA Listening subtest were generally positive indicating improvements in student achievement, although the effect sizes here tend to be smaller than those observed for Kindergarten students in other CPAA ELA subtests. What is notable is the larger gain scores

Impacts of 1:1 iPads
206
during the iPad implementation period, paralleling the Kindergarten results from the other ELA subtests. Tables 7-10 show the CPAA subtests related to Math performance.
Table 7: 2009-2014 annual average effect sizes for CPAA Measurement
Grade
Math-Measurement K 1 2 2009/2010 -0.7 0.3 NS 2010/2011 -0.74 0.16 -0.24 2011/2012 -0.45 0.44 -0.31 2012/2013 -0.24 0.36 -0.2 2013/2014 -0.24 0.35 -0.18
NS=Non-significant (i.e., gain score change no different than that expected by chance)
Table 7 shows the effect size of students’ average performance gains on the CPAA Measurement subtest over each school year and grade level. The effect sizes range dramatically by grade level and years. We see many instances of negative effect sizes, which indicate that students’ perfor-mance declined from pre to post test. Although Kindergarten effect sizes remained negative for the CPAA measurement exam in all years, the magnitude decreases as we progress through the iPad implementation years.
Less clear were the patterns observed during the shorter iPad implementation period in first and second grades, where annual gain scores appear generally more variable year-to-year. In first grade, student performance on the CPAA Measurement subtest was positive in every year. How-ever, student performance during iPad implementation years was generally similar to that of gain scores reported in pre-iPad years. In second grade, annual results were either non-significant or negative, a trend that was little changed during their first year iPad implementation (2013/2014). Table 8 continues the longitudinal exploration of students’ CPAA performance by presenting the 2009-2014 annual effect sizes for the Numeracy subtest.
Table 8: 2009-2014 annual average effect sizes for CPAA Numeracy
Grade
Math-Numeracy K 1 2 2009/2010 NS 0.28 -0.4 2010/2011 0.17 0.21 -0.23 2011/2012 0.15 0.36 -0.32 2012/2013 0.35 0.45 NS 2013/2014 NS 0.38 -0.18
NS=Non-significant (i.e., gain score change no different than that expected by chance)
Table 8 continues the longitudinal analyses of students’ average CPAA Math performance gains by presenting the Numeracy subtest across each available school year and grade level. Like the CPAA Measurement results, the effect sizes for the Numeracy subtest vary across grade levels and years and include negative, non-significant, and positive effect sizes. Looking at grade level differences over time, the Kindergarten results show increasing performance gains up to the third year of the program implementation (2013/2014). First grade results provide the most consistent results with positive effect sizes reported for all years, but no evidence of an iPad impact. Second grade results exhibit a decrease in students’ overall Numeracy performance from pre- to post test in most years, as indicated by the negative effect sizes and no real evidence of an iPad effect. Ta-
Bebell & Pedulla
207
ble 9 continues the longitudinal analyses of students’ Math performance by plotting the annual effect sizes for the Operations subtest of the CPAA.
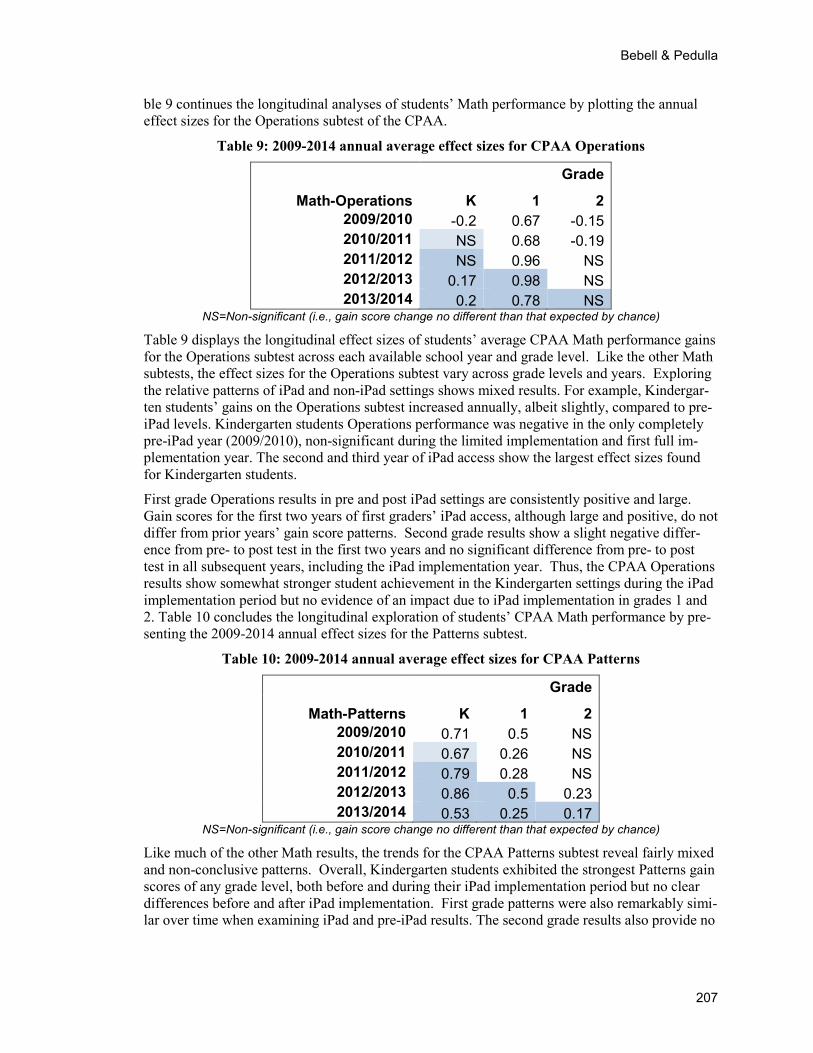
Table 9: 2009-2014 annual average effect sizes for CPAA Operations
Grade
Math-Operations K 1 2 2009/2010 -0.2 0.67 -0.15 2010/2011 NS 0.68 -0.19 2011/2012 NS 0.96 NS 2012/2013 0.17 0.98 NS 2013/2014 0.2 0.78 NS
NS=Non-significant (i.e., gain score change no different than that expected by chance)
Table 9 displays the longitudinal effect sizes of students’ average CPAA Math performance gains for the Operations subtest across each available school year and grade level. Like the other Math subtests, the effect sizes for the Operations subtest vary across grade levels and years. Exploring the relative patterns of iPad and non-iPad settings shows mixed results. For example, Kindergar-ten students’ gains on the Operations subtest increased annually, albeit slightly, compared to pre-iPad levels. Kindergarten students Operations performance was negative in the only completely pre-iPad year (2009/2010), non-significant during the limited implementation and first full im-plementation year. The second and third year of iPad access show the largest effect sizes found for Kindergarten students.
First grade Operations results in pre and post iPad settings are consistently positive and large. Gain scores for the first two years of first graders’ iPad access, although large and positive, do not differ from prior years’ gain score patterns. Second grade results show a slight negative differ-ence from pre- to post test in the first two years and no significant difference from pre- to post test in all subsequent years, including the iPad implementation year. Thus, the CPAA Operations results show somewhat stronger student achievement in the Kindergarten settings during the iPad implementation period but no evidence of an impact due to iPad implementation in grades 1 and 2. Table 10 concludes the longitudinal exploration of students’ CPAA Math performance by pre-senting the 2009-2014 annual effect sizes for the Patterns subtest.
Table 10: 2009-2014 annual average effect sizes for CPAA Patterns
Grade
Math-Patterns K 1 2 2009/2010 0.71 0.5 NS 2010/2011 0.67 0.26 NS 2011/2012 0.79 0.28 NS 2012/2013 0.86 0.5 0.23 2013/2014 0.53 0.25 0.17
NS=Non-significant (i.e., gain score change no different than that expected by chance)
Like much of the other Math results, the trends for the CPAA Patterns subtest reveal fairly mixed and non-conclusive patterns. Overall, Kindergarten students exhibited the strongest Patterns gain scores of any grade level, both before and during their iPad implementation period but no clear differences before and after iPad implementation. First grade patterns were also remarkably simi-lar over time when examining iPad and pre-iPad results. The second grade results also provide no
Impacts of 1:1 iPads
208
evidence of and effect due to iPad implementation. Thus, the CPAA Patterns subtest results pro-vide no indication that iPad access increased student performance on the Patterns subtest.
Overall, Tables 3-10 provide a long, broad view of student performance across a wide variety of ELA and Math performance indicators before and during the iPad implementation period in each grade level. Although these secondary analyses of student-level data across the entire school dis-trict do not allow for a definitive examination of the impact of the iPad-enabled practices, the re-sults may serve to illuminate potential impacts and inform future research efforts. For example, results across the ELA subtests appeared much more consistent and closely related to the iPad implementation period than those observed across the Math subtests. In other words, the poten-tial relationship between iPad access and increased student performance in this Auburn imple-mentation appears more consistent and more positive for ELA than for Math. Similarly, the longi-tudinal results suggest that the most positive impacts potentially related to the 1:1 iPad program occurred for the Kindergarten students rather than the first and second graders where results were generally more variable from year to year. To provide an additional means of summarizing such a complex series of grade-to grade achievement comparisons from year to year, we conclude the Results section of this paper with a summary of a repeated-measures analysis of the CPAA data for Kindergarten students from 2009-2014.
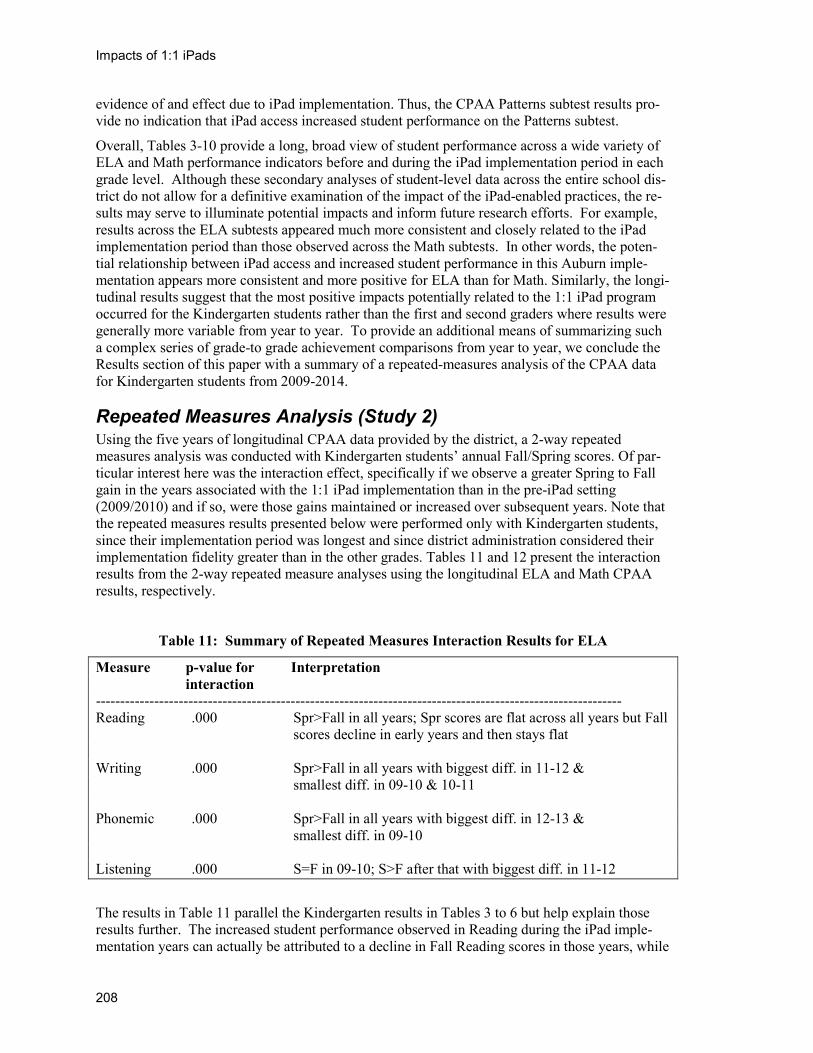
Repeated Measures Analysis (Study 2) Using the five years of longitudinal CPAA data provided by the district, a 2-way repeated measures analysis was conducted with Kindergarten students’ annual Fall/Spring scores. Of par-ticular interest here was the interaction effect, specifically if we observe a greater Spring to Fall gain in the years associated with the 1:1 iPad implementation than in the pre-iPad setting (2009/2010) and if so, were those gains maintained or increased over subsequent years. Note that the repeated measures results presented below were performed only with Kindergarten students, since their implementation period was longest and since district administration considered their implementation fidelity greater than in the other grades. Tables 11 and 12 present the interaction results from the 2-way repeated measure analyses using the longitudinal ELA and Math CPAA results, respectively.
Table 11: Summary of Repeated Measures Interaction Results for ELA
Measure p-value for Interpretation interaction ------------------------------------------------------------------------------------------------------------ Reading .000 Spr>Fall in all years; Spr scores are flat across all years but Fall
scores decline in early years and then stays flat Writing .000 Spr>Fall in all years with biggest diff. in 11-12 & smallest diff. in 09-10 & 10-11 Phonemic .000 Spr>Fall in all years with biggest diff. in 12-13 & smallest diff. in 09-10 Listening .000 S=F in 09-10; S>F after that with biggest diff. in 11-12
The results in Table 11 parallel the Kindergarten results in Tables 3 to 6 but help explain those results further. The increased student performance observed in Reading during the iPad imple-mentation years can actually be attributed to a decline in Fall Reading scores in those years, while

Bebell & Pedulla
209
Spring Reading scores stayed the same across all years. In other words, what appears to be an “iPad effect” in Table 3 is in part an artifact of the Fall Reading scores going down in the early years then staying flat and the Spring Reading scores staying flat over all years. Thus, the ob-served gains are still greater in the iPad implementation years but need to be interpreted in light of these long term trends in Fall performance.
Table 11 shows that for the CPAA Writing subtest the largest gain scores were observed in 2011-2012, the first full year of iPad implementation and the smallest in the prior two years, when there were no iPads (2009-2010) or very limited iPads (2010-2011). The remaining two years (2012-2013 and 2013-2014) showed moderate increases from Fall to Spring but not as large as those observed in 2011-2012. Thus, these results provide some evidence supporting the positive impact on students’ Writing achievement during the iPad implementation years, especially following the initial year of program implementation.
As shown in Table 11, there was a significant interaction effect for Phonemic Awareness with Spring scores greater than Fall in all years but with the smallest gain score occurring in a non-implementation year (2009-2010) and the largest gain occurring in 2012-2013. Overall, all ob-served gains in the implementation years were greater than those observed for the non-implementation period. Thus, the results provide some evidence supporting an effect during the implementation years on student’s Phonemic Awareness achievement.
Table 11 also shows that for the CPAA Listening subtest there was no difference observed in stu-dents’ Fall to Spring performance during the the non-implementation year (2009-2010). Howev-er, Spring student performance was greater than Fall scores for students’ Listening achievement across all of the iPad implementation years with the largest gain scores occurring in 2011-2012. Again, such repeated-measures results provide some emerging evidence supporting the positive impact of iPad access on student’s Listening achievement. The longitudinal analyses of Auburn students’ CPAA achievement is concluded below in Table 12 where the interaction results from the repeated measure analyses are presented across the math subtests.
Table 12: Repeated Measures Interaction Results for Math
Measure p-value for Interpretation interaction ------------------------------------------------------------------------------------------------------------ Measurement .000 Fall > Spr in all years; no iPad effect Numeracy .029 Spr much >Fall in 12-13; small or ns diff. in other years Operations .000 Fall>Spr in 09-10 & 10-11; Spr>Fall in all remaining years with diff. increasing each year Patterns .052 No sig. interaction here
Table 12 presents the interaction results across five years of Kindergarten students’ annual CPAA Math results. As with ELA, these results help in understanding the results presented separately across years and subtests in Tables 7 to 10. For the CPAA Measurement subtest, we observed a significant interaction, however the Fall scores were greater than the Spring scores in all years. Thus, there was no indication of any potential effect concerning Auburn students’ Measurement achievement during the iPad implementation period. For the Numeracy subtest we observed a statistically significant interaction effect (.000) which was attributable to Spring scores being much greater than Fall scores in 2012-2013 but with little to no difference in the other years. This
Impacts of 1:1 iPads
210
finding provides some slight evidence that students Numeracy achievement may be related to their iPad access, but the results are not consistent or particularly compelling.
Table 12 also shows there was a significant interaction effect for the Operations subtest in Math. In the earliest two years (prior to iPad implementation 2009-2010 and during the partial pilot test-ing in 2010-2011) the Fall scores were slightly higher than the Spring scores. This trend reversed starting in 2011-2012 where Spring scores were increasingly higher than Fall scores in each suc-ceeding year. Thus, we have some emerging evidence of a potential iPad implementation effect for the Operations subtest in Math, especially in the more mature implementation settings. Final-ly, for the CPAA Patterns subtest, we observed no significant interaction effect. Here, Spring scores were consistently higher than the Fall scores in all years, including the non-implementation year (2009-2010). Although this may be a positive result for the district, it does not suggest there was any iPad implementation effect on students’ Operations achievement.
Summary of Findings As with most district-initiated studies, the longitudinal results of Study 2 can only provide quali-fied statements about the impact of iPad implementation on student achievement. Given the study design, we are unable to make any causal statements about the long-term achievement impacts of 1:1 iPad based on the available longitudinal data. In contrast, the randomized control trial de-scribed in Study 1 utilizes a research design that allows for causal statements, but suffers primari-ly from a short duration. With these caveats, we will summarize our findings below.
Across the ten different ELA subtests measured in the 9-week randomized control trial, iPad stu-dents showed greater pre-post gain scores in their ELA performance than students in the control group. However, for only one of these measures, the Hearing and Recording Sounds in Words subtest, was student performance different enough between the groups to be statistically signifi-cant. Thus, Study 1 results clearly show the desired trend across student performance indicators, but only provide us limited evidence of an ELA effect favoring iPad usage. However, the timeframe for Study 1 was only nine weeks, which may be too short of an implementation period to expect any larger gains to emerge, if they do exist.
The longitudinal analyses of students’ ELA and Math scores described in Study 2 also provided mixed findings related to iPad access. For Reading, student performance gains were quite strong in Kindergarten across all years, but were even greater in the last three years of the iPad imple-mentation. At first, this appears to provide some evidence of the impact of iPads on Reading at the Kindergarten level, but a deeper look into the data show that the difference in gain scores over time is attributable, in part, to lower pretest scores in the later years while post test scores re-mained similar across all years. Although this finding tempers the Reading achievement gains, it remained that students Reading performance indeed improved more in the later years. For grades 1 and 2, no differences over time were observed in Reading.
The impact for Writing was a bit clearer. At the Kindergarten level, we observed greater pre-post gains after the introduction of iPads, and further analysis did not show the same pattern we re-ported above for Reading. Thus, we have some more emerging evidence of iPad effectiveness in the area of Writing for Kindergarten students. The longitudinal data provided no evidence of any iPad effects for grades 1 and 2 in Writing.
Increased pre-post gains for Phonemic Awareness were observed for Kindergarten students dur-ing the iPad implementation period. Theses increases were modest but consistent, providing some indication of iPad effectiveness in increasing students Phonemic Awareness. There were no dif-ferences observed across the years in Phonemic Awareness performance for grades 1 and 2. The pattern for the CPAA Listening subtest was similar to that of Phonemic Awareness.

Bebell & Pedulla
211
In terms of Math achievement, the data collected and analyzed in Study 2 revealed no evidence of gains in student performance related to iPad implementation for any of the Math subtests at any grade levels.
Discussion and Conclusion The ratio of students to computing devices in schools, a common metric for indicating students’ access to computing devices, shows the precipitous change in student access to these devices. In 1983, an average of 125 U.S. students shared a single computer (125:1). By 2011, U.S. students’ access had increased more than 40-fold, with 3 students per computing device (3:1) and nearly 100% of U.S. classrooms connected to the Internet (Russell, Bebell, & Higgins, 2004; Snyder & Dillow, 2012). As computing technologies become even more widespread across culture and in-dustry, the role of computing technologies in education will undoubtedly continue to grow and evolve (International Society for Technology in Education, 2009; Partnership for 21st Century Skills, 2008; Papert, 1996). At the time of this article, the iPad represents perhaps the single most widely adopted new educational technology device in US schools. Despite their incredible popularlity, there remain very few empirical research studies that address the impacts of the teaching and learning conditions afforded by iPads in the classroom.
Any school evaluating any type of innovative educational technology program must identify and define its objectives and goals across different stakeholders. In the current study, the district fo-cus was clearly on the cognitive achievement of early learners in their traditional public school setting. The fact that Auburn schools had such unitary and clearly defined program outcomes so early in their implementation process is notable and quite rare. In Auburn, like many schools working independently to leverage technology in the classroom, program goals were not focused on the technology per se, but on the teaching and learning practices afforded by the technology to improve student achievement in ELA and Math.
Although this research was undertaken voluntarily with no cost to the district, Auburn Public Schools should be applauded for so seriously engaging in research and evaluation from the very beginning of their iPad implementation. In Fall 2011, randomly assigning Kindergarten class-rooms to accommodate a research study was not a widely popular move, particularly for those “control group” teachers who were excited and anxious to begin using iPads with students in their class. This teacher sentiment appears to underscore the general enthusiasm expressed by the vast majority of teachers involved with the initiative, but was not systematically recorded or reported in this study.
Often, educational research is conducted top-down such that the educational researcher develops the research agenda and determines the study outcomes before recruiting schools to participate in a research endeavor. The current investigation was designed and tailored specifically to the dis-trict’s goals/outcomes as well as their existing iPad implementation schedule. This study was conducted in close partnership with school and district leadership to leverage their existing re-sources and conditions, but the resulting study was similarly limited by the real-world constraints of the implementation schedule and available outcome measures. Indeed, this study employed a narrow measure of success (the cognitive achievement as measured by available ELA and Math assessments). This focus is particularly narrow when considering the wider range of school goals typically espoused by public elementary schools including students’ emotional, social, and physi-cal development.
In general, developing a clear and succinct return on investment (ROI) is nearly impossible to calculate for an implementation such as this. Although the cost of the iPad device is simple to calculate for each student per year, the associated (and seemingly quite necessary) costs of addi-tional networks, Apps/software, professional development, and ongoing technical and curricular

Impacts of 1:1 iPads
212
support are difficult to isolate and quantify. Similarly, potential cost savings resulting from de-creased use of traditional textbooks, copying, and printing budgets can be equally hard to isolate and measure. Again, both a strength and weakness of the current study is the use of clear, quanti-tative, outcome measures.
Given the variety of reported results across grade levels, implementation years, and across the different ELA and Math outcome measures, summarizing the overall results trends is challenging. Proponents of educational technology will be encouraged and cite the data and emerging evi-dence supporting the view that iPad access was related to measurable impacts of student achievement. Particularly for Kindergarteners in ELA, these results provide some of the first em-pirical data demonstrating the potential relationship between students’ iPad access and increased student achievement.
Looking across the results, the findings may provide some support for the thesis that one can im-pact learning with iPads by providing appropriate supports in the form of training and apps to teachers. Both studies described here provide emerging evidence that ELA achievement was more positively impacted than Math. Similarly, results from Kindergarten were more consistent and more positive than in other grade levels. Based on the district’s implementation schedule, we know the Kindergarten classes had the longest implementation period. Similarly, based on the district administrators’ perspective, we know that greater professional development resources and emphasis were leveraged towards ELA and primarily at the Kindergarten level before and during the implementation period. The fact that this is where we see the clearest impact is important to highlight. Although the study design does not allow us to elucidate such results further, the emerging evidence from Auburn favoring ELA achievement particularly in Kindergarten is com-pelling.
On the other hand, this study also provides emerging evidence and data showing that the positive impacts associated with students’ iPad access was far from universal. Indeed, there were substan-tial variations across grade levels and subject areas in terms of the student outcomes. Critics of educational technology will find that these results speak to the inherent complexity and challeng-es of implementing (and studying) such far-reaching educational initiative.
It is clear that more advanced and nuanced research is needed in this field. Future research efforts must overcome a number of challenges in isolating and measuring the specific teaching and learn-ing practices afforded by 1:1 iPad access. Indeed, a research design whereby students’ usage of specific Apps is measured and quantified would allow a much richer conversation about the evo-lution of teaching and learning practices and the resulting impacts of these practices. Methodo-logical examples of such approaches are somewhat rare, but prior studies have applied such methods and approaches to study of 1:1 laptop programs and other educational investments (Be-bell & O’Dwyer, 2010).
Not only will more nuanced research provide educators, administrators, and policy makers with increased data and resources to inform the adoption and use of the next generation of educational technology tools, but schools themselves need to grow increasingly comfortable and conversant with educational research and evaluation opportunities. Indeed, schools of tomorrow will have far greater access to a wider range of data and information than ever imagined before (Bebell, Luthra, & Chaudhuri, 2014). This study provides one example of an effort where a district lever-aged its own existing data to better inform its own long-term policies and practices. It is our hope that by reporting these efforts and emerging results from Auburn, we will serve to encourage oth-ers to undertake and share similar investigations customized to their own context, goals, and out-comes.

Bebell & Pedulla
213
References Alberta Education. (2012). iPads: What are we learning?: Summary report of provincial data gathering
day October 3, 2011. Edmonton, Alberta. Retrieved from: http://education.alberta.ca/media/664652/ipad%20report%20-%20final%20version%202012-03-20.pdf
Apple. (2014). Apple reports first quarter results. Cupertino, CA: Apple Press. Retrieved from: http://www.apple.com/pr/library/2014/01/27Apple-Reports-First-Quarter-Results.html
Bebell, D., & Kay, R. (2010). One to one computing: A summary of the quantitative results from the Berk-shire Wireless Learning Initiative. The Journal of Technology, Learning and Assessment, 9(2). Re-trieved from http://ejournals.bc.edu/ojs/index.php/jtla/article/view/1607
Bebell, D., & O'Dwyer, L. M. (2010). Educational outcomes and research from 1:1 computing settings. The Journal of Technology, Learning, and Assessment, 9(1), 1-15.
Bebell, D., Luthra, S., & Chaudhuri, S. (2014). Collaboration and research in international schools. Future Forwards, 2(1), 57-68. Retrieved from http://www.asbfutureforwards-digital.com/asbfutureforwards/vol2#pg61
Chiong, C., & Shuler, C. (2010). Learning: Is there an app for that? Investigations of young children's us-age and learning with mobile devices and apps. New York, NY: The Joan Ganz Cooney Center at Ses-ame Workshop; 2010. Retrieved from: http://www.joanganzcooneycenter.org/publication/learning-is-there-an-app-for-that/
Clay, M. (2002). An observation survey of early literacy achievement. Portsmouth, NH: Heinemann.
Children’s Progress. (2009). Children’s progress technical report. New York City, NY: Children’s Pro-gress, Inc.
Costello, S. (2014). How many Apps are in the iPhone App Store? Retrieved from http://ipod.about.com/od/iphonesoftwareterms/qt/apps-in-app-store.htm
Cubelic, C., & Larwin, K. (2014). The use of iPad technology in the Kindergarten classroom: A quasi-experimental investigation of the impact on early literacy skills. Comprehensive Journal of Educa-tional Research, 2(4), 47-59.
Denton, C. A., Ciancio, D. J., & Fletcher, J. M. (2006). Validity, reliability, and utility of the observation survey of early literacy achievement. Reading Research Quarterly, 41(1), 8-34.
Henderson, S., & Yeow, J. (2012). iPad in education: A case study of iPad adoption and use in a primary school. Paper presented at the 2012 45th Hawaii International Conference on System Science (HICSS). Retrieved from http://www.computer.org/csdl/proceedings/hicss/2012/4525/00/4525a078.pdf
International Society for Technology in Education. (2009). NETS for students: Global learning in a digital age. Retrieved from http://www.iste.org/Content/NavigationMenu/NETS/ForStudents/NETS_for_Students.htm
Jaffarian, J. (2012). The impacts of specific applications on phonic instruction in Kindergarten students. St. John Fisher College: Education Masters. Paper 211.
Lathrop, L. E. (1826). Remarks on the general condition of agriculture: The farmer’s library (2nd ed.). Windsor, VT: Wyman Spooner.
Muir, M. (2011). Rumors of our locking kindergarteners in closets with iPads are greatly exaggerated. “Multiple Pathways" Blog Post Retrieved from http://multiplepathways.wordpress.com/2011/04/20/rumors-of-our-locking-kindergarteners-in-closets-with-ipads-are-greatly-exaggerated/
NAACE. (2012), The iPad as a tool for education - A study of the introduction of iPads at Longfield Acad-emy, Kent. Kent, England. Retrieved from http://www.naace.co.uk/publications/longfieldipadresearch
Papert, S. (1996). The connected family: Bridging the digital generation gap. Atlanta, GA: Long Street Press.
Impacts of 1:1 iPads
214
Partnership for 21st Century Skills. (2008). 21st Century Skills: Education and Competitiveness: A Re-source and Policy Guide. Tucson, AZ: Author.
Ravitch, D. (2011). Kindergarten kids should be playing with blocks, sand, water, butterflies, musical in-struments, not doing it all virtually. April 10, 2011 Twitter post @DianeRavitch
Ritchie, R. (2014). History of the iPad: Apple makes the tablet magical and revolutionary. Retrieved from http://www.imore.com/history-ipad-2010
Richtel, M. (2011, Sept. 3). In classroom of the future, stagnant scores. New York Times. Retrieved May 30, 2014, from http://www.nytimes.com/2011/09/04/technology/technology-in-schools-faces-questions-on-value.html?pagewanted=all&_r=0
Russell, M., Bebell, D., & Higgins, J. (2004). Laptop learning: A comparison of teaching and learning in upper elementary equipped with shared carts of laptops and permanent 1:1 laptops. Journal of Educational Computing Research., 30(3), 313-330.
Shapley, K., Sheehan, D., Maloney, C., & Caranikas-Walker, F. (2010). Evaluating the implementation fidelity of technology immersion and its relationship with student achievement. The Journal of Technology, Learning, and Assessment, 9(4).
Snyder, T. D., & Dillow, S. A. (2012). Digest of education statistics 2011 (NCES 2012-001). National Cen-ter for Education Statistics, Institute of Education Sciences, U.S. Department of Education. Washing-ton, DC: U.S. Government Printing Office.
Stemler, S. E., & Bebell, D. (2012). The school mission statement: Values, goals, and identities in Ameri-can education. New York: Routledge.
Stokes, K. (2012). Do iPads really boost test scores? February 24, 2012. Indiana Public Media. Retrieved from http://indianapublicmedia.org/stateimpact/2012/02/24/do-ipads-really-boost-test-scores/
Suhr, K. A., Hernandez, D. A., Grimes, D., & Warschauer, M. (2010). Laptops and fourth grade literacy: Assisting the jump over the fourth-grade slump. The Journal of Technology, Learning, and Assessment, 9(5). Retrieved January 2010, from http://escholarship.bc.edu/jtla/vol9/5/
Tang, M., & Gómez-Bellengé, F. X. (2007, April.). Dimensionality and concurrent validity of the observa-tion survey of early literacy achievement. Paper presented at the annual meeting of the American Edu-cational Research Association in Chicago, Illinois.
Washuk, B. (2011, April 18). Auburn’s iPad2 Story Makes Jay Leno. Lewiston Sun Journal.
Weston, M. E., & Bain, A. (2010, January). The end of the techno-critique: The naked truth about 1:1 lap-top initiatives and education change. The Journal of Technology, Learning, and Assessment, 9(6). Retrieved January 20, 2010, from http://escholarship.bc.edu/jtla/vol9/6/
Winkler, R. (2014, January 23). Chromebooks take other mobile PC’s to school. Wall Street Journal. Re-trieved from http://online.wsj.com/articles/SB10001424052702304856504579338941198812358

Bebell & Pedulla
215
Biographies Dr. Damian Bebell is an Assistant Research Professor at Boston Col-lege’s Lynch School of Education and a Senior Research Associate at the Center for the Study of Testing, Evaluation, and Educational Poli-cy. Over the past fifteen year, Damian has led numerous research and evaluation studies investigating the effects of 1-to-1 technology pro-grams and other computer-based technology tools on teaching and learning across wide range of educational settings. In 2010, Damian served as guest editor for the Journal of Technology, Learning, and Assessment producing the first collection of peer-reviewed research studies from 1:1 computing environments. Damian is the founding
Researcher for the Technology Use and Beliefs Study at the International Research Collaborative where he conducts longitudinal research and evaluation studies with international school partners. Damian is an active advocate for the use of research, measurement, and evaluation in document-ing and evolving teacher and learning practices.
Joseph J. Pedulla has a Ph.D. in Educational Research, Measurement and Evaluation from Boston College. He was trained through the Mas-ter’s degree level in mathematics and taught at the secondary level for 4 years. He taught courses in test development, program evaluation, research design and statistics as an Associate Professor at Boston Col-lege for over 30 years retiring from this faculty position in 2012. He is currently a Research Associate Professor at Boston College. He has examined and published most recently on the effectiveness of online professional development for teachers; improving teacher training pro-grams; and teachers’ views of large scale, high stakes testing programs.
He is currently examining the effectiveness of various technological innovations in college class-rooms.