A quantitative assessment of the sensitivity of the ...49490/... · midlatitude flow response to...
10
Research Collection Journal Article A quantitative assessment of the sensitivity of the downstream midlatitude flow response to extratropical transition of tropical cyclones Author(s): Grams, Christian M.; Lang, Simon T.K.; Keller, Julia H. Publication Date: 2015-11-16 Permanent Link: https://doi.org/10.3929/ethz-a-010689209 Originally published in: Geophysical Research Letters 42(21), http://doi.org/10.1002/2015GL065764 Rights / License: In Copyright - Non-Commercial Use Permitted This page was generated automatically upon download from the ETH Zurich Research Collection . For more information please consult the Terms of use . ETH Library
Transcript of A quantitative assessment of the sensitivity of the ...49490/... · midlatitude flow response to...
Research Collection
Journal Article
A quantitative assessment of the sensitivity of the downstreammidlatitude flow response to extratropical transition of tropicalcyclones
Author(s): Grams, Christian M.; Lang, Simon T.K.; Keller, Julia H.
Publication Date: 2015-11-16
Permanent Link: https://doi.org/10.3929/ethz-a-010689209
Originally published in: Geophysical Research Letters 42(21), http://doi.org/10.1002/2015GL065764
Rights / License: In Copyright - Non-Commercial Use Permitted
This page was generated automatically upon download from the ETH Zurich Research Collection. For moreinformation please consult the Terms of use.
ETH Library
Geophysical Research Letters
A quantitative assessment of the sensitivityof the downstream midlatitude flowresponse to extratropical transitionof tropical cyclones
Christian M. Grams1,2, Simon T. K. Lang1, and Julia H. Keller1
1Institute for Meteorology and Climate Research (IMK-TRO), Karlsruhe Institute of Technology, Karlsruhe, Germany,2Institute for Atmospheric and Climate Science, ETH Zurich, Zurich, Switzerland
Abstract During extratropical transition (ET) of tropical cyclones (TC) reduced predictability for themidlatitude flow is often observed. In this study we assess the sensitivity of the midlatitude flow responseto ET. To this end, a simple novel metric, the “equivalent forecast hour difference,” is introduced and appliedto experimental simulations for eight recent ET events, in which the TC has been removed or relocated.Early during ET, the midlatitude flow response is sensitive to ridgebuilding directly downstream of thetransitioning TC. In cases with strong ridgebuilding and Rossby wave triggering, the sensitivity remainshigh. The midlatitude flow response is even more sensitive to error in the initial position of the TC. Thisstudy newly quantifies the high degree of sensitivity of the downstream midlatitude flow response to ET. Itcorroborates the need for correct tropical cyclogenesis and TC track forecasts for improving midlatitudenumerical weather prediction during ET.
1. Introduction
A tropical cyclone (TC) that moves poleward often undergoes a complex interaction with the midlatitudeflow that is referred to as extratropical transition (ET) [Jones et al., 2003]. The diabatically enhanced TC outflowmay interact with the upper-level midlatitude flow, resulting in the formation of a jet streak and ridgebuildingdirectly downstream of the transitioning TC [Atallah and Bosart, 2003; Grams et al., 2013a; Archambault et al.,2013]. This perturbation of the midlatitude upper-level waveguide may continue downstream and trigger theformation or amplification of a Rossby wave train (RWT) [e.g., Harr and Dea, 2009; Agustí-Panareda et al., 2004;Riemer et al., 2008; Archambault et al., 2015; Quinting and Jones, 2015; Torn and Hakim, 2015].
The track and intensity of the transitioning TC, and the downstream impact of ET, critically depend upon therelative position of the TC with respect to the midlatitude flow [Ritchie and Elsberry, 2007; Grams et al., 2013b;Riemer and Jones, 2014]. Therefore, small error in the TC track relative to midlatitude flow features can trans-late into error of the amplitude and phasing of a downstream RWT. This explains the reduced predictabilityin downstream regions often observed during ET [Harr et al., 2008; Anwender et al., 2008; Aiyyer, 2015]. Thereduction in predictability during ET is a major challenge in current operational numerical weather prediction(NWP). Recently, Keller et al. [2011] documented the variety of possible ET forecast scenarios in operationalensemble NWP models. On the other hand, Magnusson et al. [2014] showed that an accurate forecast of thetrack and environmental flow by the ECMWF IFS model during the ET of Hurricane Sandy (2012) led to a goodforecast of Sandy’s midlatitude impacts.
In this study, we assess the sensitivity of the midlatitude large-scale flow response to ET events. Numericalsimulations are carried out demonstrating the sensitivity of the forecast to ET forecast error, such as a missedtropical cyclogenesis, track error, or a wrongly predicted decay of the TC for eight recent northern hemisphericET cases, covering a typical spectrum of ET events (supporting information Texts S2 and S4).
2. COSMO Simulations for Eight Recent ET Cases
Simulations with the regional COSMO model (COnsortium for Small-scale MOdelling, Version 4.13) [Steppeleret al., 2003; Schättler et al., 2009] are the data basis for this study. The ECMWF high-resolution analysis at
RESEARCH LETTER10.1002/2015GL065764
Key Points:• Midlatitude flow response highly
sensitive to the presence of ET and toTC track error
• Sensitivity is due to directTC-midlatitude flow interactionand later due to downstreamdevelopment
• Poorly represented ET in NWP hashigh potential to degrade midlatitudeforecast skill
Supporting Information:• Supporting Information S1
Correspondence to:C. M. Grams,[email protected]
Citation:Grams, C. M., S. T. K. Lang, andJ. H. Keller (2015), A quantita-tive assessment of the sensitivityof the downstream midlatitudeflow response to extratropicaltransition of tropical cyclones, Geo-phys. Res. Lett., 42, 9521–9529,doi:10.1002/2015GL065764.
Received 12 AUG 2015
Accepted 29 SEP 2015
Accepted article online 5 OCT 2015
Published online 11 NOV 2015
©2015. American Geophysical Union.All Rights Reserved.
GRAMS ET AL. MIDLATITUDE FLOW RESPONSE TO TROPICAL CYCLONES 9521

Geophysical Research Letters 10.1002/2015GL065764
Figure 1. Geopotential height (1175, 1200, 1225 gpdm contours) at 200 hPa in the COSMO control (solid) and no-TCsimulation (dashed), and difference control minus no-TC (shaded every 10 gpdm, 0 gpdm omitted) for TyphoonChoi-Wan at +36 h, +72 h, and +108 h.
0.25∘ grid spacing provides the initial and boundary conditions. The horizontal grid spacing of the COSMOsimulations is 0.25∘, and 80 vertical levels are used. The model domain spans an entire ocean basin(Table S1). The investigated cases are Western North Pacific Typhoons Jangmi (2008), Choi-Wan (2009), Lupit(2009), and Malakas (2010) and North Atlantic Hurricanes Hanna (2008), Irene (2011), Katia (2011), and Sandy(2012) (see Texts S2, S4, and references therein). For each case, two simulations are performed. A hindcastserves as a control simulation, representing the actual ET. A simulation, initialized from a modified analysis inwhich the TC has been removed (no-TC) or relocated, serves as a sensitivity experiment. The TC removal orrelocation is based on a potential vorticity surgery method that only alters the model balance in the region ofthe storm [Grams et al., 2013a]. The initialization times are the same for the control and sensitivity simulation(Table S1). Comparing the control against the sensitivity simulation allows us to quantify the impact of the TC.In this setup, we assume that the COSMO hindcasts correctly represent the evolution of the large-scale flowwith and without the TC.
The time of TC removal or relocation and of COSMO initialization is based on two requirements (see Text S3):(1) the TC has to be removed prior to strong TC-midlatitude flow interaction [Archambault et al., 2013] and(2) the control hindcast needs to represent ET accurately.
The impact of ET on the excitation and amplification of the upper-level midlatitude flow is exemplarily illus-trated for Typhoon Choi-Wan [cf. Keller et al., 2014], with maps of jet-level geopotential height differencesbetween the control and no-TC simulations. A discussion for all other ET cases is provided in the supportinginformation Text S4 and Figures S2–S9.
Around recurvature time (+36 h, Figure 1a), the control simulation exhibits a slightly more amplified ridgenorth of Choi-Wan. After 36 h (+72 h, Figure 1b), strong ridgebuilding directly downstream of the transitioningTC appears as a prominent positive geopotential height difference. Another 36 h later (+108 h, Figure 1c),an upper-level RWT developed and propagated downstream, resulting in a prominent ridge-trough-ridgepattern over the central and eastern North Pacific. In the absence of Choi-Wan (no-TC, dashed), the flow ismuch less amplified. The physical and dynamical processes governing the interaction of a TC undergoing ETwith the midlatitude flow have been explored in detail by various authors [e.g., Thorncroft and Jones, 2000; Harrand Elsberry, 2000; Harr et al., 2000; McTaggart-Cowan et al., 2001; Atallah and Bosart, 2003; Agustí-Panaredaet al., 2004; Riemer et al., 2008; Grams et al., 2011, 2013a, 2013b; Archambault et al., 2015].
GRAMS ET AL. MIDLATITUDE FLOW RESPONSE TO TROPICAL CYCLONES 9522

Geophysical Research Letters 10.1002/2015GL065764
3. Measure for the Sensitivity of the Midlatitude Flow Response
The sensitivity of the midlatitude flow response is expressed in terms of the equivalent forecast hour difference(ΔeqFH). Let us assume that a perturbed forecast, testing the sensitivity of the midlatitude flow responseto different initial conditions with respect to the TC, is always worse than a reference forecast and that weconsider a skill score that is larger for better forecasts, e.g., the anomaly correlation coefficient (ACC). Then theskill score for the perturbed forecast decays to a certain value A = ACCPERT(tc) at an earlier forecast hour tc
than the reference forecast.
Here tc is the “current forecast hour” and teq is the “equivalent forecast hour” when the skill score for the betterreference forecast reaches the same threshold A = ACCREF(teq) = ACCPERT(tc), teq > tc. We then define theforecast range difference ΔeqFH = teq − tc. Thus, ΔeqFH is a measure of how much later the forecast skill ofthe reference forecast decreases to a skill equal to the skill of the perturbed forecast at the current forecasthour (ACCREF(tc+ΔeqFH) = ACCPERT(tc)). Or in other words, at a current forecast hour tc the perturbed forecasthas skill equal to the reference forecast at a later equivalent forecast hour teq (ACCPERT(tc) = ACCREF(teq), tc <
teq = tc + ΔeqFH).
ΔeqFH is based on the uncentered ACC:
ACCaf =
∑Mi=1
[(fi − ci
) (ai − ci
)]√∑M
i=1
(fi − ci
)2 ∑Mi=1
(ai − ci
)2, (1)
where fi is the value of a forecast variable at grid point i = [1,M] (M ∶number of grid points), ci of a climatology,and ai of an analysis. For an ACC of 1.0 the forecast and the analysis are identical. Based on the early work ofHollingsworth et al. [1980], today an empirical threshold of ACC = 0.6 is seen as the limit where a forecast stillhas some “synoptic skill for the largest scale weather patterns,” while an ACC = 0.5 is regarded as not beingbetter than a forecast based on climatology [cf. Persson, 2013, chapter A-2.6]. The ACC is more sensitive to thespatial patterns than to the absolute values.
In this study, ACCaf of 200hPa geopotential height is computed every 12 h (f : simulation, a: analysis). The level
of 200 hPa is used as we are interested in the amplification of the tropopause-level waveguide. Similar resultsare found for other mid- or upper-tropospheric levels. For the analysis, we use the operational ECMWF analysis(a = ANA in equation (1)). ECMWF ERA-Interim [Dee et al., 2011] mean values for each calendar day at therespective synoptic hour are used as the climatology (c in equation(1)). For the forecasts, we use the COSMOsimulations (f in equation (1); either control: f = CNTRL, no-TC: f = NOTC, or relocation: f = SCEN).
In addition, the mean ACCs of all deterministic ECMWF integrated forecast system (IFS) high-resolution fore-casts (hres) in August, September, and October (with 00UTC and 12UTC initialization times) over the relevant
ocean basin are needed. These mean ACCs, denoted ACCANAhres , serve as reference values for the typical fore-
cast quality at the different forecast hours. The ACCANAhres were calculated in the North Pacific for 2008, 2009,
and 2010 and in the North Atlantic for 2008, 2011, and 2012 (Figure 2). The variability among different oceanbasins and years is due to model improvements and interannual variability.
As in each case the COSMO control simulation (CNTRL) and the corresponding experiment (EXP, either NOTC orSCEN) use the same model framework and have the same background flow, the differenceΔACC = ACCANA
CNTRL−ACCANA
EXP can be attributed to the reduction in ACC due to the modification of the initial conditions and due tothe removal or relocation of the TC.
The calculation of ΔeqFH is illustrated in Figure 2. As an example, the mean ACCANAhres for all ocean basins is
reduced by ΔACC = 0.2 at all forecast hours. For each equivalent forecast hour (teq) of the reference forecast
we search for the current forecast hour tc at which [ACCANAhres −ΔACC] has the same ACC value as ACCANA
hres (thus
[ACCANAhres − ΔACC](tc) = ACCANA
hres (teq), tc < teq).
Due to the nonlinear temporal evolution of the ACC, ΔeqFH is a function of forecast hour. For constant ΔACC,ΔeqFH is usually higher for earlier forecast hours (see Figure 2). As the hres reference data are in discrete12-hourly time steps, we use the lower value of the codomain for teq.
We compare ACCANAhres −ΔACC against the mean ACCANA
hres , instead of comparing the experiment ACCANAEXP directly
against the control simulation ACCANACNTRL. This allows us to assess the impact of ΔACC for a typical forecast,
GRAMS ET AL. MIDLATITUDE FLOW RESPONSE TO TROPICAL CYCLONES 9523

Geophysical Research Letters 10.1002/2015GL065764
Figure 2. Mean ACCANAhres of 200 hPa geopotential height for all ECMWF hres forecasts during 1 August to 1 November
2008, 2009, and 2010 for the North Pacific (HRES PAC yyyy, gray) and 2008 and 2011 for the North Atlantic (HRES ATLyyyy, black). Abscissa indicates forecast hour. Blue curves show mean ACC for all years and basins and mean reduced byΔACC = 0.2. Description of ΔeqFH in section 3.
independent of our specific experiments. Furthermore, by construction the control simulations do not reachan ACC as low as in the experiments, and thus, we lack reference values for longer lead times. As shown in
the next section, ACCANACNTRL is very close to ACCANA
hres . Consequently, ACCANAhres − ΔACC is very close to ACCANA
EXP ,which supports this approach. All ACCs are calculated for a region centered around the upper-level waveguide(Table S2).
4. Results4.1. Impact of ETFor all eight cases we computed COSMO simulations and determined the ACC-based measures. The ACCs ofthe control simulations with respect to the ECMWF analysis (ACCANA
CNTRL, Figure 3a) are very close to the mean
in the hres model (ACCANAhres , grey-dotted line), indicating a good representation of the upper-level flow during
ET in the control simulations. The control simulations are actually hindcasts using ECMWF analysis data as
initial state and boundary condition. For real forecasts an ACC below ACCANAhres would be expected. Comparing
ACCANACNTRL of the control simulations against ACCANA
hres of individual ECMWF hres forecasts at similar initializationtimes shows that the hindcasts have at least as much skill as hres forecasts at that time (Text S1 and Figure S1).The accurate representation of the entire ET process by the control simulations has also been confirmed by amore thorough verification of the track, intensity, and midlatitude flow evolution [Grams, 2011; Blumer, 2013;Grams, 2013].
In contrast, a marked drop of ACCANANOTC in the no-TC simulations, reaching an average of 0.84 by the 72 h forecast
while typically an ACCANAhres of 0.98 occurs at this forecast hour, reflects the response of the midlatitude flow to
the presence of the transitioning TC (Figure 3b). This initial decrease by ΔACC = 0.14 can be attributed to thedirect impact of ET, manifested in downstream ridgebuilding and an acceleration of the midlatitude jet[cf. Grams et al., 2013a, Text S4]. The decrease of the ACC for Irene (orange) is outstanding due to very strongTC outflow-jet interaction and ridgebuilding (Table S1 and Figure S7).
After 72 h, the evolution of ACCANANOTC shows a larger variability among the cases (Figure 3b). While on aver-
age ACCANANOTC remains slightly above 0.8 until 120 h, it continues to strongly decrease for Choi-Wan, Lupit, and
Malakas, which exhibit a strong downstream impact of ET (Text S4 and Figures S3–S5). Likewise, ACCANANOTC
continues to decrease for Sandy, which was associated with unusually long-lasting ridgebuilding directly
GRAMS ET AL. MIDLATITUDE FLOW RESPONSE TO TROPICAL CYCLONES 9524

Geophysical Research Letters 10.1002/2015GL065764
Figure 3. Anomaly correlation coefficient for 200 hPa geopotential height (y axis) dependent on forecast hour
(in h, x axis) for the different cases. (a) Control versus analysis, (b) no-TC versus analysis, (c) ACCANAhres - ΔACC. In
Figures 3a–3c also the mean ACCANAhres is shown (dashed, gray). (d) Equivalent forecast hour difference ΔeqFH
(in h, y axis). Average of COSMO simulations in black short-dashed line.
downstream of the transitioning TC. This ridgebuilding triggers anticyclonic wave breaking, a southward shiftand amplification of a downstream trough in the subtropical East Atlantic, and a shift of the upper-levelRossby wave pattern farther downstream (Text S4 and Figure S9). Jangmi, Hanna, Irene, and Katia have lesspronounced downstream impacts (Text S4 and Figures S2 and S6–S8), and the ACCANA
NOTC increases after 72 h(Figure 3b).
As the evolution of the ACC in the control simulations is similar to the evolution in the typical mean hres
forecasts, ACCANAhres −ΔACC is very close to ACCANA
NOTC (Figure 3c). For all cases, ACCANAhres −ΔACC drops during the
first 72 h and reaches a mean value of about 0.84. In the hres model, the typical equivalent forecast hour for
ACCANAhres = 0.84 is 5.5 days (2008) to 6.5 days (2010). Thus, for the 72 h forecast a ΔeqFH of on average 2.5 days
would occur in a forecast that misses the transitioning TC completely. This means that the skill of a 3.5 dayforecast is on average reduced to the level of a typical 6 day forecast (0.84) when ET is missed completely bythe forecast. A time series of ΔeqFH is shown in Figure 3d (cf. section 3).
After 72 h the average ΔeqFH peaks at about 2.5 days and ranges from 1.5 days to 4 days among the cases(Figure 3d). Beyond 72 h ΔeqFH decreases but remains above 1 day on average. This decrease is partly due tothe definition of ΔeqFH, but mainly because the direct impact of ET due to the outflow-jet interaction and theridgebuilding becomes weaker. However, for the ET cases that exhibit a very strong TC outflow-jet interaction
GRAMS ET AL. MIDLATITUDE FLOW RESPONSE TO TROPICAL CYCLONES 9525
Geophysical Research Letters 10.1002/2015GL065764
and initial ridgebuilding, resulting in a strong modification and shift of the midlatitude RWT (Choi-Wan, Lupit,Malakas, and Sandy; Text S4 and Figures S3–S5 and S9), ΔeqFH remains high or even increases at longer leadtimes. Malakas sticks out, with a ΔeqFH of 3.5 days after a 144 h forecast (Figure 3d). Choi-Wan exhibits anincrease in ΔeqFH for longer lead times, and for Lupit and Sandy ΔeqFH remains at about 1 day and 2 days,respectively (Figure 3d). For all the other storms (Jangmi, Hanna, Irene, and Katia), ΔeqFH is below 1 day after108 forecast hours (Figure 3d). Despite their direct impacts on the midlatitude flow, these storms do not affectdownstream regions (Figures S2 and S6–S8). Both Hanna and Irene show a peakΔeqFH of 4 days, which can beattributed to their intense direct impact on the midlatitude flow, associated with a strong initial ridgebuilding(Figures S6 and S7).
In the cases investigated here, western North Pacific ET tends to exhibit high values of ΔeqFH for longer leadtimes (Choi-Wan, Lupit, Malakas, and relocation experiments discussed below) compared to North Atlantic ET(Hanna, Irene, and Katia; Figures S6–S8). This is consistent with the reported more pronounced downstreamimpact of western North Pacific ET compared to North Atlantic ET in climatological studies, e.g., Quinting andJones [2015] and Torn and Hakim [2015].
4.2. Impact of the Relative PositionApplying the same diagnostic to sensitivity experiments in which the transitioning TC has been relocatedallows us to quantify the impact of the relative position between the TC and midlatitude flow features on thedownstream midlatitude flow response. We use the experiments of Grams et al. [2013b] in which TyphoonJangmi (2008) has been relocated in the zonal direction in 1.25∘ increments from −2.50∘ to 5.00∘, and in themeridional direction in 2.50∘ increments from 0.00∘ to 5.00∘ at initialization time. The experiments are labeledby the cardinal direction and number of 1.25∘ increments of the relocation; e.g., in E4N2 Jangmi is relocatedby 5∘ to the east and 2.5∘ to the north.
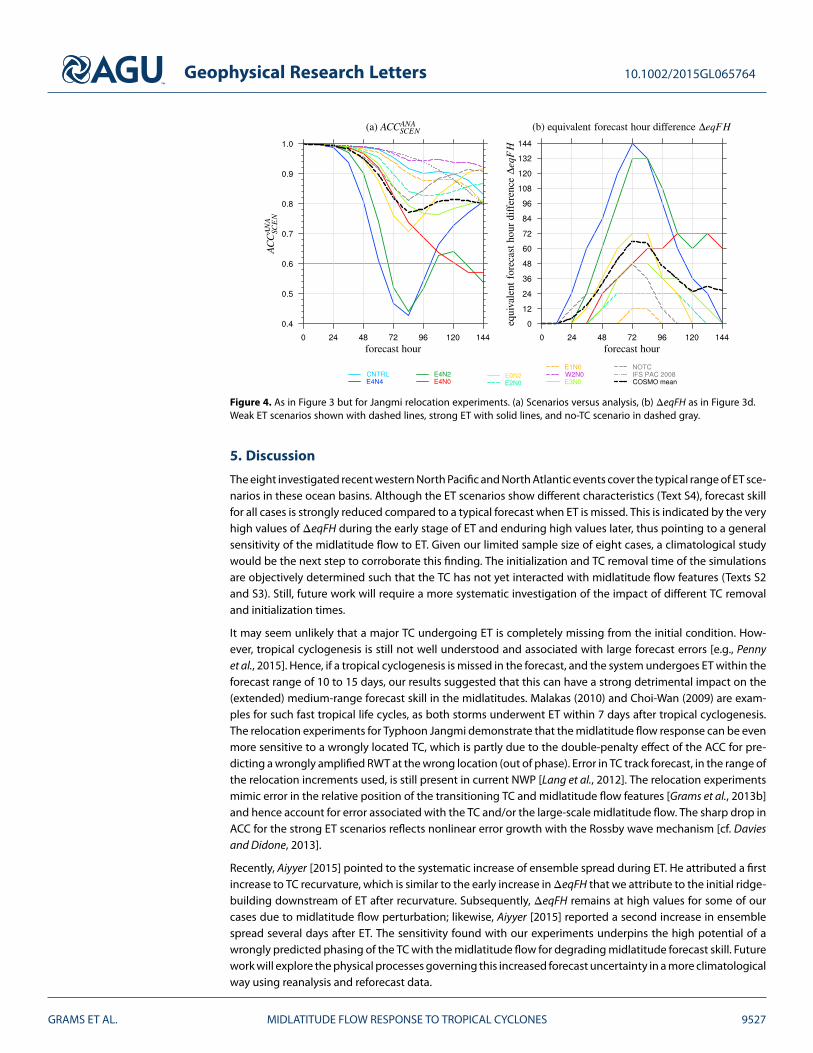
These experiments reveal two groups of scenarios: strong ET with reintensification of Jangmi, resulting instrong amplification of the downstream flow (E4N0, E4N2, E4N4, E0N2, and E3N0) and weak ET with decay ofJangmi accompanied by a broad ridge over the central Pacific (E2N0,E1N0,W2N0,and CNTRL) [cf. Grams et al.,2013b]. In the strong ET scenarios, ΔeqFH is much more pronounced than in the TC removal cases presentedearlier (solid lines, Figure 4). The ACC of scenarios with respect to the ECMWF analysis (ACCANA
SCEN, Figure 4a)drops sharply during the first 72 h for the strongest ET scenarios (E4N4, E4N2, and E0N2), and much fastercompared to the no-TC scenario (grey dashed). This reflects the very pronounced ridgebuilding and ampli-fication of a RWT downstream due to Jangmi reintensifying in these scenarios (not shown). In contrast, thedecrease of ACCANA
SCEN is much smaller for the weak ET scenarios (dashed lines, Figure 4a) and similar to thecontrol simulation (light blue).
The decay scenarios E1N0, E2N0, and W2N0 (dashed lines in orange, green, and purple) exhibit a weak ET thatis comparable to the control simulation; therefore, ΔeqFH is comparably small (Figure 4b). Although Jangmiis decaying in scenario E2N0 (green, dashed), ΔeqFH reaches about 1 day at the 60 h forecast. If the storm isrelocated by another 1.25∘ (≈ 128 km) farther to the East, which is in the range of typical 2 day TC track error[Lang et al., 2012], Jangmi reintensifies and ΔeqFH increases to 2 days (E3N0, light green).
All strong ET scenarios (solid lines; Figure 4a) depict an ACCANASCEN that is below the no-TC scenario (gray, dashed),
and well below the typical ACCANAhres of the IFS hres model (gray thin solid). Consequently, ΔeqFH (Figure 4b)
exhibits a strong increase during the first 72 h for all strong ET scenarios (solid). On averageΔeqFH peaks above2.5 days for a 72 h forecast, and the strong ET scenarios primarily contribute to this peak. However, the differ-ences between the two groups of scenarios (strong and weak ET) result in a much higher variability amongthe scenarios than among different no-TC experiments (section 4.1 and cf. Figures 3b and 3d). For scenariosE4N4, E4N2, ΔeqFH peaks at more than 5.5 days at 72 h. Thus, a 3 day forecast exhibiting this scenario wouldhave a skill equal to a typical 8.5 day forecast. This strong sensitivity of the midlatitude flow response indi-cates that there is practically no forecast skill if the storm is predicted too far to the northeast, in this case. Asin the no-TC experiments, average ΔeqFH decreases after 72 h and remains on average above 1 day. However,the average decrease occurs less abruptly and most of the strong ET scenarios exhibit a significant ΔeqFH fora 120 h forecast, in particular those scenarios with a very strong impact on the downstream flow (E4N2 andE4N0). In essence, the relocation experiments show that the midlatitude flow response is highly sensitive tothe relative position of the TC and midlatitude flow features. This sensitivity may result in a significant loss ofpredictability due to a wrongly forecasted track of the transitioning TC.
GRAMS ET AL. MIDLATITUDE FLOW RESPONSE TO TROPICAL CYCLONES 9526
Geophysical Research Letters 10.1002/2015GL065764
Figure 4. As in Figure 3 but for Jangmi relocation experiments. (a) Scenarios versus analysis, (b) ΔeqFH as in Figure 3d.Weak ET scenarios shown with dashed lines, strong ET with solid lines, and no-TC scenario in dashed gray.
5. Discussion
The eight investigated recent western North Pacific and North Atlantic events cover the typical range of ET sce-narios in these ocean basins. Although the ET scenarios show different characteristics (Text S4), forecast skillfor all cases is strongly reduced compared to a typical forecast when ET is missed. This is indicated by the veryhigh values of ΔeqFH during the early stage of ET and enduring high values later, thus pointing to a generalsensitivity of the midlatitude flow to ET. Given our limited sample size of eight cases, a climatological studywould be the next step to corroborate this finding. The initialization and TC removal time of the simulationsare objectively determined such that the TC has not yet interacted with midlatitude flow features (Texts S2and S3). Still, future work will require a more systematic investigation of the impact of different TC removaland initialization times.
It may seem unlikely that a major TC undergoing ET is completely missing from the initial condition. How-ever, tropical cyclogenesis is still not well understood and associated with large forecast errors [e.g., Pennyet al., 2015]. Hence, if a tropical cyclogenesis is missed in the forecast, and the system undergoes ET within theforecast range of 10 to 15 days, our results suggested that this can have a strong detrimental impact on the(extended) medium-range forecast skill in the midlatitudes. Malakas (2010) and Choi-Wan (2009) are exam-ples for such fast tropical life cycles, as both storms underwent ET within 7 days after tropical cyclogenesis.The relocation experiments for Typhoon Jangmi demonstrate that the midlatitude flow response can be evenmore sensitive to a wrongly located TC, which is partly due to the double-penalty effect of the ACC for pre-dicting a wrongly amplified RWT at the wrong location (out of phase). Error in TC track forecast, in the range ofthe relocation increments used, is still present in current NWP [Lang et al., 2012]. The relocation experimentsmimic error in the relative position of the transitioning TC and midlatitude flow features [Grams et al., 2013b]and hence account for error associated with the TC and/or the large-scale midlatitude flow. The sharp drop inACC for the strong ET scenarios reflects nonlinear error growth with the Rossby wave mechanism [cf. Daviesand Didone, 2013].
Recently, Aiyyer [2015] pointed to the systematic increase of ensemble spread during ET. He attributed a firstincrease to TC recurvature, which is similar to the early increase in ΔeqFH that we attribute to the initial ridge-building downstream of ET after recurvature. Subsequently, ΔeqFH remains at high values for some of ourcases due to midlatitude flow perturbation; likewise, Aiyyer [2015] reported a second increase in ensemblespread several days after ET. The sensitivity found with our experiments underpins the high potential of awrongly predicted phasing of the TC with the midlatitude flow for degrading midlatitude forecast skill. Futurework will explore the physical processes governing this increased forecast uncertainty in a more climatologicalway using reanalysis and reforecast data.
GRAMS ET AL. MIDLATITUDE FLOW RESPONSE TO TROPICAL CYCLONES 9527

Geophysical Research Letters 10.1002/2015GL065764
6. Conclusions
In this study we assess the sensitivity of the midlatitude flow response to ET, as depicted by the equivalentforecast hour difference (ΔeqFH), derived from the ACC for 200 hPa geopotential height. This metric reflectsthe temporal reduction of the forecast range at which a certain threshold of the ACC would be reached in atypical forecast. If the ET was missed completely by the model, a ΔeqFH of on average 2.5 days would occurduring the first 3 days of the simulation. In ET cases that exhibit a strong outflow-jet interaction and ini-tial ridgebuilding, and for which the midlatitude flow is sensitive for the triggering of Rossby waves, ΔeqFHremains at a level of on average 1 day during the following forecast period. We conclude that early during ETthe midlatitude flow response is highly sensitive to the direct interaction of the TC with the midlatitude flow.This sensitivity of the midlatitude flow response potentially results in a first significant loss of predictive skillfor the midlatitudes. A dynamical interpretation of this behavior (see Text S4) is that in the control simulations,the direct interaction leads to an acceleration of the midlatitude jet and to initial ridgebuilding directly down-stream of the transitioning TC, which is missing in the no-TC scenarios [Grams et al., 2013a]. Archambault et al.[2013, 2015] demonstrated that for ET with weak TC-midlatitude flow interaction also the ridgebuilding andjet acceleration directly downstream of ET is weaker. Thus, differences in the amplitude of ΔeqFH in the firsthalf of the forecast period may be attributed to the different strength of the TC-midlatitude flow interaction.The sensitivity of the midlatitude flow response further increases or remains at a high level in the scenariosin which the downstream upper-level waveguide was strongly modified by the TC, mirroring a general sensi-tivity of the upper-level midlatitude waveguide to perturbations. In the other scenarios, ΔeqFH at later timesis lower. Applying the same diagnostic to simulations in which Typhoon Jangmi has been relocated at theinitialization time reveals an even stronger sensitivity of the midlatitude flow response to ET if the TC wassimulated at a wrong position, so that a strong reintensification of the transitioning TC and amplification ofthe upper-level waveguide would occur. Due to a wrong amplitude and phase of a resulting RWT, ΔeqFH canreach more than 5 days after only 72 forecast hours, in these scenarios. Hence, a potential forecast exhibitingsuch a scenario would practically have no skill.
The results of this study quantitatively show that the downstream midlatitude flow response can have a dra-matically high degree of sensitivity to ET. Thereby, the downstream flow response depends on the strengthof the initial ridgebuilding directly downstream of ET and on the intrinsic sensitivity of the midlatitude flowto perturbations of the upper-level Rossby waveguide. Our results are particularly relevant for extendedmedium-range weather forecasts, as they demonstrate that a missed TC genesis in the forecast or a wronglylocated TC has the potential to make the subsequent forecast useless in downstream midlatitude regions.Hence, this study underlines the value of improving tropical cyclogenesis and TC track forecasts for improvingNWP in the midlatitudes.
ReferencesAgustí-Panareda, A., C. D. Thorncroft, G. C. Craig, and S. L. Gray (2004), The extratropical transition of hurricane Irene (1999):
A potential-vorticity perspective, Q. J. R. Meteorol. Soc., 130, 1047–1074, doi:10.1256/qj.02.140.Aiyyer, A. (2015), Recurving western North Pacific tropical cyclones and midlatitude predictability, Geophys. Res. Lett., 42,
doi:10.1002/2015GL065082.Anwender, D., P. A. Harr, and S. C. Jones (2008), Predictability associated with the downstream impacts of the extratropical transition of
tropical cyclones: Case studies, Mon. Weather Rev., 136, 3226–3247, doi:10.1175/2008MWR2249.1.Archambault, H. M., L. F. Bosart, D. Keyser, and J. M. Cordeira (2013), A climatological analysis of the extratropical flow response to recurving
Western North Pacific tropical cyclones, Mon. Weather Rev., 141, 2325–2346, doi:10.1175/MWR-D-12-00257.1.Archambault, H. M., D. Keyser, L. F. Bosart, C. A. Davis, and J. M. Cordeira (2015), A composite perspective of the extratropical flow response
to recurving Western North Pacific tropical cyclones, Mon. Weather Rev., 143, 1122–1141, doi:10.1175/MWR-D-14-00270.1.Atallah, E. H., and L. F. Bosart (2003), The extratropical transition and precipitation distribution of Hurricane Floyd (1999), Mon. Weather Rev.,
131, 1063–1081, doi:10.1175/1520-0493(2003)131<1063:TETAPD>2.0.CO;2.Blumer, S. R. (2013), The downstream impact of extratropical transition during the North Atlantic Hurricane Season 2011, Master’s thesis,
Institute for Atmospheric and Climate Science, ETH Zurich, Switzerland.Davies, H. C., and M. Didone (2013), Diagnosis and dynamics of forecast error growth, Mon. Weather Rev., 141(7), 2483–2501,
doi:10.1175/MWR-D-12-00242.1.Dee, D. P., et al. (2011), The ERA-Interim reanalysis: Configuration and performance of the data assimilation system, Q. J. R. Meteorol. Soc.,
137(656), 553–597, doi:10.1002/qj.828.Grams, C. M. (2011), Quantification of the Downstream Impact of Extratropical Transition for Typhoon Jangmi and Other Case Studies,
Wissenschaftliche Berichte des Instituts für Meteorologie und Klimaforschung des Karlsruher Instituts für Technologie, KIT ScientificPublishing, Karlsruhe, Germany, doi:10.5445/KSP/1000024940.
Grams, C. M. (2013), Quantification of Hurricane Sandy’s impact on the midlatitude flow, in paper presented at the 16th Cyclone Workshop,pp. Evening Session: Sandy Retrospective, 23 Sep 2013, St-Adèle, Québec, Canada.
AcknowledgmentsThis study was conducted duringthe authors’ doctorate at KITsupported by the German ResearchFoundation (DFG), as part ofthe research unit PANDOWAE(FOR896). Very valuable commentsfrom three anonymous reviewerssubstantially helped improvingthe quality of this manuscript and topresent our concept of ΔeqFH in aclearer way. We thank the DeutscherWetterdienst (DWD) for supportwith the COSMO model and forproviding access to the ECMWFanalysis data. We acknowledgeECMWF for computing and archivefacilities through the special project“The impact of tropical cyclones onextratropical predictability.” The dataanalysis and visualization was partlydone using the NCAR CommandLanguage [UCAR/NCAR/CISL/VETS,2014]. Data to reproduce ΔeqFH areavailable via the first author. We thankStephan Pfahl (ETHZ) for commentsand helpful discussions that improvedthe manuscript. We thank HeatherArchambault (NOAA) for advice onthe usage of the TC-midlatitude flowinteraction metric. We are deeplygrateful to Sarah Jones (DWD/KIT)for the many fruitful discussions andexcellent mentoring during our PhDs.
GRAMS ET AL. MIDLATITUDE FLOW RESPONSE TO TROPICAL CYCLONES 9528

Geophysical Research Letters 10.1002/2015GL065764
Grams, C. M., H. Wernli, M. Böttcher, J. Campa, U. Corsmeier, S. C. Jones, J. H. Keller, C.-J. Lenz, and L. Wiegand (2011), The key role of diabaticprocesses in modifying the upper-level tropospheric wave guide: A North Atlantic case study, Q. J. R. Meteorol. Soc., 137, 2174–2193,doi:10.1002/qj.891.
Grams, C. M., S. C. Jones, P. A. Davis, C. A. Harr, and M. Weissmann (2013a), The impact of Typhoon Jangmi (2008) on the midlatitude flow.Part I: Upper-level ridgebuilding and modification of the jet, Q. J. R. Meteorol. Soc., 139, 2148–2164, doi:10.1002/qj.2091.
Grams, C. M., S. C. Jones, and C. A. Davis (2013b), The impact of Typhoon Jangmi (2008) on the midlatitude flow. Part II: The role of thephasing for the downstream evolution, Q. J. R. Meteorol. Soc., 139, 2165–2180, doi:10.1002/qj.2119.
Harr, P. A., and J. M. Dea (2009), Downstream development associated with the extratropical transition of tropical cyclones over the WesternNorth Pacific, Mon. Weather Rev., 137, 1295–1319, doi:10.1175/2008MWR2558.1.
Harr, P. A., and R. L. Elsberry (2000), Extratropical transition of tropical cyclones over the Western North Pacific. Part I: Evolution ofstructural characteristics during the transition process, Mon. Weather Rev., 128(8), 2613–2633,doi:10.1175/1520-0493(2000)128<2613:ETOTCO>2.0.CO;2.
Harr, P. A., R. L. Elsberry, and T. F. Hogan (2000), Extratropical transition of tropical cyclones over the Western North Pacific. Part II:The impact of midlatitude circulation characteristics, Mon. Weather Rev., 128(8), 2634–2653,doi:10.1175/1520-0493(2000)128<2634:ETOTCO>2.0.CO;2.
Harr, P. A., D. Anwender, and S. C. Jones (2008), Predictability associated with the downstream impacts of the extratropical transition oftropical cyclones: Methodology and a case study of Typhoon Nabi (2005), Mon. Weather Rev., 136, 3205–3225,doi:10.1175/2008MWR2248.1.
Hollingsworth, A., K. Arpe, M. Tiedtke, M. Capaldo, and H. Savijärvi (1980), The performance of a medium-range forecast model in winterimpact of physical parameterizations, Mon. Weather Rev., 108, 1736–1773, doi:10.1175/1520-0493(1980)108<1736:TPOAMR>2.0.CO;2.
Jones, S. C., et al. (2003), The extratropical transition of tropical cyclones: Forecast challenges, current understanding, and future directions,Weather Forecasting, 18, 1052–1092, doi:10.1175/1520-0434(2003)018<1052:TETOTC>2.0.CO;2.
Keller, J. H., S. C. Jones, J. L. Evans, and P. Harr (2011), Characteristics of the TIGGE multimodel ensemble prediction system in representingforecast variability associated with extratropical transition, Geophys. Res. Lett., 38, L12802, doi:10.1029/2011GL047275.
Keller, J. H., S. C. Jones, and P. A. Harr (2014), An eddy kinetic energy view of physical and dynamical processes in distinct forecast scenariosfor the extratropical transition of two tropical cyclones, Mon. Weather Rev., 142, 2751–2771, doi:10.1175/MWR-D-13-00219.1.
Lang, S. T. K., M. Leutbecher, and S. C. Jones (2012), Impact of perturbation methods in the ECMWF ensemble prediction system on tropicalcyclone forecasts, Q. J. R. Meteorol. Soc., 138, 2030–2046, doi:10.1002/qj.1942.
Magnusson, L., J.-R. Bidlot, S. T. K. Lang, A. Thorpe, N. Wedi, and M. Yamaguchi (2014), Evaluation of medium-range forecasts for HurricaneSandy, Mon. Weather Rev., 142, 1962–1981, doi:10.1175/MWR-D-13-00228.1.
McTaggart-Cowan, R., J. R. Gyakum, and M. K. Yau (2001), Sensitivity testing of extratropical transitions using potentialvorticity inversions to modify initial conditions: Hurricane Earl case study, Mon. Weather Rev., 129, 1617–1636,doi:10.1175/1520-0493(2001)129<1617:STOETU>2.0.CO;2.
Penny, A. B., P. A. Harr, and M. M. Bell (2015), Observations of a nondeveloping tropical disturbance in the Western North Pacific duringTCS-08 (2008), Mon. Weather Rev., 143(7), 2459–2484, doi:10.1175/MWR-D-14-00163.1.
Persson, A. (2013), User guide to ECMWF forecast products (V1.1).Quinting, J. F., and S. C. Jones (2015), On the impact of tropical cyclones on rossby wave packets: A climatological perspective, Mon. Weather
Rev., doi:10.1175/MWR-D-14-00298.1.Riemer, M., and S. C. Jones (2014), Interaction of a tropical cyclone with a high-amplitude, midlatitude wave pattern: Waviness analysis,
trough deformation and track bifurcation, Q. J. R. Meteorol. Soc., 140, 1362–1376, doi:10.1002/qj.2221.Riemer, M., S. C. Jones, and C. A. Davis (2008), The impact of extratropical transition on the downstream flow: An idealized modelling study
with a straight jet, Q. J. R. Meteorol. Soc., 134, 69–91, doi:10.1002/qj.189.Ritchie, E. A., and R. L. Elsberry (2007), Simulations of the extratropical transition of tropical cyclones: Phasing between the upper-level
trough and tropical cyclones, Mon. Weather Rev., 135, 862–876, doi:10.1175/MWR3303.1.Schättler, U., G. Doms, and U. Schraff (2009), A description of the nonhydrostatic Regional Model LM. Part VII: User guide. [Available at
http://www.cosmo-model.org.]Steppeler, J., G. Doms, U. Schättler, H. W. Bitzer, A. Gassmann, U. Damrath, and G. Gregoric (2003), Meso-gamma scale forecasts using the
nonhydrostatic model LM, Meteorol. Atmos. Phys., 82, 75–96, doi:10.1007/s00703-001-0592-9.Thorncroft, C., and S. C. Jones (2000), The extratropical transitions of Hurricanes Felix and Iris in 1995, Mon. Weather Rev., 128, 947–972,
doi:10.1175/1520-0493(2000)128<0947:TETOHF>2.0.CO;2.Torn, R. D., and G. J. Hakim (2015), Comparison of wave packets associated with extratropical transition and winter cyclones, Mon. Weather
Rev., 143(5), 1782–1803, doi:10.1175/MWR-D-14-00006.1.UCAR/NCAR/CISL/VETS (2014), The NCAR command language (version 6.1.2) [software], Boulder, Colo., doi:10.5065/D6WD3XH5.
GRAMS ET AL. MIDLATITUDE FLOW RESPONSE TO TROPICAL CYCLONES 9529