A prospective study of change in sleep duration: associations with mortality in the Whitehall II...
19
A prospective study of change in sleep duration: associations with mortality in the Whitehall II cohort JE Ferrie*, MJ Shipley*, FP Cappuccio § , EJ Brunner*, MA Miller § , M Kumari*, MG Marmot* *International Centre for Health & Society, Department of Epidemiology & Public Health, University College London § Cardiovascular Medicine & Epidemiology Group, Clinical Sciences Research Institute, Warwick Medical School, Coventry
-
date post
21-Dec-2015 -
Category
Documents
-
view
218 -
download
2
Transcript of A prospective study of change in sleep duration: associations with mortality in the Whitehall II...

A prospective study of change in sleep duration: associations with mortality in the Whitehall II cohort
JE Ferrie*, MJ Shipley*, FP Cappuccio§, EJ Brunner*, MA Miller§, M Kumari*, MG Marmot*
*International Centre for Health & Society, Department of Epidemiology & Public Health, University College London§Cardiovascular Medicine & Epidemiology Group, Clinical Sciences Research Institute, Warwick Medical School, Coventry

2
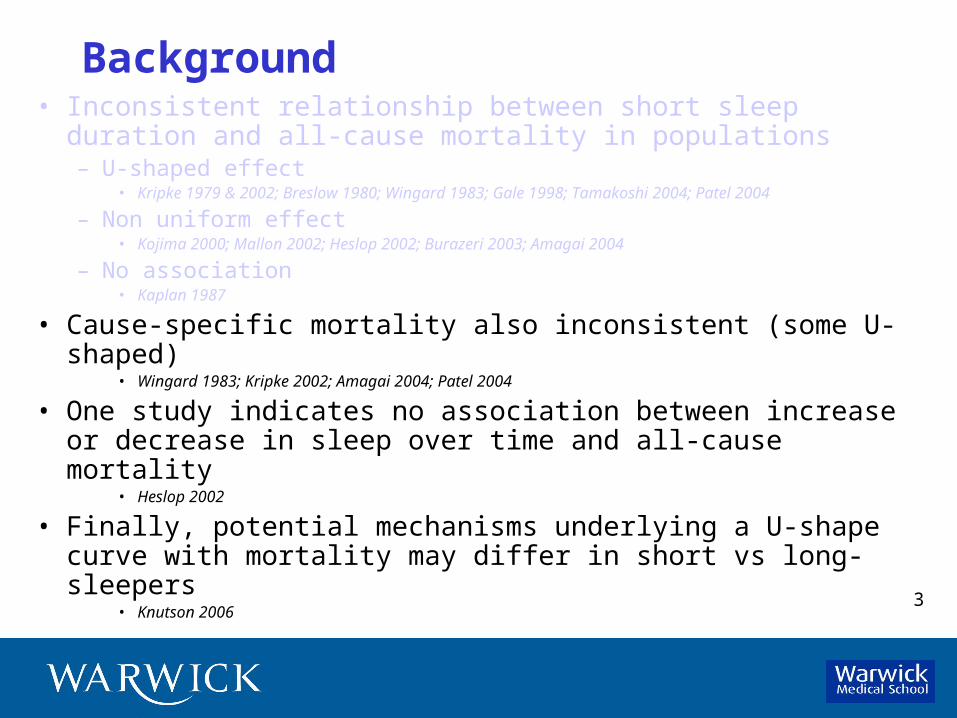
Background• Inconsistent relationship between short sleep duration and
all-cause mortality in populations– U-shaped effect
• Kripke 1979 & 2002; Breslow 1980; Wingard 1983; Gale 1998; Tamakoshi 2004; Patel 2004
– Non uniform effect• Kojima 2000; Mallon 2002; Heslop 2002; Burazeri 2003; Amagai 2004
– No association• Kaplan 1987
3
Background• Inconsistent relationship between short sleep duration and
all-cause mortality in populations– U-shaped effect
• Kripke 1979 & 2002; Breslow 1980; Wingard 1983; Gale 1998; Tamakoshi 2004; Patel 2004
– Non uniform effect• Kojima 2000; Mallon 2002; Heslop 2002; Burazeri 2003; Amagai 2004
– No association• Kaplan 1987
• Cause-specific mortality also inconsistent (some U-shaped)• Wingard 1983; Kripke 2002; Amagai 2004; Patel 2004
• One study indicates no association between increase or decrease in sleep over time and all-cause mortality
• Heslop 2002
• Finally, potential mechanisms underlying a U-shape curve with mortality may differ in short vs long-sleepers
• Knutson 2006

4
Objective
• To examine sleep duration and change in sleep duration as predictors of all-cause, cardiovascular and non-cardiovascular mortality in longitudinal data from the Whitehall II study of British civil servants

5
Whitehall II Cohort• White-collar British civil servants• Men and women aged 35-55 at entry
n=10,308 at entry in 1985-88Response rate 73%
33% women
Available measurementsn=9,781Phase 1 (1985-88)
Available measurements in survivors
n=7,729Phase 3 (1991-93)
Follow-up17.1 years from Phase 111.8 years from Phase 3
30th Sept 2004

6
Measures (1)
Exposure = sleep duration
• Phase 1 “How many hours of sleep do you have on an average night?” Categories were <5, 6, 7, 8, >9h
• Phase 3 “On an average weekday how many hours do you spend on the following activities? a) work b) time with family c) sleep” Responses were 1-12h and were collapsed to match Ph 1.
• People on sleep medications (147 and 91) were included in <5h.• Changes in sleep duration over time = three categories
– Sleeping less, the same or more at Ph3 than at Ph1– For decrease we pooled 6,7 and 8– For increase we pooled 5 and 6 (assuming beneficial effect on
mortality), and 7 and 8 (assuming detrimental effect on mortality)– Reference group for comparison = those who slept the same

7
Measures (2)
Mortality
• Through the NHS Central Registry• Censored at 30th September 2004• Mean follow-up = 17.1 years from Ph1, 11.8 from Ph 3• Death certificates coded using 9th and 10th revisions of
ICD– Cardiovascular (ICD-9 390-459 and ICD-10 I00-I99)– Non-cardiovascular (all remaining codes)

8
Measures (3)
Covariates and Risk factors
• Socio-demographic factors – Age, employment grade, marital status
• Existing morbidity– Modified GHQ score ‘without sleep Qs’, use of hypnotics, self-rated
health, physical illness indicator (diabetes, heart trouble, ECG abnormalities, hypertension, respiratory illnesses), prevalent CHD
• CVD risk factors– BMI, blood pressure, total cholesterol
• Health-related behaviours– Cigarette smoking, high alcohol consumption, ‘little’ exercise (<1h of
mod-to-vig exercise a week)

9
Analysis
• Cox proportional hazard models – Follow-up as time scale– Hazard Ratio (95% CI)– 7h of sleep as reference category
• Results identical in men and women, hence pooled • Two models
– Age-adjusted– Fully-adjusted
• Age, sex, marital status, employment grade, smoking, physical activity, alcohol consumption, self-related health, BMI, SBP, cholesterol, physical illness indicator, modified GHQ score, prevalent CHD
10
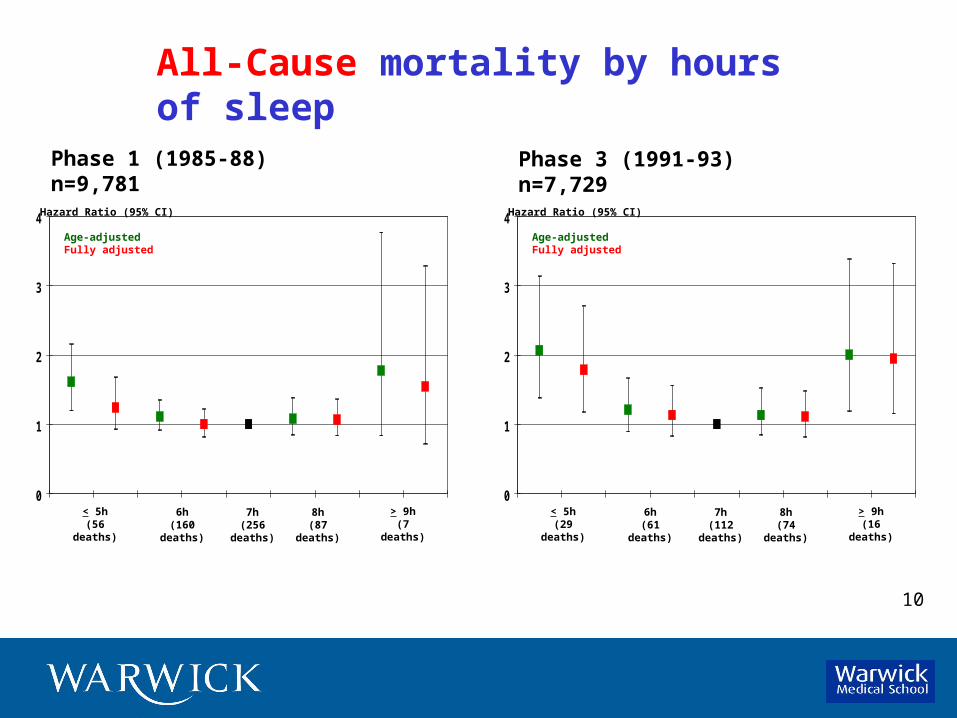
All-Cause mortality by hours of sleep
0
1
2
3
4
< 5h(56 deaths)
7h(256 deaths)
8h(87 deaths)
Hazard Ratio (95% CI)
Age-adjustedFully adjusted
6h(160 deaths)
> 9h(7 deaths)
Phase 1 (1985-88) n=9,781
0
1
2
3
4
< 5h(29 deaths)
7h(112 deaths)
8h(74 deaths)
Hazard Ratio (95% CI)
Age-adjustedFully adjusted
6h(61 deaths)
> 9h(16 deaths)
Phase 3 (1991-93) n=7,729

11
CVD mortality by hours of sleep
8.92 6.32
0
1
2
3
4
5
6
< 5h(19 deaths)
7h(69 deaths)
8h(31 deaths)
Hazard Ratio (95% CI)
Age-adjustedFully adjusted
6h(47 deaths)
> 9h(2 deaths)
Phase 1 (1985-88) n=9,781
0
1
2
3
4
5
6
< 5h(13 deaths)
7h(34 deaths)
8h(14 deaths)
Hazard Ratio (95% CI)
Age-adjustedFully adjusted
6h(22 deaths)
> 9h(6 deaths)
Phase 3 (1991-93) n=7,729

12
Non-CVD mortality by hours of sleep
0
1
2
3
4
< 5h(35 deaths)
7h(184 deaths)
8h(56 deaths)
Hazard Ratio (95% CI)
Age-adjustedFully adjusted
6h(113 deaths)
> 9h(5 deaths)
Phase 1 (1985-88) n=9,781
0
1
2
3
4
< 5h(15 deaths)
7h(76 deaths)
8h(59 deaths)
Hazard Ratio (95% CI)
Age-adjustedFully adjusted
6h(38 deaths)
> 9h(10 deaths)
Phase 3 (1991-93) n=7,729

13
All-cause mortality from Phase 3 by hours of sleep at Phase 1 and 3
<5h 6h 7h 8h
<5h 4.3
6h 3.5
7h 2.3
8h 1.8Age-standardised mortality rates per 1,000 person years
Phase 3
Phase 1

14
All-Cause mortality from Phase 3 by the change in sleep between Phase 1 and Phase 3
0
1
2
3
4
RefIncrease from 5 or 6h(55 deaths)
Decrease from 6, 7 or 8h(57 deaths)
Increase from 7 or 8h(58 deaths)
Hazard Ratio (95% CI)
Age-adjustedFully adjusted

15
CVD mortality from Phase 3 by the change in sleep between Phase 1 and Phase 3
0
1
2
3
4
RefIncrease from 5 or 6h(16 deaths)
Decrease from 6, 7 or 8h(24 deaths)
Increase from 7 or 8h(12 deaths)
Hazard Ratio (95% CI)
Age-adjustedFully adjusted

16
Non-CVD mortality from Phase 3 by the change in sleep between Phase 1 and Phase 3
0
1
2
3
4
RefIncrease from 5 or 6h(38 deaths)
Decrease from 6, 7 or 8h(33 deaths)
Increase from 7 or 8h(45 deaths)
Hazard Ratio (95% CI)
Age-adjustedFully adjusted

17
Summary
• Either a decrease in sleep duration from a regular 6, 7 or 8h per night or an increase from a regular 7 or 8h per night predict all-cause mortality
• A decrease in sleep duration affects all-cause mortality via increases in cardiovascular deaths
• An increase in sleep duration affects overall mortality via an increase in non-cardiovascular deaths

18
Conclusions
• People reporting decrease in sleep duration should be regarded as high risk groups for cardiovascular and all-cause mortality
• Further work is required to determine which causes of death contribute most to the excess non-cardiovascular mortality among people whose sleep duration increases

19
Acknowledgements and disclosures• The Whitehall II study has been supported by grants from the MRC, BHF,
HSE, DoH, NHLBI (HL36310): NIA (AG13196), Agency for Health Care Policy Research (HS06516); and the JD & CT MacArthur Foundation Research Networks on Successful Midlife Development and Socio-economic Status and Health.
• J.E.F. is supported by MRC, M.J.S. by BHF and M.G.M. by an MRC Research Professorship.
• We thank all participating Civil Service departments and their welfare, personnel, and establishment officers; the Occupational Health and Safety Agency; the Council of Civil Service Unions; all participating civil servants in the Whitehall II study; all members of the Whitehall II study team.
• F.P.C. holds the Cephalon Chair, an endowed post at Warwick Medical School, the result of a donation from the company. The appointment to the Chair was made entirely independently of the company and the postholder is free to devise his own programme of research. Cephalon do not have any stake in IP associated with the postholder and the Chair has complete academic independence from the company.