A Proposed 1.5m Observing System for the VLA / EVLA · · 2005-08-03Proposed Deployment Program...
27
- 1/27 - A Proposed 1.5m Observing System for the VLA / EVLA Field and Lab Test Results, Design Updates, and Deployment Plans L. Greenhill, R. Blundell (CfA) C. Carilli, R. Perley (NRAO) Pre-review Draft 2005 July 25 Rev. 2005 Aug. 3 Project Outline............................................................................................................................................................. 2 Project Status ............................................................................................................................................................... 2 Perspective ................................................................................................................................................................... 2 Field Test Activities ..................................................................................................................................................... 5 Prototype receiver performance ................................................................................................................................. 5 SENSITIVITY................................................................................................................................................................................. 5 PRIMARY BEAM ........................................................................................................................................................................... 5 POLARIZATION RESPONSE ........................................................................................................................................................... 7 Proposed Changes to the Prototype Receiver System................................................................................................ 8 WHAT WILL NOT CHANGE ............................................................................................................................................................ 8 WHAT WILL CHANGE ................................................................................................................................................................. 10 SENSITIVITY............................................................................................................................................................................... 10 Impact on P and L-band System Performance ......................................................................................................... 11 L-BAND...................................................................................................................................................................................... 11 P-BAND ...................................................................................................................................................................................... 11 Loaded 1.5m Dipole ................................................................................................................................................ 12 Shorted 1.5m Dipole ................................................................................................................................................ 12 Manpower ................................................................................................................................................................... 14 USE TO DATE ........................................................................................................................................................................ 15 FORECAST ............................................................................................................................................................................ 15 RFI.............................................................................................................................................................................. 16 COORDINATION.......................................................................................................................................................................... 17 FILTERING.................................................................................................................................................................................. 19 SUBTRACTION............................................................................................................................................................................ 19 General User (Legacy) Science ................................................................................................................................ 19 184-186 MHZ............................................................................................................................................................................ 19 ABOVE AND BELOW THE TV BROADCAST BANDS ..................................................................................................................... 20 Proposed Deployment Program................................................................................................................................ 21 TEST TIME REQUESTED .............................................................................................................................................................. 21 TESTING AND IMPLEMENTATION OF SHORT STAND-OFFS BETWEEN DIPOLES.......................................................................... 22 IMPACT OF SHORT STAND-OFFS ON P-BAND PERFORMANCE ...................................................................................................... 23 Sensitivity and Key Science ....................................................................................................................................... 23 Sensitivity and Legacy Science.................................................................................................................................. 25 Miscellaneous Issues ................................................................................................................................................. 25 MAINTENANCE AND SPARES ...................................................................................................................................... 26 MOU ....................................................................................................................................................................... 26 OBSERVING SUPPORT ............................................................................................................................................. 26 SOFTWARE ............................................................................................................................................................. 26 Uncertainties .............................................................................................................................................................. 26
Transcript of A Proposed 1.5m Observing System for the VLA / EVLA · · 2005-08-03Proposed Deployment Program...

- 1/27 -
A Proposed 1.5m Observing System for the VLA / EVLA
Field and Lab Test Results, Design Updates, and Deployment Plans
L. Greenhill, R. Blundell (CfA)C. Carilli, R. Perley (NRAO)
Pre-review Draft 2005 July 25Rev. 2005 Aug. 3
Project Outline.............................................................................................................................................................2Project Status...............................................................................................................................................................2Perspective...................................................................................................................................................................2Field Test Activities .....................................................................................................................................................5Prototype receiver performance .................................................................................................................................5
SENSITIVITY.................................................................................................................................................................................5PRIMARY BEAM...........................................................................................................................................................................5POLARIZATION RESPONSE ...........................................................................................................................................................7
Proposed Changes to the Prototype Receiver System................................................................................................8WHAT WILL NOT CHANGE............................................................................................................................................................8WHAT WILL CHANGE .................................................................................................................................................................10SENSITIVITY...............................................................................................................................................................................10
Impact on P and L-band System Performance .........................................................................................................11L-BAND......................................................................................................................................................................................11P-BAND ......................................................................................................................................................................................11
Loaded 1.5m Dipole ................................................................................................................................................12Shorted 1.5m Dipole................................................................................................................................................12
Manpower ...................................................................................................................................................................14USE TO DATE ........................................................................................................................................................................15FORECAST ............................................................................................................................................................................15
RFI..............................................................................................................................................................................16COORDINATION..........................................................................................................................................................................17FILTERING..................................................................................................................................................................................19SUBTRACTION............................................................................................................................................................................19
General User (Legacy) Science ................................................................................................................................19184-186 MHZ............................................................................................................................................................................19ABOVE AND BELOW THE TV BROADCAST BANDS .....................................................................................................................20
Proposed Deployment Program................................................................................................................................21TEST TIME REQUESTED ..............................................................................................................................................................21TESTING AND IMPLEMENTATION OF SHORT STAND-OFFS BETWEEN DIPOLES..........................................................................22IMPACT OF SHORT STAND-OFFS ON P-BAND PERFORMANCE......................................................................................................23
Sensitivity and Key Science .......................................................................................................................................23Sensitivity and Legacy Science..................................................................................................................................25Miscellaneous Issues .................................................................................................................................................25
MAINTENANCE AND SPARES ......................................................................................................................................26MOU .......................................................................................................................................................................26OBSERVING SUPPORT.............................................................................................................................................26SOFTWARE .............................................................................................................................................................26
Uncertainties..............................................................................................................................................................26

- 2/27 -
Project Outline
The program may be broken down into five phases over 16 months:(1) initial design and feasibility assessments at SAO
(2004 AUGUST – 2004 DECEMBER);(2) construction of prototypes with off-the-shelf components
(2004 DECEMBER – 2005 FEBRUARY);(3) field testing to evaluate antenna, IF, and correlator performance, and to assess
receiver/feed design(2005 MARCH – 2005 JUNE);
(4) redesign of electronics incorporating custom-made components; formulation of data processingstrategies, all in light of lessons learned(2005 MAY – 2005 JULY); and
(5) construction and deployment of second generation receiver/feed systems(2005 AUGUST – 2005 NOVEMBER 30).
D-configuration (150h approved contingent on performance) begins 2005 November 4 and ends2006 January 17. Our latest planned readiness date for science observing is 2005 December 5. Aproposed deployment schedule for final production receivers is discussed in a later section.
Project Status
(1) Three prototype receiver systems are fielded; number 4 is in use for design tests.(2) Routine operation in a ~2 MHz band at 195 MHz has been demonstrated (Figure 1).(3) Performance is adequate for key science.(4) Impact on VLA L and P-band systems has been shown to be small.(5) The RFI environment has been characterized and initial mitigation plans laid.(6) A production receiver design has been completed.(7) A window for general-user science has been identified (184-186 MHz) and a long-term
contingency plan formulated in the event this band becomes unusable due to RFI.
Perspective
The program to outfit the VLA (and EVLA) for operation at 1.5m wavelength is motivated bythe high potential reward of the key science. Through our field testing program duringspring/summer 2005 it has been possible to test array performance with datasets on the order of5h long with 3 baselines. The ultimate scientific goal of the program requires integrations ofseveral hundred hours in the 2007 D-configuration. Time requested for interim late 2005 andearly 2006 D-configuration is explicitly intended to demonstrate performance with intermediateintegrations of order 50 hours and to support the larger time request. Time in 2005/2006 willalso be used to test a theorized (though seemingly unlikely) strong signal case, investigate thecrowded fields around proposed targets, and support algorithm testing and development. This

- 3/27 -
work requires a full or nearly full deployment on the array so that good u,v coverage is achieved even withheavy tapers (0.2 kλ) and dedication of 1-3 antennas to RFI monitoring.
Intensive field testing has enabled us to develop a robust RF design (schematically similar to that ofthe P-band receiver), characterize impact on P and L-band system performance, and studylogistical constraints related to desired rapid deployment in late 2005. We are prepared to fieldthis design (presented to the recently convened review panel). Secondary changes to mounting ofthe feed have been proposed to further improve sensitivity. To validate them and to confirmthey do not negatively impact the other users, we propose testing in late September or earlyOctober, before deployment. (The testing will focus on sensitivity and beam characteristics at1.5m and P-band). If we are unable to makes tests at that time, we are prepared to integratetesting and the first week of deployment activities, as described in a later section. Alternatively,we can defer the changes to later in 2006.
Clearly work with the proposed 1.5m receiver system carries technical risk; it might not performadequately to accomplish the key science. However, initial indications are encouraging, and wecannot know how well it will actually perform for high dynamic range imaging until we deploy it.The program will explore a new scientific and technical frontier, and it is hoped to carry with itlong-term benefits to the VLA and EVLA projects (i.e., expansion of frequency coverage andscience). Uncertainties that remain now will be largely put to rest after the 2005/2006 D-configuration data are reduced.

- 4/27 -
Figure 1—Images of 3C295 at 195 MHz (3 element subarray; 5.8h on source; 2 MHz band.Crosshairs in the expanded view (bottom) mark catalog positions.

- 5/27 -
Field Test Activities
The VHF field testing program has targeted three themes: (1) assessment of antenna andprototype receiver performance at 195 MHz, (2) measurement of impact on L-band and P-bandsystem performance, and (3) characterization of RFI and initial formulation of mitigationstrategies.
SAO personnel have worked in Socorro or at the VLA site (day shifts and night shifts) for 10 ofthe 15 weeks between 2005 March 7 and 2005 June 17, principally using maintenance andsoftware time where available. Test data have also been acquired during regularly scheduledtracks:
• 2005 April: 12h,• 2005 May: 12h,• 2005 June: 11.5h (all at night), and• 2005 July: 15.5h (all at night)
The pace and direction of work during April and May was dictated by (1) the learning curve formaking total-power measurements with the prototype receivers and (2) the delivery schedule forcustom-made narrow band tunable front-end filters (~2 MHz at -3 dB). We discovered thesewere needed to obtain stable performance of the VLA front-end auto-level control system whenfaced with the rapid time variability of carriers from analog TV stations. The filters areengineering grade and will not be required in the long run.
Prototype receiver performanceSENSITIVITY
Our most reliable means by which to assess interferometer sensitivity (G/T) is measurement ofphase RMS (i.e., signal-to-noise ratio) on a source of known flux. (Work with our prototypereceivers has demonstrated the difficulty of estimating G/T in total-power mode becausehot/cold load measurements cannot be made effectively and calibration of the noise diode signalinjection in the prototype receivers is limited.)
Estimates of system equivalent flux density (SEFD) measured during nighttime observation of3C295 and 3C313/7 on June 2, 10, 21, and July 4 are 2700 - 4400 Jy. For an adoptedTSYS~200 K(1) at high galactic latitude, the inferred aperture efficiency is ~26% to 35%. Wenote that this is comparable to the ~30% obtained with the Westerbork 25m dishes and primefocus dipole feeds.
PRIMARY BEAM
The primary beam at 195 MHz has been measured through standard holography on CasA(Figures 2-3). The half-power full width measured in beam cuts is ~4.3° (1.2λ/D=4.2°), though
(1) We adopt a sky temperature of ~100 K, based on measurements of Haslam et al. (1982) at 408 MHzextrapolated to 195 MHz (T∝ν-2.6), receiver temperature of ~ 60 K, based on lab characterization of thereceiver minus the feed, and spillover temperature of ~ 40 K, based on an estimated beam taper of –6 dB atthe edge of the VLA dish. Actual system temperatures could be somewhat larger in light of feed losses,which are difficult to measure. However, anticipated performance of final receiver designs is better andwill be discussed later.

- 6/27 -
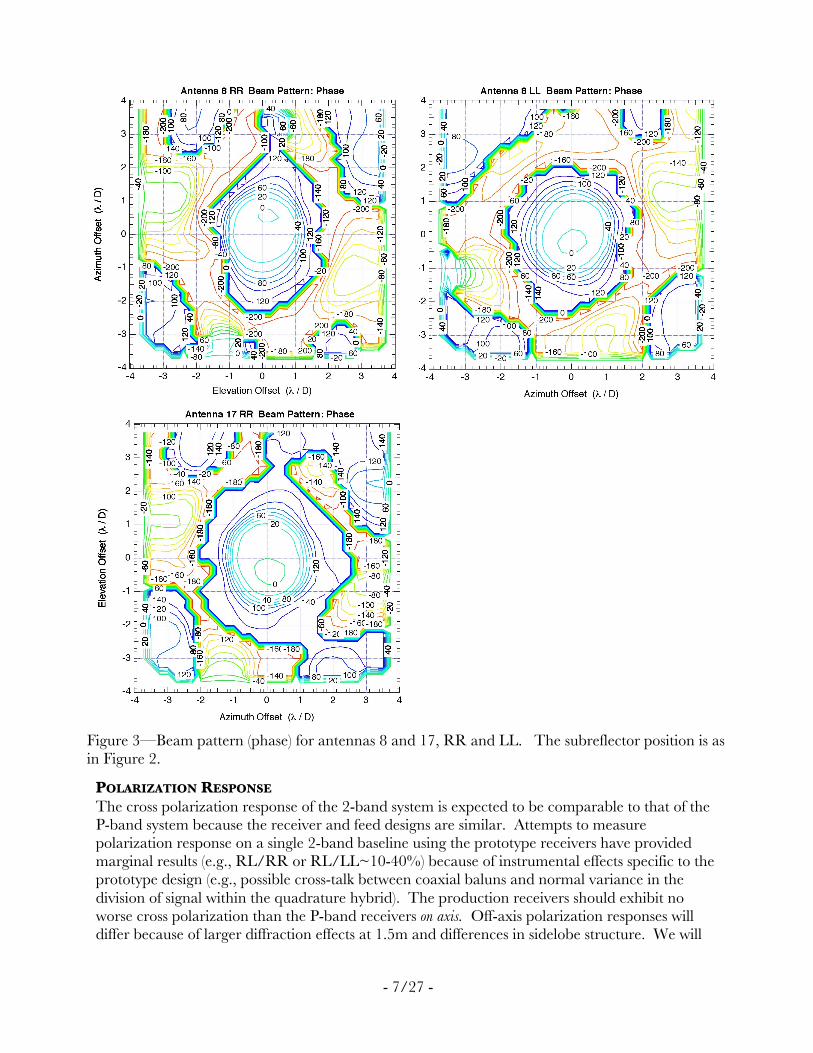
sidelobe structure is present at about -10dB, some oval distortion is visible. We are collectingfollow-up holographic data to better quantify these and other second-order characteristics.
Figure 2—Beam patterns (amplitude) for antennas 8 and 17, RR and LL. The subreflector isrotated to the L-band default position (short side 45° from the downside quadrupod leg). Thebeam characteristics are repeatable from antenna to antenna.
- 7/27 -
POLARIZATION RESPONSE
The cross polarization response of the 2-band system is expected to be comparable to that of theP-band system because the receiver and feed designs are similar. Attempts to measurepolarization response on a single 2-band baseline using the prototype receivers have providedmarginal results (e.g., RL/RR or RL/LL~10-40%) because of instrumental effects specific to theprototype design (e.g., possible cross-talk between coaxial baluns and normal variance in thedivision of signal within the quadrature hybrid). The production receivers should exhibit noworse cross polarization than the P-band receivers on axis. Off-axis polarization responses willdiffer because of larger diffraction effects at 1.5m and differences in sidelobe structure. We will
Figure 3—Beam pattern (phase) for antennas 8 and 17, RR and LL. The subreflector position is asin Figure 2.

- 8/27 -
study off-axis response once the production receivers are available, and (1) we are no longerconstrained to use our small number of front-end, engineering-grade filters, and (2) we can bemore certain of consistent receiver performance and generalizable results.
Proposed Changes to the Prototype Receiver System
The prototype receivers were constructed from off-the-shelf components and enabled rapidimplementation of a test system at the VLA. Semi-permanent mounting of 1.5m dipoles, incontrast to the 4m dipoles, has provided an opportunity for low operational overhead andconsistency in performance. Experience gained in field work has highlighted critical areas (e.g.,RFI suppression in hardware, impedance matching of the feed, and quadrature hybridplacement in the signal path) and enabled design of lower noise, more robust and efficientreceivers (Figure 4).
WHAT WILL NOT CHANGE
The VHF receiving systems comprise crossed dipole feed assemblies mounted beneath the sub-reflectors, and RF modules mounted in the barrel cabins. The 1.5m dipoles and central hubs areclamped to the P-band dipole assemblies via removable stand-offs. The 1.5m baluns are locatedin the central hubs, and ~1m of LMR300 coaxial cable conducts the RF signals to the receivermodules. These are anchored to the reverse side of the mounting plates for the P-band RFmodules. The RF cables pass through the on-axis structural supports of the P-band feed
Table 1: Prototype vs Proposed Production Receiver Systems
Component Change DriverQ-hybrid Move to before LNA; broader
band, lower loss componentPurity of polarization; isolationof LNA from mismatches
LNA Operating point Higher gain, lower TRX
Noise diode injection Move to after LNA; off forscience observations
Stability; low TRX; precludeleakage into P-band receiver
Lumped-element balun Replace coaxial balun Low insertion loss, broadbandwidth
Bandpass filter Use 8-pole custom filter Exclusion of TV carriersHigh-Q crystalnotch filters
Inclusion Exclusion of TV carriers toenable operation of ALCs andto avoid ringing in spectra
Dipole shorting switch Inclusion P-band performance.Connection to superflex 3 dB pad at 2-band RX out Damp 3 MHz bandpass ripple in
1.5m AND P-band output2-band/P-band powerand cal on/off control
S/W control of power and calsignal to 2-band and P-band
Noninterference assured.2-band off for P-band obs.P-band off for 2-band obs.Control power at A-rack input

- 9/27 -
Figure 4—Layout of proposed production receivers. The RF electronics comprise surfacemount components in shielded enclosures and weather tight boxes identical to those for P-band.A heater provides temperature control for critical elements, to assure gain stability.

- 10/27 -
assemblies. The power, calibration control signals, and RF output for the 1.5m and P-bandreceivers are daisy chained so that existing cables serving the barrel cabins can be used withoutmodification. One control bit is needed.
WHAT WILL CHANGE
Tables 1-3 summarize the differences between prototype and proposed production receiverdesigns, and the proposed receiver specifications.
Table 2: Specification of the Proposed Production Receiver Systems
† (v)—video carrier; (a)—audio carrier; (c)—digital carrier†† 0.1 dB loss contributes ~7K of receiver temperature.
Table 3: Anticipated Performance of VLA/EVLAAntennas and Receivers at 1.5m
Primary beam ~ 4.3° half power full width; 10 dB 1st sidelobeSEFD 2400 – 4000 Jy (16 cm dipole spacing)
2100 – 3400 Jy (10 cm dipole spacing) †Cross pol. Comparable to P-band
† The option and advantages of reduced spacing between 1.5m and0.92m feeds will be discussed in a later section. The prototype
receivers exhibit SEFDs of 2700-4400 Jy with a16 cm dipole spacing.
SENSITIVITY
Design improvements are anticipated to reduce receiver temperature by ~30% and systemtemperature by ~10%. Contributions will come chiefly from lower loss in the balun, betteroperating point for the LNA, and switching off the noise diode injection during observing, In the
Bandwidth Feed: 193 MHz center; Δν/ν ~ 5-8% optimumBP filter: 184-198 MHz @ -3 dBQuadrature hybrid: 160-230 MHz
Gain 84 dB minus pads, filter insertion losses, etcNotches TV 7(v), TV8(a), TV9(v), TV10(v,a)
TV11(v), DTV9(c), DTV10(c) †
Power out -67 dBm over 14 MHz at input to A-rackSystem noisesavings overprototypes
Low noise balun (0.05-0.1 dB) ††
Simplification of balun connections (0.01-0.05 dB)Shortened cable between balun and RX (0.01 dB)LNA operating point (10-20K)Noise diode off during science ops (~5-10K)Spill-over (~10K; contingent on feed alteration see later section)

- 11/27 -
a later section we propose testing a shorter separation between 1.5m and 0.92m dipoles in aneffort to recover another 10% in sensitivity (G/T), for a net improvement of ~20% (25% if ananticipated 10K improvement in spillover is achieved) - see Table 3.
Impact on P and L-band System Performance
L-BAND
Impact on L-band TSYS (zenith) and G/T were measured on 2005 May 25 with the 1.5m dipolemounted and dismounted from antenna 8. With the dipole mounted and assuming 10K spill-over, a hot load test yields a TSYS of 29K and a noise cal temperature of 2.03±0.04K for 12cycles of the cal. Measurements were repeated with the 1.5m dipole dismounted. The caltemperature was this time used to estimate TSYS directly, 30K after subtracting the temperatureof the galactic plane, which was close to overhead (Reich et al. 1982, AAS, 48, 219).Similar measurements at L-band were also made on 2005 March 16, using antenna 6. TSYS withthe dipole mounted was 30K and 30K without the dipole, ±1K.
On 2005 May 25, ratios of fringe power for CasA with and without the 1.5m dipole mountedwere used to estimate impact on sensitivity. The ratio was measured three times, 0.98, 0.99, and0.98 with formal uncertainties of 1%. On 2005 March 16 the ratio for CasA was 1.01 withcomparable uncertainty.
P-BAND
Impact tests for the P-band system evaluated both loaded and shorted 1.5m dipoles. Lab testingat SAO in 2004 raised expectations that a shorted 1.5m dipole would act as a director, improvingthe forward gain of the P-band feed. Electromagnetic finite element modeling (using theMMANA package) has also suggested there may be some benefit to shorting the1.5m dipole(Table 4).
Table 4: Model P-band Gain† in Response to Loaded/Shorted1.5m dipole
† Gains are relative. †† The 325 MHz gain for a P-band dipole alone is 7.55 dB.
ν 1.5m loaded 1.5m shorted Δ 305 MHz 7.35 dB 7.84 dB 0.49 dB315 7.54 7.79 0.25325 †† 7.50†† 7.54 0.04335 7.32 7.28 -0.04345 7.05 6.89 -0.16

- 12/27 -
Loaded 1.5m DipoleAlthough field-testing has focused on performance for shorted 1.5m dipoles, basic tests show thatantenna 17 has average sensitivity when equipped with a loaded 1.5m dipole. 3C295 wasobserved on 2005 June 21. Comparison of S/N achieved on different baselines to antenna 3shows that the performance of antenna 17 is comparable to other antennas (Figure 5).Comparison of phase noise measurements at 327 MHz on 2002 April 06 give comparableresults. The phase noise on 2005 June 21 is consistent with TSYS / Ae~ 670 K or a ~ 30%efficiency for TSYS ~ 200 K, in agreement with measurements by Perley in early 2005 March,before deployment of the 1.5m dipoles. More accurate measurements for a loaded dipole can bereadily made, but for a deployed 1.5m system, operation with a short applied will be the default.
Shorted 1.5m DipoleWe have examined the effect of shorted 1.5m dipoles on P-band beam characteristics (305 and325 MHz) and sensitivity (305 to 345 MHz). In the first observations, on 2005 June 02 at 325MHz with 3.125 MHz bandwidth, relative G/T and beam width were estimated from analysis ofbeamcuts in holography mode along four axes while observing 3C147. The mean ratio of fringepower with the shorted dipole mounted/dismounted was 1.07±0.05. Comparison of –3 dBbeam widths indicates a mean 11±3% narrowing of the P-band beam when the shorted dipole isin place.
Full holographic measurements were completed on 2005 July 26 and 27 with the 1.5m dipoleshorted and dismounted from antenna 17 (Figure 6). The raster scan covered ~18°. Slicesthrough the beam power pattern at 325 MHz show up to a 10% reduction in –3dB and –10dBbeam widths (Table 5a,b). The reduction in beam width is consistent with reduction indefocusing of the P-band system (from 50 cm to 40±3 cm).
Figure 5—Good performance of antenna 17 with a loaded 1.5m dipole inplace, relative to other antennas at P-band.
- 13/27 -
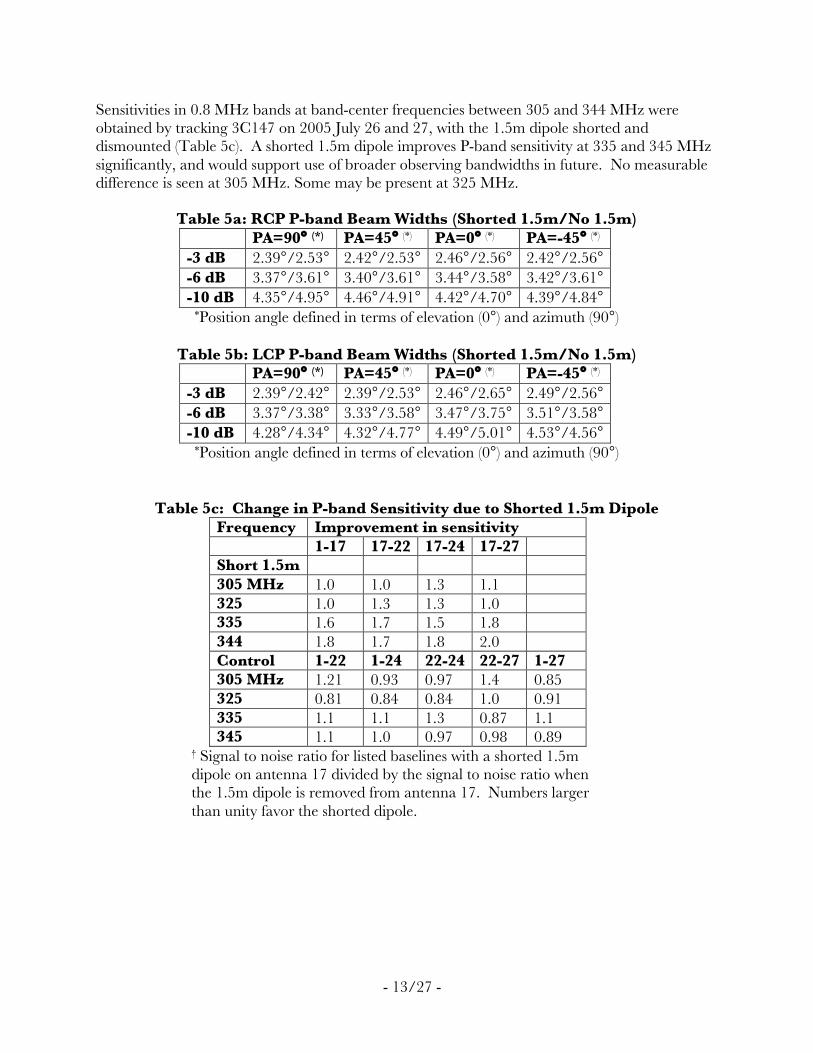
Sensitivities in 0.8 MHz bands at band-center frequencies between 305 and 344 MHz wereobtained by tracking 3C147 on 2005 July 26 and 27, with the 1.5m dipole shorted anddismounted (Table 5c). A shorted 1.5m dipole improves P-band sensitivity at 335 and 345 MHzsignificantly, and would support use of broader observing bandwidths in future. No measurabledifference is seen at 305 MHz. Some may be present at 325 MHz.
Table 5a: RCP P-band Beam Widths (Shorted 1.5m/No 1.5m)PA=90° (*) PA=45° (*) PA=0° (*) PA=-45° (*)
-3 dB 2.39°/2.53° 2.42°/2.53° 2.46°/2.56° 2.42°/2.56°-6 dB 3.37°/3.61° 3.40°/3.61° 3.44°/3.58° 3.42°/3.61°-10 dB 4.35°/4.95° 4.46°/4.91° 4.42°/4.70° 4.39°/4.84°
*Position angle defined in terms of elevation (0°) and azimuth (90°)
Table 5b: LCP P-band Beam Widths (Shorted 1.5m/No 1.5m)PA=90° (*) PA=45° (*) PA=0° (*) PA=-45° (*)
-3 dB 2.39°/2.42° 2.39°/2.53° 2.46°/2.65° 2.49°/2.56°-6 dB 3.37°/3.38° 3.33°/3.58° 3.47°/3.75° 3.51°/3.58°-10 dB 4.28°/4.34° 4.32°/4.77° 4.49°/5.01° 4.53°/4.56°
*Position angle defined in terms of elevation (0°) and azimuth (90°)
Table 5c: Change in P-band Sensitivity due to Shorted 1.5m DipoleFrequency Improvement in sensitivity
1-17 17-22 17-24 17-27Short 1.5m305 MHz 1.0 1.0 1.3 1.1325 1.0 1.3 1.3 1.0335 1.6 1.7 1.5 1.8344 1.8 1.7 1.8 2.0Control 1-22 1-24 22-24 22-27 1-27305 MHz 1.21 0.93 0.97 1.4 0.85325 0.81 0.84 0.84 1.0 0.91335 1.1 1.1 1.3 0.87 1.1345 1.1 1.0 0.97 0.98 0.89
† Signal to noise ratio for listed baselines with a shorted 1.5mdipole on antenna 17 divided by the signal to noise ratio whenthe 1.5m dipole is removed from antenna 17. Numbers largerthan unity favor the shorted dipole.

- 14/27 -
Figure 6—P-band beam patterns for antenna 17 (in dB) without a 1.5m dipole assembly andwith a shorted 1.5m assembly in place.

- 15/27 -
ManpowerUSE TO DATE
Bob Smith and Dan Mertely have provided the bulk of support within NRAO for field testing. JohnMcClendon and the cherry picker operators have also worked on the project, but to a lesser extent.When feasible, we chose to work with Bob Smith because his duties were VLA-related, ratherthan EVLA-related. This manpower has been needed for operations that require work in theareas that require safety training: barrel cabins and on the reverse side of the sub-reflectors(mounting and receivers and feeds, dismounting feed assemblies for impact testing, DVM orreflection loss sweeps, and basic RF testing such as insertion of pads or terminations). Demandearly in the field test program was driven by the need to follow-up inconsistent test results thathave since been linked to receiver performance in the presence of unexpectedly heavy RFI.Later in the field test program, activity focused on the vertex cabins and pedestal, where the PIwas able to handle most activities, supported by Carilli and Perley when able.
FORECAST
Any future installation program will be designed to minimize demands on NRAO manpower.Structural details of the prototype and production receivers are effectively identical. In terms ofnoise characteristics, efficiency, and RF performance in the presence of RFI, improvements willgreatly simplify and speed testing of the production receivers.
Extensive experience has been gained through the installation of the prototype1.5m receivers.The procedure for production units will be substantially similar. A practical rate is two receivers perfull day for three people plus cherry picker operator. This requires one person to work a barrel cabin withsafety look-out in the dish (4h) and a second person working in the cherry picker, accompanied byan operator for (~2h). Testing in the barrel cabins will be limited to line voltage measurements,switching tests, and RF continuity tests involving the look-out who will work with a spectrumanalyzer in the vertex room. Subsequent receiver performance testing will be conducted throughremote control of the antennas and the correlator. There is not now any expectation of a need tomake time consuming manual measurements as were made by us in 2005 April and May (e.g.,total power with the Milhouse laptop).
Receivers and feeds will be delivered (with documentation) to NRAO after function testing, noisemeasurements, and vector network analyzer characterization. Confirmation before mountingcan be managed by SAO personnel during weekly visits to NRAO. SAO can also supportinstallation with up to two engineers on site if safety qualification can be arranged and harnessesprovided. The PI or SAO staff substitute can also support installation activities. Additionalsupport from Carilli or Perley is not counted here in the interest of conservatism.
Complications in receiver/feed installation on EVLA antennas are not anticipated because theEVLA and VLA barrel cabins are the same, the P-band feed assemblies are the same, and the P-band signal paths prior to sampling are the same. Adjustment for the higher noise diode controlsignal (28V versus 15V) and higher supply voltage (17V versus 15V) is readily handled in the1.5m receiver design, which includes regulators. The most likely difference in receiverperformance will involve internally generated RFI, where the EVLA environment is quieter,though a test installation on an EVLA antenna during summer 2005 would provide certainty.

- 16/27 -
RFI
At the VLA, the RFI environment in the commercial broadcast bands is much more aggressivethan anticipated, based on site monitoring in mid/late 2004. Though more difficult than first believed,mitigation still appears to be practical.
A substantial fraction of observed narrow-line RFI is internal and not phase coherent; thefrequencies of lines are often antenna dependent and only a small fraction appear in cross power.(We note that tests on antennas 6 and 17 show that almost all lines enter via the feed rather thanthe cabling and electronics racks.) Nearly all of the strong lines seen in cross power are related toTV broadcasting (Figure 7-9). The audio carrier is frequency modulated chiefly over ~20 kHz,with additional modulation possible over 200 kHz (e.g., SAP), and reception can cause ringing inFourier transform spectra. The video carrier is amplitude modulated, causing both ringing andinterfering with operation of the VLA auto-level control system (ALC). Additional RFI featuresin spectra include DTV signals where the carrier is not modulated, but the broadband signalexhibits substantial spectral structure and overall emission for known sources can be well abovethe sky noise level (by ~ 10 dB).
Figure 7—Allocation of analog TV transmission for an individual channel. (Graphic takenfrom “Understanding and Measuring Video TV-RF Signals,” by Glen Kroupuenske.) In thecase of VLA spectra, video and audio carriers are readily detected (see following figures), butthe color sub-carriers are not observed.

- 17/27 -
A three-layered approach to RFI mitigation appears to be the most promising.
COORDINATION
DTV: DTV transmissions are the most substantial obstacle to the proposed science, because thesignal can be many dB above the sky, it uniformly fills broad (6 MHz) bands, and nearby stationsoverlap our key science band. Channel 9 (KNMD) covers 186-192 MHz, and channel 10(KCHF) covers 192-198 MHz. The line-center HI emissions associated with the three targetquasars proposed in AG686/706 lie between 191.1 and 196.4 MHz. Necessary offline sciencebands may extend as low as ~188 MHz and as high as ~198 MHz.
Figure 8—Complex cross-power spectrum of RFI from 186 to 203 MHz (05 July 17, night),dominated by analog TV carriers. Channel allocations are 6 MHz wide (e.g., 186-192 MHz).Line-center frequencies for our proposed astronomical targets are indicated by vertical bars.Visible DTV transmission is known to be KNMD, operated by the University of New Mexico.Weak DTV emission between 192 and 198 MHz has also been detected intermittently, whichwe believe to be low power operation by KCHF. The spectrum shown comprises separate 0.8MHz bands. Bandpass responses have not been removed, hence the deviations in phase andamplitude at the (many) band edges. Channel spacing is 1.5 kHz.

- 18/27 -
KNMD operates a 0.2 kW transmitter on Sandia Mt, and the received power is ~10 dB abovethe sky. KCHF operates a 1.7 kW directional transmitter west of Santa Fe (serving Santa Fe andAlbuquerque) and is building a 30 kW omnidirectional facility at the same site. To date, KCHFtransmission has been observed intermittently only somewhat above the sky noise. However, itslarger facility will be at least12 dB stronger, if activity to date represents full-power testing, andthe detected signal will be substantially stronger than the detected for KNMD.
KNMD is operated by the University of NM and through the efforts of Frank Gilfeather hasexpressed willingness to coordinate with late night/early morning operation at the VLA. Wehave already successfully coordinated test time on May 18. (Our key science targets transit atmidnight between late February and mid-March, and observing has been requested for Q4 2005and Q1 2007.)
KCHF is also a noncommercial station. Our contact at KCHF is the RF system engineer. Hehas more than once expressed willingness to work on coordination for late-night/early morningtracks. Full-power broadcasting (30 kW) is expected in mid-2006. Daily low-power broadcastingmay begin in late 2005.
Figure 9—Expanded view of the cross-power spectrum shown in Figure 8. Weak lines thatappear in this ~2m scalar average are probably not related to TV broadcasting and may beinternally generated.

- 19/27 -
If the panel review approves continued work on the 1.5m receiver system, we will follow up withboth stations, to inform them of timelines and to obtain additional commitments in writing ifpossible.
FM: New FM transmission facilities to be built near Riley, NM will service 95.9 MHz, and thefirst harmonic lies in our science band. A managing partner for Matinee Radio, LLC has agreedto work with NRAO and SAO when engineering and construction of the station are underway,to assure low out-of-band emissions. However, for the time being, the Riley site is inactive.
FILTERING
An eight pole filter will define the passband of the proposed 1.5m production receivers The 3dBpoints will be 184 and 198 MHz. VLA front-end filters may also be used (185/25 MHz for EORscience and 187/12.5 MHz for general-user science – see later section). The strongest RFI isbroadcast by TV channel 7 (audio) at 179.75 MHz (300 kW at Sandia Mt). This constrains thelower end of our passband. A complex of lines and associated modulation products constrain theupper end.
We have demonstrated routine operation of the VLA through use of 2 MHz engineering-gradefront-end filters tuned to exclude carriers (195.4±1 MHz). Based on this success, we haveformulated a plan to notch filter eight analog TV carrier and other lines that have been observedin cross power (on a 1 km baseline; Figures 8, 9). The notches will be created at RF using high-Qcrystals (Figure 4). Lab tests with a 100 MHz (space qualified) crystal have generated on theorder of 15 dB suppression with a –3 dB width of ~7 kHz. Models indicate we may anticipateanother ~10 dB of suppression from our intended parts, and broader notches can be created byadjusting the impedances around the crystals with moderate loss in depth. Other weak lines (20kHz FWZI) have been detected in cross power and excision from correlator data demonstratedfor channel spacings of 6 kHz. This should also be practical for the correlator modes weanticipate using (channel spacing 12.2 or 24.4 kHz after Hanning smoothing).
SUBTRACTION
Techniques that employ antenna nodding and subtraction using reference antennas (e.g., VLAantennas pointed > 1 beam off source) are under consideration, but we require a larger array (>3 antennas) to test dynamic range limitations, assess need, and develop algorithms.
General User (Legacy) Science
Legacy science has been an important consideration in conception of the VHF program and indesign of the production receivers.
184-186 MHZ
General users are unlikely to be able to observe at 186-198 MHz because coordination with theDTV stations will be impractical if demand is high and projects cannot be block scheduled. Tocover this eventuality, we have designed a sufficiently broad receiver bandwidth that usefulobservations can be made at 184-186 MHz using narrow back end filters (0.4-1.5 MHz). Thiscorresponds to TV channel 8 (analog). Practical operation in this band may be anticipated from

- 20/27 -
success at frequencies in a narrow band close to 195.4 MHz during field testing (analog TVchannel 10). Electromagnetic finite element modeling shows the gain of the 1.5m feed at 185MHz will differ by ~ 2% from the gain at 195 MHz, which is smaller than the uncertainty in themodel (see later section).
ABOVE AND BELOW THE TV BROADCAST BANDS
Predicting the RFI environment over the long term is difficult; new DTV stations or other usersmay be encountered in the current TV broadcast bands. Once the key science proposed forAG686/706 has been completed, a simple refit (by NRAO) of the 1.5m receivers would enablegeneral user science in somewhat more benign parts of the spectrum, specifically the fixed-mobile
Figure 10—Cross-power spectrum of RFI from 162 to 177 MHz (05 May 27,evening). TV channel 7 appears at the upper end of the spectrum. Below this,the band is allocated to non-TV transmission. Channel spacing is 3 kHz.

- 21/27 -
allocations at either 162-174 (Figure 10) or 216-235 MHz (see also www.ntia.doc.gov/osmhome/allochrt.pdf). The surface mounted 8-pole bandpass filters in each RF module wouldneed to be replaced (~$400 per antenna), and the feed assembly would require adjustment(present arms detached, longer or shorter dipole arms inserted, changing the L/C values used inthe balun at little unit cost). Replacement of the notch filters should not be necessary becausetransmissions in these two bands comprises carriers with narrow-band frequency modulation forwhich excision should be possible, especially after commissioning of the EVLA correlator.
Proposed Deployment Program
Experience has shown that two receiver systems can be installed in one day. We propose to install four systems eachweek, using a full maintenance day and two software half days. Testing will comprise fringe checks usingshort tracks each day and efficiency/holography tests using longer tracks at the end of each week.
The 2005/6 D-configuration, for which 150h has been approved contingent on performance,ends on 2006 January 17. We have adopted a target date for full deployment of MondayDecember 5. In order to be ready, deployment must begin no later than the week of October 10,where we have discounted the week of Thanksgiving. The proposed schedule includes ~15%contingency by not counting the “double maintenance day” that occurs once per month.
The proposed deployment schedule is a substantially faster one than the one proposed at the2005 January review because we had to delay final assessment of results from field testing.Overall, the testing took longer than anticipated because of the unanticipated intensity of RFI(which complicated formulation and interpretation of experiments and measurements) and leadtime in procurement of our 2 MHz front-end filters. Production and lab testing will be phasedso that shipments can be made to the VLA at a steady rate during October and November. Thecomponents with the longest lead times, the 8-pole bandpass filters (Filtro-netics), quadraturehybrids (Anaren), and notch filters (Raltron), have been ordered and arrangements made withmanufacturers to speed delivery where possible. We expect to receive initial deliveries ofbandpass filters by September 10, Q-hybrids by mid-August, and notch filters by September 30.The notches will be the last components to be mounted. However, we anticipate little impactbecause it is possible to assemble and test much of the RF modules without the notch filters inplace.
TEST TIME REQUEST
To assess receiver health and performance, as new units are deployed, we request 1h (night) at theend of each installation day, using a subarray comprising at least four 1.5m-equipped antennas.We will use this time to measure phase noise and to make beam cuts on two axes (at 1.5m). Wealso request 7h (night) at the end of each week for 1.5m and P-band holography and sensitivitymeasurements (3h for holography in each band and 1h for snapshot imaging and study of S/N atdifferent frequencies across the passbands. To establish a baseline, we request 1h (night) shortlybefore the start of deployment to measure G/T for each antenna at P and L-bands (see Table 6).

- 22/27 -
Table 6: Test Time RequestedActivity Timing† Trackfringe test; sensitivity;beam cuts
night; end of eachinstallation day
1h line mode; 1s
dumpholography (1.5/0.92m);sensitivity; passband sweep
night; end of each week 7h line/cont; 1s
dumpbaseline performance(P/L bands)
night; once just beforedeployment starts
1h continuummode; 10s dump
Short stand-off assessment(1.5/0.92m)
night; end of 2nd day 7h line/cont; 1s
dump† Request will depend ultimately on what is practical if coordinationwith broadcasters is necessary.
TESTING AND IMPLEMENTATION OF SHORT STAND-OFFS BETWEEN DIPOLES
The emission that we hope to detect or constrain is extremely weak (on the order of 10 mK), and1.5m sensitivity will be critical to the quality of science we obtain at the VLA (i.e., even a littlemore would be significantly better). Some gains will be achieved through the reduced TRX of theproduction receivers. However, we would like to test at or before the start of deployment, a small modificationto the feed assembly that we anticipate will enable a meaningful increase in gain (e.g., Table 3).Electromagnetic finite element modeling of an infinite ground plane, 0.92m dipole, and 1.5mdipole has shown that the gain of the later can be improved (10%) by reducing the length of thestand-offs that separate the dipoles (Figure 11; Table 7). At present the default spacing (bothdipoles λ/4 from the ground plane) is 15.6 cm, dipole arm center-to-center. We would like totest ~10cm stand-offs. The physical limit set by actual feed geometry is 8 cm.
Table 7: Model 1.5m Gain† vs Distance from a 0.92m Dipole
Distance (cm) 185 MHz (dB) 195 MHz (dB)15.6 7.41 7.3310.0 7.74 7.788.00 7.39 7.905.00 7.28 8.02
† Gains are relative. Reflection loss at the balun input is zero at 195MHz but contributes to loss of gain at 185 MHz.
Tests can be performed once at least two production receivers and feed assemblies are installed atthe VLA. (The existing prototype baluns are narrowly tuned for operation with 15.6 cm stand-offs, and the existing prototype receivers are overall too sensitive to changes in dipole impedanceto be reliable testbeds). Testing to confirm model predictions may be attempted at one of twotimes, depending on readiness of hardware. Our preference is to deploy two productionreceivers without notch filters but augmented by our 2 MHz front-end filters in late Septemberor early October. We estimate the testing will require 2 software intervals and one maintenanceday or two maintenance days. Two 4 hour tracks at night for holography will probably benecessary in the event daytime coordination with broadcasters is not possible.

- 23/27 -
Our contingency is to combine testing and first week deployment activities, though this will be anorganizational challenge. This plan is practical only because first-order tests can be completedquickly (measurement of RMS phase noise and four beam cuts at 1.5 m and 0.92m during thenightly 1h test tracks; see Table 6). Full characterization could be completed before the start ofactivities during the second week and assessment by NRAO completed before the third week.We propose (1) install receivers 1, 2, and 3 with long stand-offs, (2) obtain baseline data at theend of day 2, (3) swap stand-offs and dipole feed assemblies on day 3, while the RF modules forreceiver 4 is being installed, and (4) obtain comparison data over the weekend.
If the rudiments of the model are not born out, deployment can continue with long stand-offs asoriginally planned. Only three antennas will need to be refit, which can be accomplished by theend of week two. If measurements are consistent with the model, then we would presentinformally to NRAO a memo summarizing the tests and results at the start of week two. Thevolume of data to review will be comparatively small, and if the use of short stand-offs isapproved before week three, then only fiveantennas will need to be refitted with short stand-offsover the course of the deployment. Conversely, if use of short stand-offs is not approved, thenonly three antennas will need to be refitted with long stand-offs.
IMPACT OF SHORT STAND-OFFS ON P-BAND PERFORMANCE
Stand-off length affects P-band performance as well as 1.5m performance. Figure 12 shows theresult of electromagnetic modeling for five frequencies across the band, and indicates 5%degradation at 305 MHz and no degradation above 315 MHz. These results are encouragingand will be confirmed with field tests during the same tracks used to evaluate 1.5m performance.
Sensitivity and Key Science
The a priori 1.5m SEFD adopted for technical discussion in our most recent proposal was 2240 Jy(TSYS=160 K, efficiency=40%). The SEFD observed with the prototype receivers on different
Figure 11— Relative 1.5m dipole gain predicted by a finite element model, as afunction of spacing from the 0.92m dipole, including reflection losses at the balun.(blue) 185 MHz. (red) 195 MHz.

- 24/27 -
days has been 2700-4400 Jy. Improvement in TSYS anticipated through simple changes to theRF signal path (10%) will reduce the SEFD to 2400-4000 Jy. If model results are accurate, thenreduction to 2100-3400 Jy (a ~25% gain total) may be achieved with adjustment to feedplacement (see earlier discussion).
For the a priori SEFD, we have previously estimated a thermal noise limit of 3.1 mK assuming a1.6 MHz line, dual polarization, 300h integration with 85% duty cycle, 26 antennas, 0.2 kλ taper(15′ beam half power full width) and sufficiently broad bandwidth to enable simultaneousobservations of one on line band and two off line bands for foreground subtraction. (The 15%overhead is applied to calibration of flux can polarization response.)
Figure 12 – Finite element model gains calculated for a ground plane and horizontal0.92m dipole offset by λ/4, with a 1.5m dipole at different spacings. (top left)—Loaded1.5m dipole. (top right)—Shorted 1.5m dipole. (bottom)—difference between shorted andloaded dipole. A shorted1.5m dipole slightly improves performance of the 0.92m dipoleon average between 305 and 345 MHz. The effect is more pronounced for shorterspacings between dipoles but below 10 cm, the relative gain at 0.92m drops significantlybelow the value in the absence of a 1.5m dipole (7.55 dB).

- 25/27 -
The actual sensitivity we will achieve will depend in part on the correlator mode we select, andthat will be dictated by how we deal with RFI. The originally proposed plan, 800 kHz channelspacing, is no longer viable. The detection of numerous weak lines in cross power, beyond theTV carriers that will be filtered in hardware, will drive us to use excision to a large extent andrequires use of relatively narrow spectral channels, no more than 12.2-24.4 kHz considering the10-20 kHz full widths (zero intensity) of these weak lines. Two possible correlator modes are4×0.781 MHz and 4×1.5625 MHz (with online Hanning smoothing). For the latter, reduction inbandwidth on the line will impose a factor of 1.10 penalty in noise with respect to the originalsensitivity calculation, assuming the central 85% of the band is used. Off-line observations willalternate between high and low frequencies to enable interpolation across the line and therebyminimize systematics. Subtraction of interpolated off-line data will impose a factor of 1.41 noisepenalty. These losses may be offset somewhat by (1) reduction in source sample from 3 to 2(increasing integration time to 450h each in 2007) with concomitant factor of 0.82 noise reductionand (2) improvement in SEFD with a multiplier of 0.90 or 0.75 on the noise level.
For a 4×1.5625 MHz observation of 450h, the thermal noise limit is 4.2 mK to 7.0 mK,, with thedefault 15.6 cm separation between 1.5m and 0.92m dipoles. The noise limit is 3.7 mK to 5.8mK for a 10 cm separation and predicted decrease in SEFD. For a source perfectly matched tothe beam, it would be possible to detect a 100% neutral shell of HI with a signal to noise ratio(S/N) of 3.3-5.5 for a 15.6 cm spacing of dipoles and 3.9-6.2 for a10 cm spacing. (Because thetarget positions and redshifts are known with high accuracy, a 3σ result would be significant.)Alternatively, an upper limit of ~0.5 could be established with 3σ significance for overall goodRFI conditions (obtained via coordination with broadcasters) and a 10 cm offset between dipoles.This would be a substantive advance given that at present there are NO direct constraints on theneutral fraction during the epoch of reionization. However, we note with some caution thatreaching the thermal noise will be a challenge (see last section). On the other hand, substantiveuncertainties probably exist in prediction of source strength, which depends on indirect inferenceof quasar luminosity, degree of concentration of intergalactic Hydrogen on length scales of ~5Mpc, accretion geometry, degree of overlap among quasar HII regions, and quasar age. In thislast case, a 20% increase in source size would enable use of a slightly heavier (u,v) taper than 0.2kλ and modest improvement in surface brightness sensitivity.
Sensitivity and Legacy Science
We anticipate that observing for legacy science (~185 MHz) will be somewhat less sensitive thanfor key science (~195 MHz). Sky temperatures will be ~ 10-15% hotter depending on proximityto the galactic plane at the lower frequency, and receiver systems will be less well optimized tosome degree. On the other hand, larger array configurations will be usable, which reduces theimpact of RFI. For a 6h track on source, 27 antennas, two 1.3 MHz IF (85% of 1.5625 MHz),and conservative SEFD of 5000 Jy, the thermal noise limit will be ~1 mJy or 400-500 K in the A-configuration (9′′ synthesized beam).
Miscellaneous IssuesMAINTENANCE AND SPARESSAO is constructing 28 receiver units for deployment at the VLA. At the request of the earlierreview panel, SAO will also provide 2 complete spare feed assemblies and receivers, 3 extra (fully

- 26/27 -
stuffed) receiver circuit boards and balun circuit boards, and two extra sets of cables. These extraparts will be provided after the 28 receiver systems are deployed. All schematics, mechanicaldrawings, circuit board designs, part descriptions, and lab/field procedure descriptions will beturned over in editable electronic formats agreeable to NRAO and SAO personnel. There areno specialized test fixtures at this time.
There are no special maintenance requirements known above and beyond what may be appliedto the P-band receivers. The RF module, including bulkhead connectors, are sealed with rubbergaskets and silicon RTV adhesive. The LMR-300 cables that connect the feed and receiver arerated for 30 years, outdoor use. Power cables are Teflon coated, and connector ends are shrinkwrapped. The dipole assembly is also weather tight (RTV), and it contains no active componentsapart from the dipole shorting switches. The default position will be shorted, to protect P-band.(The default position for the control relay that alternates power between P-band and 1.5mreceivers will also select P-band.) Exposed surfaces are either brass (painted) or P.E.T.(Polyethylene Terephthalate), which will not degrade in sunlight or as a result of temperatureswings.
MOUA draft MOU was assembled in 2005 May in consultation with the Jim Ulvestad and CharlesAlcock. It has been under consideration by the director of NRAO. In light of progress madesince May, some revision may be appropriate.
OBSERVING SUPPORTThe real-time system already routines services observe files for 2-band, and requiredmodifications to JOBSERVE may be small. There are two differences between P-band and 2-band observing cards. First, the band identifier “22.” Second, the L6 setting most often used is–839.9 MHz for an IF nominally centered at 185.1 MHz (VLA 25 and 50 MHz front-end filter)or 187.1 (VLA 12.5 MHz front-end filter). L6 settings of -810.1 and -860.1 MHz will alsopartially overlap the intended pass band of the 2-band receivers (184-198 3dB), if the 50 MHzfront-end filter is specified.
SOFTWAREField-test data has been reduced using AIPS without modification. In order to make possiblepolarization beam calibration, foreground subtraction, and active RFI mitigation, it will probablybe necessary to switch at least a fraction of the processing to AIPS++ or derivatives. Aprocessing path in AIPS++ has not yet been formulated. Some algorithm development will benecessary. We anticipate employment of two to three post-doctoral fellows or students at SAOand NRAO, who will be responsible for these developments.
Uncertainties
In the context of the perspective discussed on page 3, we note the following uncertainties that arestill outstanding. Requested observing time in the 2005/2006 D-configuration will enable us toaddress most of these. Some relate to extrinsic factors (e.g., the good faith of broadcasters withwhom are in discussions regarding coordination) and are unlikely to disappear altogether.

- 27/27 -
• Is there a limit to how quickly or how far image noise levels will drop with integrationtime; how much does modulated analog TV transmission away from carriers limitdynamic range; when DTV channels 9 and 10 are will subtraction of compactextragalactic foreground sources truly enable imaging to the thermal noise limit; willpolarization calibration be stable and adequate to enable accurate subtraction of diffusegalactic foreground emission?
o The answer is not yet known because of dynamic range limits and calibrationlimitations imposed by a three element test array. Proper treatment requires a fullor nearly full deployment.
• Will the TV/RFI environment worsen, making key and legacy science impossible?o We have anticipated broadcasting on channels 9 and 10, which is critical to
proposed key science. Coordination appears possible, though it depends onbroadcasters’ flexibility and continued neighborliness.
o Legacy science at 184-186 MHz may be affected by eventual development ofDTV broadcasting on channel 8, although terrain shielding is good (Farmington).We have established the contingency of shifting general user science to lowerfrequencies in the era of the EVLA correlator (162-174 MHz).
o Continued interest by UNM in low frequency astronomy at the VLA site maystrengthen our position in discussions with local broadcasters.
• Will internally generated inteference be a problem for EVLA electronics?o The EVLA is expected to be at least as quiet at the VLA.o Nearly all internal RFI enters the existing signal path via the feed.o The 3 kW power supplies have been identified as a potential source of RFI.o We are working to measure the impact of these supplies over the next week. In
the worst case, the EVLA is likely to shield the power supplies, driven at least inpart by a desire to protect P-band performance.
• Will the EVLA antennas be ready by 2005 December?o We hope NRAO will have installed the requisite P-band RF support modules and
utility modules for control of the dipole shorting and DPDT receiver powerswitches (Figure 4). If this proves impractical, we will move ahead becauseoperation with 21 or 22 antennas is better than not operating at all, in light of theneed to demonstrate capability in support of our request for time in 2007. Thesame applied to the EVLA antenna power supply shielding. If it is not available,we will choose to drop the EVLA antennas.
We thank B. Clark, I. Ginsburg, R. Hayward, R. Kimberk, S. Leiker, J. McClendon, D.Mertely, L Peritz, P. Sanchez, L. Serna, R. Smith, K. Sowinski, E. Tong, J. Wrobel, andthe VLA operators and staff for contributions and assistance during the 1.5m field testingprogram.