Natural Flood Defences Rhine/Meuse Wouter Helmer Ark Foundation.

- 1 -
A Proposal for 3D stochastic modeling ofthe Rhine Meuse Delta
Amisha Maharaja
Stanford Center for Reservoir Forecasting
April 10, 2003
Abstract
An extensive data set on the Rhine-Meuse delta in the Netherlands has beenassembled by the researchers at Utrecht University to reconstruct the paleogeographicevolution of the fluvial part of the Holocene delta and to study the factors influencing thepaleogeographic development of the delta. The data set contains approximately 200,000lithological borehole descriptions and reconstructed 2D paleogeographic maps of thedelta from various times in the Holocene.
A 2D-slice stacking approach is proposed for the construction of the 3Darchitecture model of the delta. Paleogeographic maps taken at various times in theHolocene will be used to obtain 2D training images of the delta. A sample of theborehole data will be considered as conditioning hard data for the 2D stochasticrealizations to be generated. Channel depth will be assigned stochastically based on thechannel morphology, thus a flattened 3D slice will be generated for a given time.Similarly 3D slices will be generated for different times in the Holocene and then stackedto create an overall 3D fluvial architecture model of the delta.
The advantage of this model is that it will be based on a well-studied delta and thelater time paleogeographic maps can be used to check the prediction made by this model.Such stochastic approach can be modified to model other ancient deltas that are ofhydrocarbon interest.

- 2 -
Introduction to the Data Set
The data set on the Rhine-Meuse delta assembled by Utrecht University is anextensive qualitative and quantitative data set that has been collected to reconstruct thespatial and temporal evolution of the fluvial part of the delta, with an emphasis on theHolocene evolution (past 10,000 years). The data set is the result of over 40 years offield data collection and more than 1400 undergraduate students, about 50 graduatestudents, 85 student-assistants and 10 Ph.D. students have participated in the process.Professor H. J. A. Berendsen has been leading, innovating and coordinating the researchsince 1973 and is an author of several publications on the subject (see references).Virtually the entire Rhine-Meuse delta has been mapped in detail and approximately200,000 lithological borehole descriptions, 1200 14C dates, 36,000 archaeologicalartifacts, and data on gradients of paleochannels is available. A complete guide to theresearch done at Utrecht was published in 2001 co-authored by Berendsen andStouthamer and this paper summarizes the major data sets described in it. The maps,borehole data and 14C dates are available in digital format to enable the generation ofpaleogeographic maps for any time during the Holocene within accuracy of ± 200 years.In addition, the data set contains a wealth of conceptual and actual images of differenttypes of river systems that can be utilized to generate a catalog of training images. The principal use of the data set has been in reconstructing the paleogeographicevolution of the Rhine-Meuse delta on a time scale of eight millennia with a resolution ofa few centuries. The factors controlling avulsion and the sedimentary products ofavulsions have been studied. Avulsion is defined as the abandonment of a part or thewhole of channel belt by a stream in favor of a new course (Allen, 1965). It is animportant parameter that influences geomorphology and alluvial architecture bydetermining the channel recurrence interval on the floodplain, and consequently channeldensity and interconnectedness (Berendsen and Stouthamer, 2001). Quantitativeassessment of avulsion parameters such as avulsion frequency, avulsion duration, andinter-avulsion period has been done for this particular delta. 91 avulsion sites have beendated and located geographically based on the paleogeographic reconstruction. A newresearch project aimed towards producing a 4D process-based model of delta evolutionby avulsion is being developed at Utrecht University.
Background
Rhine facts
The oldest sediments of the Rhine date from the Miocene when it was a small streamdraining the Graben of the Lower Rhine Embayment (SCHIRMER 1990). From ageological point of view, the apex of the Rhine delta is located near Bonn (Germany),

- 3 -
where the Rhine leaves the Rhenish Massif and enters the North Sea basin. The presentmean annual discharge of the Rhine is about 2200 m3/s; that of the Meuse (Dutch: Maas)is smaller by about a factor of ten. Rhine discharge is divided among three distributaries:Waal (6/9 of total discharge), Nederrijn-Lek (2/9) and Ijssel (1/9). The Maas has been atributary of the Rhine during most of geological history.
Areal extent of study area
The study area is the fluvial part of the delta as shown in the Figure 1. Virtually all of theHolocene delta has a subaerial origin, and was formed by river sedimentation in a backbarrier area or by peat formation and covers an area of about 5700 km2. All the boreholeshave been obtained within this area and the mapping of the channel belts is also restrictedto this area.
Thickness of the deposits
Because of the morphology of the North Sea basin, the Pleistocene lowstand deltas of theRhine-Meuse system occur far seaward of the highstand deltas. Consequently, theHolocene wedge occurs not on top of the preceding lowstand delta, but overlies alluvialplain sediments of Pleistocene age on top of a delta front sequence of Early Pleistoceneage. The thickness of the clayey floodbasin deposit ranges from about 1 m near theGerman border to about 25 m near the Dutch coast, where thick peat layers occurintercalated with clay (Berendsen and Stouthamer, 2001).
Subdivision of the delta area
The Holocene Rhine-Meuse delta area can be subdivided into the following areas, seeFigure 2 (Berendsen and Stouthamer, 2001):
• The fluvial area, characterized by meandering rivers, 1 - 2 km wide channel belts andrelatively small floodbasins.
• The back-barrier coastal plain with strong fluvial influence, sometimes called the'perimarine' area (Hageman, 1969). This area is characterized by narrow, low-sinuosity meandering and straight anastomosing channel belts (Makaske, 1998).Floodbasins are large and contain thick layers of peat.
• The estuarine and back-barrier tidally influenced area, with intertidal deposits ofAtlantic and Subboreal age, covered with peat. Sedimentation processes in this areahave been described in brief by De Jong et. al. (1962). Approximately 3700 yr BP thecoast was closed and extensive peat formation occurred in the back-barrier area.Where peat has been excavated for fuel and salt extraction, lakes occur. Since about1450 AD many of these lakes have been pumped dry. In that case Atlantic tidaldeposits occur at the surface.

- 4 -
• The barrier beach and coastal dune area. The oldest preserved barrier beaches withlow dunes are located farthest inland (Zagwijn, 1984).
Wave/Tide/Fluvial dominated delta?
The coastal area of the Netherlands can be subdivided into three regions, see Figure 3(Berendsen and Stouthamer, 2001):
1. the southwestern coast, characterized by tidal inlets and the estuary of the Scheldt,
2. the Holland coast, without tidal inlets, where wave action is the dominant process,
3. the northern coast of the Wadden Sea, with islands, tidal inlets, and large tidal flatsthat are inundated only with high tide. Strictly speaking, the Wadden Sea lies outsidethe Holocene delta area.
Tidal difference varies from almost 4 m in the southwest to 2 m along the central part ofthe coast, and then increases again to almost 3 m in the northeast. It is generally acceptedthat the tidal differences have not changed much over the last few thousand years. Thetidal difference is considered to be one of the parameters influencing the Holoceneevolution of the fluvial and coastal plain (Berendsen and Stouthamer, 2001). Thus, thedelta cannot be strictly classified into a single category. Instead, it is appropriate toclassify it as a mixed tide and wave dominated delta.
Spatial information
MapsThe geological-geomorphological map (scale 1:10,000) of the Rhine-Meuse delta isessentially based on corings and maps made by undergraduate and Ph.D. students ofphysical geography at Utrecht University. The original maps were to the scale of1:10,000. These maps have been stored in a digital format using Geographic InformationSystem (GIS) at a scale of 1:50,000, together with information on the age of the mappedphenomenon.
A printed map (scale 1:100,000) obtained from the GIS database has beenincluded with the data set. This map shows the ages of the Holocene channel belts,organized in 500 yr ( ± 100 yr) time intervals. Time is expressed as conventionalradiocarbon years BP. The map shows only the fragments of channel belts that survivederosion by younger river systems. 206 such channel belts have been identified, mapped,and dated using 14C. In the GIS, however, reconstructed eroded parts of the channel beltshave been implemented to enable the generation of paleogeographic maps for any timeduring the Holocene. Sixteen reconstructed paleogeographic maps from 10,000 yr BP topresent are provided as JPEG images on the accompanying CD. Each map shows thechannel belts existing at a given time as well as the abandoned channel belts. For e.g. themap of channel belts for 5,500 BP shows the channel belts active at that time and theabandoned channel belts from 10,000 yr BP to 5,500 yr BP in a different color.

- 5 -
In the GIS, all channel belt fragments have been stored in a single layer as amosaic of polygons and not as a layered system. Therefore, the GIS are a database ofchannel belt fragments rather than a database of channel belts. Consequently, the systemis based on raw data and independent of the reconstruction the researcher has in mind.Modifications or alternative reconstructions can be made easily. In this way, the GIS wasnot only used as a mapping tool, but also as an analysis tool. The time series map ofpaleogeographic reconstruction of the channel belts from various times in the Holocenederived from the GIS, for example was used both to visualize and to test thepaleogeographic reconstruction (Berendsen and Stouthamer, 2001).
A 150 km long longitudinal (W-E) geological cross-section of the Rhine-Meusedelta is also included in the data set. The cross-section was generated using corings andthe GIS for archaeological application.
Borehole dataOne of the most important data available is borehole description. Lithologicalinformation about the delta such as grain size, texture, has been obtained by coring, orwhenever available, from excavations. The coring density varies from 30 to 350 per km2
with the minimum drilling depth being 2-3 m and the maximum drilling depth being 15m. Corings were initially made in cross-sections, with a coring separation distance of100 m and in some areas, as small as 5 m. Approximately 200,000 boreholes have beendrilled and described, and at least 20% of the boreholes penetrate the entire Holocenesequence.
Core Locations
The location of the core is described in a consistent fashion using the topographic map ofthe Netherlands, scale 1:10,000. Within each kilometer square, x and y distances of theborehole location are measured in meter relative to the coordinate lines west and south ofthe borehole. The z-coordinate (elevation relative to mean sea level) was generally takenfrom the elevation map of the Netherlands, scale 1:10,000, and have an accuracy of ± 5cm. In some cases (e.g. 14C sampling) elevation was determined by leveling with anaccuracy of ± 0.1 cm.
Parameters described
All sediment cores have been described in the field at 10 cm intervals (or more detailed,if necessary). The borehole descriptions involve a description of the following:
• Texture (using Dutch textural units)• Organic material content• Gravel content• Median grain size• Color• Iron and calcium carbonate content (using a 5% HCl solution)

- 6 -
• Occurrence of ground water• Shells
A total of 80,000 core descriptions are available in digital form (as of 2001). Thecomputer program LLG-info enables to select any kind of information from the boreholedescriptions, and export it to a GIS environment. Thus, information about any attributefrom the database is easy to access. All 200,000 borehole descriptions will eventually fiton one CD-ROM, and will be made available to scientific workers and other applicants.
Temporal Information
To reconstruct the paleogeographic development, 206 erosional remnants of channel beltswere described, mapped, and dated. Different methods have been used with varyingdegree of confidence for determining the relative and absolute ages of the channel beltfragments.
Methods used for dating and correlating channel belt fragments include:
• Geological and geomorphological mapping• Calcium carbonate content• Soil formation• Relative depth of overbank deposits• Gradient of the top of the (sandy) channel deposits (GTS-line method)• Gradient of the top of the natural levees• Pollen analysis• Archaeological artifacts• 14C analysis
Most of the above mentioned methods are useful for determining the relative ages of thechannel belts. Absolute ages are obtained by through 14C analysis and archaeologicalartifacts. 14C dating in general has proven to be the best and most widely applicable wayof dating Holocene fluvial systems in the Rhine-Meuse delta (Berendsen and Stouthamer,2001). Over 1200 14C datings have been carried out in the fluvial part of the delta, out ofwhich at least 500 of them are useful for the age determination of Holocene riversystems. The 14C ages of the 206 channel belts are provided in Appendix 4 in Berendsenand Stouthamer, 2001. AMS-dating is used to enhance the reliability of dates becausebotanical contamination can be avoided by dating selected terrestrial macrofossils, suchas seeds. Details of AMS-radiocarbon dated samples are provided in Appendix 2. Basedon the presently available data, a complete reconstruction of the paleogeographicdevelopment could be made from approximately 7000 14C years BP to the present.
Appendix 1 in Berendsen and Stouthamer, 2001 contains details of over 1200radiocarbon dates and forms the principal temporal data set. The following informationis included:

- 7 -
• Laboratory number and sample name• Age and standard deviation• Coordinates (x, y, z)• Sample depth relative to the surface• Material dated• Sample positive relative to layer• Significance• Type of date (beginning or end of sedimentation)• References and remarks
Description of Channel Belts
An important data set that was obtained from mapping and dating is a description of allthe channel belts in the delta area in the Netherlands. A total of 206 channel belts havebeen identified, dated, and described. This information is included in Appendix 3 inBerendsen and Stouthamer, 2001.
The characteristics given for each channel belt is as follows:
• Upstream/downstream coordinates• Highest sand elevation (relative to mean sea level)• Average gradient (cm/km)• Upstream and downstream connections• Dating evidence• Beginning of sedimentation• End of sedimentation• Archaeology• References
Detailed mapping shows that Holocene channel belts with their contemporaneous naturallevees occur as an intricate maze of sand bodies in a clayey and peaty matrix. Youngerchannel belts have eroded older channel belts, leaving only erosional remnants. Afterconnecting the erosional remnants of (approximately) the same age, the resulting paleo-river is described as a ‘river system’. For example, the Benschop river system consists ofa number of channel belts, that are all related to the main channel of the Rhine between7600 and 5350 14C yr BP (Berendsen and Stouthamer, 2001). Seven such river systemshave been identified.
Figures

- 8 -
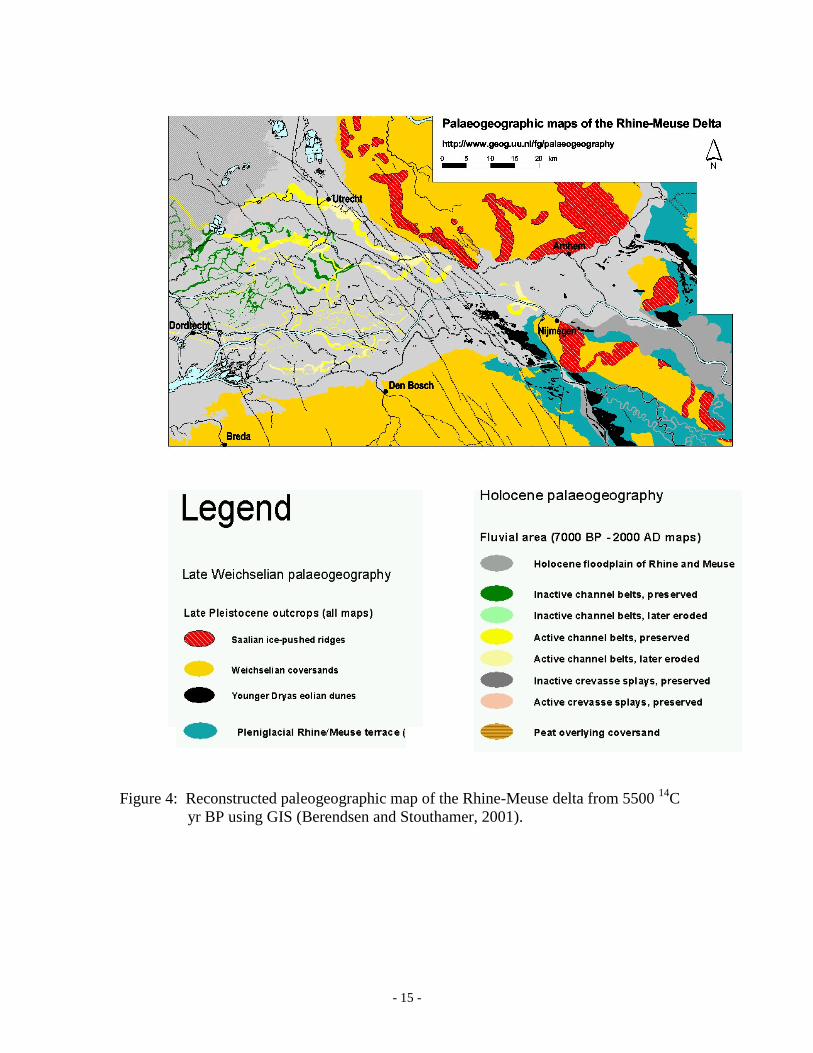
Sixteen reconstructed paleogeographic maps from 10,000 yr BP to present are providedas JPEG images on the accompanying CD. The GIS files that were used to create themaps are provided as well. Each map shows the channel belts existing at a given time aswell as the abandoned channel belts. For e.g. the map of channel belts for 5,500 BPshows the channel belts active at that time and the abandoned channel belts from 10,000yr BP to 5,500 yr BP in a different color, see Figure 4. These maps can be utilized inseveral ways. For instance, they can be used to obtain a training image for the delta atany time t ∈[0, 10,000] yr BP. They can be also be used to validate the distribution ofthe channel belt at time t + ∆ t predicted by modeling.
Moreover, the CD accompanying the data set contains conceptual and actualimages of rivers and deltas of the world, which are helpful in understanding fundamentaldifference between the various river types, see Figure 5. Important characteristics suchas facies distribution, net-to-gross ratio, average channel width, width-to-depth ratio,spatial continuity, sinuosity, and branching can be inferred from the images and usedwhile making a decision of stationarity for the Rhine-Meuse delta.
Use of Rhine-Meuse Delta Data Set
The principal purpose of the researchers at Utrecht University was to reconstructthe Holocene paleogeographic evolution of the Rhine-Meuse delta and understand theparameters that are responsible for the evolution. Avulsion, caused by geologic factorsand human influence, is considered to be the key mechanism behind the Holoceneevolution of the delta (Berendsen and Stouthamer, 2001).
Using this extensive database, studies have been performed to qualitatively accessthe factors controlling the Holocene avulsion history of the Rhine-Meuse delta(Berendsen and Stouthamer, 2000, 2001). Avulsion sites have been inferred from thepaleogeographic reconstruction.
Detailed study of three avulsion sites in the delta was done to qualitativelyunderstand the characteristics of deposits related to avulsion and to determine if avulsionlocation can be recognized by characteristic sediment architecture (Stouthamer, 2001).
Quantitative analysis of the data set includes the determination of quantitativevalues for avulsion parameters such as avulsion frequency, avulsion duration, and inter-avulsion period (Berendsen and Stouthamer, 2001(a)). The relationship of theseparameters with the products of avulsion has been studied for the Rhine-Meuse delta andcompared with that of other rivers and deltas around the world. These parameters areimportant for process-based modeling.
A new research program to construct a 4D process-based alluvial architecturemodel simulating delta evolution based on Mackey and Bridge (1995) model is beingdeveloped at Utrecht University. The aim is to test the model against real world alluvialarchitecture data such as the Rhine-Meuse data, validate it using data from other deltas inthe world, and perform sensitivity analysis on input parameters on model outcomes indifferent geologic settings.

- 9 -
Proposed work on the Rhine-Meuse data set
The objective is to construct a 3D stochastic model of the channel architecture and faciesdistribution in the fluvial part of the Holocene Rhine-Meuse delta using the extensivedata set assembled by the researchers at the Utrecht University.
Building the 3D model
This data set is unique because it contains not only abundant borehole data but alsopaleogeographic reconstruction of channel architecture of the delta from various times inthe Holocene. The reconstruction is done in a GIS environment and it represents theresearcher’s interpretation of channel architecture supported by field observations. Toexploit these resources fully, a 2D-slice stacking approach is proposed to construct thefinal 3D model.
The modeling process will begin by selecting a suitable training image for thedelta from 10,000 yr BP, which represents the beginning of the Holocene. A trainingimage captures prior geological knowledge about the delta and is equivalent to using avariogram in two-point statistics. A few borehole data taken from a later time, say 9000yr. BP, will be used to generate conditional equiprobable realizations. Information suchas channel orientation, sinuosity, thickness, etc. will be extracted from thepaleogeographic map from that time and the realizations will be modified accordingly.Channel thickness will be assigned stochastically to the realizations based on the channelmorphology. Hence, a flattened 3D realization will be obtained, see figure 6b. Selectinga training image at a new time and following the above procedure, other flattened 3Drealizations can be produced for subsequent times in the Holocene. The optimum timesteps for selecting training images will be determined using the paleogeographic mapsand the borehole data.
In the final stage, the realizations will be stacked such that the oldest realization isat the base and the youngest is at the top. This stack of realizations will represent the 3Dmodel of the delta for the entire Holocene, see figure 6c. The model will honor the hardborehole data and the geological information contained in the paleogeographic maps.
Field evidence shows that younger channel belts have eroded older channel beltsas a result of avulsion. The younger channel belt either occupies the older channel belt, orcrosses over the older channel belt, see figure 7. In the latter case, the channel belts maycross in the same plane or the younger channel belt may be in a plane higher than theolder one depending on the relative ages of the channel belts. The former will beincorporated into the model by including overlapping channel belts in the training image,while the latter scenario will be implemented by including channel belts that cross, butoccur in different layers.

- 10 -
Predicting the 2D channel architecture
The paleogeographic maps are a valuable source of information for various channelcharacteristics such as channel pattern, orientation, sinuosity, width, length, density, etc.Apart from using these maps to select training images and generate the realizations, theycan also be used (along with borehole data) to test the ability of the stochastic method topredict channel architecture at some time t using only a few borehole data. For instance,the realizations obtained using a few conditioning data at time t can be compared to thepaleogeographic map taken at time t for similarities in channel patterns, locations,orientation, density, and other important characteristics.
The number of borehole data used for conditioning can be increased or decreasedbased on how well the resulting realization matches with the GIS map. In general, thegreater the conditioning data, the smaller the uncertainty, hence a better match can beexpected. During early hydrocarbon exploration, very few wells are drilled andconditioning data is sparse, while for mature fields, typically, a fair amount of well data isavailable. Thus, by varying the number of hard conditioning data, one can mimicmodeling of real world hydrocarbon reservoirs from early exploration to productionstages.
Advantages from this model
The data set contains 200,000 borehole information, which is remarkable for earthsciences data sets. Moreover, paleogeographic maps of the delta during any time in theHolocene have been constructed based on extensive field mapping and 14C dating of thechannel belts. These maps offer a unique opportunity to evaluate the prediction ability ofthe modeling algorithms as described above while varying the number of conditioningdata.
The concept of training images as structural models can be explored in detailwith the aid of the paleogeographic maps. The issue of stationarity and the level of detailto be incorporated in the training image can be investigated.
The main advantage of stochastic modeling is the ease of data conditioning. Byconditioning to available hard and soft data, a stochastic model can be morphed to modelany other delta of hydrocarbon significance. Thus, the model will not be exclusive to theRhine-Meuse delta, but will be an inclusive model that can be fully exploited forhydrocarbon exploration and production.

- 11 -
References
ALLEN, J.R.L. (1965), A Review of the Origin and Characteristics of Recent AlluvialSediments. Sedimentology 5, p. 89-191.
BERENDSEN, H. J. A., and STOUTHAMER, E. (2000), Factors controlling the Holoceneavulsion history of the Rhine-Meuse delta. Journal of Sedimentary Research, v.70, no. 5, p. 1051-1064.
BERENDSEN, H. J. A., and STOUTHAMER, E. (2001), Paleogeographic development of theRhine-Meuse delta, the Netherlands. Utrecht University.
BERENDSEN, H. J. A., and STOUTHAMER, E. (2001 a), Avulsion frequency, avulsionduration, and interavulsion period of Holocene channel belts in the Rhine-Meusedelta, the Netherlands. Journal of Sedimentary Research, v. 71, no. 4, p. 589-598.
DE JONG, J.D., I.S. ZONNEVELD & J.I.S. ZONNEVELD (1962), Air-trip to the Delta Area.Mededelingen van de Geologische Stichting 14, p. 9-20.
HAGEMAN, B.P. (1969), Development of the Western Part of The NetherlandsDuring the Holocene. Geologie en Mijnbouw 48, p. 373-388.
MACKEY, S.D., & J.S. BRIDGE (1995), Three-dimensional model of alluvial stratigraphy:theory and application: Journal of Sedimentary Research v. B65 (1), p. 7-31.
MAKASKE, B. (1998), Anastoming rivers - Forms, processes and sediments. Ph.D. Thesis,Universiteit Utrecht. KNAG/Faculteit Ruimtelijke Wetenschappen, NetherlandsGeographical Studies 249, 287 p.
SCHIRMER, W. Ed. (1990), Rheingeschichte zwischen Mosel und Maas. Deuqua-Führer 1.Hannover.
ZAGWIN, W.H. (1984), The Formation of the Younger Dunes on the West Coast of TheNetherlands (AD 1000-1600). Geologie en Mijnbouw 63, 259-269.
STOUTHAMER, E. (2001), Sedimentary products of avulsions in the Holocene Rhine-Meuse delta, the Netherlands. Sedimentary Geology, no. 145, pg. 73-92.

- 12 -
Appendix: Figures
Figure 1: The study area (Berendsen and Stouthamer, 2001, pg. 4)

- 13 -
Figure 2: Subdivion of the Rhine-Meuse delta area (Berendsen and Stouthamer, 2001. pg. 14)

- 14 -
Figure 3: Subdivision of the Dutch Coast (Berendsen and Stouthamer, 2001, pg. 7)
- 15 -
Figure 4: Reconstructed paleogeographic map of the Rhine-Meuse delta from 5500 14C yr BP using GIS (Berendsen and Stouthamer, 2001).

- 16 -
Figure 5: Conceptual illustration of different types of rivers (Berendsen and Stouthamer, 2001, pg. 21)

- 17 -
c) 3D model
(a) Longitudinal View
(b) Flattened 3D Slice
Figure 6: Conceptual diagram of the 3D model. (a) Longitudinal cross-section of themodel showing the gradient lines of the channel belts at various times in the Holocene(from: Berendsen and Stouthamer, 2001); (b) 3D view of a hypothetical slice at sometime t in the Holocene; (c) 3D view of the model after stacking of the 3D slices fromvarious times in the Holocene.

- 18 -
Figure 7: Illustration of crossing channel belts (from: Berendsen and Stouthamer, 2001)