A promyelocytic leukaemia protein-thrombospondin 2...
28
Dvorkina et al. A promyelocytic leukaemia protein-thrombospondin 2 axis and the risk of relapse in neuroblastoma 1 A promyelocytic leukaemia protein-thrombospondin 2 axis and the risk of relapse in neuroblastoma Maria Dvorkina a1 , Valentina Nieddu b,c,d,1 , Shalini Chakelam a,2 , Annalisa Pezzolo e,2 , Sandra Cantilena b,f , Ana Paula Leite a , Olesya Chayka b,f , Tarik Regad a,g , Angela Pistorio h , Angela Rita Sementa i , Alex Virasami f,j , Jack Barton f,j , Ximena Montano f,j , Tanguy Lechertier k , Nicola Brindle a , Daniel Morgenstern f,j , Morgane Lebras l , Alan Burns f , Nigel Saunders b , Kairbaan Hodivala-Dilke k , Luigi Bagella c,d , Hugues De The l , John Anderson f,j , Neil Sebire f,j , Vito Pistoia h , Arturo Sala b,f,2 and Paolo Salomoni a,2 . Affiliations: a University College London Cancer Institute, Samantha Dickson Brain Cancer Unit, UCL, London, UK; b Department of Life Sciences, Brunel University London, Uxbridge, UK; c Department of Biomedical Sciences, and National Institute of Biostructures and Biosystems, University of Sassari, Sassari, Italy; d Sbarro Institute for Cancer Research and Molecular Medicine, Center for Biotechnology, College of Science and Technology, Temple University, Philadelphia, USA e Laboratorio di Oncologia, Istituto Giannina Gaslini, Genova, Italy; f UCL Institute of Child Health, London, UK; g Nottingham Trent University, Nottingham, UK; h Laboratorio di Anatomia Patologica, Istituto Giannina Gaslini, Genova, Italy; i Epidemiologia e Biostatistica, Istituto Giannina Gaslini, Genova, Italy; j Great Ormond Street Hospital, London, UK; k Barts Cancer Institute, Queen Mary University, London, UK; l Institut Universitaire d’Hematologie, Sant-Louis Hospital, Paris-Diderot, France; 1 Equal contribution (First author) 2 Equal contribution (Second author) 3 Corresponding authors: Paolo Salomoni, UCL Cancer Institute, Samantha Dickson Brain Cancer Unit, University College London WC1E 6DD, London UK; email: [email protected]; or Arturo Sala, Department of Life Sciences, Brunel University London, UB8 3PH, Uxbridge UK; email: [email protected] Running title: A PML-I/thrombospondin-2 axis regulates angiogenesis We do not have any conflict of interest to disclose
Transcript of A promyelocytic leukaemia protein-thrombospondin 2...

Dvorkina et al. A promyelocytic leukaemia protein-thrombospondin 2 axis and the risk of relapse in neuroblastoma
1
A promyelocytic leukaemia protein-thrombospondin 2 axis and the risk of relapse in neuroblastoma Maria Dvorkinaa1, Valentina Nieddub,c,d,1, Shalini Chakelama,2, Annalisa Pezzoloe,2, Sandra
Cantilenab,f, Ana Paula Leitea, Olesya Chaykab,f, Tarik Regada,g, Angela Pistorioh, Angela Rita
Sementai, Alex Virasamif,j, Jack Bartonf,j, Ximena Montanof,j, Tanguy Lechertierk, Nicola
Brindlea, Daniel Morgensternf,j, Morgane Lebrasl, Alan Burnsf, Nigel Saundersb, Kairbaan
Hodivala-Dilkek, Luigi Bagellac,d, Hugues De Thel, John Andersonf,j, Neil Sebiref,j, Vito Pistoiah,
Arturo Salab,f,2 and Paolo Salomonia,2.
Affiliations: aUniversity College London Cancer Institute, Samantha Dickson Brain Cancer Unit, UCL, London, UK; bDepartment of Life Sciences, Brunel University London, Uxbridge, UK; cDepartment of Biomedical Sciences, and National Institute of Biostructures and Biosystems, University of
Sassari, Sassari, Italy; dSbarro Institute for Cancer Research and Molecular Medicine, Center for Biotechnology, College of
Science and Technology, Temple University, Philadelphia, USA
eLaboratorio di Oncologia, Istituto Giannina Gaslini, Genova, Italy; fUCL Institute of Child Health, London, UK; gNottingham Trent University, Nottingham, UK; hLaboratorio di Anatomia Patologica, Istituto Giannina Gaslini, Genova, Italy; iEpidemiologia e Biostatistica, Istituto Giannina Gaslini, Genova, Italy; jGreat Ormond Street Hospital, London, UK; kBarts Cancer Institute, Queen Mary University, London, UK; lInstitut Universitaire d’Hematologie, Sant-Louis Hospital, Paris-Diderot, France;
1Equal contribution (First author) 2Equal contribution (Second author)
3Corresponding authors: Paolo Salomoni, UCL Cancer Institute, Samantha Dickson Brain Cancer Unit,
University College London WC1E 6DD, London UK; email: [email protected]; or Arturo Sala,
Department of Life Sciences, Brunel University London, UB8 3PH, Uxbridge UK; email:
Running title: A PML-I/thrombospondin-2 axis regulates angiogenesis
We do not have any conflict of interest to disclose
Dvorkina et al. A promyelocytic leukaemia protein-thrombospondin 2 axis and the risk of relapse in neuroblastoma
2
Translational relevance
Neuroblastoma is a childhood malignancy originating from the sympathetic nervous system that
is prone to metastasize and relapse. PML is a tumour suppressor gene frequently deregulated
in cancer, but its prognostic and functional significance in neuroblastoma is unknown. A fraction
of localized neuroblastomas recur locally after surgery and can do so several times in spite of
further treatments, eventually killing the patient. In this study we have established that PML-I is
a negative regulator of angiogenesis via activation of thrombospondin-2 and its reduced or
absent expression in localized neuroblastoma is an accurate marker of the risk of relapse. An
important clinical implication of our study is that PML expression could be now used to identify
patients with low-risk, localized tumors needing systemic treatments to avoid cancer recurrence.
Abstract
Purpose. Neuroblastoma is a childhood malignancy originating from the sympathetic nervous
system with a complex biology, prone to metastasize and relapse. High-risk, metastatic cases
are explained in part by amplification or mutation of oncogenes such as MYCN and ALK and
loss of tumour suppressor genes in chromosome band 1p. However, it is fundamental to identify
other pathways responsible for the large portion of neuroblastomas with no obvious molecular
alterations.
Experimental design. Neuroblastoma cell lines were used for assessment of tumour growth in
vivo and in vitro. Protein expression in tissues and cells was assessed using
immunofluorescence and immunohistochemistry. The association of PML expression with
neuroblastoma outcome and relapse was calculated using log-rank and Mann-Whitney tests,
respectively. Gene expression was assessed using chip microarrays.
Results: PML is detected in the developing and adult sympathetic nervous system, whereas it
is not expressed or low in metastatic neuroblastoma tumours. Reduced PML expression in
patients with low-risk cancers - i.e. localized and negative for the MYCN protooncogene - is
strongly associated with tumour recurrence. PML-I, but not PML-IV, isoform suppresses
angiogenesis via upregulation of thrombospondin-2 (TSP-2), a key inhibitor of angiogenesis.
Finally, PML-I and TSP-2 expression inversely correlates with tumour angiogenesis and
recurrence in localized neuroblastomas.
Dvorkina et al. A promyelocytic leukaemia protein-thrombospondin 2 axis and the risk of relapse in neuroblastoma
3
Conclusions: Our work reveals a novel PML-I-TSP2 axis for regulation of angiogenesis and
cancer relapse, which could be used to identify patients with low-risk, localized tumours that
might benefit from chemotherapy.
Key words: paediatric oncology, PML, thrombospondin, neuroblastoma, MYCN
Dvorkina et al. A promyelocytic leukaemia protein-thrombospondin 2 axis and the risk of relapse in neuroblastoma
4
Introduction
The Promyelocytic Leukaemia protein (PML) is a growth/tumour suppressor inactivated in Acute
Promyelocytic Leukaemia (APL) via the t(15;17) translocation. PML is expressed as multiple
splice variants and is the essential component of a subnuclear structure called the PML nuclear
body (PML-NB), which is disrupted in APL (1). PML has emerged as pleiotropic growth
suppressor affecting multiple cellular pathways involved in tumourigenesis, in part via
recruitment of nuclear factors to the PML-NBs, also required for activation of p53 (2-8). One of
the main physiological roles of PML is its ability to regulate cell fate in stem/progenitor cells in
multiple tissues (9). In the nervous system, we have shown that PML regulates neurogenesis
and cortex development by modifying the Retinoblastoma (pRb) G1/S checkpoint (9, 10). Most
growth and tumour suppressive activities of PML have been linked to the splice variant PML-IV
(11), whereas little is known about the other more abundant variants, such as PML-I (12, 13).
PML expression is lost in tumours of multiple histological origins, and its inactivation has been
shown to promote tumour progression in APL, prostate and lung cancer (5, 14-16). In contrast, it
may play an oncogenic role in chronic myeloid leukaemia and breast cancer (17, 18). PML role
in tumours of the nervous system has not been investigated.
Neuroblastoma is the most common extra-cranial solid tumour in childhood and the most
frequently diagnosed malignancy in infancy. It accounts for 8% of cancer cases in children and
approximately 15% of all childhood cancer deaths, highlighting the aggressive nature of this
tumour (19, 20). The tumour develops from neural crest-derived sympathoadrenal precursor
cells (20). Neuroblastoma is characterized by a number of genetic aberrations; these include
ploidy changes, gains of chromosome arm 17q, amplification of the proto-oncogene MYCN,
activating mutations of ALK, and deletions of different genomic regions containing putative
tumour suppressor genes in chromosome bands 11q23, 1p36 and 14q23-qter(19, 21-24).
Neuroblastomas commonly arise from the medullary region of the adrenal gland (20, 25) and
are classified into five stages (1-4 and 4S), according to the International Neuroblastoma
Staging System (INSS) (26, 27). Low-risk patients (stages 1, 2 and 4S with a favourable
histology) have a survival rate greater than 85% whereas the survival rate for high-risk
neuroblastoma (stages 3,4 with unfavourable histology and MYCN amplification) is less than
50% in spite of multimodal therapy, reflecting the propensity of the tumour to relapse into a
treatment resistant, fatal form of the disease (20, 27, 28). Recurrent neuroblastoma in patients
initially classified as low-risk is uncommon, but can develop into an intractable cancer. It would
Dvorkina et al. A promyelocytic leukaemia protein-thrombospondin 2 axis and the risk of relapse in neuroblastoma
5
be very important to identify patients at risk of recurrence needing chemotherapy in addition to
surgical removal of the localized tumour mass.
In this study, we show that PML expression inversely correlates with tumour relapse in localized
neuroblastomas and is lost in aggressive forms of human and mouse neuroblastomas. The
PML-I isoform, when overexpressed in neuroblastoma cells, does not affect proliferation or
survival, but instead it suppresses angiogenesis in vitro and in vivo. Mechanistically, PML-I
inhibits angiogenesis by upregulating Thrombospondin-2, a known angiogenesis suppressor.
Finally, PML-I expression inversely correlates with tumour angiogenesis in primary tumour
samples. Overall, these data implicate PML in isoform-specific regulation of neuroblastoma
pathogenesis and suggest that it may serve as predictor of relapse in localized neuroblastoma.

Dvorkina et al. A promyelocytic leukaemia protein-thrombospondin 2 axis and the risk of relapse in neuroblastoma
6
Materials and Methods
Cell culture. IMR32, SH-EP, SK-N-SH, SK-N-AS, Kelly, NB69 and LAN-5 human
neuroblastoma lines were a kind gift from Dr Louis Chesler’s lab (Institute of Cancer Research,
London, UK). SHSY5Y human neuroblastoma cell line was purchased from ATCC. The cells
were cultured in DMEM- or RPMI-based media supplemented with 10% foetal calf serum, 2 mM
L-glutamine, 100 mg/mL penicillin and 100 mg/mL streptomycin. Cell lines were sent to Public
Health England or DDC Medical for authentication. The validation method used was Short
Tandem Repeat (STR) assay. For ex vivo mouse neural crest trunk progenitor cultures, the
neural tubes were dissected from e9.5 C57BL/6 mouse embryos, and the trunk section of the
tube was placed on laminin/fibronectin-covered coverslip and left to attach in a drop of
dissection medium (DMEM:F-12 medium 1:1 +5%FCS+100 mg/mL penicillin+100 mg/mL
streptomycin). The explants were cultured for 24-48 hours in neural tube culture medium
(DMEM/F12 1:1 supplemented with N2, B27 (both Invitrogen), bFGF 20ng/ml and EGF 20ng/ml.
The coverslips with the neural tube explants and migrated progenitors were fixed in 4% PFA
and used for immunostaining.
Cell proliferation assessment. Cells were plated in 12-well plates and cultured until fully
confluent. During the culturing period, images were acquired at regular intervals using IncuCyte
live-cell imaging system (Essen Biosciences) and processed using the IncuCyte software to
calculate the growth rates.
Patients and Clinical Follow-up. A retrospective series of primary tumours from
neuroblastoma (NB) patients (Table 1, Supplementary Tables 1 and 2) was collected at the
Istituto Giannina Gaslini, Genova, Italy (January 2000 to December 2008) and Great Ormond
Street Hospital (GOSH)/UCL Institute of Child Health (until 2013). All patients included in the
Gaslini cohort received surgical treatment, and the only inclusion criterion was the availability of
the complete clinical records. The study was approved by the respective Institutional Review
Boards and informed consent was obtained from patients or their legal guardians at both
institutions. Patients were classified according to the International Neuroblastoma Staging
System classification (29). Event-Free Survival (EFS) was calculated from diagnosis to last
follow-up or event (first occurrence of relapse, progression, or death).
Tumour Specimens. Formalin-fixed, paraffin-embedded tissue sections from NB tumours were
studied. Each tumour area tested contained malignant cells, as assessed by histological
examination. Quantification of immunofluorescence- or DAB-positive tumour cells was
performed on serial tumour tissue sections, thus allowing quantification in tumour areas
Dvorkina et al. A promyelocytic leukaemia protein-thrombospondin 2 axis and the risk of relapse in neuroblastoma
7
selected by the pathologist. Tumour cells were distinguished in the samples using NB-specific
marker NCAM (NB56). The adhesion molecule NCAM has been shown to be widely and brightly
expressed on NB tumours (30). All tumours were evaluated at the time of diagnosis prior to any
treatment other than surgery.
Immunostaining of cultured cells. For immunostaining of human or mouse cells in culture,
cells were grown on poly-D-lysine coated coverslips and fixed with 4% PFA. Tissue sections or
cells were permeabilised with 0.5% Triton-X100, subjected to antigen retrieval (tissue sections
only), blocked using 10% normal goat serum/2.5%BSA/0.1% PBS-Tween and incubated with a
primary antibody diluted in blocking solution overnight at 4°C, followed by incubation with a
secondary antibody (AlexaFluor, Invitrogen) in blocking solution for 1 hour at room temperature,
counterstained with Hoechst and mounted for microscopy.
Immunofluorescence analysis and quantifications of micro-vessel density in tissue samples. Mouse tissue samples were fixed in 4% PFA, dehydrated and embedded in paraffin
or preserved by snap-freezing in liquid N2. Tissue sections were cut and mounted on glass
slides. Paraffin-embedded sections were deparaffinised and rehydrated. Frozen sections were
fixed in 4% PFA or cold acetone (specific for CD31 staining). Standard histochemical protocol
was used for haematoxylin and eosin staining. Indirect immunofluorescence was performed on
formalin-fixed, paraffin embedded tissues from 30 primary NB tumours as previously described
(31). Paraffin sections (4 μm thick) were processed by standard deparaffinisation with xylene
and hydrated in a descending ethanol series to double-distilled water. Antigen retrieval on
formalin-fixed tissue section was performed using Sodium-Citrate buffer (pH 6.0). Slides were
incubated with primary antibodies overnight at 4°C. Secondary antibodies used were: goat anti-
mouse IgG Alexa-488, goat anti-rabbit IgG Alexa-568 (diluted 1:200; Invitrogen, Germany),
donkey anti-goat IgG-NL557 (diluted 1:200; R&D Systems, Inc, Europe). After washing, the
slides were counterstained with 4’,6’-diamidino-2- phenylindole (DAPI, Sigma-Aldrich, Milan,
Italy) and cover-slipped. The proportion of immunofluorescence positive tumour cells counted
was at least 100-1000 cells and reported in the percentage for the subsequent statistical
analysis. The micro-vessel count (MVC) was assessed by anti-CD31 staining and examination
of twenty microscopic fields (0.5 mm2) per tumour. The most intense vascular areas (hotspots)
were selected subjectively from each tumour section. The micro-vessels with a clearly defined
lumen or well-defined linear vessel shape were taken into account for MVC.

Dvorkina et al. A promyelocytic leukaemia protein-thrombospondin 2 axis and the risk of relapse in neuroblastoma
8
Digital images were collected using a Nikon E-1000 fluorescence microscope (Nikon
Instruments, Tokyo, Japan) equipped with appropriate filter sets and the Genikon imaging
system software (Nikon Instruments).
Western blotting. Cells were lysed in Laemmli buffer supplemented with β-mercaptoethanol.
The proteins were resolved on SDS-PAGE and transferred onto nitrocellulose or PVDF
membranes. Membranes were incubated overnight with the primary antibodies followed by
incubation with HRP-conjugated secondary antibodies (Amersham) and ECL substrate (Thermo
Scientific™).
Angiogenesis assay. The angiogenesis assay was performed using the in vitro angiogenesis
kit (Cellworks #ZHA4000). In brief, human umbilical vein endothelial cells (HUVEC) were
seeded in 24 multiwell plates and cultured for 14 days in the presence of conditioned media
from neuroblastoma cells that was changed every 2 days. The endothelial cells were fixed with
70% ethanol at room temperature for 30 minutes, incubated with anti-human anti-CD31
antibody (1:400) for 1h at 370 C, followed by incubation with goat anti-mouse conjugated to
alkaline phosphatase. To visualize the vascular structures, cells were stained using 5-bromo-4-
chloro-3-indolyl phosphate/nitro blue tetrazolium (BCIP/NBT) at room temperature until tubules
develop a dark purple colour, washed with distilled H2O and let to air dried. Images were
captured using JuLI™ - Smart Fluorescent Cell Analyser and analysed using AngioSys 1.0
Image Analysis Software (Cellworks #ZHA-1800).
Constructs, transfection, retroviral/lentiviral infections. Human PML-I isoform and PML-IV
isoform coding sequences were cloned into the pBabe puro and pBabe hygro retroviral vectors,
respectively (9). shPML pLKO and pLKO scrambled lentiviral plasmids were a kind gift from the
Everett’s lab (32). pGIPZ eGFP PML, TSP2 and pGIPZ eGFP scrambled plasmids were
purchased from Open Biosystems/Dharmacon and lentiviral supernatants were prepared
according to the manufacturer’s protocol (most efficient sequences were used for the study).
The sequence of the shRNA (GIPZ Clone V3LHS_402844) used for TSP2 downregulation
studies was TATATGTAAACGTCATTCT. After infection the cells were cultured in presence of
puromycin or hygromycin to select for infected cells. For pGIPZ eGFP lentiviral infection,
infected GFP+ cells with the highest level of plasmid expression were selected using FACS
sorting. Overexpression and downregulation of PML protein was confirmed by Western blot and
fluorescent immunostaining.
Antibodies. Rabbit anti-human pan PML (H238) (1:200 for Western blot and immunostaining,
Santa Cruz, #SC-5621), mouse anti-human pan PML (PG-M3) (1:200 for immunostaining,

Dvorkina et al. A promyelocytic leukaemia protein-thrombospondin 2 axis and the risk of relapse in neuroblastoma
9
Santa Cruz, #SC-966), anti-mouse pan PML (1:100 for Western blot and immunostaining,
Millipore, #05-718), rabbit anti-human PML-I (diluted 1/100; produced by Hugues De The), anti-
NCAM (1:400, Chemicon, #AB5032), anti-HIF1α (1:1000, BD Biosciences, #6109059), anti-
Sox10 (1:3000, produced in Michael Wegner’s lab, a kind gift from Huiliang Li, UCL), anti-
tyrosine hydroxylase (TH, 1:200, Millipore, #AB152), anti-p75 (1:250, Promega, #G3231), anti-
actin (1:5000, Sigma, #A2172), anti-CD31 (1:50, BD Pharmingen, #550274; for mouse tissue),
anti-CD31, mouse monoclonal (diluted 1/100; Dako Cytomation, Hamburg, Germany; for human
tissue).
RNA extraction and quantitative real-time (qRT) PCR. Total RNA was extracted using
RNAeasy Plus Mini Kit (Qiagen) and cDNA was synthesized using High Capacity RNA-to-cDNA
Kit (Applied Biosystems) according to the manufacturer’s instructions. qRT PCR was performed
in Applied Biosystems 7500 Real-Time PCR System thermo cycler using Maxima™ SYBR
Green qPCR Master Mix (Fermentas). PML mRNA was normalised by measuring β-actin mRNA
levels. The following primers were used:
PML total sense 5’-GGTGCAGAGGATGAAGTGCT
PML total antisense 5’-AGGAAACCGTGCATGTCC
PML-I sense 5’-CTCAGGGTCCTGGACGAGAACC
PML-I anti-sense 5’-CACGGCCTTGGAGTAGATGC
β-actin sense 5’-CCAACCGCGAGAAGATGA
β-actin 5’-TCCATCACGATGCCAGTG
TSP2 sense 5’-CTTTAGCTGCTGCTTGTGCC
TSP2 antisense 5’-GCGTTAGATGCGCCTTTTCC.
In vivo experiments. Immunodeficient NOD/SCID female mice (purchased from Harlan;
10/group) were subcutaneously injected into both flanks with 1x10⁶ neuroblastoma cells.
Tumour size was monitored with a calliper and calculated according to the formula: V=(length x
width2)/2. Transgenic human-MycN TH mice (strain 129/SvJ) were kindly provided by Dr. Louis
Chesler (Institute of Cancer Research, London, UK). Wild type C57BL/6 mice were obtained
from the Jackson laboratories (via Charles River Laboratories). All experimental procedures
involving wild type and transgenic mice were approved by the University College London and
were conducted under the Animal Scientific Procedures Act, 1986 (United Kingdom).
Dvorkina et al. A promyelocytic leukaemia protein-thrombospondin 2 axis and the risk of relapse in neuroblastoma
10
Microarray. Total RNA was extracted from IMR32 pBpuro and PML-I-OE using Qiagen RNeasy
Mini Kit 74104 (n=2). cDNAs labelled were prepared with SuperScript III RT kit (Invitrogen)
using 5 µl of total RNA. Microarray slides were pre-hybridized in 3X SSC, 0.1% (w/v) SDS and
10 mg/ml bovine serum albumin (BSA) at 600 C for 20 min. Following pre-hybridization, slides
were washed with distilled water for 1 minute and isopropanol for 1 minute, dried with an
airbrush and pre-scanned to check for any array defects.
The capture sequence-tagged cDNAs were hybridized onto the microarray slide for 16 h at 550
C in a SlideBooster SB400 (Advalytix) with the power setting at 27 and a pulse:pause ratio of
3:7. The slides were washed in 2xSSC, 0.2% (w/v) SDS for 10 min at 550 C and then for 10 min
at room temperature. The slides were dried and hybridized with the Cy3 and Cy5 dendrimers
(3DNA 900, Genisphere) following manufacturer’s instructions. Dried slides were scanned using
a Inno Scan 700 (Innopsys) using autocalibration to obtain optimized non-saturating images for
each fluorophore and analysed using BlueFuse for Microarrays (BlueGnome).
The data underwent Cross Channel Correction, followed by Lowess Normalisation. After
normalising the data, the mean fold ratio value was derived and a cyber-T test was performed to
generate a p-value. The software BASE was used to carry out the normalization. The data has
been deposited in NCBI's Gene Expression Omnibus (33) and is accessible through GEO
Series accession number GSE78086
(https://www.ncbi.nlm.nih.gov/geo/query/acc.cgi?acc=GSE78086).
Pathway Analysis. Oligos with a p-value below 0.05 (Cyber t-test) and a fold ratio ≥1.5 for up-
regulation or ≤0.67 for down-regulation were selected. This resulted in 1567 up-regulated and
1195 down-regulated oligos, of which 1219 and 876, respectively, could be uniquely mapped to
Entrez gene IDs (Supplementary Table 1). We then tested both sets of genes for enrichment of
known pathways from various databases provided by ConsensusPathDB (34). Pathways with q-
value≤0.1 for ConsensusPathDB were considered significantly enriched (Supplementary Table
2).
Statistical analysis. Correlations were evaluated by the Spearman’s rank correlation coefficient
(rS); rS values from 0.40 to 0.59 were considered moderate, from 0.60 to 0.79 were considered
strong, and from 0.80 to 1 were considered very strong; values below 0.4 were considered
weak. To compare quantitative variables between two groups of observations, the non-
parametric Mann-Whitney U test was used. Statistical significance of differences between
experimental and control groups was determined by ANOVA with Tukey’s multiple comparison

Dvorkina et al. A promyelocytic leukaemia protein-thrombospondin 2 axis and the risk of relapse in neuroblastoma
11
test using GraphPad Prism 3.0 software (GraphPad Software, Inc.). Survival curves were
constructed by using the Kaplan-Meier method.

Dvorkina et al. A promyelocytic leukaemia protein-thrombospondin 2 axis and the risk of relapse in neuroblastoma
12
Results
We have previously shown that PML is expressed in neural progenitor/stem cells of the
developing neocortex (9). In order to evaluate its expression during development of the
peripheral nervous system, we performed immunohistochemical analysis of neural crest
progenitors of the sympathetic nervous system and, postnatally, in the adrenal gland medulla.
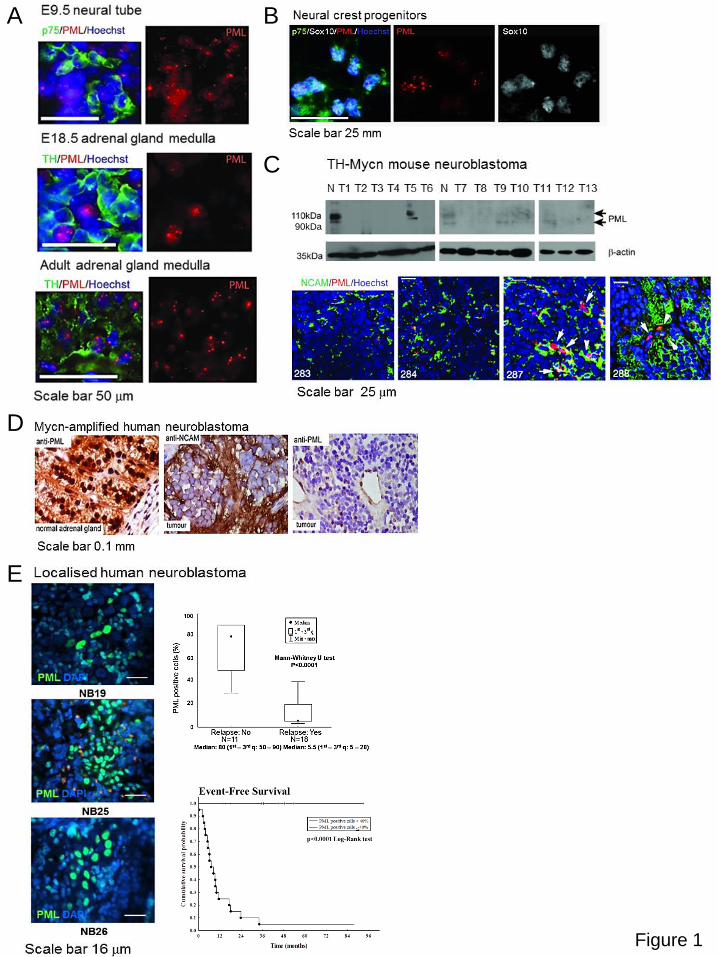
PML was found expressed in a subset of embryonic p75-positive progenitors delaminating from
the neural tube and in TH-positive cells in the developing and adult adrenal medulla (Figure 1A).
Similarly, in vitro cultures of neural tube-derived progenitors showed PML accumulating in a
subset of p75- and Sox10-positive cells (Figure 1B).
As neuroblastoma is believed to originate from progenitor cells of the developing sympathetic
nervous system (20), we evaluated PML expression in neuroblastomas arising in tyrosine-
hydroxylase (TH)-MYCN-transgenic mice, and found that it was downregulated in most tumours
analysed (Figure 1C). We next assessed the expression of PML in primary neuroblastoma
patients at presentation by immunohistochemical or immunofluorescence analysis in two
independent cohorts. We showed that PML expression is high in the adult human adrenal
medulla, but it is generally low in neuroblastomas (Figure 1D; Supplementary Table 1, two
separate cohorts). Notably, the cumulative survival probability of patients whose localised
tumours contained more than 40% of PML positive cells was excellent, with 100% event free
survival probability after 7 years from diagnosis (Figure 1E; Supplementary Table 1). In stark
contrast, survival probability of patients whose tumours contained less than 40% PML positive
cells was only 10% after 2 years (Figure 1E). There was a striking correlation between low
expression (<40% positive cells) of PML and tumour recurrence in localised, low-risk, patients,
suggesting that PML expression may represent an accurate biomarker of relapse
(Supplementary Table 1). Using double-staining immunohistochemical analysis we also
assessed a third and larger cohort (Supplementary Table 2) that included relapsed cases only
for stage 3-4 tumours. It is important to note that in this cohort MYCN-amplified tumours
displayed significantly higher PML expression than MYCN-non-amplified samples
(Supplementary Table 2 and Supplementary Figure 1A). PML expression in MYCN-non-
amplified tumours (all stages) and MYCN-non-amplified stage 4 tumours was significantly
associated with a reduced risk of tumour relapse (Supplementary Table 2 and Supplementary
Figure 1B, C).

Dvorkina et al. A promyelocytic leukaemia protein-thrombospondin 2 axis and the risk of relapse in neuroblastoma
13
We next investigated PML expression in a panel of neuroblastoma cell lines. As mentioned
above, there are several splice variants that produce seven or more protein isoforms, which
retain a common tripartite motif but vary in their C-termini (12, 35). Analysis of total PML
expression by Western Blotting and immunofluorescence analyses using a pan-PML antibody
showed that a number of cell lines display low PML expression, with the most prominent PML
isoform migrating at around 90-100 kilodalton (kDa), which corresponds to the PML-I (and PML-
II) isoforms (Figure 2A, B). The mRNA levels of PML-I generally correlate with the high-
molecular weight PML isoform (Figure 2C). Interestingly, PML-I expression seemed to be
associated especially with Schwannian or intermixed types (Figure 2A-C). These findings
suggest that there is, at least in part, a selective expression of PML isoforms in neuroblastoma
cell lines. We then assessed the effect of reconstituting PML expression in PMLlow
neuroblastoma cells. To this end, PMLlow IMR32 cells were infected with retroviral vectors
expressing PML-I or the tumour-suppressive PML-IV isoform (Figure 2D) and analysed for their
growth properties. PML-IV-, but not PML-I-expressing cells showed a marginal but significant
inhibition of proliferation compared to vector-infected control cells (Figure 2E). The PML-
reconstituted cell lines were injected into the flanks of immunodeficient mice and tumour
masses were measured at regular intervals for about 4 weeks. Experiments were terminated
when the tumour size reached the upper limit allowed by UK and local animal welfare
regulations. While neuroblastoma cells infected with the control or PML vectors formed tumours
of comparable size, necroscopic and pathological analyses revealed that PML-I tumours were
paler compared to control or PML-IV tumours (Figure 3A, B). Indeed, immunofluorescence
analysis of the CD31 endothelial marker, revealed that there was a significant reduction in
vascular clusters in PML-I compared to control tumours (Figure 3C). Furthermore, decreased
angiogenesis in PML-I tumours correlated with enrichment in S100-positive Schwann-like cells,
typically associated with low-risk forms of neuroblastoma (26, 27), and reduced number of cells
expressing the neuroblast marker CD56 (Figure 3D). This effect did not appear related to a cell-
autonomous effect of PML-I on S100, as expression of this marker was not increased in PML-I-
overexpressing cells in vitro (not shown).
These results prompted us to investigate whether PML-I-expressing cells secrete antiangiogenic
factor(s) that could explain the observed phenotype. We used supernatants from PML-I or
empty vector-infected IMR32 cells in endothelial cell tubule formation assays with human
umbilical vascular endothelial chord (HUVEC) cells. We observed inhibition of tubule number,
length and branching when HUVEC cells were exposed to the PML-I, but not control,
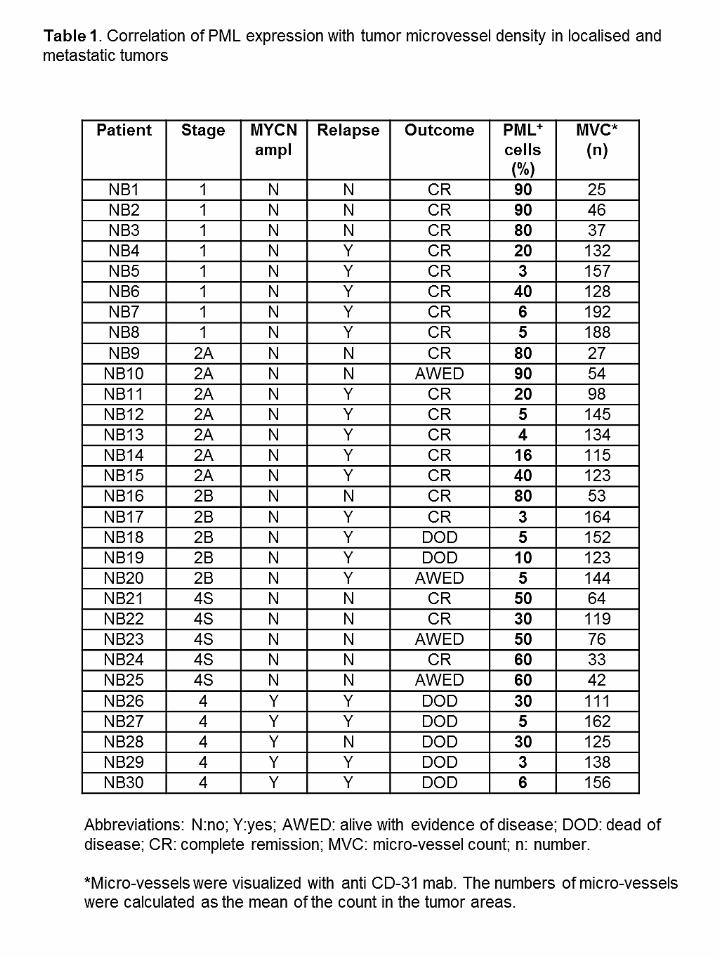
supernatants (Figure 3E). These in vitro results were corroborated by immunofluorescence
Dvorkina et al. A promyelocytic leukaemia protein-thrombospondin 2 axis and the risk of relapse in neuroblastoma
14
analysis in neuroblastoma patients that confirmed that there was a statistically significant
inverse correlation between CD31 positive microvessel clusters and PML expression (Figure
3F, G and Table 1). Thus, PML regulates angiogenesis in vitro and in vivo.
We next studied the potential mechanisms involved. Based on previous studies (36), the PML-
IV isoform controls angiogenesis via an mTOR/HIF1α/vascular endothelial growth factor (VEGF)
axis in fibroblasts and prostate cancer. However, we failed to detect differences in HIF1α levels
in either normoxic or hypoxic conditions (Supplementary Figure 2A), thus implicating different
mechanisms underlying PML-I-mediated regulation of angiogenesis in neuroblastoma.
Therefore, we set out to study the potential effect of PML-I on gene expression. We analysed
gene expression in PML-I and pBabe control IMR32 cells using custom-made arrays. As
expected, PML-I appears to modulate a number of genes involved in cell cycle control (see
Pathway Analysis in Supplementary Table 3), but also some regulating angiogenesis (not
VEGF). Among them, thrombospondin-2 [TSP2 (THBS2)], a known inhibitor of angiogenesis
(37-39), displayed over 4-fold increased expression in PML-I-transduced cells (Supplementary
Table 4). These findings were validated via quantitative PCR (QPCR) and Western Blotting
(Figure 4A, B). A western blot confirming substantial overexpression of PML-I in neuroblastoma
cells after retroviral infections is shown in Supplementary figure 2B. In order to define the
involvement of TSP2 in PML-I-mediated suppression of angiogenesis, we transduced control or
PML-I-expressing IMR32 cells with lentiviral vectors expressing TSP2-specific or control
shRNAs (Figure 4C). Critically, while TSP2 knockdown in control cells did not affect
angiogenesis, it rescued the suppressive phenotype caused by PML-I (Figure 4D). A western
blot confirmed that the TSP2 shRNA did not change the levels of overexpressed PML-I in
neuroblastoma cells (Supplementary Figure 2C). Finally, by using PML-I- and TSP-2-specific
antibodies tissue sections from neuroblastoma patients were scored as the percentage of
stained nuclear and cytoplasm respectively neuroblastoma cells (Figure 4E). We revealed a
correlation between expression of PML-I and TSP-2 (Spearman’s correlation rank r=0.89),
suggesting that the functional relationship is conserved in primary neuroblastoma (Table 2).
Overall, our findings indicate that the tumour suppressor PML suppresses angiogenesis at
multiple levels via the specialised functions of two of its splice forms, PML-I and PML-IV.
Discussion Localised tumours without amplification of MYCN is a group of particular interest due to a
difficult risk estimation resulting in quite different therapeutic options (intermediate-risk
Dvorkina et al. A promyelocytic leukaemia protein-thrombospondin 2 axis and the risk of relapse in neuroblastoma
15
chemotherapy versus wait-and-see strategy without chemotherapy) (40, 41). In this study, we
have established that loss of PML expression identifies patients with localised disease at risk of
tumour relapse that will potentially benefit from chemotherapeutic treatment, suggesting that
PML could be used as a marker to guide therapeutic intervention. Interestingly, PML did not
appear to act as a growth suppressor in neuroblastoma, as transduction of the growth
suppressive PML-IV isoform in PMLlow neuroblastoma cells only marginally inhibited cell growth,
whereas PML-I had no effect on either cell or tumour growth. In contrast, transduction of PML-I
led to inhibition of angiogenesis both in vitro and in vivo. We cannot exclude that prolonged
observation of tumour growth could have revealed differences in tumour size as well, but we
could not extend the analysis due to animal welfare regulations. These data indicate an isoform-
specific PML role in regulation of angiogenesis in neuroblastoma. Notably, PML expression
inversely correlated with tumour angiogenesis index in patient samples. More generally, these
findings suggest a novel role for tumour angiogenesis in relapse of localized tumours.
It is interesting to note that PML-IV was reported to inhibit angiogenesis via an mTOR/HIF1α-
dependent mechanism (36), but we failed to detect an angiogenesis role of PML-IV in
neuroblastoma nor changes in HIF1α protein levels. Instead, PML-I appears to work as a
HIF1α− angiogenesis suppressor via transcriptional regulation of
thrombospondin-2 (TSP2), a known inhibitor of angiogenesis and tumourigenesis (37, 38, 42).
Although it remains to be determined how PML-I could regulate TSP2, our findings suggest that
a novel PML-I/TSP2 signalling module suppresses tumour angiogenesis in neuroblastoma.
Considering the effect of PML-I expression on the retinoblastoma pathway (see Pathway
Analysis and (9)), one could speculate that pRb/E2Fs regulates TSP2 gene expression. In this
respect, as oncogenic RAS is known to inhibit the expression of TSP2 in tumour cells (43), it
could be hypothesized that TSP2 induction could be part of a PML/pRb tumour suppressive
checkpoint triggered by RAS activation in normal cells (44).
Another finding of our study is the association between reduced angiogenesis and increased
expression of Schwann-like markers in PML-I-overexpressing tumours. The presence of
Schwann-like differentiation in neuroblastoma is a good prognostic marker and has been found
associated with reduced angiogenesis (45), although it is still debated whether cells carrying
Schwann markers with neuroblastoma tumours are of tumour origin (46, 47). A previous report
suggested that PML expression correlates with the Schwann-like phenotype in cell lines and
that reintroduction of PML in PMLlow Neuronal (N-type) cells induced neurite extension (48).
However, we failed to observe a differentiation-promoting effect of PML in N-type IMR32 cells

Dvorkina et al. A promyelocytic leukaemia protein-thrombospondin 2 axis and the risk of relapse in neuroblastoma
16
nor increased expression of the Schwannian marker S100 in vitro. Thus, our study suggests
that PML may regulate Schwannian differentiation within neuroblastoma tumours via
angiogenesis inhibition or that TSP2 itself may have direct pro-differentiation properties in vivo.
In keeping with this, TSP2 has been shown to induce synaptogenesis in the central nervous
system (49) and chondrogenic differentiation in the bone (50).
In conclusion, our study reveals a novel PML-I/TSP2 axis regulating neuroblastoma
angiogenesis and differentiation, which could serve as biomarker to predict relapse in localized
neuroblastoma. More generally, PML is emerging as key player in angiogenesis regulation via
the ability of two of its splice forms, PML-I (the present study) and PML-IV (36) to control
different steps of the angiogenesis process.
Dvorkina et al. A promyelocytic leukaemia protein-thrombospondin 2 axis and the risk of relapse in neuroblastoma
17
Acknowledgments
This study was supported by a project grant from the Wellcome Trust to PS and AS. We thank
the Pathology teams both at ICH (Dyanne Rampling) and Gaslini and the UCL Scientific
Services, the Cancer Genome Engineering facility, the UCL Biological Services Unit and the
Microarray Facility at Brunel University. PS leads the Samantha Dickson Brain Cancer Unit.
Funding
This work was in part funded by a Wellcome Trust project grant (to PS and AS). PS is funded by
the Brain Tumor Charity among other funding bodies. AP and VP were supported by funds
‘Cinque per mille’ and ‘Ricerca corrente’ from the Italian Health Ministry to the Istituto Gaslini.
References
1. Sahin U, Lallemand-Breitenbach V, de The H. PML nuclear bodies: regulation, function and therapeutic perspectives. J Pathol. 2014;234(3):289-91. 2. Dellaire G, Bazett-Jones DP. PML nuclear bodies: dynamic sensors of DNA damage and cellular stress. Bioessays. 2004;26(9):963-77. Epub 2004/09/08. 3. Salomoni P, Pandolfi PP. The role of PML in tumor suppression. Cell. 2002;108(2):165-70. 4. Bernardi R, Pandolfi PP. Structure, dynamics and functions of promyelocytic leukaemia nuclear bodies. Nature reviews Molecular cell biology. 2007;8(12):1006-16. Epub 2007/10/12. 5. Salomoni P, Ferguson BJ, Wyllie AH, Rich T. New insights into the role of PML in tumour suppression. Cell Res. 2008;18(6):622-40. 6. Salomoni P. Stemming out of a new PML era? Cell Death Differ. 2009;16(8):1083-92. Epub 2009/06/13. 7. Koken MH, Linares-Cruz G, Quignon F, Viron A, Chelbi-Alix MK, Sobczak-Thepot J, et al. The PML growth-suppressor has an altered expression in human oncogenesis. Oncogene. 1995;10(7):1315-24. 8. Ablain J, de The H. Retinoic acid signaling in cancer: The parable of acute promyelocytic leukemia. Int J Cancer. 2014;135(10):2262-72. 9. Regad T, Bellodi C, Nicotera P, Salomoni P. The tumor suppressor Pml regulates cell fate in the developing neocortex. Nat Neurosci. 2009;12(2):132-40. Epub 2009/01/13. 10. Schreck KC, Gaiano N. PML: a tumor suppressor essential for neocortical development. Nat Neurosci. 2009;12(2):108-10. 11. Bischof O, Kirsh O, Pearson M, Itahana K, Pelicci PG, Dejean A. Deconstructing PML-induced premature senescence. Embo J. 2002;21(13):3358-69. 12. Condemine W, Takahashi Y, Zhu J, Puvion-Dutilleul F, Guegan S, Janin A, et al. Characterization of endogenous human promyelocytic leukemia isoforms. Cancer Res. 2006;66(12):6192-8. 13. Condemine W, Takahashi Y, Le Bras M, de The H. A nucleolar targeting signal in PML-I addresses PML to nucleolar caps in stressed or senescent cells. J Cell Sci. 2007;120(Pt 18):3219-27. 14. Rego EM, Wang ZG, Peruzzi D, He LZ, Cordon-Cardo C, Pandolfi PP. Role of promyelocytic leukemia (PML) protein in tumor suppression. J Exp Med. 2001;193(4):521-29. 15. Scaglioni PP, Yung TM, Cai LF, Erdjument-Bromage H, Kaufman AJ, Singh B, et al. A CK2-dependent mechanism for degradation of the PML tumor suppressor. Cell. 2006;126(2):269-83.
Dvorkina et al. A promyelocytic leukaemia protein-thrombospondin 2 axis and the risk of relapse in neuroblastoma
18
16. Trotman LC, Alimonti A, Scaglioni PP, Koutcher JA, Cordon-Cardo C, Pandolfi PP. Identification of a tumour suppressor network opposing nuclear Akt function. Nature. 2006;441(7092):523-7. 17. Ito K, Bernardi R, Morotti A, Matsuoka S, Saglio G, Ikeda Y, et al. PML targeting eradicates quiescent leukaemia-initiating cells. Nature. 2008. 18. Carracedo A, Weiss D, Leliaert AK, Bhasin M, de Boer VC, Laurent G, et al. A metabolic prosurvival role for PML in breast cancer. The Journal of clinical investigation. 2012;122(9):3088-100. Epub 2012/08/14. 19. Borriello A, Roberto R, Della Ragione F, Iolascon A. Proliferate and survive: cell division cycle and apoptosis in human neuroblastoma. Haematologica. 2002;87(2):196-214. 20. Brodeur GM. Neuroblastoma: biological insights into a clinical enigma. Nat Rev Cancer. 2003;3(3):203-16. 21. Altura RA, Maris JM, Li H, Boyett JM, Brodeur GM, Look AT. Novel regions of chromosomal loss in familial neuroblastoma by comparative genomic hybridization. Genes, chromosomes & cancer. 1997;19(3):176-84. 22. Maris JM, Matthay KK. Molecular biology of neuroblastoma. J Clin Oncol. 1999;17(7):2264-79. 23. George RE, Sanda T, Hanna M, Frohling S, Luther W, 2nd, Zhang J, et al. Activating mutations in ALK provide a therapeutic target in neuroblastoma. Nature. 2008;455(7215):975-8. 24. Mosse YP, Laudenslager M, Longo L, Cole KA, Wood A, Attiyeh EF, et al. Identification of ALK as a major familial neuroblastoma predisposition gene. Nature. 2008;455(7215):930-5. 25. Jiang M, Stanke J, Lahti JM. The connections between neural crest development and neuroblastoma. Current topics in developmental biology. 2011;94:77-127. 26. Shimada H, Ambros IM, Dehner LP, Hata J, Joshi VV, Roald B, et al. The International Neuroblastoma Pathology Classification (the Shimada system). Cancer. 1999;86(2):364-72. 27. Shimada H, Umehara S, Monobe Y, Hachitanda Y, Nakagawa A, Goto S, et al. International neuroblastoma pathology classification for prognostic evaluation of patients with peripheral neuroblastic tumors: a report from the Children's Cancer Group. Cancer. 2001;92(9):2451-61. 28. Matthay KK, Villablanca JG, Seeger RC, Stram DO, Harris RE, Ramsay NK, et al. Treatment of high-risk neuroblastoma with intensive chemotherapy, radiotherapy, autologous bone marrow transplantation, and 13-cis-retinoic acid. Children's Cancer Group. N Engl J Med. 1999;341(16):1165-73. 29. Brodeur GM, Pritchard J, Berthold F, Carlsen NL, Castel V, Castelberry RP, et al. Revisions of the international criteria for neuroblastoma diagnosis, staging, and response to treatment. J Clin Oncol. 1993;11(8):1466-77. 30. Ferreira-Facio CS, Milito C, Botafogo V, Fontana M, Thiago LS, Oliveira E, et al. Contribution of multiparameter flow cytometry immunophenotyping to the diagnostic screening and classification of pediatric cancer. PLoS One. 2013;8(3):e55534. 31. Pezzolo A, Parodi F, Marimpietri D, Raffaghello L, Cocco C, Pistorio A, et al. Oct-4+/Tenascin C+ neuroblastoma cells serve as progenitors of tumor-derived endothelial cells. Cell Res. 2011;21(10):1470-86. 32. Everett RD, Chelbi-Alix MK. PML and PML nuclear bodies: implications in antiviral defence. Biochimie. 2007;89(6-7):819-30. Epub 2007/03/09. 33. Edgar R, Domrachev M, Lash AE. Gene Expression Omnibus: NCBI gene expression and hybridization array data repository. Nucleic acids research. 2002;30(1):207-10. Epub 2001/12/26. 34. Kamburov A, Pentchev K, Galicka H, Wierling C, Lehrach H, Herwig R. ConsensusPathDB: toward a more complete picture of cell biology. Nucleic Acids Res. 2011;39(Database issue):D712-7. 35. Borden KL, Culjkovic B. Perspectives in PML: a unifying framework for PML function. Front Biosci (Landmark Ed). 2009;14:497-509. 36. Bernardi R, Guernah I, Jin D, Grisendi S, Alimonti A, Teruya-Feldstein J, et al. PML inhibits HIF-1alpha translation and neoangiogenesis through repression of mTOR. Nature. 2006;442(7104):779-85. 37. Tokunaga T, Nakamura M, Oshika Y, Abe Y, Ozeki Y, Fukushima Y, et al. Thrombospondin 2 expression is correlated with inhibition of angiogenesis and metastasis of colon cancer. Br J Cancer. 1999;79(2):354-9. 38. Volpert OV, Tolsma SS, Pellerin S, Feige JJ, Chen H, Mosher DF, et al. Inhibition of angiogenesis by thrombospondin-2. Biochem Biophys Res Commun. 1995;217(1):326-32. 39. Lawler PR, Lawler J. Molecular basis for the regulation of angiogenesis by thrombospondin-1 and -2. Cold Spring Harbor perspectives in medicine. 2012;2(5):a006627. 40. Oberthuer A, Hero B, Berthold F, Juraeva D, Faldum A, Kahlert Y, et al. Prognostic impact of gene expression-based classification for neuroblastoma. J Clin Oncol. 2010;28(21):3506-15. 41. Simon T, Spitz R, Hero B, Berthold F, Faldum A. Risk estimation in localized unresectable single copy MYCN neuroblastoma by the status of chromosomes 1p and 11q. Cancer Lett. 2006;237(2):215-22.
Dvorkina et al. A promyelocytic leukaemia protein-thrombospondin 2 axis and the risk of relapse in neuroblastoma
19
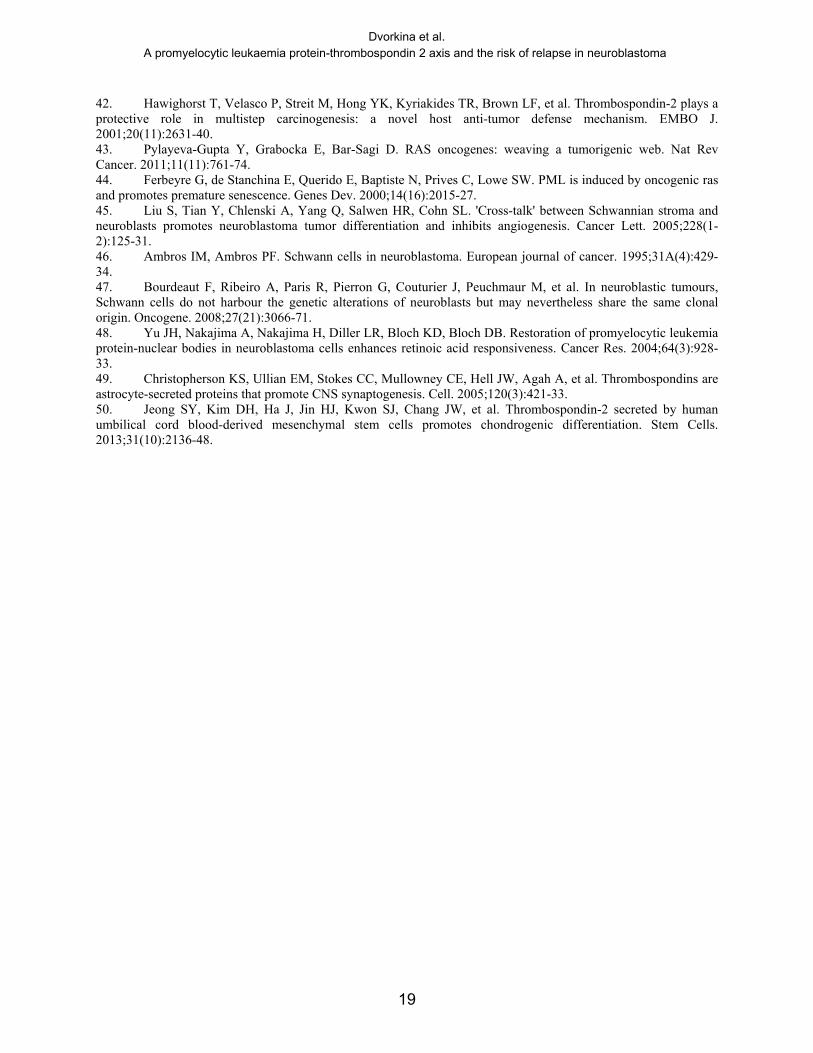
42. Hawighorst T, Velasco P, Streit M, Hong YK, Kyriakides TR, Brown LF, et al. Thrombospondin-2 plays a protective role in multistep carcinogenesis: a novel host anti-tumor defense mechanism. EMBO J. 2001;20(11):2631-40. 43. Pylayeva-Gupta Y, Grabocka E, Bar-Sagi D. RAS oncogenes: weaving a tumorigenic web. Nat Rev Cancer. 2011;11(11):761-74. 44. Ferbeyre G, de Stanchina E, Querido E, Baptiste N, Prives C, Lowe SW. PML is induced by oncogenic ras and promotes premature senescence. Genes Dev. 2000;14(16):2015-27. 45. Liu S, Tian Y, Chlenski A, Yang Q, Salwen HR, Cohn SL. 'Cross-talk' between Schwannian stroma and neuroblasts promotes neuroblastoma tumor differentiation and inhibits angiogenesis. Cancer Lett. 2005;228(1-2):125-31. 46. Ambros IM, Ambros PF. Schwann cells in neuroblastoma. European journal of cancer. 1995;31A(4):429-34. 47. Bourdeaut F, Ribeiro A, Paris R, Pierron G, Couturier J, Peuchmaur M, et al. In neuroblastic tumours, Schwann cells do not harbour the genetic alterations of neuroblasts but may nevertheless share the same clonal origin. Oncogene. 2008;27(21):3066-71. 48. Yu JH, Nakajima A, Nakajima H, Diller LR, Bloch KD, Bloch DB. Restoration of promyelocytic leukemia protein-nuclear bodies in neuroblastoma cells enhances retinoic acid responsiveness. Cancer Res. 2004;64(3):928-33. 49. Christopherson KS, Ullian EM, Stokes CC, Mullowney CE, Hell JW, Agah A, et al. Thrombospondins are astrocyte-secreted proteins that promote CNS synaptogenesis. Cell. 2005;120(3):421-33. 50. Jeong SY, Kim DH, Ha J, Jin HJ, Kwon SJ, Chang JW, et al. Thrombospondin-2 secreted by human umbilical cord blood-derived mesenchymal stem cells promotes chondrogenic differentiation. Stem Cells. 2013;31(10):2136-48.
Dvorkina et al. A promyelocytic leukaemia protein-thrombospondin 2 axis and the risk of relapse in neuroblastoma
20
Figure legends
Figure 1: PML expression is low in neuroblastoma compared with normal tissues and is a marker of high-risk tumours. (A) Immunofluorescence analysis of PML expression in
sympathetic neurons during mouse development. PML is detectable in early neural crest p75+
progenitors in the neural tube, and in TH+ medullar cells in the developing and adult adrenal
gland (scale bar 50m); (B) Expression of p75, Sox10 and PML in neural crest progenitors in
vitro. (C) PML expression is low in neuroblastomas arising in TH-MycN transgenic mice. Upper
panel: Western blot analysis showing PML expression (indicated by the arrows) in tumours (T1-
13) compared to normal adrenal gland (N). Equal loading was verified by blotting with an actin
antibody (bottom gel). Lower panel; representative images of immunofluorescence analysis
showing co-expression of PML and the neuroblast marker NCAM (numbers indicate tumours
ID). (D) Immunohistochemical analysis demonstrating co-expression of PML in primary human
neuroblastomas compared to normal adrenal gland. An anti N-CAM antibody was used to mark
neuroblastic tumour cells (E) Low PML expression in localized human neuroblastomas is
associated with increased probability of relapse (p<0.0001, Mann-Whitney test) and reduced
cumulative survival probability (p<0.0001, log-rank test); immunofluorescence analysis of
tumours from three patients is shown on the left.
Figure 2: Expression of PML isoforms in neuroblastoma cell lines and effect on cell growth. (A) Western blot analysis showing expression of total PML in neuroblastoma cell lines.
Actin was used as loading control. Quantification of the western blot analysis is shown in the
bottom. (B) Immunofluorescence analysis of total PML expression in neuroblastoma cell lines.
(C) Reverse transcription Q-PCR analysis was used to assess the relative expression of total
PML and the PML-I isoform in neuroblastoma cell lines. Primary glioblastoma neural stem cells
(G4) and foetal neural stem cells (NSC) were used as negative and positive controls,
respectively. The bars indicate the mean values from triplicate wells and the error bars standard
errors. (D) Western blot analysis showing exogenous overexpression of the PML-I and IV
isoforms in IMR32 cells. (E) Proliferation curves showing the growth rates of IMR32 cells
transduced with an empty retroviral vector or viruses containing the PML-I and PML-IV isoforms,
as indicated. Points in the curve are the mean values from triplicate wells and the error bars
indicate standard errors.
Dvorkina et al. A promyelocytic leukaemia protein-thrombospondin 2 axis and the risk of relapse in neuroblastoma
21
Figure 3. PML-I inhibits angiogenesis in human neuroblastomas. (A, B) IMR32 cells
expressing (PML-I-OE and PML-IV-OE) or non expressing (pBpuro and pBhygo) PML isoforms
were injected into the flanks of immunodeficient mice. At the end of the experiment, tumours
were excised and photographed (A panel). Tumour volumes were also measured every other
day starting from one week after injections of neuroblastoma cells (B panel). Values represents
means +/- SD, n=10 for PML-I/PML-IV and vector controls; stars refer to individual time points at
which p-values were calculated, albeit not significant (t-test). C) CD31+ vascular clusters
(indicated by the arrows) were detected in the xenotransplanted tumour using
immunofluorescence analysis (left panels). Quantification of the experiment is shown in the right
panel (*** = P<0.001). (D) Immunohistochemical analysis of representative sections of control
(pBpuro) or PML-I overexpressing (PML-I-OE) tumour xenografts. The antibodies used are
indicated (H&E=haematoxylin and eosin). (E) Angiogenesis assay. The upper panel shows
images of the vascular structures in the presence of pro- (VEGF), anti- (Suramin) angiogenic
factors or supernatants from cells expressing (PML-I OE) or non expressing (pBpuro) PML-I.
Quantification of the experiment is shown in the bottom panel. Bars indicate the means of
triplicate values and error bars the standard errors. (F) Microvessel clusters (red) in primary
human neuroblastomas were detected by immunofluorescence analysis using a CD31 antibody;
nuclei were counter stained with DAPI (blue). Scale bar = 32 μm. Representative image
showing a tumour with high MCV/low PML (left) and a tumour with low MCV/high PML (right).
(G) Graph showing a reverse correlation between the number of CD31+ micro-vessel clusters
and PML positive cells in the whole tumour area (Spearman’s correlation rank r=-0.89).
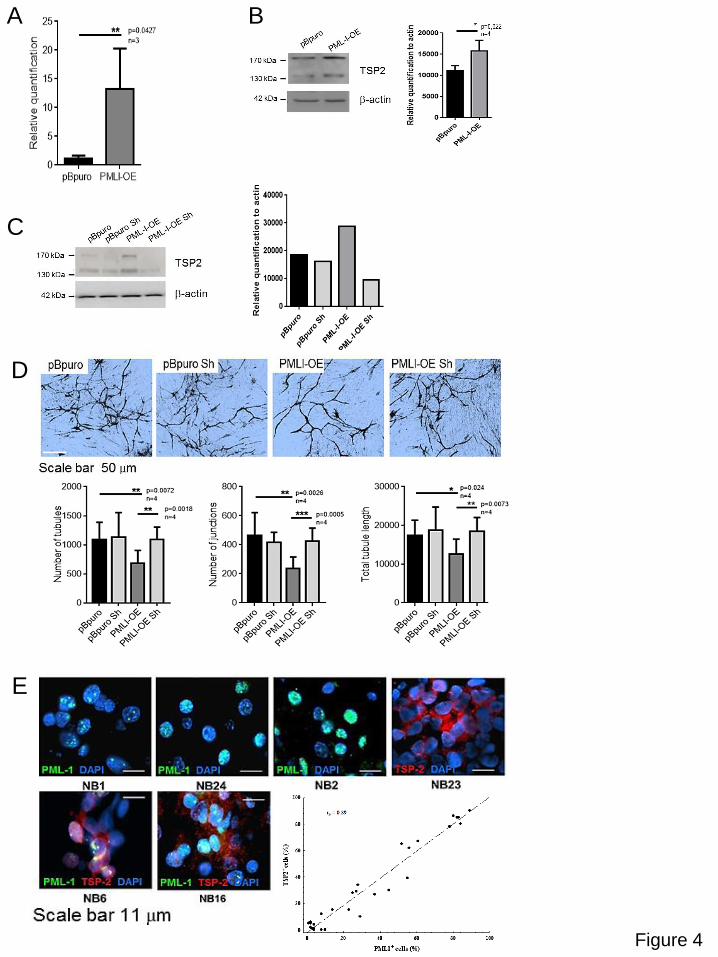
Figure 4. PML-I induces expression of Thrombospondin 2 (TSP2), which is required for the antiangiogenic activity. (A) Reverse transcription Q-PCR analysis confirming
overexpression of TSP2 in PML-I expressing cells (PML-I-OE) relative to control (pBpuro); the
bars indicate the mean values of three independent experiments and error bars standard errors.
(B) Western blot analysis showing increased expression of TSP2 protein in PML-I-expressing
cells. Quantification of the western blot is shown in the right panel. (C) Western blot assay
showing reduced expression of TSP2 in neuroblastoma cells transduced with a TSP2 shRNA
with (PML-I-OE Sh) or without (pBpuro Sh) PML-I overexpression. It should be noted that PML-I
overexpression (PML-I-OE) caused up regulation of TSP2 with respect to control cells (pBpuro).
Quantification of the western blot is shown on the right. (D) Angiogenesis assay. The reduction
in angiogenesis caused by incubation of HUVEC cells with supernatants from neuroblastoma
cells overexpressing PML-I (PML-I-OE) was reverted by knockdown of TSP2 (PML-I-OE Sh).

Dvorkina et al. A promyelocytic leukaemia protein-thrombospondin 2 axis and the risk of relapse in neuroblastoma
22
Bars indicate the mean values of four independent experiments and error bars the standard
errors. Representative images from the Angiogenesis assay are shown in the top of the panel.
(E) Immunofluorescence analysis showing co-expression of PML-I and TSP2 in sections of
primary human neuroblastomas. Statistical analysis shows a significant degree of correlation
(Spearman’s correlation rank r=0.89).
Table 1. Correlation of PML expression with tumor microvessel density in localised and
metastatic tumors.
Table 2. Analysis of total PML, PML-I and TSP2 expression in localised and metastatic tumor
A B
Figure 1
E
D
C
90kDa

C
D
A B
E
Figure 2

A B
C
E
F
G
D
Figure 3
A
D
C
E
B
Figure 4