A PROJECT REVIEW ON PERFORMANCE OF COPPER · PDF fileBACK SLIDE TRAVEL MM 200 MAX. ... Genichi...
33
A PROJECT REVIEW ON PERFORMANCE OF COPPER AND COPPER TUNGSTEN ELECTRODES WITH DIFFERENT DIELECTRICS USING TAGUCHI BASED TOPSIS Under the guidance of Dr. A.NEELAKANTESWARA RAO ASSOCIATE PROFESSOR Submitted By P.RAMESHBABU ME093115 MANUFACTURING ENGINEERING
Transcript of A PROJECT REVIEW ON PERFORMANCE OF COPPER · PDF fileBACK SLIDE TRAVEL MM 200 MAX. ... Genichi...

A PROJECT REVIEW
ON
PERFORMANCE OF COPPER AND COPPER TUNGSTEN
ELECTRODES WITH DIFFERENT DIELECTRICS USING TAGUCHI
BASED TOPSIS
Under the guidance of
Dr. A.NEELAKANTESWARA RAO
ASSOCIATE PROFESSOR
Submitted By
P.RAMESHBABU
ME093115
MANUFACTURING ENGINEERING
INTRODUCTION
Electro Discharge Machining (EDM) is a traditional machining technology
and is one of the most efficient technologies for fabricating components.
EDM is the most widely and successfully used method for machining
difficult to machine materials like super alloys and titanium alloys.
Titanium and its alloys have many attractive properties, including a high
specific strength, excellent corrosion resistance and cryogenic properties.
Titanium alloy, which is a difficult-to-machine material, can be machined
effectively by EDM.

LITERATURE REVIEW
Biing Hwa Yan , Hsien Chung Tsai (2005), Study investigates the influence of
the machining characteristics on pure titanium metals using EDM with the
addition of urea into distilled water.
Anand Pandey et. Al (2010), Explained Present manufacturing industries are
facing challenges from these advanced materials viz. super alloys.
LUO Yong et.al (2007), Described about Three different nitrogen ion doses
were implanted into a Ti6Al4V alloy to improve its mechanical surface
properties
I.Puertas, C.J.Luis,(2003), worked on study on the machining parameters
optimization of electrical discharge machining.
F. Hosseinzadeh Lotfi et al [2009], the aim of this paper is to extend the
TOPSIS method for decision-making problems with Fuzzy data.

OBJECTIVE OF PRESENT WORK
To investigate the performance of copper and copper tungsten as electrodes
in EDM characteristics of Titanium alloy [Ti–6Al–4V] using kerosene, distilled
water and urea solution as the dielectrics.
To attain higher Material removal rate, lower Electrode wear rate, while
machining Titanium alloy [Ti–6Al–4V] using copper tungsten as electrode with
different dielectrics.
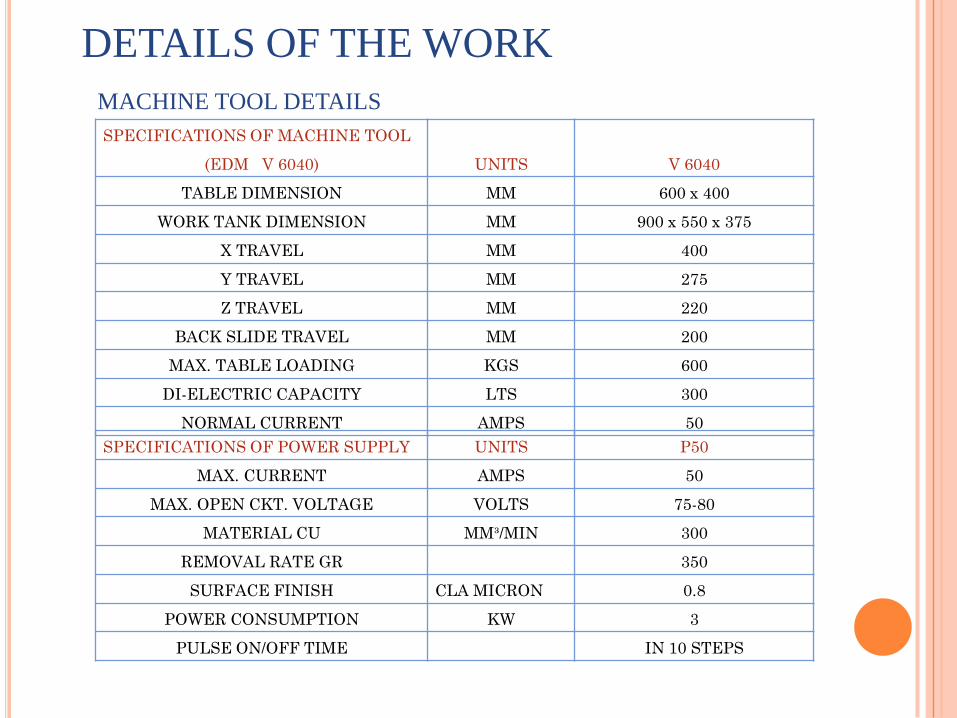
MACHINE TOOL DETAILS
SPECIFICATIONS OF MACHINE TOOL
(EDM V 6040) UNITS V 6040
TABLE DIMENSION MM 600 x 400
WORK TANK DIMENSION MM 900 x 550 x 375
X TRAVEL MM 400
Y TRAVEL MM 275
Z TRAVEL MM 220
BACK SLIDE TRAVEL MM 200
MAX. TABLE LOADING KGS 600
DI-ELECTRIC CAPACITY LTS 300
NORMAL CURRENT AMPS 50
SPECIFICATIONS OF POWER SUPPLY UNITS P50
MAX. CURRENT AMPS 50
MAX. OPEN CKT. VOLTAGE VOLTS 75-80
MATERIAL CU MM³/MIN 300
REMOVAL RATE GR 350
SURFACE FINISH CLA MICRON 0.8
POWER CONSUMPTION KW 3
PULSE ON/OFF TIME IN 10 STEPS
DETAILS OF THE WORK
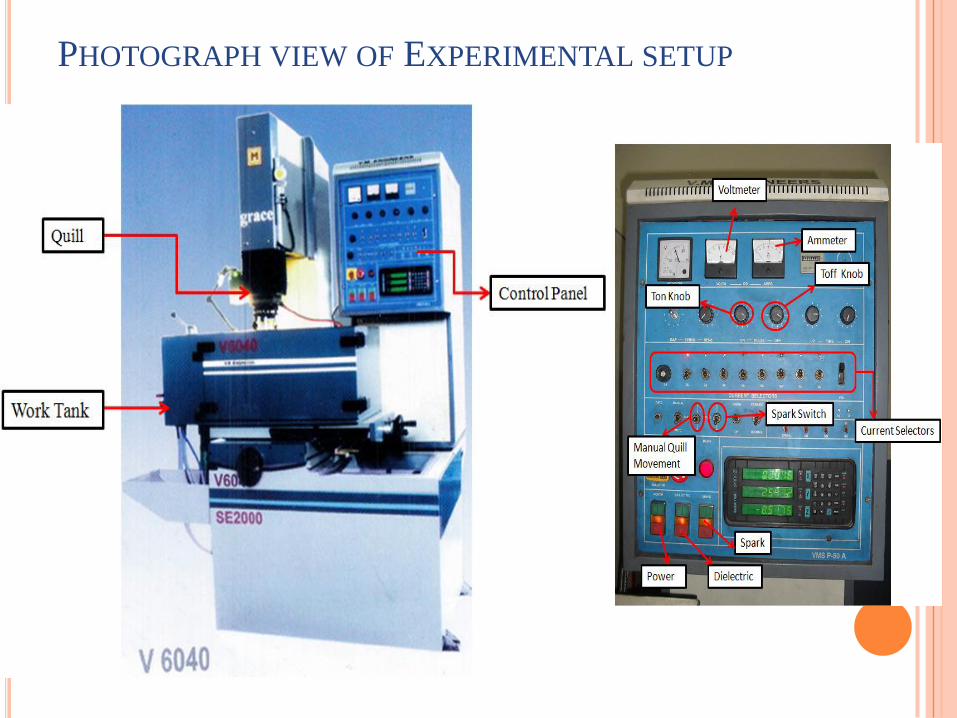
PHOTOGRAPH VIEW OF EXPERIMENTAL SETUP

WORK MATERIAL
Titanium Alloy [Ti–6Al–4V]
Composition Mechanical properties
Content
C <0.08%
Fe <0.25%
N2 <0.05%
O2 <0.2%
Al 5.5-6.76%
V 3.5-4.5%
H2(sheet) <0.015%
H2(bar) <0.0125%
H2(billet) <0.01%
Ti Balance
Property Minimum Typical Value
Tensile Strength MPa (ksi) 897 (130) 1000 (145)
0.2% Proof Stress MPa (ksi) 828 (120) 910 (132)
Elongation Over 2 Inches % 10 18
Reduction in Area % 20
Elastic Modulus GPa (Msi) 114 (17)
Hardness Rockwell C 36
Specified Radius <0.070 in x Thickness 4.5
Specified Radius >0.070 in x Thickness 5.0
Welded Radius x Thickness 6
Charpy, V-Notch Impact J (ft.lbf) 24 (18)
Applications
Aerospace industry
Biomechanical
Marine applications
Chemical industry
Petrochemical
Body Jewelers
Sports Equipment
Work piece Copper electrode Copper tungsten electrode

PREPARATION OF DIELECTRIC
Urea solution is prepared of concentration 10 grams urea powder in 1 liter of distilled water.
Urea Properties
Molar mass 60.06 g mol−1
Appearance White solid
Density 1.32 g/cm3
Melting point 133–135 C
Solubility in water 51,8 g/100 ml (20 C)
Distilled water
Distilled water Properties
Density ( 1000 Kg/m3) 1
Viscosity (Pa-s) 1.79*10e-3
Kinematic Viscosity (m2/s) 1.79*10e-6
Temperature 0

TAGUCHI DESIGN OF EXPERIMENTS PROCESS STEPS
Genichi Taguchi, a Japanese engineer, has developed the Taguchi method for the application of
design of experiment.
Taguchi methods is the method used for the optimization of experimental designs for
performance quality and cost.
Taguchi parameter design can optimize the performance characteristics through the settings of
design parameters and reduce the sensitivity of the system performance to sources of variation.
Steps followed by the taguchi method
1. Problem identification
2. Objectives of the project work
3. Selecting Quantity characteristics
4. Selecting the process parameters that may influence quantity characteristics

CONTD..5. Identifying Control factors
Control factors Noise factors
Peak current(Amps) Environmental (Room) conditions
Ton(Micro secs) Homogeneity of work or tool material
Gap voltage(Volts) Tool and Machine Tool Rigidity
Electrode Tool & Work Material
Dielectric
6. Selecting levels for control factors
Control factors Level 1 Level 2 Level 3
Electrode CU CU+W
Dielectric Kerosene Distilled water Urea solution
Peak current(Amp) 3 5 7
Ton(Micro secs) 50 100 200
Gap voltage(Volts) 35 40 45
7. Selecting Orthogonal Array and Assign Factors
Here we have five factors and three levels for each factor so L18 Mixed Orthogonal array can be
selected and factors are assigned.

Contd..8. Conducting Tests as per trials in Orthogonal Array
9. Analyze the results of experimentation trials
10. Conduct confirmation Experiment
Experimental DesignMixed level L18
SL.No A B C D E
1 1 1 1 1 1 1 1 1
2 1 1 2 2 2 2 2 2
3 1 1 3 3 3 3 3 3
4 1 2 1 1 2 2 3 3
5 1 2 2 2 3 3 1 1
6 1 2 3 3 1 1 2 2
7 1 3 1 2 1 3 2 3
8 1 3 2 3 2 1 3 1
9 1 3 3 1 3 2 1 2
10 2 1 1 3 3 2 2 1
11 2 1 2 1 1 3 3 2
12 2 1 3 2 2 1 1 3
13 2 2 1 2 3 1 3 2
14 2 2 2 3 1 2 1 3
15 2 2 3 1 2 3 2 1
16 2 3 1 3 2 3 1 2
17 2 3 2 1 3 1 2 3
18 2 3 3 2 1 2 3 1
Factors were assigned in A,B,C,D,E column means
A-Electrode, B-Dielectric, C-Peak current, D-Ton, E-Gap voltage
Contd..
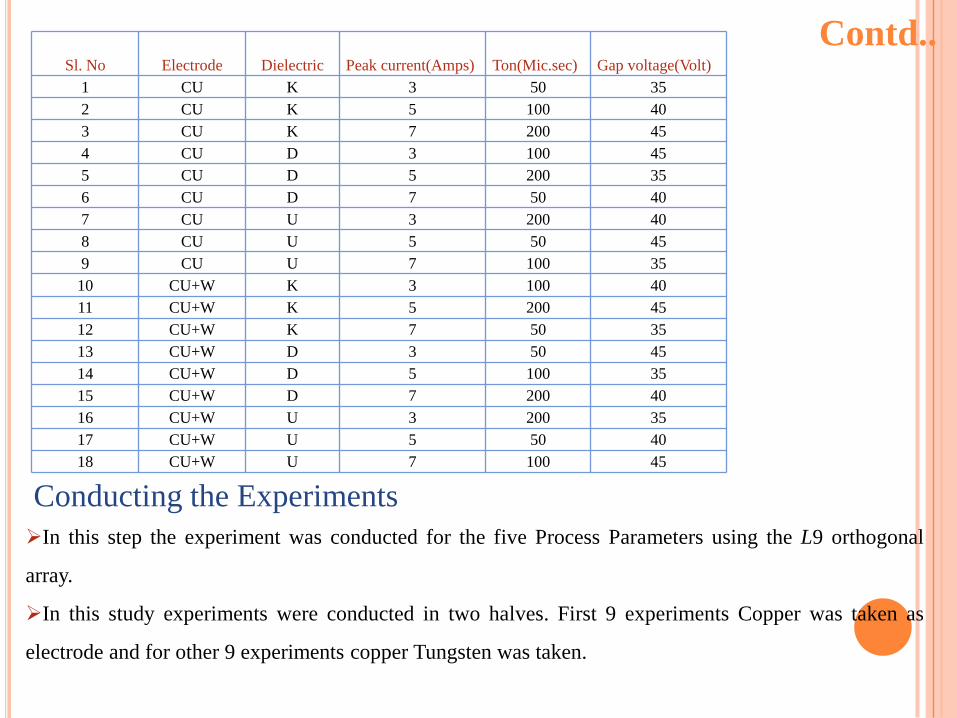
Conducting the Experiments
In this step the experiment was conducted for the five Process Parameters using the L9 orthogonal
array.
In this study experiments were conducted in two halves. First 9 experiments Copper was taken as
electrode and for other 9 experiments copper Tungsten was taken.
Sl. No Electrode Dielectric Peak current(Amps) Ton(Mic.sec) Gap voltage(Volt)
1 CU K 3 50 35
2 CU K 5 100 40
3 CU K 7 200 45
4 CU D 3 100 45
5 CU D 5 200 35
6 CU D 7 50 40
7 CU U 3 200 40
8 CU U 5 50 45
9 CU U 7 100 35
10 CU+W K 3 100 40
11 CU+W K 5 200 45
12 CU+W K 7 50 35
13 CU+W D 3 50 45
14 CU+W D 5 100 35
15 CU+W D 7 200 40
16 CU+W U 3 200 35
17 CU+W U 5 50 40
18 CU+W U 7 100 45
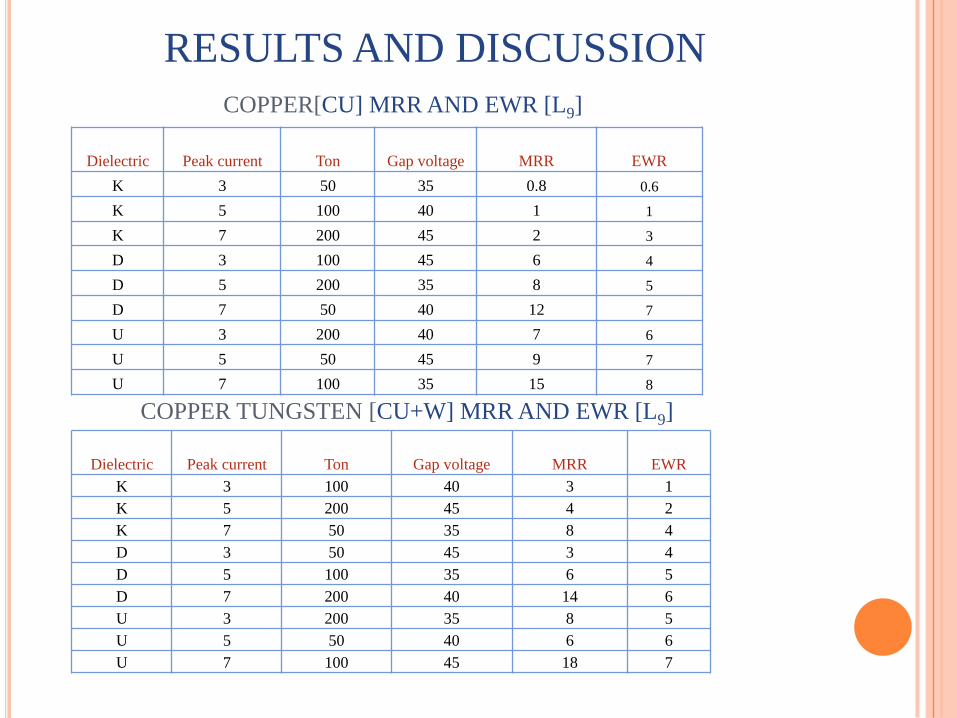
Dielectric Peak current Ton Gap voltage MRR EWR
K 3 50 35 0.8 0.6
K 5 100 40 1 1
K 7 200 45 2 3
D 3 100 45 6 4
D 5 200 35 8 5
D 7 50 40 12 7
U 3 200 40 7 6
U 5 50 45 9 7
U 7 100 35 15 8
COPPER[CU] MRR AND EWR [L9]
COPPER TUNGSTEN [CU+W] MRR AND EWR [L9]
Dielectric Peak current Ton Gap voltage MRR EWR
K 3 100 40 3 1
K 5 200 45 4 2
K 7 50 35 8 4
D 3 50 45 3 4
D 5 100 35 6 5
D 7 200 40 14 6
U 3 200 35 8 5
U 5 50 40 6 6
U 7 100 45 18 7
RESULTS AND DISCUSSION

Contd..CU&CU+W MRR, EWR [L18]
Sl.
No Electrode Dielectric Peak current Ton Gap voltage MRR EWR
1 CU K 3 50 35 0.8 0.6
2 CU K 5 100 40 1 1
3 CU K 7 200 45 2 3
4 CU D 3 100 45 6 4
5 CU D 5 200 35 8 5
6 CU D 7 50 40 12 7
7 CU U 3 200 40 7 6
8 CU U 5 50 45 9 7
9 CU U 7 100 35 15 8
10 CU+W K 3 100 40 3 1
11 CU+W K 5 200 45 4 2
12 CU+W K 7 50 35 8 4
13 CU+W D 3 50 45 3 4
14 CU+W D 5 100 35 6 5
15 CU+W D 7 200 40 14 6
16 CU+W U 3 200 35 8 5
17 CU+W U 5 50 40 6 6
18 CU+W U 7 100 45 18 7
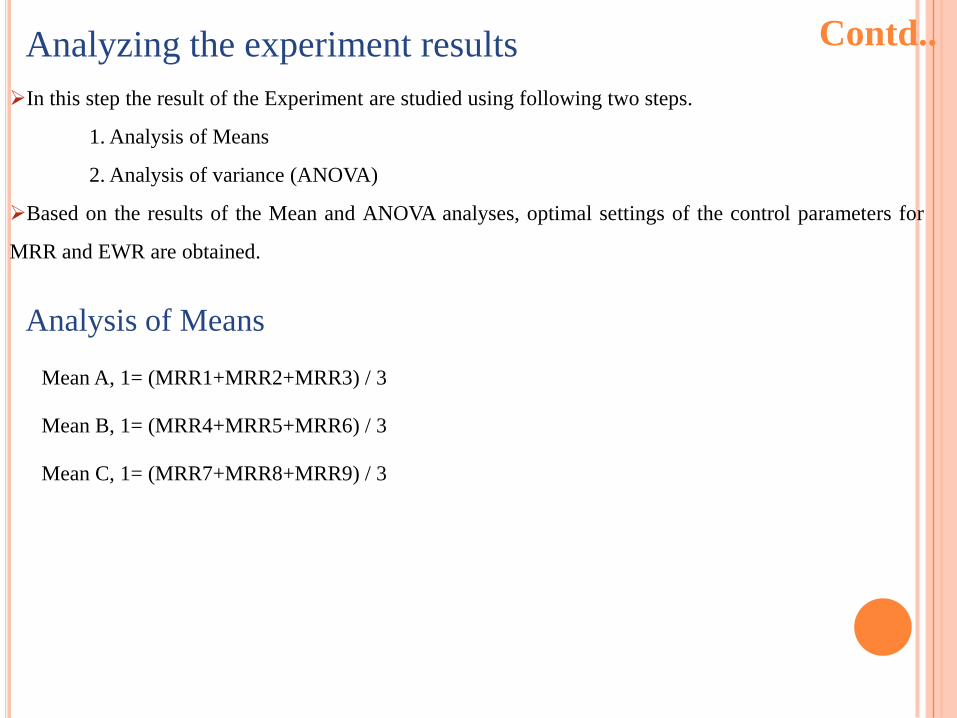
Contd..Analyzing the experiment results
In this step the result of the Experiment are studied using following two steps.
1. Analysis of Means
2. Analysis of variance (ANOVA)
Based on the results of the Mean and ANOVA analyses, optimal settings of the control parameters for
MRR and EWR are obtained.
Analysis of Means
Mean A, 1= (MRR1+MRR2+MRR3) / 3
Mean B, 1= (MRR4+MRR5+MRR6) / 3
Mean C, 1= (MRR7+MRR8+MRR9) / 3

Contd..Mean Response table for CU MRR
Level Dielectric Peak current Ton Gap voltage
1 1.267 4.600 7.267 7.933
2 8.667 6.000 7.333 6.667
3 10.333 9.667 5.667 5.667
Delta 9.067 5.067 1.667 2.267
Rank 1 2 4 3
Mean Response graph for CU MRR Vs Control Parameters
Optimum process parameters: A3, B3, C2, D1
Dielectric = Urea solution
Peak current = 7 Amps
Ton = 100 Micro seconds
Gap voltage = 35 Volts
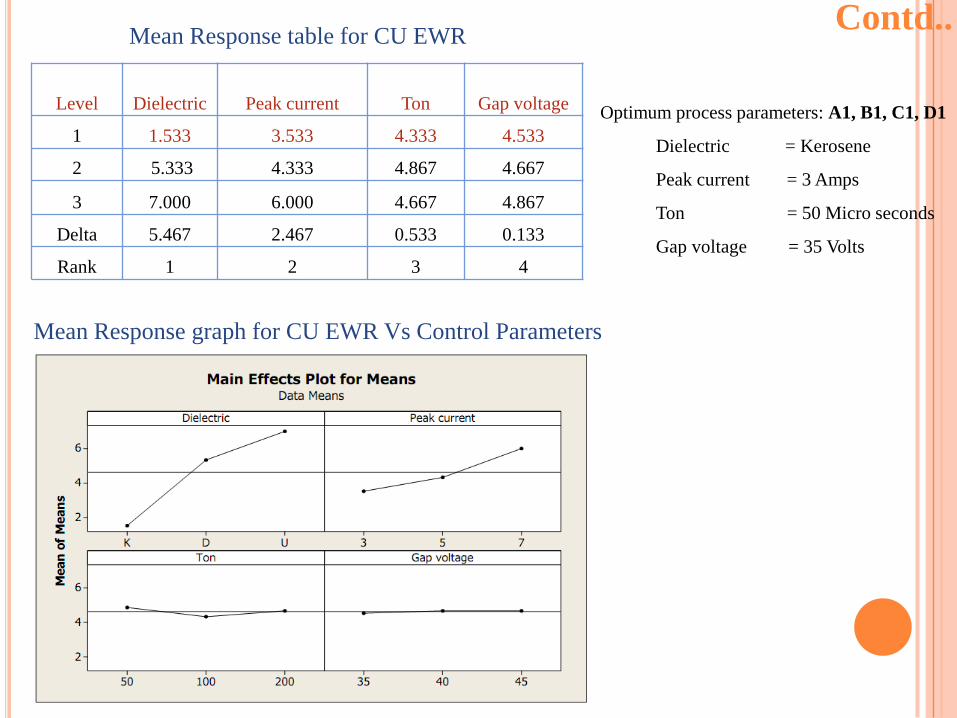
Contd..Mean Response table for CU EWR
Level Dielectric Peak current Ton Gap voltage
1 1.533 3.533 4.333 4.533
2 5.333 4.333 4.867 4.667
3 7.000 6.000 4.667 4.867
Delta 5.467 2.467 0.533 0.133
Rank 1 2 3 4
Optimum process parameters: A1, B1, C1, D1
Dielectric = Kerosene
Peak current = 3 Amps
Ton = 50 Micro seconds
Gap voltage = 35 Volts
Mean Response graph for CU EWR Vs Control Parameters

Contd..Mean Response table for CU+W MRR
Level Dielectric Peak current Ton Gap voltage
1 5.000 4.667 5.667 7.333
2 7.667 5.333 9.000 7.667
3 10.667 13.333 8.667 8.333
Delta 5.667 8.667 3.333 1
Rank 2 1 3 4
Optimum process parameters: A3, B3, C2, D3
Dielectric = Urea solution
Peak current = 7 Amps
Ton = 100 Micro seconds
Gap voltage = 45 Volts
Mean Response graph for CU+W MRR Vs Control Parameters

Contd..Mean Response table for CU+W EWR
Level Dielectric Peak current Ton Gap voltage
1 2.333 3.333 4.667 4.667
2 5.000 4.333 4.333 4.333
3 6.000 5.667 4.334 4.345
Delta 3.667 2.333 0.333 0.333
Rank 1 2 3.5 3.5
Optimum process parameters: A1, B1, C2, D2
Dielectric = Kerosene
Peak current = 3 Amps
Ton = 50 Micro seconds
Gap voltage = 40 Volts
Mean Response graph for CU+W EWR Vs Control Parameters
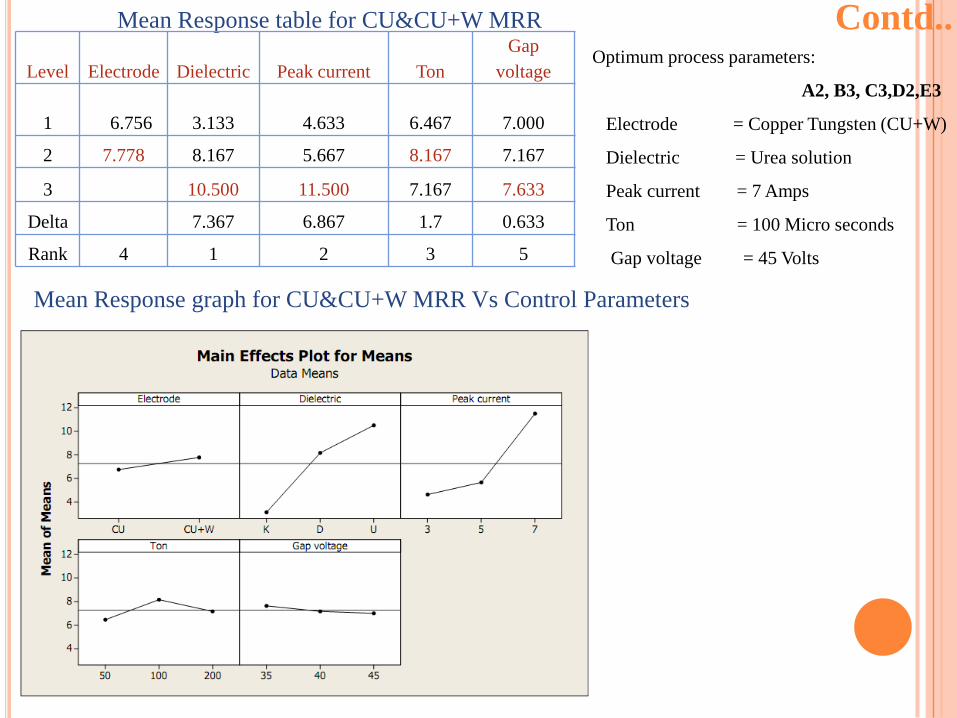
Contd..Mean Response table for CU&CU+W MRR
Level Electrode Dielectric Peak current Ton
Gap
voltage
1 6.756 3.133 4.633 6.467 7.000
2 7.778 8.167 5.667 8.167 7.167
3 10.500 11.500 7.167 7.633
Delta 7.367 6.867 1.7 0.633
Rank 4 1 2 3 5
Mean Response graph for CU&CU+W MRR Vs Control Parameters
Optimum process parameters:
A2, B3, C3,D2,E3
Electrode = Copper Tungsten (CU+W)
Dielectric = Urea solution
Peak current = 7 Amps
Ton = 100 Micro seconds
Gap voltage = 45 Volts

Contd..Mean Response table for CU&CU+W EWR
Level Electrode Dielectric Peak current Ton
Gap
voltage
1 4.622 1.933 3.433 4.767 4.60
2 4.444 5.167 4.333 4.333 4.500
3 6.500 5.833 4.500 4.550
Delta 4.567 2.40 0.433 0.1
Rank 4 1 2 3 5
Optimum process parameters:
A2, B1, C1,D2,E2
Electrode = Copper Tungsten (CU+W)
Dielectric = Kerosene
Peak current = 3 Amps
Ton = 100 Micro seconds
Gap voltage = 40 Volts
Mean Response graph for CU&CU+W EWR Vs Control Parameters

ANALYSIS OF VARIANCE
The purpose of the analysis of variance (ANOVA) is to investigate which design parameters
significantly affect the quality characteristic.
To calculated the sum of the squares, mean squares and contributions by each of the design
parameters from response table.
Average (nm) = (MRR1+MRR2+MRR3+MRR4+MRR5+MRR6+MRR7+MRR8+MRR9)/9
First, Average calculated as:
Total Sum of Squares (ST) =
Sum of squares due to the mean (Sm) = n*(nm)2
Sum of squares due to factors (SA) = nA1*A12+ nA2*A2
2+ nA3*A32 - Sm
Degree of freedom (DOF) = no of levels – 1
Mean sum of squares (MQa) = SA / DOF
% Contribution (P) = SA / St where St = ST- Sm

Results of the ANOVA for CU
Sym
bol
Process
parameters
DOF Sum of
squares
Mean
squares
Contribution
(%)
A Dielectric 2 140.41 70.205 72.16
B
Peak
current 2 41.77 20.885 21.46
C Ton 2 6.03 3.015 3.09
D
Gap
voltage 2 8.42 4.21 4.32
Error
0 - - -
St 8
194.58 - -
Mean
410.06 - -
ST
604.64 - -
Sym
bol
Process
parameters
DOF Sum of
squares
Mean
squares
Contribution
(%)
A Dielectric 2 47.77 23.885 83.41
B
Peak
current 2 9.68 4.84 16.90
C Ton 2 0.64 0.32 1.11
D
Gap
voltage 2 5.96 2.98 10.40
Error
0 - - -
St 8
57.27 - -
Mean
192.09 - -
ST
249.36 - -
MRR EWR

Sym
bol
Process
parameters
DOF Sum of
squares
Mean
squares
Contribution
(%)
A Dielectric 2 47.28 23.64 22.46
B
Peak
Current 2 139.22 69.61 66.53
C Ton 2 53.27 26.63 25.45
D
Gap
Voltage 2 1.23 0.61 0.50
Error 0
- - -
St 8 209.25
- -
Mean 544.75
- -
ST 754
- -
Sym
bol
Process
parameters
DOF Sum of
squares
Mean
squares
Contribution
(%)
A Dielectric 2 21.55 10.77 71.28
B
Peak
Current 2 8.22 4.11 27.19
C Ton 2 0.22 0.11 0.72
D
Gap
Voltage 2 0.22 0.11 0.72
Error 0
- - -
St 8 30.23
- -
Mean 177.77
- -
ST 208
- -
Results of the ANOVA for CU+W
MRR EWR

Results of the ANOVA for CU & CU+W
MRR EWR
Sym
bol
Process
Parameters
DOF Sum of
squares
Mean
squares
Contribution
(%)
A Electrode 1 6.53 6.53 1.59
B Dielectric 2 171.86 85.93 41.92
C
Peak
Current 2 166.24 83.12 40.55
D Ton 2 10.59 5.29 2.58
E
Gap
Voltage 2 3.04 1.52 0.74
Error 8
- - -
St 17 409.91
- -
Mean 948.73
- -
ST 1358.64
- -
Sym
bol
Process
Parameters
DOF Sum of
squares
Mean
squares
Contribution
(%)
A Electrode 1 0.63 0.63 0.72
B Dielectric 2 66.73 10.77 75.83
C
Peak
Current 2 18.13 4.11 20.60
D Ton 2 1.12 0.11 1.27
E
Gap
Voltage 2 0.59 0.11 0.6
Error 8
- - -
St 17 87.99
- -
Mean 369.37
- -
ST 457.36
- -
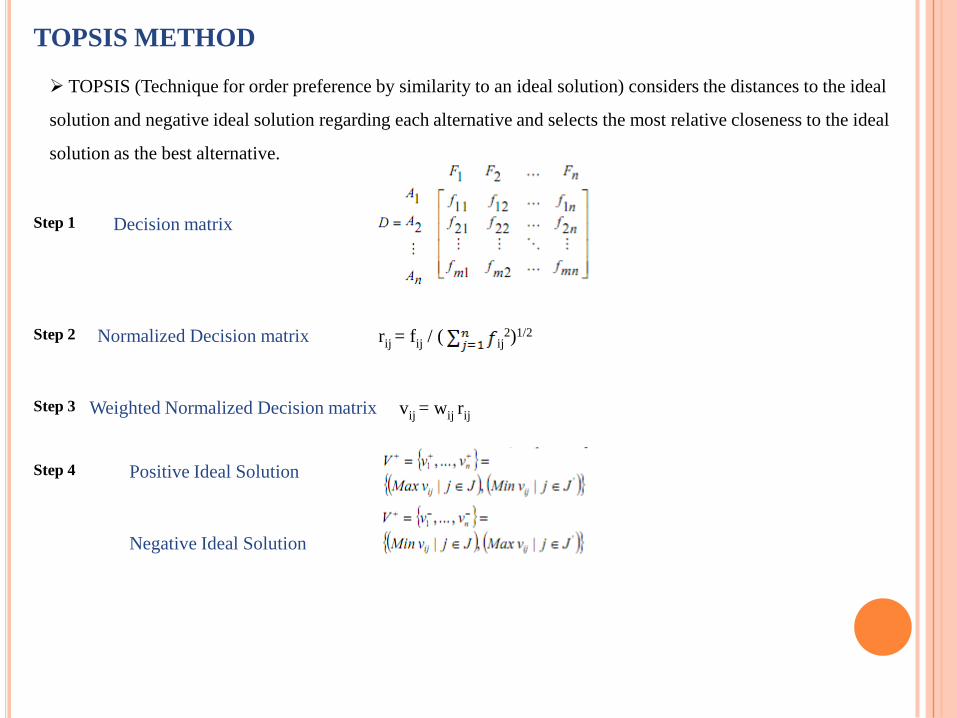
TOPSIS METHOD
TOPSIS (Technique for order preference by similarity to an ideal solution) considers the distances to the ideal
solution and negative ideal solution regarding each alternative and selects the most relative closeness to the ideal
solution as the best alternative.
Step 1 Decision matrix
Step 3
Normalized Decision matrix rij = fij / ( ij2)1/2Step 2
Weighted Normalized Decision matrix vij = wij rij
Step 4 Positive Ideal Solution
Negative Ideal Solution
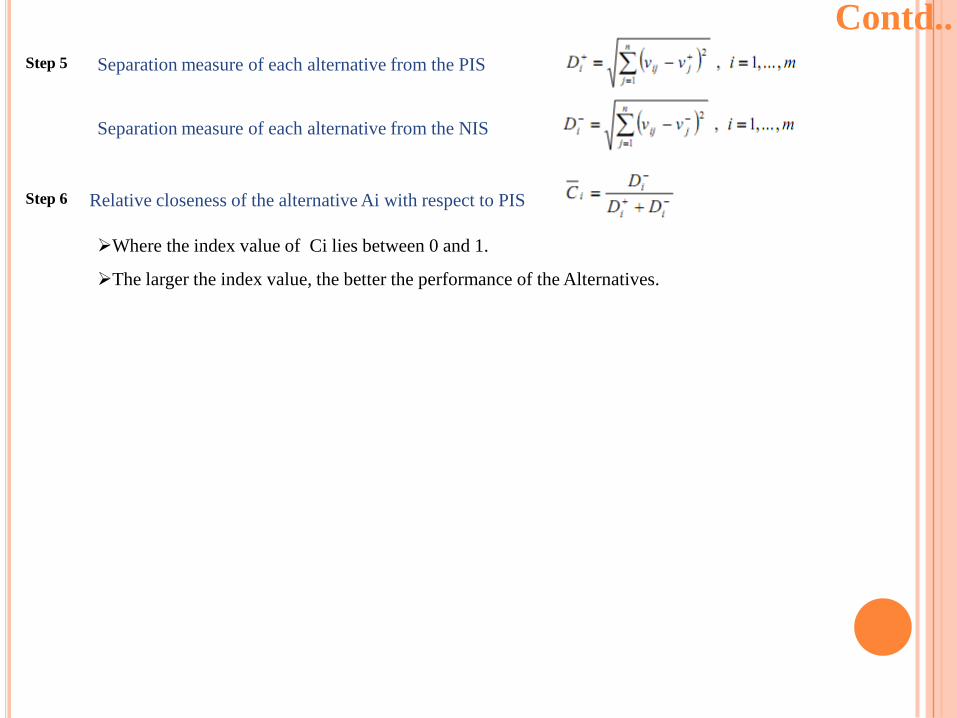
Step 6
Contd..
Relative closeness of the alternative Ai with respect to PIS
Where the index value of Ci lies between 0 and 1.
The larger the index value, the better the performance of the Alternatives.
Step 5 Separation measure of each alternative from the PIS
Separation measure of each alternative from the NIS

Contd..Decision Matrix [CU]
Diele
ctric
Peak
current Ton
Gap
voltage MRR EWR
K 3 50 35 0.8 0.6
K 5 100 40 1 1
K 7 200 45 2 3
D 3 100 45 6 4
D 5 200 35 8 5
D 7 50 40 12 7
U 3 200 40 7 6
U 5 50 45 9 7
U 7 100 35 15 8
Normalized decision matrix [CU]
Dielectric Peak current Ton
Gap
voltage MRR EWR
K 0.190117 0.125988 0.290159 0.032534 0.037996
K 0.316862 0.251976 0.331611 0.040668 0.063327
K 0.443607 0.503953 0.373062 0.081336 0.18998
D 0.190117 0.251976 0.373062 0.244007 0.253307
D 0.316862 0.503953 0.290159 0.325343 0.316633
D 0.443607 0.125988 0.331611 0.488015 0.443287
U 0.190117 0.503953 0.331611 0.284675 0.37996
U 0.316862 0.125988 0.373062 0.366011 0.443287
U 0.443607 0.251976 0.290159 0.610018 0.506613
Weighted normalized decision matrix [CU] Dielectric Peak current Ton
Gap
voltage MRR EWR
K 0.057035 0.025198 0.023213 0.013014 0.00076
K 0.095059 0.050395 0.026529 0.016267 0.001267
K 0.133082 0.100791 0.029845 0.032534 0.0038
D 0.057035 0.050395 0.029845 0.097603 0.005066
D 0.095059 0.100791 0.023213 0.130137 0.006333
D 0.133082 0.025198 0.026529 0.195206 0.008866
U 0.057035 0.100791 0.026529 0.11387 0.007599
U 0.095059 0.025198 0.029845 0.146404 0.008866
U 0.133082 0.050395 0.023213 0.244007 0.010132

Contd..Relative closeness to the ideal solution for [CU]
Electrode Dielectric Relative closeness
CU K 0
CU K 0.162387
CU K 0.3405
CU D 0.339274
CU D 0.545878
CU D 0.686975
CU U 0.455757
CU U 0.518482
CU U 0.827988
Relative closeness to the ideal solution for [CU+W]
Electrode Dielectric Relative closeness
CU+W K 0.096866
CU+W K 0.293256
CU+W K 0.39076
CU+W D 0.031159
CU+W D 0.254256
CU+W D 0.767725
CU+W U 0.389904
CU+W U 0.231264
CU+W U 0.822157
Relative closeness to the ideal solution for [CU]& [CU+W]
Electrode Dielectric Relative closeness
CU K 0
CU K 0.145782
CU K 0.30744
CU D 0.290238
CU D 0.468076
CU D 0.612224
CU U 0.396697
CU U 0.448818
CU U 0.772134
CU+W K 0.145694
CU+W K 0.309963
CU+W K 0.439323
CU+W D 0.120195
CU+W D 0.320988
CU+W D 0.788453
CU+W U 0.438708
CU+W U 0.304493
CU+W U 0.845587

Contd..Topsis Analysis are summarized as follows:
Sl.No Array of Experiments Best Alternative
1 Copper L9 [1-9] Urea solution
2 Copper Tungsten [9-18] Urea solution
3 Copper & Copper Tungsten [1-18] Copper Tungsten and Urea solution

CONCLUSION
On the basis of experimental results, the EDM characteristics of Titanium alloy [Ti–6Al–4V] were examined
using kerosene, distilled water and urea solution as the dielectrics and Copper and copper Tungsten as
electrodes.
• Copper Tungsten electrode gives better MRR while copper performed for lower EWR.
• Urea solution gives better MRR and kerosene is preferred for lower EWR.
• By applying TOPSIS Urea solution and Copper Tungsten electrode gives better results among
other alternatives.

REFERENCES
1.Biing Hwa Yan , Hsien Chung Tsai, Fuang Yuan Huang, The effect in EDM of a dielectric of a urea solution in water on modifying
the surface of titanium, International Journal of Machine Tools & Manufacture 45 (2005), 194–200.
2. Lin, Y.C., Yan, B.H., Chang, Y.S., 2000. Machining characteristics of titanium alloy (Ti–6Al–4V) using a combination process of
EDM with USM. J. Mater. Process. Technol. 104, 171–177. Material Property Data, Matweb, 2007.
3. M. Toren, Y. Zvirin, Y. Winograd, Melting and evaporation phenomena during electrical erosion, Journal of Heat Transfer 1989;
576–581.
4. Hascalik, A., Caydas, U., 2007, Electrical discharge machining of titanium alloy (Ti–6Al–4V), Applied Surface Science, 253:9007-
9016.
5. Boothroyd, G.; Winston, A.K. (1989): Non-conventional machining processes, in Fundamentals of Machining and Machine Tools,
Marcel Dekker, Inc, New York, 491.
6. Marafona J, Wykes C (2000) A new method of optimizingmaterial removal rate using EDM with copper-tungsten electrodes. Int J
Mach & Manuf 40:153–164.
7. C.J. Luis, I. Puertas, G. Villa, Material removal rate and electrodewear study on the EDM of silicon carbide, Journal of
MaterialsProcessing Technology 164–165 (2005) 889–896.
8. Jahanshahloo, G.R., Junior, H.V., Hosseinzadeh Lotfi, F., Akbarian, D., 2007, A new DEA ranking system based on changing the
reference set, European Journal of Operational Research. 181, 331-337.
9. G.Taguchi (1990) Introduction to Quality Engineering, Asian Produc-tivity Organization, Tokyo.
10. F. Hosseinzadeh Lotfi, T. Allahviranloo, M. Alimardani Jondabeh, and N. A. Kiani, A New Method for Complex Decision Making
Based on TOPSIS for Complex Decision Making Problems with Fuzzy Data, Applied Mathematical Sciences, Vol. 1, 2007, no. 60,
2981 – 2987.

THANK YOU