![En la sangre [microform] - University Library€¦ · EUGENIOCAMBACERES ENLA SANGRE BUEN06AIRES emprentadeSud-Auérica,calleBolívar34 1887](https://static.fdocuments.in/doc/165x107/5f9c49206f35224ae77a4073/en-la-sangre-microform-university-library-eugeniocambaceres-enla-sangre-buen06aires.jpg)
A project for GY320 – Surface Processes and Geomorphology Eric Leonard Colorado College Sangre de...
21
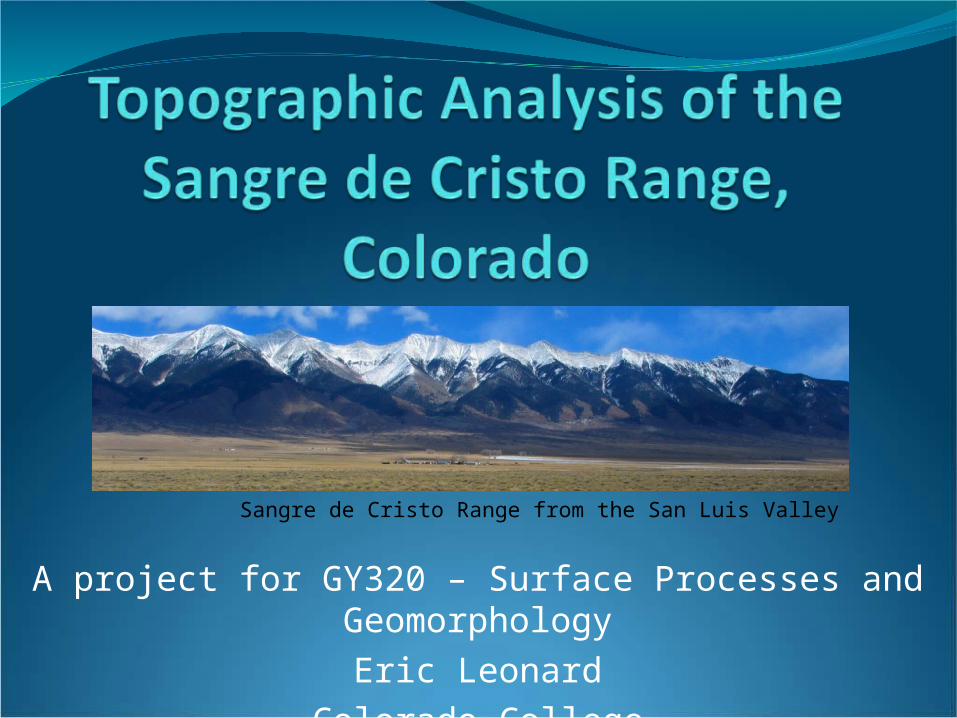
A project for GY320 – Surface Processes and Geomorphology Eric Leonard Colorado College Sangre de Cristo Range from the San Luis Valley
-
Upload
noel-townsend -
Category
Documents
-
view
213 -
download
0
Transcript of A project for GY320 – Surface Processes and Geomorphology Eric Leonard Colorado College Sangre de...
A project for GY320 – Surface Processes and GeomorphologyEric Leonard
Colorado College
Sangre de Cristo Range from the San Luis Valley
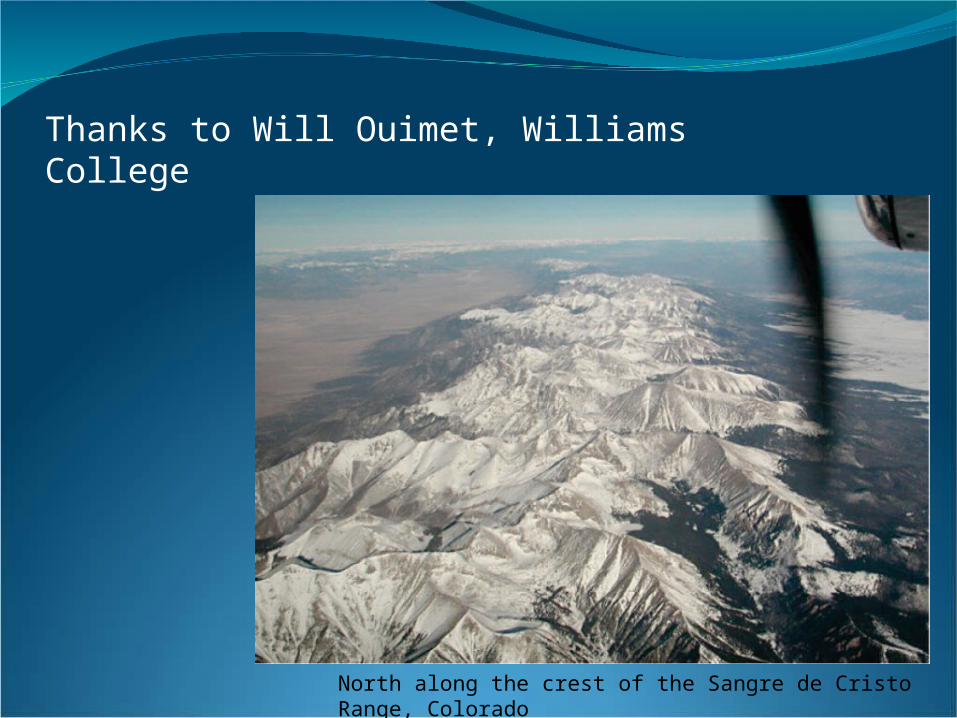
Thanks to Will Ouimet, Williams College
North along the crest of the Sangre de Cristo Range, Colorado
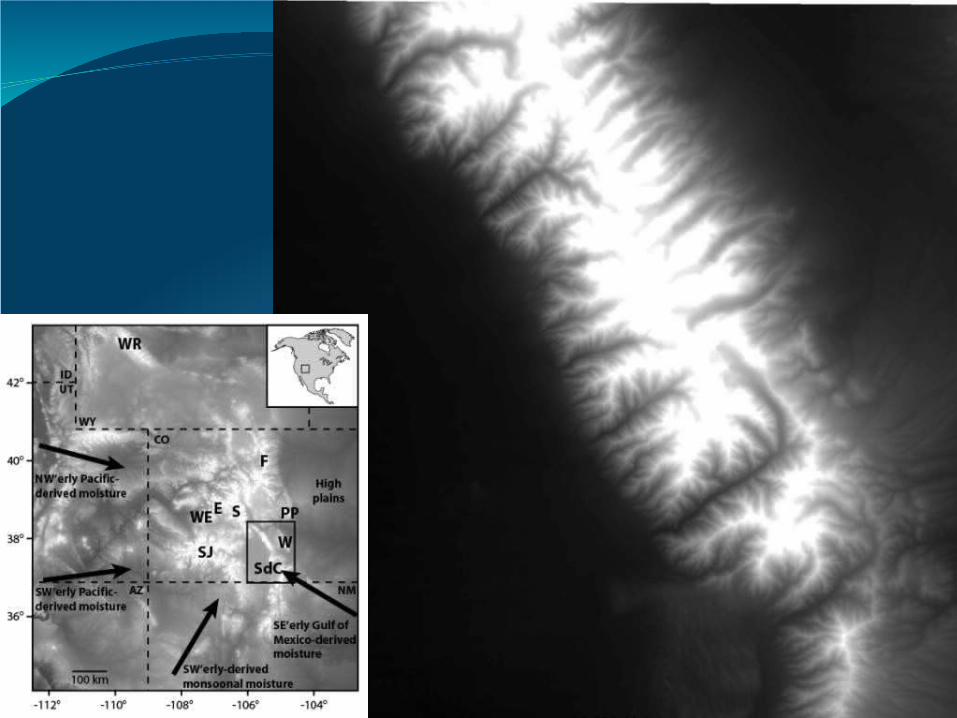
•What can be learned about the landscape and geomorphic evolution of the Sangre de Cristo Range through a GIS-based analysis of digital elevation models?
•More specifically, what can be said about the roles of lithology, tectonics, climate, and different geomorphic processes in causing profound morphological differences between the two sides of the range?
•To increase student understanding of how geomorphic processes are reflected in range-scale landscapes, especially in how they may be reflected in landscape characteristics that can be assessed using digital elevation models (DEMs).
•To introduce students to several GIS tools that are important in interpretation of DEMs and other raster data sets.

•Most are sophomore or junior Geology majors, a few are Environmental Science or Biology majors.
•All have completed a previous lab in this class introducing Arc GIS – including a brief introduction to raster data sets and specifically to DEMs.
•The class has spent several previous sessions on fluvial, glacial, and tectonic geomorphology.
•What are the digital topographic signatures of glaciation in the range? of fluvial processes?•What are the digital topographic signatures of active tectonics?•What evidence is there that lithology has affected range-scale topography?•Why is the topographic signal of glaciation so different on the two sides of the range despite the extensive glaciation of both sides?
•Digital elevation model of the range, and separate DEMs of its western and eastern flanks
•Shape files of major lithologic units in and adjacent to the range
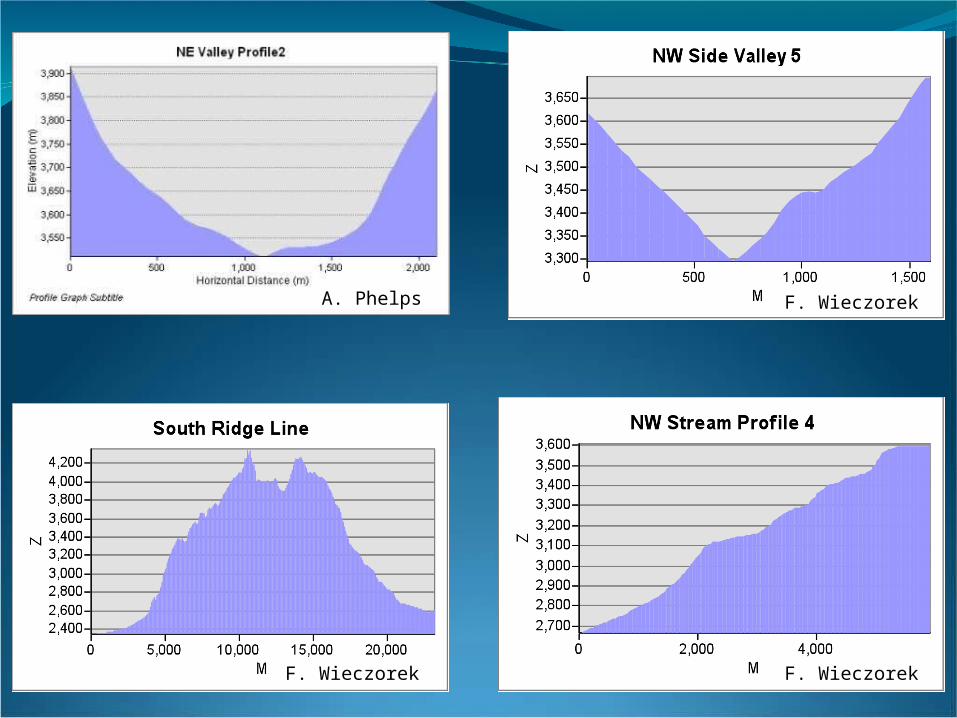
•Shape files of streams on each side of the range allowing students to extract stream profiles
•Additional data plots from MICRODEM
•Tools used by students to generate spatial data• Spatial Analyst (surface characteristics, neighborhood statistics, raster calculator)• 3-D Analyst (topographic profiles)• Histograms (exported to Excel)• Layout view for creating figures
•Other spatial data supplied to, and interpreted by, students• Stream profiles (using Arc Hydro output)• More sophisticated area/altitude/slope data plots (using MICRODEM output)
•In the initial session, students are introduced to the various Arc tools by the project handout.
•Initially the project handout guides students to significant geological observations, but as students progress through the handout geological guidance becomes subtler.
•The final session is devoted to student-initiated analyses and figure preparation.

A. Phelps
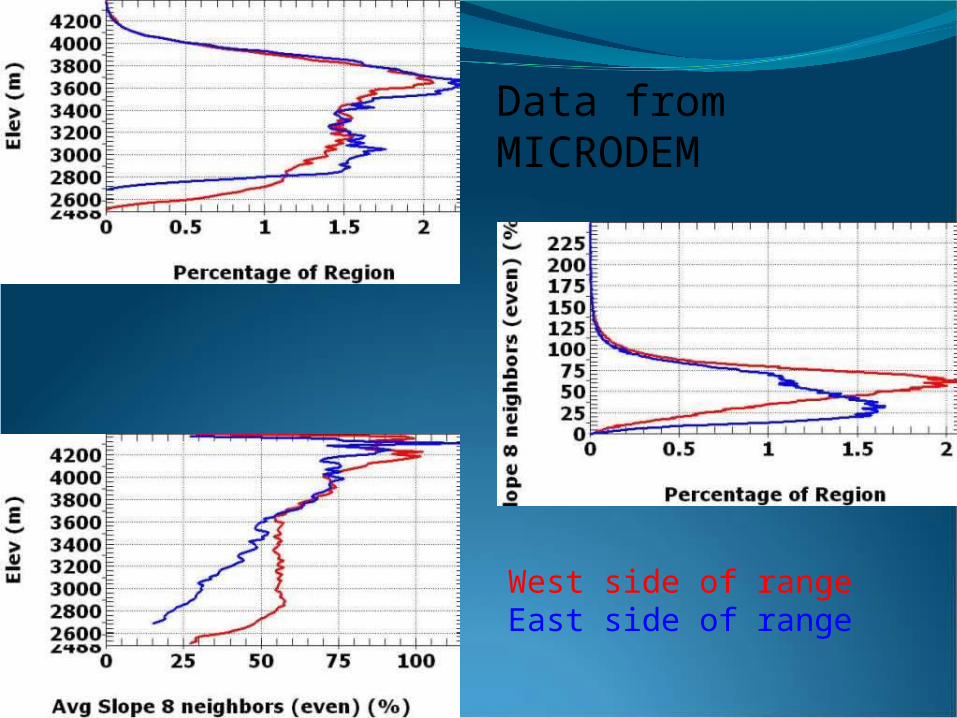
Data from MICRODEM
West side of rangeEast side of range
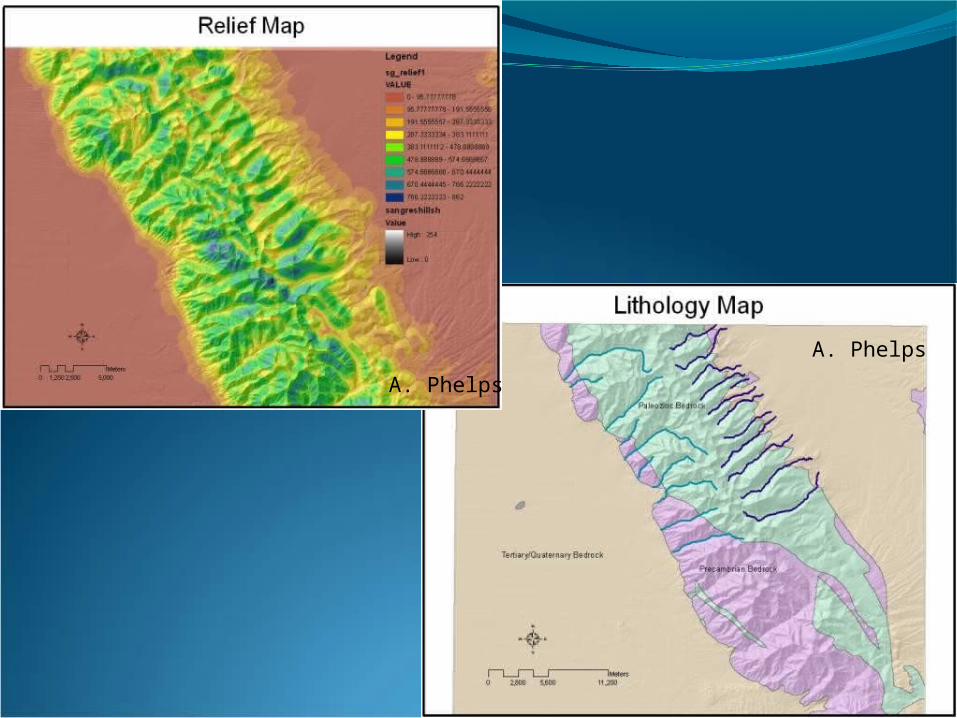
A. Phelps
A. Phelps
A. Phelps
F. WieczorekF. Wieczorek
F. Wieczorek
•Four-to-five pages of text, with multiple supporting maps, graphs, and data tables, discussing:
• Observations regarding the differences between the two sides of the range
• A discussion of multiple hypotheses for the causes of the observed differences between the two sides of the range

•Project seems to have been quite successful overall:• I have been pleased with project write-ups. Students generally do a good job describing their observations, considering multiple hypotheses, and discussing how the observations support or refute the hypotheses.
• Students appear to retain at least some facility with these DEM-analysis approaches in subsequent classes (glacial geology, advanced geomorphology, etc.)
• Students are generally quite enthusiastic about the project in their comments and course evaluation.
•Finding the correct amount of guidance/direction to give students in interpretation of their data in the project handout
•Convincing students to go beyond the analyses I suggest in the project handout to develop additional ways of addressing project questions