A Profile of the Talent Search Program: 1999-2000 · A Profile of the Talent Search Program:...
60
A Profile of the Talent Search Program: 1999-2000 U.S. Department of Education Office of Postsecondary Education Office of Federal TRIO Programs 2002
Transcript of A Profile of the Talent Search Program: 1999-2000 · A Profile of the Talent Search Program:...

A Profile of theTalent SearchProgram: 1999-2000
U.S. Department of EducationOffice of Postsecondary EducationOffice of Federal TRIO Programs
2002


A Profile of the Talent Search Program: 1999-2000
Prepared for:U.S. Department of EducationOffice of Postsecondary EducationOffice of Federal TRIO Programs
By Mathematica Policy Research Inc.Justin G. HumphreyNancy L. CareyWendy Mansfield
2002

This report was prepared for the U.S. Department of Education under Contract No. 1-36U-6742 (031). The views expressed herein are those of the contractor. Noofficial endorsement by the U.S. Department of Education is intended or should be inferred.
U.S. Department of EducationRod PaigeSecretary
Office of Postsecondary EducationSally L. StroupAssistant Secretary
Office of Federal TRIO ProgramsLarry OxendineActing Director
September 2002
This report is in the public domain. Authorization to reproduce it in whole or in partis granted. While permission to reprint this publication is not necessary, the citationshould be: U.S. Department of Education, Office of Postsecondary Education, A Profile of the Talent Search Program: 1999-2000, Washington, D.C., 2002.
To obtain additional copies of this report:
write to: Office of Federal TRIO Programs, U.S. Department of Education, 1990 KStreet, NW, Suite 7000, Washington, D.C. 20006-8510
or fax your request to: (202) 502-7857
or e-mail your request to: [email protected].
This report is also available on the Department’s Web site at:
http://www.ed.gov/offices/OPE/HEP/trio/talent.html.
On request, this publication is available in alternate formats, such as Braille, largeprint, audiotape, or computer diskette. For more information, please contact theDepartment’s Alternate Format Center at (202) 260-9895 or (202) 205-8113.

CONTENTS
FOREWORD . . . . . . . . . . . . . . . . . . . . . . . . . . . . . . . . . . . . . . . . . . . . . . . . . . . viii
ACKNOWLEDGEMENTS . . . . . . . . . . . . . . . . . . . . . . . . . . . . . . . . . . . . . . . . . . . . ix
HIGHLIGHTS . . . . . . . . . . . . . . . . . . . . . . . . . . . . . . . . . . . . . . . . . . . . . . . . . . . xi
I. INTRODUCTION . . . . . . . . . . . . . . . . . . . . . . . . . . . . . . . . . . . . . . . . . . . . . 1A. Background . . . . . . . . . . . . . . . . . . . . . . . . . . . . . . . . . . . . . . . . . . . . 1B. Performance report response . . . . . . . . . . . . . . . . . . . . . . . . . . . . . . . 2C. Comparison of response rates: 1998-99 and 1999-2000 . . . . . . . . . . . 3D. Structure of the report . . . . . . . . . . . . . . . . . . . . . . . . . . . . . . . . . . . . 3
II. DEMOGRAPHICS . . . . . . . . . . . . . . . . . . . . . . . . . . . . . . . . . . . . . . . . . . . . 5A. Number of participants assisted . . . . . . . . . . . . . . . . . . . . . . . . . . . . . 5B. Participant distribution by eligibility . . . . . . . . . . . . . . . . . . . . . . . . . 6C. Participant distribution by race and ethnicity . . . . . . . . . . . . . . . . . . 7D. Participant distribution by gender . . . . . . . . . . . . . . . . . . . . . . . . . . . 9E. Participant distribution by age . . . . . . . . . . . . . . . . . . . . . . . . . . . . . . 10F. Participant distribution by grade level . . . . . . . . . . . . . . . . . . . . . . . . 11G. Veterans served. . . . . . . . . . . . . . . . . . . . . . . . . . . . . . . . . . . . . . . . . . 12H. Participants of limited English proficiency. . . . . . . . . . . . . . . . . . . . . 12I. Target schools . . . . . . . . . . . . . . . . . . . . . . . . . . . . . . . . . . . . . . . . . . 12
III. PROJECT SERVICES AND ACTIVITIES . . . . . . . . . . . . . . . . . . . . . . . . . . . . . . 19A. Academic support services . . . . . . . . . . . . . . . . . . . . . . . . . . . . . . . . . 21
1. Middle school participants . . . . . . . . . . . . . . . . . . . . . . . . . . . . . . 222. High school participants . . . . . . . . . . . . . . . . . . . . . . . . . . . . . . . 233. Adult participants . . . . . . . . . . . . . . . . . . . . . . . . . . . . . . . . . . . . . 24
B. Personal and career development services . . . . . . . . . . . . . . . . . . . . . 261. Middle school participants . . . . . . . . . . . . . . . . . . . . . . . . . . . . . . 272. High school participants . . . . . . . . . . . . . . . . . . . . . . . . . . . . . . . 283. Adult participants . . . . . . . . . . . . . . . . . . . . . . . . . . . . . . . . . . . . . 28
C. Historical perspective on service provision. . . . . . . . . . . . . . . . . . . . . 29
IV. PERFORMANCE OUTCOMES . . . . . . . . . . . . . . . . . . . . . . . . . . . . . . . . . . . . 31A. Secondary school retention, graduation, and reentry . . . . . . . . . . . . . 31B. Admissions and financial aid assistance. . . . . . . . . . . . . . . . . . . . . . . . 32C. Postsecondary admissions and reentry . . . . . . . . . . . . . . . . . . . . . . . . 34D. Postsecondary placement . . . . . . . . . . . . . . . . . . . . . . . . . . . . . . . . . . 35

V. DATA ISSUES AND FUTURE PLANS . . . . . . . . . . . . . . . . . . . . . . . . . . . . . . . 37
APPENDIX A . . . . . . . . . . . . . . . . . . . . . . . . . . . . . . . . . . . . . . . . . . . . . . . . . . . 39
REFERENCES . . . . . . . . . . . . . . . . . . . . . . . . . . . . . . . . . . . . . . . . . . . . . . . . . . . 43

TABLES AND FIGURES
TABLES1. TRIO funding, number of grants, number served, average grant
award, amount per person served, and average number served: 2000. . . . 22. TRIO funding levels in constant 2000 dollars (millions) . . . . . . . . . . . . . 33. Number of Talent Search projects and projects reporting performance
information, by type of host institution: 1999-2000 . . . . . . . . . . . . . . . . . 34. Number of Talent Search projects and participants and percentage
reporting performance information, by federal region: 1999-2000 . . . . . 45. Participant distribution by eligibility status and type of host institution:
1999-2000 . . . . . . . . . . . . . . . . . . . . . . . . . . . . . . . . . . . . . . . . . . . . . . . . 76. Participant distribution by race and ethnicity and type of host
institution: 1999-2000 . . . . . . . . . . . . . . . . . . . . . . . . . . . . . . . . . . . . . . . 97. Participant distribution by age and type of host institution:
1999-2000 . . . . . . . . . . . . . . . . . . . . . . . . . . . . . . . . . . . . . . . . . . . . . . . . 108. Participant distribution by grade level and type of host institution:
1999-2000 . . . . . . . . . . . . . . . . . . . . . . . . . . . . . . . . . . . . . . . . . . . . . . . . 119. Estimate of eligible students served by Talent Search, by state:
1999-2000 . . . . . . . . . . . . . . . . . . . . . . . . . . . . . . . . . . . . . . . . . . . . . . . . 1510. Percentage of students eligible for the federal free lunch program
in Talent Search target schools, all other secondary schools, and all secondary schools, by state: 1999-2000 . . . . . . . . . . . . . . . . . . . . . . . . . . 16
11. Average pupil-teacher ratios for Talent Search target schools, all othersecondary schools, and all secondary schools, by state: 1999-2000 . . . . . . 18
12. Percentage of projects offering services to participants, by grade level: 1999-2000 . . . . . . . . . . . . . . . . . . . . . . . . . . . . . . . . . . . . . . . . . . . . . . . . 19
13. Comparison of percentage of projects offering different types of services to participants: 1998-99 and 1999-2000 . . . . . . . . . . . . . . . . . . . 20
14. Percentage of projects offering multiple services to participants, by grade level: 1999-2000. . . . . . . . . . . . . . . . . . . . . . . . . . . . . . . . . . . . . 20
15. Percentage of participants receiving academic support services, average number of sessions per project, and average number of sessions per participant for participants overall: 1999-2000 . . . . . . . . . 22
16. Average number of sessions per project and average number of sessions per participant for middle school participants: 1999-2000 . . . 23
17. Average number of sessions per project and average number of sessions per participant for high school participants: 1999-2000 . . . . . 24
18. Average number of sessions per project and average number of sessions per participant for adult participants: 1999-2000 . . . . . . . . . . 25
19. Percentage of participants receiving personal and career development services for participants overall: 1999-2000 . . . . . . . . . . . . . . . . . . . . . . . 27

20. Percentage of participants receiving each type of service, comparingperformance report data from 1990-91, 1998-99, and 1999-2000 . . . . . . 30
21. Comparison of approved objectives and actual achievements for secondary school outcomes: 1999-2000 . . . . . . . . . . . . . . . . . . . . . . . 32
22. Comparison of approved objectives and actual achievements for assistance in applying for postsecondary admissions and financial aid: 1999-2000 . . . . . . . . . . . . . . . . . . . . . . . . . . . . . . . . . . . . . . 33
23. Comparison of approved objectives and actual achievements for postsecondary outcomes: 1999-2000. . . . . . . . . . . . . . . . . . . . . . . . . . 34
24. Postsecondary placement of participants by sector: 1999-2000 . . . . . . . . 3625. Section and item response rates: 1999-2000. . . . . . . . . . . . . . . . . . . . . . . 38
Appendix TablesA1. Number of Talent Search projects and participants and percentage
reporting performance information, by federal region: 1999-2000 . . . . . 39A2. Participant distribution by eligibility status and federal region:
1999-2000 . . . . . . . . . . . . . . . . . . . . . . . . . . . . . . . . . . . . . . . . . . . . . . . . 39A3. Participant distribution by race and ethnicity and federal region:
1999-2000 . . . . . . . . . . . . . . . . . . . . . . . . . . . . . . . . . . . . . . . . . . . . . . . . 40A4. Participant distribution by grade level and federal region:
1999-2000 . . . . . . . . . . . . . . . . . . . . . . . . . . . . . . . . . . . . . . . . . . . . . . . . 40A5. Percentage of projects providing academic support services,
by federal region: 1999-2000 . . . . . . . . . . . . . . . . . . . . . . . . . . . . . . . . . . 41A6. Percentage of projects providing personal and career development
services, by federal region: 1999-2000 . . . . . . . . . . . . . . . . . . . . . . . . . . . 41
Figures1. Performance report response rates by region: 1999-2000 . . . . . . . . . . . . 42. Participant distribution by type of host institution: 1999-2000 . . . . . . . . 53. Participant distribution by status and type of host institution:
1999-2000 . . . . . . . . . . . . . . . . . . . . . . . . . . . . . . . . . . . . . . . . . . . . . . . . 64. Participant distribution by eligibility status: 1999-2000 . . . . . . . . . . . . . . 75. Participant distribution by race and ethnicity: 1999-2000 . . . . . . . . . . . . 86. Participant distribution by gender and type of host institution:
1999-2000 . . . . . . . . . . . . . . . . . . . . . . . . . . . . . . . . . . . . . . . . . . . . . . . . 97. Participant distribution by age: 1999-2000. . . . . . . . . . . . . . . . . . . . . . . . 108. Participant distribution by grade level: 1999-2000 . . . . . . . . . . . . . . . . . . 119. Average number of target schools per project by type of host institution:
1999-2000 . . . . . . . . . . . . . . . . . . . . . . . . . . . . . . . . . . . . . . . . . . . . . . . . 1310. Percentage of middle school participants receiving academic support
services: 1999-2000 . . . . . . . . . . . . . . . . . . . . . . . . . . . . . . . . . . . . . . . . . 2211. Percentage of high school participants receiving academic support
services: 1999-2000 . . . . . . . . . . . . . . . . . . . . . . . . . . . . . . . . . . . . . . . . . 2412. Percentage of adult participants receiving academic support services:
1999-2000 . . . . . . . . . . . . . . . . . . . . . . . . . . . . . . . . . . . . . . . . . . . . . . . . 25

13. Percentage of middle school participants receiving personal and careerdevelopment services: 1999-2000 . . . . . . . . . . . . . . . . . . . . . . . . . . . . . . . 27
14. Percentage of high school participants receiving personal and careerdevelopment services: 1999-2000 . . . . . . . . . . . . . . . . . . . . . . . . . . . . . . . 28
15. Percentage of adult participants receiving personal and career development services: 1999-2000 . . . . . . . . . . . . . . . . . . . . . . . . . . . . . . . 29
16. Postsecondary placement of Talent Search participants overall:1999-2000 . . . . . . . . . . . . . . . . . . . . . . . . . . . . . . . . . . . . . . . . . . . . . . . . 35
FOREWORD
To help ensure the full success of President Bush’s education initiative, “No Child LeftBehind,” high-quality postsecondary educational opportunities must be available to allstudents. In keeping with this goal, the Federal TRIO Programs provide outreach andsupport programs to help low-income, first-generation college students progressthrough the academic pipeline from middle school to postbaccalaureate programs.
On behalf of the Office of Federal TRIO Programs, I am pleased to present thisreport, A Profile of the Talent Search Program: 1999-2000. The Talent Search Programidentifies and assists youth (between 11 and 27 years of age) from disadvantaged back-grounds who have the potential to succeed in higher education. The program pro-vides academic, career, and financial aid counseling, tutoring, exposure to collegecampuses, and assistance in preparing for college entrance examinations and in com-pleting college admission and financial aid applications. The goal of the program isto increase the number of disadvantaged youth who graduate from high school andcontinue on to postsecondary institutions of their choice.
This report is the second in a series of reports that present a national profile of theTalent Search Program. Individual project reports, under separate cover, summarizespecific information submitted by each Talent Search project and provide aggregateinformation on other Talent Search projects in the same federal region, the sameinstitutional sector, and the nation. The 1999-2000 performance report, submitted bythe Talent Search projects, was the primary data source for both the national profileand individual project reports.
The Office of Federal TRIO Programs is proud to share with you national informa-tion on the Talent Search Program. It is our hope that the collection and dissemina-tion of this information will foster communication aimed at assessing our mission andimplementing measures to see how well we are doing. We look forward to this collab-orative relationship as we work together to improve program services and postsec-ondary enrollment rates for low-income, potential first-generation college students.
Larry OxendineActing DirectorOffice of Federal TRIO Programs
viii

ACKNOWLEDGMENTS
Publishing this report was a team effort and we appreciate the support of all who con-tributed. First, we thank the project staff members of the Talent Search projects whoreported the data upon which the report is based. Computer Business Methods Inc.processed the data files. The Office of Federal TRIO Programs sponsored the reportand Frances Bergeron of the Office of Federal TRIO Programs coordinated thereporting process. Mary Fran Miklitsch designed this report.
ix


HIGHLIGHTS
This report provides a comprehensive profile of the Talent Search Program using the1999-2000 performance report data. Complete performance reports were submittedby 359 of 361 projects (99 percent) serving a total of 328,070 participants. This reportis intended to serve as a resource for the improvement of Talent Search services.
Below are highlights from the following sections: demographics of project partici-pants and target schools, services and activities, and performance outcomes.
Demographics of Project Participants and Target Schools• Fifty-nine percent of Talent Search participants continued from a previous year
and 41 percent were new to the program.
• Seventy-four percent of participants met both the low-income and first gener-ation college eligibility requirements.
• Thirty-five percent of participants were black or African American, 32 percentwere white, 23 percent were Hispanic or Latino, and 10 percent were of otherracial or ethnic backgrounds.
• Thirty percent of all Talent Search participants were attending middle school,65 percent were attending high school, and 5 percent had graduated from highschool or dropped out of high school or college.
• Five percent of participants had limited English proficiency.
• A typical project served about 14 target schools, and 40 percent of the studentswithin Talent Search target schools qualified for the federal free lunch program.
Services and Activities• College orientation activities, test-taking and study skills development, coun-
seling, and academic advising and course selection were the services mostcommonly offered to participants.
• Seventy-seven percent of participants received counseling and 64 percentreceived services related to academic advising and course selection.
• Fifty-seven percent of participants took part in college orientation activities, 34 percent participated in cultural activities, and 20 percent received tutoringservices.
xi
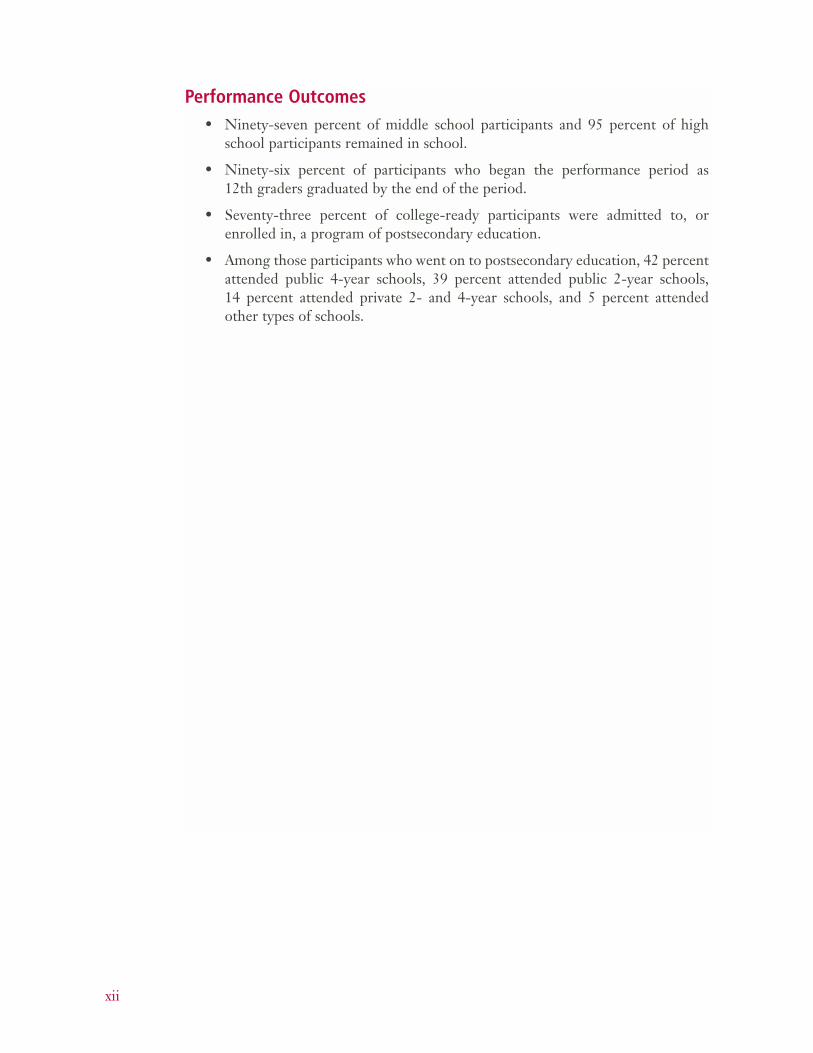
Performance Outcomes• Ninety-seven percent of middle school participants and 95 percent of high
school participants remained in school.
• Ninety-six percent of participants who began the performance period as 12th graders graduated by the end of the period.
• Seventy-three percent of college-ready participants were admitted to, orenrolled in, a program of postsecondary education.
• Among those participants who went on to postsecondary education, 42 percentattended public 4-year schools, 39 percent attended public 2-year schools, 14 percent attended private 2- and 4-year schools, and 5 percent attendedother types of schools.
xii

I. INTRODUCTION
This report is the second in a series addressing Talent Search projects. The report ispresented in two documents. This first piece, the national report, provides feedbackfrom Talent Search projects on the status of Talent Search performance reporting andgives the overall results from all projects reporting. A second, companion documentprovides individual reports, which summarize data from each project.
The purpose of the reports is to share feedback and other information from the per-formance reports that Talent Search projects prepare each year. It is our hope thatTalent Search projects can use this information to plan and improve their own serv-ices, which will increase educational opportunities for low-income and potential first-generation college students.
In both the national and individual project reports, we look at the data by type of hostinstitution—public 4-year, private 4-year, and 2-year postsecondary institutions; andcommunity organizations. In Appendix A, we also present some data by federal region.
Although Talent Search and Educational Opportunity Centers (EOC) projects have simi-lar performance report forms, these programs have different missions, participant charac-teristics, and services. To gather and present performance report information more fully foreach of these programs, we have prepared separate but similar reports for each program.
A. Background
Talent Search projects identify and assist individuals from disadvantaged backgroundswho have the potential to succeed in higher education. The program provides aca-demic, career, and financial aid counseling to its participants and encourages them tograduate from high school and continue on to the postsecondary school of theirchoice. Talent Search also serves high school dropouts by encouraging them to reen-ter the educational system and complete their education.
The U.S. Department of Education funded 361 Talent Search projects in the 1999-2000 program year. Talent Search projects are operated by 2- or 4-year colleges,public or private nonprofit agencies or organizations, or combinations of these spon-sors. In each project, at least two-thirds of the participants must be both low-incomeand potential first-generation college students. Talent Search participants must alsobe 11 to 27 years of age1 or have completed the fifth grade. Services provided byTalent Search projects include: academic, financial, career, and personal counseling;career exploration and aptitude assessment; tutoring; information on postsecondaryeducation; exposure to college campuses; information on financial aid; assistance in
1
1 Projects may serve clients age 28 or older if no Educational OpportunityCenter is available to serve them and doing so will not dilute the services they pro-vide to the main target group.
completing college admissions and financial aid applications; preparation for collegeentrance exams; mentoring; and workshops for participants’ parents.
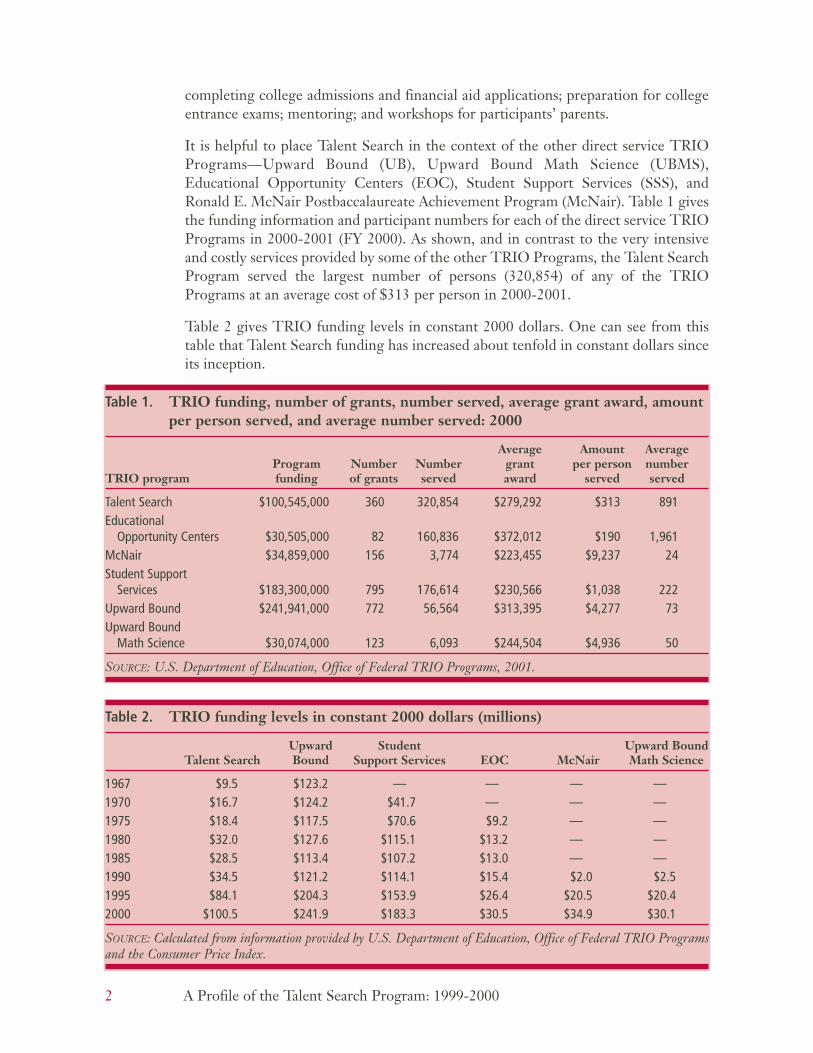
It is helpful to place Talent Search in the context of the other direct service TRIOPrograms—Upward Bound (UB), Upward Bound Math Science (UBMS),Educational Opportunity Centers (EOC), Student Support Services (SSS), andRonald E. McNair Postbaccalaureate Achievement Program (McNair). Table 1 givesthe funding information and participant numbers for each of the direct service TRIOPrograms in 2000-2001 (FY 2000). As shown, and in contrast to the very intensiveand costly services provided by some of the other TRIO Programs, the Talent SearchProgram served the largest number of persons (320,854) of any of the TRIOPrograms at an average cost of $313 per person in 2000-2001.
Table 2 gives TRIO funding levels in constant 2000 dollars. One can see from thistable that Talent Search funding has increased about tenfold in constant dollars sinceits inception.
2 A Profile of the Talent Search Program: 1999-2000
Table 1. TRIO funding, number of grants, number served, average grant award, amountper person served, and average number served: 2000
Average Amount AverageProgram Number Number grant per person number
TRIO program funding of grants served award served served
Talent Search $100,545,000 360 320,854 $279,292 $313 891Educational
Opportunity Centers $30,505,000 82 160,836 $372,012 $190 1,961McNair $34,859,000 156 3,774 $223,455 $9,237 24Student Support
Services $183,300,000 795 176,614 $230,566 $1,038 222Upward Bound $241,941,000 772 56,564 $313,395 $4,277 73Upward Bound
Math Science $30,074,000 123 6,093 $244,504 $4,936 50
SOURCE: U.S. Department of Education, Office of Federal TRIO Programs, 2001.
Table 2. TRIO funding levels in constant 2000 dollars (millions)
Upward Student Upward BoundTalent Search Bound Support Services EOC McNair Math Science
1967 $9.5 $123.2 — — — —1970 $16.7 $124.2 $41.7 — — —1975 $18.4 $117.5 $70.6 $9.2 — —1980 $32.0 $127.6 $115.1 $13.2 — —1985 $28.5 $113.4 $107.2 $13.0 — —1990 $34.5 $121.2 $114.1 $15.4 $2.0 $2.51995 $84.1 $204.3 $153.9 $26.4 $20.5 $20.42000 $100.5 $241.9 $183.3 $30.5 $34.9 $30.1
SOURCE: Calculated from information provided by U.S. Department of Education, Office of Federal TRIO Programsand the Consumer Price Index.
B. Performance report response
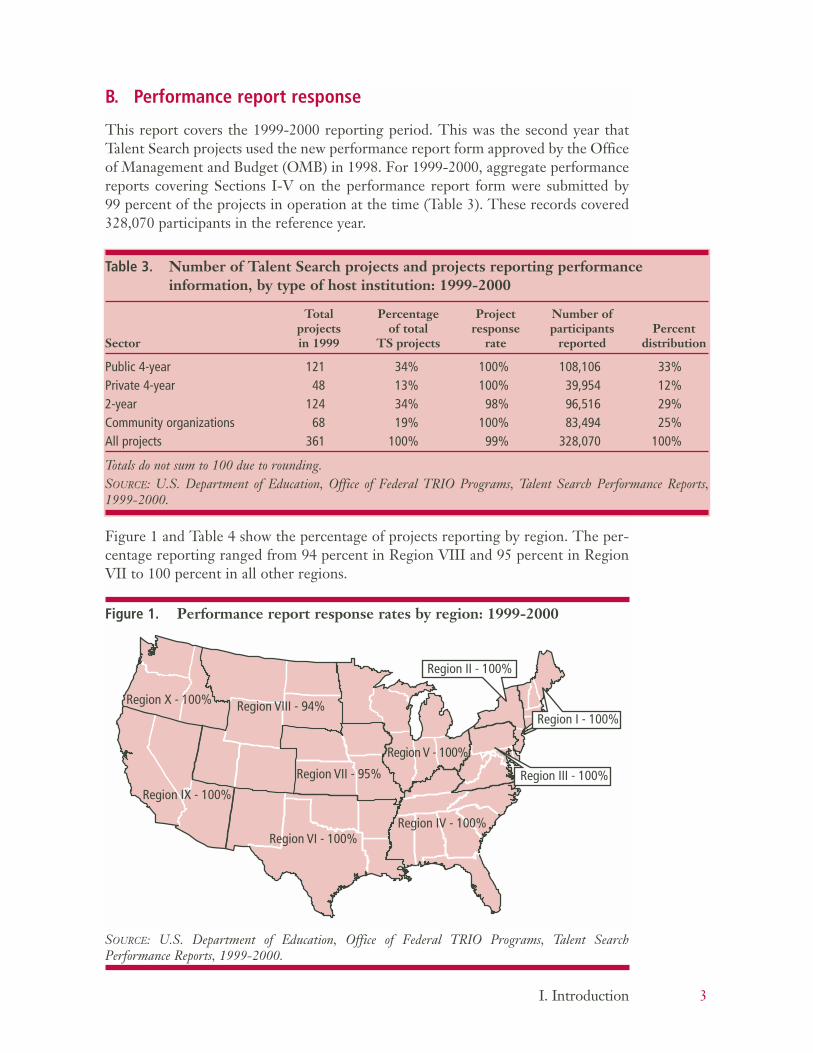
This report covers the 1999-2000 reporting period. This was the second year thatTalent Search projects used the new performance report form approved by the Officeof Management and Budget (OMB) in 1998. For 1999-2000, aggregate performancereports covering Sections I-V on the performance report form were submitted by 99 percent of the projects in operation at the time (Table 3). These records covered328,070 participants in the reference year.
Figure 1 and Table 4 show the percentage of projects reporting by region. The per-centage reporting ranged from 94 percent in Region VIII and 95 percent in RegionVII to 100 percent in all other regions.
I. Introduction 3
Table 3. Number of Talent Search projects and projects reporting performanceinformation, by type of host institution: 1999-2000
Total Percentage Project Number ofprojects of total response participants Percent
Sector in 1999 TS projects rate reported distribution
Public 4-year 121 34% 100% 108,106 33%Private 4-year 48 13% 100% 39,954 12%2-year 124 34% 98% 96,516 29%Community organizations 68 19% 100% 83,494 25%All projects 361 100% 99% 328,070 100%
Totals do not sum to 100 due to rounding.SOURCE: U.S. Department of Education, Office of Federal TRIO Programs, Talent Search Performance Reports,1999-2000.
Figure 1. Performance report response rates by region: 1999-2000
SOURCE: U.S. Department of Education, Office of Federal TRIO Programs, Talent SearchPerformance Reports, 1999-2000.
Region X - 100% Region VIII - 94%
Region VII - 95%
Region V - 100%
Region IX - 100%
Region VI - 100%Region IV - 100%
Region II - 100%
Region III - 100%
Region I - 100%

C. Comparison of response rates: 1998-99 and 1999-2000
For the 1999-2000 project year, all but two Talent Search projects (99 percent) sub-mitted performance reports using the new OMB approved form. For 1998-99, sixTalent Search projects did not submit a performance report and another six used aprevious version of the report form. Complete demographic data were provided on307,451 participants in 1998-99 and 328,070 in 1999-2000.
D. Structure of the report
The rest of this report is organized according to the structure of the performancereport. Chapter II presents a demographic profile of Talent Search participants andtarget schools. Chapter III discusses the provision of project services. Chapter IVprovides an analysis of performance outcomes, and Chapter V discusses data issues aswell as plans for future years.
4 A Profile of the Talent Search Program: 1999-2000
Table 4. Number of Talent Search projects and participants and percentage reportingperformance information, by federal region: 1999-2000
Total Number ofprojects Project Number of projects Response
Federal region in 1999 distribution participants reporting rate
Region I (Boston) 14 4% 12,255 14 100%Region II (New York) 33 9% 32,114 33 100%Region III (Philadelphia) 35 10% 43,521 35 100%Region IV (Atlanta) 88 24% 74,486 88 100%Region V (Chicago) 55 15% 42,556 55 100%Region VI (Dallas) 48 13% 44,650 48 100%Region VII (Kansas City) 20 6% 15,940 19 95%Region VIII (Denver) 18 5% 15,156 17 94%Region IX (San Francisco) 38 11% 38,956 38 100%Region X (Seattle) 12 3% 8,436 12 100%Total for nation 361 100% 328,070 359 99%
SOURCE: U.S. Department of Education, Office of Federal TRIO Programs, Talent Search Performance Reports,1999-2000.

II. DEMOGRAPHICS
This section summarizes the demographic information that was reported on the1999-2000 Talent Search performance reports. Statistics are given for Talent Searchprojects as a whole, as well as projects grouped by type of host institution, defined as4-year public colleges and universities, 4-year private colleges and universities, 2-yearcolleges, and community organizations.
A. Number of participants assisted
A total of 359 Talent Search projects reported serving 328,070 participants overall, oran average of 914 participants per project. As Figure 2 shows, 33 percent of participantswere served by projects based in public 4-year colleges and universities and 12 percentin private 4-year colleges and universities. Two-year institutions served 29 percent ofparticipants and community organizations hosted 25 percent of all participants.
Fifty-nine percent of all participants in 1999-2000 continued from a previous year,and 41 percent joined Talent Search for the first time (Figure 3). According to theinstructions accompanying the performance report, a new participant is one served bythe project for the first time during the current reporting period. A continuing par-ticipant is one who was served by the project for the first time in another reportingperiod and who received project services during this reporting period.
Community organizations had a much higher proportion of new participants (58 per-cent) than did public 4-year institutions (35 percent), private 4-year institutions (34 percent), or 2-year institutions (34 percent).
5
Figure 2. Participant distribution by type of host institution: 1999-2000
Totals do not sum to 100 due to rounding.SOURCE: U.S. Department of Education, Office of Federal TRIO Programs, Talent SearchPerformance Reports, 1999-2000.
Public4-year33%
Private 4-year12%
2-year 29%
Community organizations
25%

6 A Profile of the Talent Search Program: 1999-2000
Overall, the 1999-2000 program year data present a shift from the 1998-99 programyear, when there was a fairly even split between new and continuing participants (52 percent and 48 percent, respectively).
B. Participant distribution by eligibility
Talent Search projects overall exceeded the requirement that two-thirds of their par-ticipants be both low-income2 and potential first-generation college students.3
Seventy-four percent of the participants during the 1999-2000 reporting period metboth criteria (Figure 4). Twenty-one percent were either low-income or potentialfirst-generation students. Five percent had other needs. The distributions of partici-pants by eligibility status were consistent across the four sectors (Table 5).
Figure 3. Participant distribution by status and type of host institution:1999-2000
SOURCE: U.S. Department of Education, Office of Federal TRIO Programs, Talent SearchPerformance Reports, 1999-2000.
Public 4-year
Private 4-year
2-year Community orgs.
All projects
100%
80
60
40
20
0
Continuing participants
New participants
59% 41%65%
35%66% 34%
66% 34%
42% 58%
2 A low-income participant is one whose family’s taxable income was less than 150 percent of the poverty level amount. The U.S. Department of Commerce,Bureau of the Census, sets guidelines to determine the definition of poverty level.
3 A potential first-generation college student is one whose parents or guardiansdid not receive a baccalaureate degree.

II. Demographics 7
C. Participant distribution by race and ethnicity
Thirty-five percent of all Talent Search participants were black or African American,32 percent were white, and 23 percent were Hispanic or Latino. Asians and AmericanIndians/Alaska Natives each made up 4 percent of the Talent Search participant pop-ulation. One percent of participants were natives of Hawaii or other Pacific islandsand another 1 percent were from a multi-ethnic background (Figure 5). The 1999-2000 distribution is almost identical to the racial and ethnic composition of partici-pants from the 1998-99 program year.
Figure 4. Participant distribution by eligibility status: 1999-2000
SOURCE: U.S. Department of Education, Office of Federal TRIO Programs, Talent SearchPerformance Reports, 1999-2000.
Low-income and first generation
74%
Low-incomeonly 7%
First generation only 14%
Other 5%
Table 5. Participant distribution by eligibility status and type of host institution: 1999-2000
Low-income Low-income First generation Sector and first generation only only Other
Public 4-year 75% 7% 13% 5%Private 4-year 73% 7% 15% 5%2-year 73% 5% 16% 5%Community organizations 73% 8% 13% 6%All projects 74% 7% 14% 5%
Totals do not sum to 100 due to rounding.SOURCE: U.S. Department of Education, Office of Federal TRIO Programs, Talent Search Performance Reports,1999-2000.

8 A Profile of the Talent Search Program: 1999-2000
The racial and ethnic composition of projects in program year 1999-2000 differedsomewhat among the four sectors. For example, a higher proportion of black orAfrican American participants (46 percent) were served by projects hosted by private4-year colleges than by projects overall (35 percent). In contrast, a higher proportionof Hispanic or Latino participants (38 percent) were served by projects hosted bycommunity organizations than by projects overall (23 percent). This distributionamong sectors is similar to the 1998-99 distribution. Complete results are providedin Table 6.
Figure 5. Participant distribution by race and ethnicity: 1999-2000
SOURCE: U.S. Department of Education, Office of Federal TRIO Programs, Talent SearchPerformance Reports, 1999-2000.
American Indian or Alaska Native
4%Asian4%
Black or African
American35%
Hispanic or Latino
23%
White 32%
Native Hawaiian orother Pacific
Islander1%
More thanone racereported
1%

II. Demographics 9
D. Participant distribution by gender
Consistent with the pattern for other TRIO Programs, Talent Search served morewomen than men. Sixty percent of Talent Search participants in 1999-2000 werefemale and 40 percent were male. As Figure 6 shows, the proportions varied littleacross the sectors.
Table 6. Participant distribution by race and ethnicity and type of host institution: 1999-2000
NativeAmerican Hawaiian More
Indian Black or other than oneor Alaska or African Hispanic Pacific race
Sector Native Asian American or Latino White Islander reported
Public 4-year 4% 3% 37% 20% 32% 1% 2%Private 4-year 1% 2% 46% 20% 29% 0% 1%2-year 4% 3% 33% 13% 44% 2% 1%Community organizations 5% 6% 30% 38% 18% 1% 2%All projects 4% 4% 35% 23% 32% 1% 1%
Totals to do not sum to 100 due to rounding.SOURCE: U.S. Department of Education, Office of Federal TRIO Programs, Talent Search Performance Reports,1999-2000.
Figure 6. Participant distribution by gender and type of host institution:1999-2000
SOURCE: U.S. Department of Education, Office of Federal TRIO Programs, Talent SearchPerformance Reports, 1999-2000.
61% 39%
62% 38%
61% 39%
59% 41%
60% 40%
0 20 40 60 80 100%
Female Male
Public 4-year
Private 4-year
2-year
Communityorganizations
All projects

10 A Profile of the Talent Search Program: 1999-2000
E. Participant distribution by age
Sixty-eight percent of Talent Search participants in program year 1999-2000 were 14-18 years of age (Figure 7). While recent years have seen increased program devel-opment for middle school students, almost three-fourths of Talent Search partici-pants remain in the age groups over 14, the same proportion as in 1998-99. The sametrend emerges when percentages are broken down by sector (Table 7).
Figure 7. Participant distribution by age: 1999-2000
SOURCE: U.S. Department of Education, Office of Federal TRIO Programs, Talent SearchPerformance Reports, 1999-2000.
Age 28 and above
1%
Age11-1325%
Age 14-18 68%
Age 19-27 5%
Table 7. Participant distribution by age and type of host institution: 1999-2000
Sector 11-13 14-18 19-27 28 and above
Public 4-year 25% 70% 4% 1%Private 4-year 33% 65% 2% 0%2-year 28% 68% 3% 1%Community organizations 20% 69% 10% 1%All projects 25% 68% 5% 1%
SOURCE: U.S. Department of Education, Office of Federal TRIO Programs, Talent Search Performance Reports,1999-2000.

II. Demographics 11
F. Participant distribution by grade level
Sixty-five percent of Talent Search participants were in grades 9-12 at the beginningof the 1999-2000 reporting period and 30 percent of participants were in grades 6-8(Figure 8). Two percent had dropped out of high school, 2 percent had graduated orreceived the GED, and 1 percent had dropped out of postsecondary school.
The distribution across grades was similar for projects hosted by 4-year and 2-yearinstitutions. However, community organizations less frequently served middle schoolparticipants and more frequently served 12th graders (Table 8).
Figure 8. Participant distribution by grade level: 1999-2000
SOURCE: U.S. Department of Education, Office of Federal TRIO Programs, Talent SearchPerformance Reports, 1999-2000
0% 10% 20% 30% 40% 50%
Postsecondary dropout
High school (or GED) graduate
Secondary school dropout
12th grade only
9th-11th grade
6th-8th grade
1%
2%
2%
22%
43%
30%
Table 8. Participant distribution by grade level and type of host institution: 1999-2000
Secondary High school Post-6th-8th 9th-11th 12th grade school (GED) secondary
Sector grades grades only dropout graduate dropout
Public 4-year 30% 46% 20% 2% 2% 1%Private 4-year 37% 43% 17% 2% 1% 0%2-year 33% 46% 17% 2% 1% 0%Community organizations 22% 38% 32% 2% 4% 1%All projects 30% 43% 22% 2% 2% 1%
Totals to do not sum to 100 due to rounding.SOURCE: U.S. Department of Education, Office of Federal TRIO Programs, Talent Search Performance Reports,1999-2000.

12 A Profile of the Talent Search Program: 1999-2000
G. Veterans served
In 1999-2000, the percentage of Talent Search participants who were veterans wasvery small, less than 1 percent (not shown in tables). Slightly more than 100 veteransparticipated in Talent Search.
H. Participants of limited English proficiency
Five percent of Talent Search participants had limited English proficiency (not shownin tables). A person of limited English proficiency is defined as one whose native lan-guage is not English and who has sufficient difficulty speaking, reading, writing, orunderstanding English to prevent that person from learning successfully in class-rooms in which English is the language of instruction. In 1999-2000, 6 percent of the students served by projects based in 4-year public schools had limit-ed English proficiency. Five percent of students served by 4-year private schools, 6 percent of students served by 2-year schools, and 4 percent of students served bycommunity organizations had limited English proficiency.
I. Target schools
Talent Search projects served, on average,4 14 target schools. Target schools, by def-inition, are secondary schools (middle and high schools) designated by the grantee asa focus of project services. Projects based in public 4-year institutions generally servedthe largest number of target schools, 16 schools per project (Figure 9). Projects basedin 2-year institutions served 13 target schools and those based in private 4-yearinstitutions and community organizations served 12 target schools.
Of the 361 Talent Search projects funded in 1999-2000, 322 submitted a list of tar-get schools (89 percent) compared to 341 projects (94 percent) submitting a list of tar-get schools for 1998-99 program year. These projects reported serving a total of5,032 schools in 1999-2000 compared to 5,105 target schools in 1998-99.
The only information obtained from the performance report data about a targetschool is its name and location (city, state, and zip code). In an effort to obtain morein-depth knowledge of the characteristics of Talent Search target schools, we mergedthe target school names from the performance reports with school names in theCommon Core of Data (CCD). The CCD is a comprehensive database of elemen-tary and secondary schools across the nation. The data are collected by the U.S.Department of Education, updated on an annual basis, and provide basic descriptiveinformation about public schools in the United States. Data are provided at both theschool and district levels.
4 The average refers to the median in this case. The mean number of targetschools served was 16.

II. Demographics 13
Matches to the CCD were found for 95 percent of the 5,032 target schools listed inthe performance report. Errors in the names or locations of schools as provided in theperformance reports may have contributed to the lack of a match for some schools.
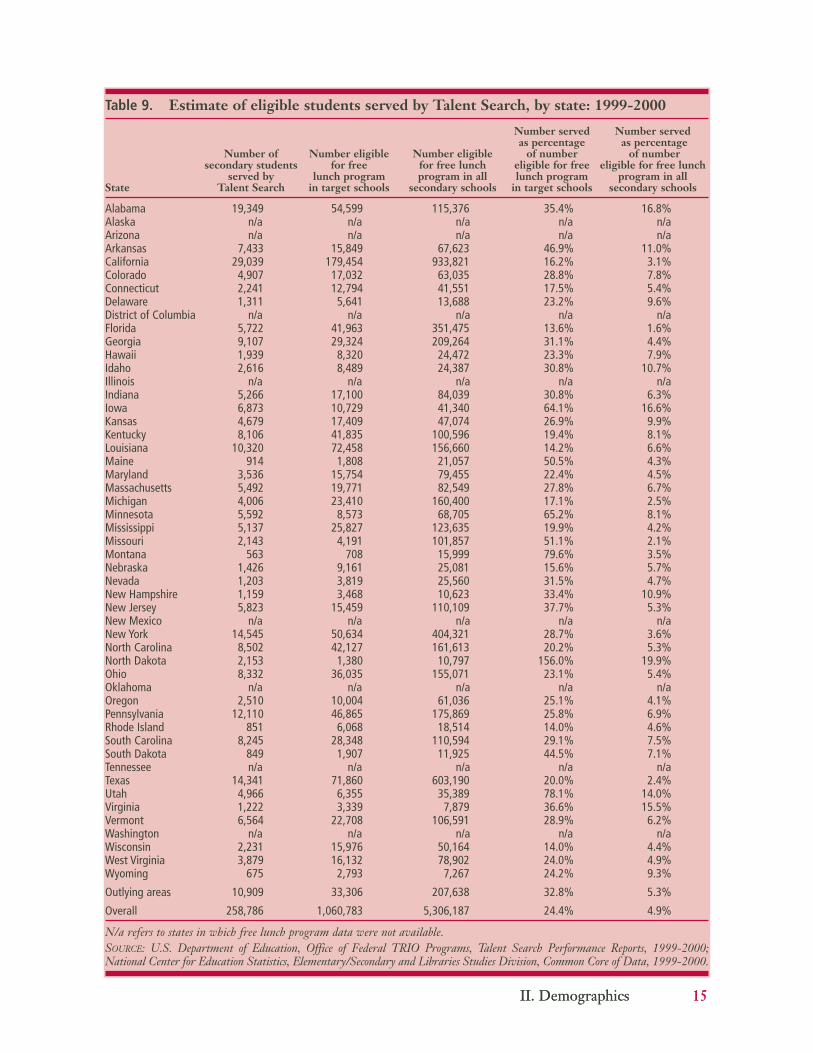
One issue that the merge with the CCD allowed us to examine was the extent towhich eligible students in the target schools were served by the Talent SearchProgram. A proxy measure of the number eligible for Talent Search is the number eli-gible for the federal free lunch program. This measure is not the same as the TalentSearch eligibility criterion, but it does give an indication of the proportion of eco-nomically disadvantaged students who were served. To be eligible for the free lunchprogram, family income must not exceed 130 percent of the poverty level. Overallestimates show that in 1999-2000 Talent Search served about 24 percent of the esti-mated number of students eligible for the free lunch program in the target schools.5
State-by-state results, provided in Table 9, also show that this estimate varied a great
Figure 9. Number of target schools per project by type of host institution:1999-2000
SOURCE: U.S. Department of Education, Office of Federal TRIO Programs, Talent SearchPerformance Reports, 1999-2000.
Public 4-year
Private 4-year
2-year Community orgs.
Allprojects
20
18
16
14
12
10
8
6
4
2
0
16
1213
12
14
5 The percentages were calculated by dividing the total number of participantsin Talent Search in a given state by the total number of students eligible for the freelunch program in the target schools in that state. Although all participants in TalentSearch may not be eligible for free lunch, the calculation includes all Talent Searchsecondary school participants.

14 A Profile of the Talent Search Program: 1999-2000
deal across states. Wisconsin, for example, served 14 percent of the “eligible popula-tion” while North Dakota served over 100 percent.6
Table 9 also presents the number of secondary school students7 served by TalentSearch as a percentage of free-lunch-eligible students in all secondary schools, notjust the target schools. Secondary schools were defined as schools serving students ingrade 7 or higher.8 We limited our analysis to secondary schools because the TalentSearch Program regulations require participants to be in grade 6 or higher. Overall,Talent Search projects served 4.9 percent of the students eligible for the free lunchprogram in secondary schools in the U.S. and outlying areas.
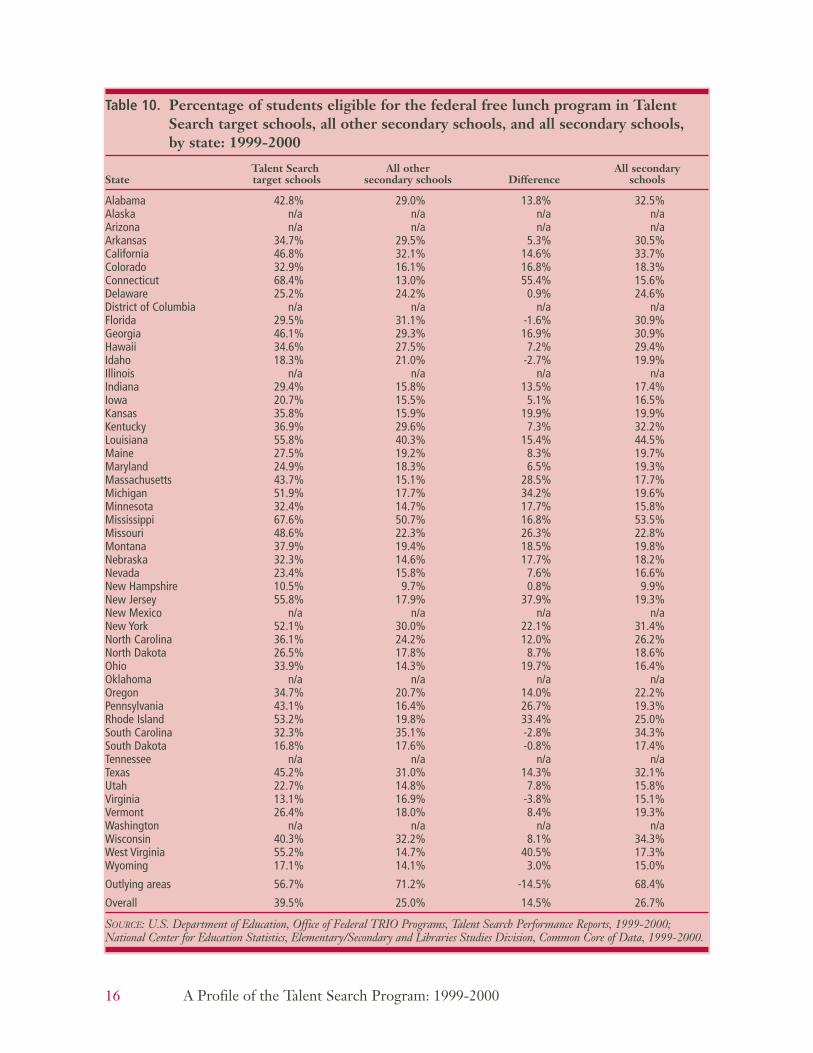
The second issue we considered was the difference in demographic characteristicsbetween target schools and all other schools. We selected two variables from theCCD for this analysis: the percentage of free-lunch-eligible students in a given schooland the ratio of pupils to full-time-equivalent teachers, or the pupil-teacher ratio. InTable 10, we present the data on free lunch status. The second column indicates theaverage percentage of free-lunch-eligible students for the Talent Search targetschools in that state.9 The third column provides the percentage of free-lunch-eligi-ble students for all other secondary schools in that state.10 The fourth column is thedifference between the percentages for Talent Search target schools and for all othersecondary schools.11 The last column provides the percentages for all secondary
6 There are several possible reasons why some states exceeded 100 percent (i.e.the number of participants served was greater than the number of free-lunch-eligible students). First, the income guidelines for participation in Talent Search and partici-pation in the federal free lunch program differ somewhat. For Talent Search, a par-ticipant’s household income must not exceed 150 percent of the poverty level. Toqualify for the free lunch program, income must not exceed 130 percent. In addition,Talent Search requires that only two-thirds of the participants meet both the low-income and first generation eligibility requirements. The remaining one-third neednot meet either of those criteria.
7 Only secondary school students in states with free lunch data were included.8 Schools that served grades 5 and 6 only were also included.9 Percentages were calculated by dividing the total number of students eligible
for free lunch in target schools by the total enrollment in target schools.10 Percentages were calculated by dividing the number of students eligible for
free lunch in all secondary schools that were not targeted by Talent Search by the totalenrollment in those schools.
11 To calculate the difference, we subtracted the value in column 3 (percentagesof free-lunch-eligible students in all other schools) from the value in column 2 (per-centages of free-lunch-eligible students in the target schools).
II. Demographics 15II. Demographics 15
Table 9. Estimate of eligible students served by Talent Search, by state: 1999-2000
Number served Number servedas percentage as percentage
Number of Number eligible Number eligible of number of numbersecondary students for free for free lunch eligible for free eligible for free lunch
served by lunch program program in all lunch program program in allState Talent Search in target schools secondary schools in target schools secondary schools
Alabama 19,349 54,599 115,376 35.4% 16.8%Alaska n/a n/a n/a n/a n/aArizona n/a n/a n/a n/a n/aArkansas 7,433 15,849 67,623 46.9% 11.0%California 29,039 179,454 933,821 16.2% 3.1%Colorado 4,907 17,032 63,035 28.8% 7.8%Connecticut 2,241 12,794 41,551 17.5% 5.4%Delaware 1,311 5,641 13,688 23.2% 9.6%District of Columbia n/a n/a n/a n/a n/aFlorida 5,722 41,963 351,475 13.6% 1.6%Georgia 9,107 29,324 209,264 31.1% 4.4%Hawaii 1,939 8,320 24,472 23.3% 7.9%Idaho 2,616 8,489 24,387 30.8% 10.7%Illinois n/a n/a n/a n/a n/aIndiana 5,266 17,100 84,039 30.8% 6.3%Iowa 6,873 10,729 41,340 64.1% 16.6%Kansas 4,679 17,409 47,074 26.9% 9.9%Kentucky 8,106 41,835 100,596 19.4% 8.1%Louisiana 10,320 72,458 156,660 14.2% 6.6%Maine 914 1,808 21,057 50.5% 4.3%Maryland 3,536 15,754 79,455 22.4% 4.5%Massachusetts 5,492 19,771 82,549 27.8% 6.7%Michigan 4,006 23,410 160,400 17.1% 2.5%Minnesota 5,592 8,573 68,705 65.2% 8.1%Mississippi 5,137 25,827 123,635 19.9% 4.2%Missouri 2,143 4,191 101,857 51.1% 2.1%Montana 563 708 15,999 79.6% 3.5%Nebraska 1,426 9,161 25,081 15.6% 5.7%Nevada 1,203 3,819 25,560 31.5% 4.7%New Hampshire 1,159 3,468 10,623 33.4% 10.9%New Jersey 5,823 15,459 110,109 37.7% 5.3%New Mexico n/a n/a n/a n/a n/aNew York 14,545 50,634 404,321 28.7% 3.6%North Carolina 8,502 42,127 161,613 20.2% 5.3%North Dakota 2,153 1,380 10,797 156.0% 19.9%Ohio 8,332 36,035 155,071 23.1% 5.4%Oklahoma n/a n/a n/a n/a n/aOregon 2,510 10,004 61,036 25.1% 4.1%Pennsylvania 12,110 46,865 175,869 25.8% 6.9%Rhode Island 851 6,068 18,514 14.0% 4.6%South Carolina 8,245 28,348 110,594 29.1% 7.5%South Dakota 849 1,907 11,925 44.5% 7.1%Tennessee n/a n/a n/a n/a n/aTexas 14,341 71,860 603,190 20.0% 2.4%Utah 4,966 6,355 35,389 78.1% 14.0%Virginia 1,222 3,339 7,879 36.6% 15.5%Vermont 6,564 22,708 106,591 28.9% 6.2%Washington n/a n/a n/a n/a n/aWisconsin 2,231 15,976 50,164 14.0% 4.4%West Virginia 3,879 16,132 78,902 24.0% 4.9%Wyoming 675 2,793 7,267 24.2% 9.3%
Outlying areas 10,909 33,306 207,638 32.8% 5.3%
Overall 258,786 1,060,783 5,306,187 24.4% 4.9%
N/a refers to states in which free lunch program data were not available.SOURCE: U.S. Department of Education, Office of Federal TRIO Programs, Talent Search Performance Reports, 1999-2000;National Center for Education Statistics, Elementary/Secondary and Libraries Studies Division, Common Core of Data, 1999-2000.
16 A Profile of the Talent Search Program: 1999-2000
Table 10. Percentage of students eligible for the federal free lunch program in TalentSearch target schools, all other secondary schools, and all secondary schools, by state: 1999-2000
Talent Search All other All secondaryState target schools secondary schools Difference schools
Alabama 42.8% 29.0% 13.8% 32.5%Alaska n/a n/a n/a n/aArizona n/a n/a n/a n/aArkansas 34.7% 29.5% 5.3% 30.5%California 46.8% 32.1% 14.6% 33.7%Colorado 32.9% 16.1% 16.8% 18.3%Connecticut 68.4% 13.0% 55.4% 15.6%Delaware 25.2% 24.2% 0.9% 24.6%District of Columbia n/a n/a n/a n/aFlorida 29.5% 31.1% -1.6% 30.9%Georgia 46.1% 29.3% 16.9% 30.9%Hawaii 34.6% 27.5% 7.2% 29.4%Idaho 18.3% 21.0% -2.7% 19.9%Illinois n/a n/a n/a n/aIndiana 29.4% 15.8% 13.5% 17.4%Iowa 20.7% 15.5% 5.1% 16.5%Kansas 35.8% 15.9% 19.9% 19.9%Kentucky 36.9% 29.6% 7.3% 32.2%Louisiana 55.8% 40.3% 15.4% 44.5%Maine 27.5% 19.2% 8.3% 19.7%Maryland 24.9% 18.3% 6.5% 19.3%Massachusetts 43.7% 15.1% 28.5% 17.7%Michigan 51.9% 17.7% 34.2% 19.6%Minnesota 32.4% 14.7% 17.7% 15.8%Mississippi 67.6% 50.7% 16.8% 53.5%Missouri 48.6% 22.3% 26.3% 22.8%Montana 37.9% 19.4% 18.5% 19.8%Nebraska 32.3% 14.6% 17.7% 18.2%Nevada 23.4% 15.8% 7.6% 16.6%New Hampshire 10.5% 9.7% 0.8% 9.9%New Jersey 55.8% 17.9% 37.9% 19.3%New Mexico n/a n/a n/a n/aNew York 52.1% 30.0% 22.1% 31.4%North Carolina 36.1% 24.2% 12.0% 26.2%North Dakota 26.5% 17.8% 8.7% 18.6%Ohio 33.9% 14.3% 19.7% 16.4%Oklahoma n/a n/a n/a n/aOregon 34.7% 20.7% 14.0% 22.2%Pennsylvania 43.1% 16.4% 26.7% 19.3%Rhode Island 53.2% 19.8% 33.4% 25.0%South Carolina 32.3% 35.1% -2.8% 34.3%South Dakota 16.8% 17.6% -0.8% 17.4%Tennessee n/a n/a n/a n/aTexas 45.2% 31.0% 14.3% 32.1%Utah 22.7% 14.8% 7.8% 15.8%Virginia 13.1% 16.9% -3.8% 15.1%Vermont 26.4% 18.0% 8.4% 19.3%Washington n/a n/a n/a n/aWisconsin 40.3% 32.2% 8.1% 34.3%West Virginia 55.2% 14.7% 40.5% 17.3%Wyoming 17.1% 14.1% 3.0% 15.0%
Outlying areas 56.7% 71.2% -14.5% 68.4%
Overall 39.5% 25.0% 14.5% 26.7%
SOURCE: U.S. Department of Education, Office of Federal TRIO Programs, Talent Search Performance Reports, 1999-2000;National Center for Education Statistics, Elementary/Secondary and Libraries Studies Division, Common Core of Data, 1999-2000.

II. Demographics 17
schools, regardless or whether or not they are Talent Search target schools.12 Table11 provides information in a similar manner for the pupil-teacher ratio.
Forty percent of students in grades 6 to 12 in the Talent Search target schools wereeligible to receive free lunch. This is about 15 percentage points higher than for allother secondary schools. Pupil-teacher ratios, however, differed very little betweentarget schools and all other schools when averaged across the U.S. and outlying areas.The average class size in a Talent Search target school was about 16 students.
12 Percentages were calculated by dividing the total number of secondary schoolstudents eligible for free lunch in a given state by total enrollment in secondaryschools in that state.

18 A Profile of the Talent Search Program: 1999-2000
Table 11. Average pupil-teacher ratios for Talent Search target schools, all othersecondary schools, and all secondary schools, by state: 1999-2000
Talent Search All other All secondaryState target schools secondary schools Difference schools
Alabama 16.2 15.5 0.7 15.7Alaska 17.5 17.1 0.4 17.1Arizona 18.0 18.0 0.0 18.0Arkansas 12.0 13.4 -1.4 13.0California 22.5 21.3 1.1 21.4Colorado 15.6 17.3 -1.7 17.0Connecticut 14.2 13.4 0.8 13.4Delaware 15.3 14.0 1.3 14.4District of Columbia 14.0 14.2 -0.2 13.9Florida 18.3 17.3 1.0 17.4Georgia 16.2 16.5 -0.3 16.5Hawaii 16.4 16.6 -0.3 16.5Idaho 17.0 14.5 2.5 15.1Illinois 16.2 15.8 0.4 15.8Indiana 17.2 16.7 0.5 16.8Iowa 14.1 13.5 0.6 13.6Kansas 14.1 13.1 1.0 13.2Kentucky 16.0 17.8 -1.8 17.2Louisiana 15.6 14.7 0.9 14.8Maine 14.2 13.4 0.8 13.4Maryland 17.3 15.8 1.5 16.0Massachusetts n/a n/a n/a n/aMichigan 16.2 18.0 -1.7 17.9Minnesota 14.2 15.4 -1.1 15.3Mississippi 16.4 16.4 0.0 16.4Missouri 11.9 13.5 -1.6 13.5Montana 13.3 12.0 1.4 12.0Nebraska 14.0 11.6 2.4 11.7Nevada 21.7 20.0 1.7 20.1New Hampshire 13.6 13.8 -0.2 13.8New Mexico 15.1 15.2 -0.1 15.1New York 16.9 15.2 1.7 15.3North Carolina 14.4 13.6 0.8 13.7North Dakota 10.4 12.6 -2.2 12.4Ohio 16.4 17.3 -0.9 17.2Oklahoma 13.4 14.4 -1.0 14.2Oregon 18.7 18.1 0.6 18.1Pennsylvania 17.0 16.6 0.5 16.6Rhode Island 13.8 13.3 0.5 13.4South Carolina 14.8 15.7 -0.9 15.5South Dakota 16.2 12.1 4.1 12.2Tennessee n/a n/a n/a n/aTexas 13.6 13.3 0.3 13.3Utah 17.8 19.1 -1.3 18.9Virginia 12.3 12.5 -0.2 12.4Vermont n/a n/a n/a n/aWashington 19.6 20.1 -0.6 20.1Wisconsin 14.2 14.0 0.2 14.0West Virginia 16.3 15.2 1.1 15.2Wyoming 13.7 11.4 2.3 11.7
Outlying areas 17.9 19.6 -1.7 19.2
Overall 16.2 15.5 0.7 15.7
SOURCE: U.S. Department of Education, Office of Federal TRIO Programs, Talent Search Performance Reports, 1999-2000;National Center for Education Statistics, Elementary/Secondary and Libraries Studies Division, Common Core of Data, 1999-2000.

III. PROJECT SERVICES AND ACTIVITIES
This section provides an overview of the types of services and activities that TalentSearch projects provide to their participants. The performance reports asked projectsto list the number of activity sessions and the number of participants who attendedeach of 10 activities over the 1999-2000 program year. Staff reported participants byage group—middle school, high school, and adult. Middle school participants werethose in grades 6 to 8 and high school participants were those in grades 9 to 12 orwho had dropped out of high school. Any participant who had completed high schoolor earned a GED was considered an adult.
Table 12 presents the percentage of projects that provided each service, broken downby education level. For example, the first row indicates that 77 percent of TalentSearch projects provided tutoring to middle school students, 73 percent providedtutoring to high school students, 11 percent provided tutoring to adults, and 83 per-cent provided tutoring to participants overall. College orientation activities, test-tak-ing and study skills development, counseling, and academic advising/course selectionwere the services most commonly offered overall. As expected, the data show thatTalent Search services are geared more toward students in middle and high schoolsthan toward adults.
The percentage of projects providing each service increased for each of the 10 serv-ices between the 1998-99 and 1999-2000 program years (Table 13). The largestincreases were in family activities (8 percentage point increase) and assisted comput-er labs (7 percentage point increase).
19
Table 12. Percentage of projects offering services to participants, by grade level: 1999-2000
Service Middle school High school Adult Overall
Tutoring 77% 73% 11% 83% Assisted (computer) labs 55% 62% 16% 70% Test-taking & study skills development 91% 95% 23% 97% Counseling 91% 95% 45% 96% Academic advising/course selection 87% 95% 41% 96% Mentoring 54% 56% 12% 64% Cultural activities 91% 87% 15% 94% College orientation activities 87% 97% 42% 99% Family activities 80% 86% 22% 92%Referrals 40% 62% 31% 70%
SOURCE: U.S. Department of Education, Office of Federal TRIO Programs, Talent Search Performance Reports,1999-2000.

20 A Profile of the Talent Search Program: 1999-2000
For the 1999-2000 program year, projects also varied in the number of types of serv-ices they offered to Talent Search participants. Overall, projects were more likely tooffer a wide range of services rather than only one or two. For example, 60 percentof Talent Search projects offered nine or 10 types of services, while fewer than 2 per-cent offered four or fewer services (Table 14).
Projects were more likely to provide a range of services to their high school partici-pants than to their adult participants. While 70 percent of projects offered seven ormore types of services to high school students, only 6 percent offered that many serv-ices to their adult participants.
Table 13. Comparison of percentage of projects offering different types of services toparticipants: 1998-99 and 1999-2000
Service 1998-99 1999-2000 Increase
Tutoring 80% 83% 3%Assisted (computer) labs 63% 70% 7%Test-taking & study skills development 92% 97% 5%Counseling 92% 96% 4%Academic advising/course selection 91% 96% 5%Mentoring 58% 64% 6%Cultural activities 90% 94% 4%College orientation activities 95% 99% 4%Family activities 84% 92% 8%Referrals 68% 70% 2%
SOURCE: U.S. Department of Education, Office of Federal TRIO Programs, Talent Search Performance Reports,1998-99 and 1999-2000.
Table 14. Percentage of projects offering multiple services to participants, by grade level:1999-2000
Total services offered Middle School High School Adult Overall
9 or 10 of above services 15% 23% 2% 61%7 or 8 of above services 46% 47% 4% 28%5 or 6 of above services 28% 24% 13% 10%3 or 4 of above services 8% 4% 21% 1%1 or 2 of above services 2% 2% 16% <.5%None of above services 1% 0% 43% 0%
Totals do not sum to 100 due to rounding.SOURCE: U.S. Department of Education, Office of Federal TRIO Programs, Talent Search Performance Reports,1999-2000.

III. Project Services and Activities 21
A. Academic support services
The following four services, grouped as academic support services, were defined inthe performance report as follows:
• Tutoring—individual or small-group tutoring provided by professional staff orstudents who are either part-time paid staff, volunteers, or internship-for-credit students.
• Assisted (computer) labs—academic support or tutoring provided through alearning or computer center, which may include computer-assisted instruction.
• Test-taking and study skills development—workshops, tutoring, or individualassistance specifically designed to help students develop the skills necessary todo any of the following: 1) succeed in academic programs, 2) meet scoringrequirements on national or state standardized tests for admission into a post-secondary educational institution, or 3) pass a high school equivalency exam.
• Academic advising/course selection—assisting students in making educationplans, selecting appropriate courses, meeting academic requirements, planningfor high school graduation, and gaining admission to a postsecondary educa-tional institution.
Three different measures were used to look at the extent to which services wereoffered to participants. The first measure indicated the percentage of all TalentSearch participants who received a service. The second measure was the averagenumber of sessions per project (for only those projects that undertook that service).The third measure looked at the average number of sessions per participant (for thoseparticipants engaged in that service). Projects differed in the manner in which theycounted sessions, but we included these data here as an indicator of intensity ratherthan a measure of the number of participant contacts. This measure underestimatesthe actual sessions per participant. When a project provided services to a group of fivepeople, for example, the project was instructed to count the session as one rather thanfive sessions.
Overall, 20 percent of participants received tutoring, 15 percent attended assisted(computer) labs, 46 percent attended test-taking and study skill development sessions,and 64 percent were advised on academic matters (Table 15). The average number oftutoring sessions per participant over this period was about two and the average forother academic support services was approximately one.
Projects typically provided 493 tutoring sessions, 169 assisted (computer) labs, 313 test-taking and study development sessions, and 747 sessions related to academic advis-ing/course selection over the 1999-2000 program year. This is an increase from the1998-99 program year when projects provided an average of 149 assisted (computer) labsessions per project, 265 test-taking and study skills development sessions, and 673 aca-demic advising sessions. The average number of tutoring sessions per project, howev-er, dropped from 574 sessions per project in 1998-99.

22 A Profile of the Talent Search Program: 1999-2000
1. Middle school participants
As chapter II highlights, about 30 percent of the participants in Talent Search werein middle school (grades 6-8). Figure 10 shows that more than half of the participantsin this group received academic advising (65 percent) and participated in activitiesdesigned to enhance test-taking and study skills (59 percent). Other forms of academic support were less common. Thirty-four percent were tutored and 19 per-cent were assisted through the use of an assisted (computer) lab.
Table 15. Percentage of participants receiving academic support services, average numberof sessions per project, and average number of sessions per participant for participants overall: 1999-2000
Percentage of Average number Average numberparticipants of sessions of sessions per
Service receiving service per project participant
Tutoring 20% 493 2.3Assisted (computer) labs 15% 169 0.9Test-taking & study skills development 46% 313 0.7Academic advising/course selection 64% 747 1.2
SOURCE: U.S. Department of Education, Office of Federal TRIO Programs, Talent Search Performance Reports,1999-2000.
Figure 10. Percentage of middle school participants receiving academicsupport services: 1999-2000
SOURCE: U.S. Department of Education, Office of Federal TRIO Programs, Talent SearchPerformance Reports, 1999-2000.
100%
80
60
40
20
0Tutoring Assisted
(computer) labsTest-taking
and study skillsAcademic advising
17%
63% 63%
34%
19%
59%65%

III. Project Services and Activities 23
Each project provided to its middle school participants an average of 344 tutoring ses-sions, 90 labs, 139 test-taking and study skill development sessions, and 218 academ-ic advising/course selection sessions (Table 16). The average number of tutoring sessions per participant was nearly 3, which was 2 sessions more than for assisted(computer) labs, test-taking and study skills development sessions, and academicadvising/course selection sessions.
2. High school participants
Sixty-four percent of high school participants attended academic advising and courseselection sessions (Figure 11). Forty-one percent were involved in test-taking and
Table 16. Average number of sessions per project and average number of sessions perparticipant for middle school participants: 1999-2000
Average number of Average number of Service sessions per project sessions per participant
Tutoring 344 2.9Assisted (computer) labs 90 1.0Test-taking & study skills development 139 0.8Academic advising/course selection 218 1.1
SOURCE: U.S. Department of Education, Office of Federal TRIO Programs, Talent Search Performance Reports,1999-2000.
Figure 11. Percentage of high school participants receiving academic supportservices: 1999-2000
SOURCE: U.S. Department of Education, Office of Federal TRIO Programs, Talent SearchPerformance Reports, 1999-2000.
100%
80
60
40
20
0Tutoring Assisted
(computer) labsTest-taking
and study skillsAcademic advising
14% 13%
41%
64%

24 A Profile of the Talent Search Program: 1999-2000
study skill development activities, 14 percent received tutoring services throughTalent Search, and another 13 percent attended assisted (computer) labs.
Academic advising and course selection activities were the predominant means bywhich high school students received academic support. As shown in Figure 11, theparticipation level for this activity was higher than for other academic support serv-ices. In addition, the average number of academic advising sessions was 542 (Table17), higher than for any other academic support service and an increase of 80 sessionsper project over the 1998-99 program year.
3. Adult participants
Sixty-six percent of the adult participants in Talent Search received academic advis-ing/course selection assistance (Figure 12). Fewer participated in tutoring, assisted(computer) labs, or test-taking and study skills development sessions. Since adult par-ticipants are less likely to be enrolled in school upon entering Talent Search, servicessuch as tutoring or assisted (computer) labs may be less applicable.
Academic support services for adults were less frequent than those provided to mid-dle and high school participants. The average number of sessions per project rangedfrom 24 for assisted (computer) labs to 50 for tutoring (Table 18). The average num-ber of sessions per participant ranged from about 1 for most academic support serv-ices to over 2 for tutoring.
Table 17. Average number of sessions per project and average number of sessions perparticipant for high school participants: 1999-2000
Average number of Average number of Service sessions per project sessions per participant
Tutoring 196 1.6Assisted (computer) labs 108 0.8Test-taking & study skills development 181 0.7Academic advising/course selection 542 1.3
SOURCE: U.S. Department of Education, Office of Federal TRIO Programs, Talent Search Performance Reports,1999-2000.

III. Project Services and Activities 25III. Project Services and Activities 25
Figure 12. Percentage of adult participants receiving academic supportservices: 1999-2000
SOURCE: U.S. Department of Education, Office of Federal TRIO Programs, Talent SearchPerformance Reports, 1999-2000.
Tutoring Assisted (computer) labs
Test-takingand study skills
Academic advising
100%
80
60
40
20
09%
14%
25%
66%
Table 18. Average number of sessions per project and average number of sessions perparticipant for adult participants: 1999-2000
Average number of Average number of Service sessions per project sessions per participant
Tutoring 50 2.1Assisted (computer) labs 24 0.9Test-taking & study skills development 35 1.1Academic advising/course selection 42 0.9
SOURCE: U.S. Department of Education, Office of Federal TRIO Programs, Talent Search Performance Reports,1999-2000.

26 A Profile of the Talent Search Program: 1999-2000
B. Personal and career development services
Additional services and activities were grouped into a single category, comprising activ-ities designed to enhance the personal and career development of Talent Search partic-ipants. These services, such as counseling and mentoring, often had a much broaderfunction, involving help with academic decisions in addition to personal and career-related matters. The six activities were defined in the performance report as follows:
• Counseling—assistance with personal, educational, and career decision-making.
• Mentoring—a variety of personal or academic support activities provided byother students or professionals and designed to expose project participants tocareers and other educational opportunities available to them.
• Cultural activities—any project-sponsored activities, such as field trips, speciallectures, and symposiums, that are intended to enrich the academic progressand personal development of project participants.
• College orientation activities—workshops, college fairs, or project-sponsoredtrips to other postsecondary institutions to acquaint students with a variety ofpostsecondary educational opportunities.
• Family activities—events, workshops, meetings, and counseling designed toprovide families with information on postsecondary educational opportunitiesand financial aid available and to involve them in the educational decisions oftheir children.
• Referrals to other service providers—the formal and informal network of socialservice programs and community organizations, including other TRIOPrograms, available to help project participants.
As in the 1998-99 program year, counseling was the service provided to the largestnumber of participants overall in 1999-2000 (77 percent). Fifty-seven percent partic-ipated in college orientation, 34 percent in cultural activities, 30 percent in familyactivities, and 18 percent in mentoring. Nine percent of participants received refer-rals to outside service providers (Table 19).
Counseling was also provided more frequently than other personal and career devel-opment services, with an average of 1,302 counseling sessions per project during the1999-2000 program year. Each project also provided an average of 342 college ori-entation activities, 206 mentoring sessions, 154 family activities, 81 cultural activities,and 32 referrals to external service providers.

III. Project Services and Activities 27
1. Middle school participants
Counseling is the most common personal and career development service for middleschool students, with 84 percent of participants receiving these services (Figure 13).More than half of middle school students also participated in college orientation (53 percent) and cultural activities (51 percent). Thirty-six percent of these partici-pants engaged in family activities and 25 percent in mentoring activities. These pro-portions are similar to the percentage of middle school participants engaged in per-sonal and career development services in 1998-99.
Table 19. Percentage of participants receiving personal and career development servicesfor participants overall: 1999-2000
Percentage of participants Average number of Service receiving service sessions per project
Counseling 77% 1,302Mentoring 18% 206Cultural activities 34% 81College orientation activities 57% 342Family activities 30% 154Referrals 9% 32
SOURCE: U.S. Department of Education, Office of Federal TRIO Programs, Talent Search Performance Reports,1999-2000.
Figure 13. Percentage of middle school participants receiving personal andcareer development services: 1999-2000
SOURCE: U.S. Department of Education, Office of Federal TRIO Programs, Talent SearchPerformance Reports, 1999-2000.
0 20 40 60 80 100%
Referrals
Family activities
College orientation
Cultural activities
Mentoring
Counseling
7%
36%
53%
51%
25%
84%

28 A Profile of the Talent Search Program: 1999-2000
2. High school participants
As with middle school participants, counseling was the most highly used activity ofhigh school participants. Nearly three quarters of high school participants (74 percent)received counseling in 1999-2000 (Figure 14). Fifty-eight percent received college ori-entation and 27 percent participated in family and cultural activities. Fifteen percentof students received mentoring, and 10 percent received referrals to service providersother than Talent Search. These percentages vary little from the proportion of highschool students engaged in personal and career development services in 1998-99.
3. Adult participants
The percentage of adults receiving personal and career services increased in all cate-gories except cultural activities between 1998-99 and 1999-2000. Eighty-two percentof adult participants received counseling and 65 percent participated in college orien-tation activities (Figure 15). This represents an increase of 9 and 16 percentage pointsfrom 1998-99, respectively. Forty-four percent participated in family activities and 24 percent received referrals to other service providers, an increase from the previousyear of 5 percentage points and a decrease of 8 percentage points, respectively.
Figure 14. Percentage of high school participants receiving personal andcareer development services: 1999-2000
SOURCE: U.S. Department of Education, Office of Federal TRIO Programs, Talent SearchPerformance Reports, 1999-2000.
0 10 20 30 40 50 60 70 80%
Referrals
Family activities
College orientation
Cultural activities
Mentoring
Counseling
10%
27%
58%
27%
15%
74%

III. Project Services and Activities 29
C. Historical perspective on service provision
Relatively little information is available on how the Talent Search Program and itsservices have evolved since the program first began. A report by Elizabeth Eisner,however, provides one slice of the program’s lengthy history by analyzing perform-ance report data from the 1990-91 program year (Eisner 1992). Of the 177 projectsin operation in 1990-91, 162 submitted performance reports.
The performance report in 1990-91 differed somewhat from the current version ofthe report. Thus, direct comparisons between the 1990-91 data and the 1998-99 and1999-2000 data are not possible for all of the service dimensions. In addition, defini-tions were not given for each of the services listed, providing no parameters for cate-gorizing services. There were, however, five general areas of overlap in the perform-ance report items: tutoring, development of study skills, counseling, cultural activi-ties, and college orientation. In counseling, the overall participation rate was one per-centage point lower in 1999-2000 than in 1990-91. In tutoring, study skills, culturalactivities, and college orientation, the 1998-99 and 1999-2000 levels exceeded thosereported by Eisner for 1990-91 (Table 20). This information indicates an increasedfocus on academic services in Talent Search in the 1990s.
Figure 15. Percentage of adult participants receiving personal and careerdevelopment services: 1999-2000
SOURCE: U.S. Department of Education, Office of Federal TRIO Programs, Talent SearchPerformance Reports, 1999-2000.
0 20 40 60 80 100%
Referrals
Family activities
College orientation
Cultural activities
Mentoring
Counseling
24%
44%
65%
19%
11%
82%

30 A Profile of the Talent Search Program: 1999-2000
Table 20. Percentage of participants receiving each type of service, comparingperformance report data from 1990-91, 1998-99, and 1999-2000
Service 1990-91 1998-99 1999-2000
Tutoring 8% 21% 20%Study skills 5% 47% 46%Counseling 78% 77% 77%Cultural activities 9% 33% 34%College orientation 19% 54% 57%
SOURCE: U.S. Department of Education, Office of Federal TRIO Programs, Talent Search Performance Reports, 1998-99 and 1999-2000 and Eisner, “Analysis of Talent Search Performance Reports, 1986-87 and 1990-91.”

IV. PERFORMANCEOUTCOMES
In the fourth section of the performance report, grantees were asked to report ontheir progress in meeting their approved objectives. These objectives were outlinedin a project’s grant proposal and needed to relate to the goals of the Talent SearchProgram as well as respond to the prior experience criteria as described in the pro-gram regulations. The outcomes addressed secondary school progression, retention,graduation, and reentry. The outcomes also included admissions and financial aid forpostsecondary education for college-ready participants. College-ready participantsinclude adults, 12th grade high school students, and high school or high school equiv-alency graduates.
Only Talent Search projects with the following types of data were included in theobjective and outcome calculations: 1) the applicable population (i.e., high schoolparticipants); 2) objective data; and 3) outcome data. Projects missing any of thesethree data types were not included in the calculations. In addition, some projectsreported higher numbers in the outcomes than in the applicable population counts(i.e, more students graduating high school than 12th grade participants). Thus, wecapped the outcomes at the number reported in the population so no calculation wasover 100 percent.
A. Secondary school retention, graduation, and reentry
Secondary school retention, graduation, and reentry were defined as follows in theinstructions provided to projects with the performance report form:
• Secondary school retention—all middle and high school students who will con-tinue in secondary school for the next academic term.
• Secondary school graduation—all high school seniors (and GED or alternativeeducation students) who received a high school diploma or completed a highschool equivalency program during the reporting period.
• Secondary school reentry—all secondary school dropouts who reentered high school or enrolled in a high school equivalency program during thereporting period.
As in 1998-99, projects had little difficulty meeting retention and graduation objec-tives. In 1999-2000 Talent Search projects expected 88 percent of middle school andhigh school participants to stay in school. Ninety-seven percent of middle school par-ticipants and 95 percent of high school participants did so.
Ninety-six percent of high school participants who were in the 12th grade at thebeginning of the reporting period (September 1, 1999) had graduated by the end of
31

32 A Profile of the Talent Search Program: 1999-2000
the reporting period (August 31, 2000)—nine percentage points higher than theapproved objective. In addition, 50 percent of those participants who were reportedas having dropped out of high school at the beginning of the reporting period hadreturned to school by the end of the reporting period (Table 21).
For the 1999-2000 program year, graduation rates among 12th graders were almostequal among the four sectors (not shown in table). Ninety-seven percent of these par-ticipants graduated from projects hosted by private 4-year institutions compared with96 percent at 2-year institutions and 95 percent at both public 4-year institutions andcommunity organizations.
B. Admissions and financial aid assistance
One of the aims of the Talent Search Program is to assist participants with the processof applying to college and obtaining financial aid, thus helping to overcome some ofthe barriers that economically disadvantaged students often face when pursuing post-secondary education. Program staff can offer assistance at various stages of the col-lege application process—selecting schools to apply to, choosing appropriate cours-es, completing the application, and finding ways to finance a college education. Talent
Table 21. Comparison of approved objectives and actual achievements for secondaryschool outcomes: 1999-2000
Outcome Approved objective Actual
Retention Middle school 88% 97%High school 88% 95%
Graduation Middle school * *High school 87% 96%
Re-entry Middle school 63% **High school 63% 50%
*Not applicable for middle school participants. Although promotion from middle to high school was not included amongthe approved objectives, projects were asked to provide the number of middle school students who went on to high school.Projects reported 40,266 participants, or 41 percent of all middle school participants, were promoted from middle tohigh school. Performance report data on the number of middle school students eligible to be promoted were not avail-able, so we were not able to determine the percentage of eligible students promoted.**The performance report did not ask projects to provide the number of participants who were middle school dropoutsat the beginning of the reporting period. As a result, we were not able to determine the percentage of middle schooldropouts that re-entered middle school. Projects reported that 1,210 participants re-entered middle school during the1999-2000 program year.SOURCE: U.S. Department of Education, Office of Federal TRIO Programs, Talent Search Performance Reports,1999-2000.

IV. Performance Outcomes 33
Search Program staff were asked to provide the following information to assess theextent to which participants were receiving these services:
• Applied for postsecondary admission—number of participants who receivedhelp with college entrance applications and the number who applied for post-secondary admission.
• Applied for student financial aid—number of participants who received helpcompleting financial aid forms, including scholarship applications, U.S.Department of Education federal student financial aid forms, and state appli-cations for financial aid and the number who applied for financial aid.
Eighty-four percent of high school seniors and graduates applied to a post-secondaryinstitution and 82 percent applied for financial aid in 1999-2000 (Table 22). Overall,projects had expected to assist 89 percent of their participants with applications forpostsecondary admissions and for student financial aid. Among the four sectors, com-munity organizations had the highest percentage of students apply for both postsec-ondary admission (86 percent) and for financial aid (85 percent).
Table 22. Comparison of approved objectives and actual achievements for assistance inapplying for postsecondary admissions and financial aid: 1999-2000
Outcome Approved objective Actual
Assistance in applying for postsecondary admissions Overall 89% 84%Public 4-year 88% 82%Private 4-year 91% 85%2-year 90% 82%Community organizations 89% 86%
Assistance in applying for student financial aid Overall 89% 82%Public 4-year 88% 80%Private 4-year 91% 84%2-year 91% 80%Community organizations 88% 85%
SOURCE: U.S. Department of Education, Office of Federal TRIO Programs, Talent Search Performance Reports,1999-2000.

34 A Profile of the Talent Search Program: 1999-2000
C. Postsecondary admissions and reentry
Postsecondary enrollment numbers were divided into the following two groups:
• Postsecondary admissions—number of high school graduates and participantswho have completed requirements to obtain a high school equivalency degree, aswell as other eligible individuals who have enrolled in programs of postsecondaryeducation for the first time during this reporting period or for the fall term.
• Postsecondary reentry—number of participants who were previously dismissedor had halted their educational progress toward a postsecondary degree, butwho reenrolled in a program of postsecondary education during the reportingperiod or for the fall term.
Overall, Talent Search projects expected 74 percent of eligible participants to enrollin college and 64 percent of participants who had previously dropped out of collegeto re-enroll. In fact, projects reported that 73 percent of participants enrolled for thefirst time and that 76 percent of the participants in the program who had dropped outre-entered (Table 23).
When examining the data by sector, projects hosted at community organizations hadthe highest percentage of their college-ready participants admitted to a postsecondaryinstitution (76 percent) and projects hosted at 2-year colleges had the highest per-centage of their postsecondary dropouts re-enroll (86 percent).
Table 23. Comparison of approved objectives and actual achievements for postsecondaryoutcomes: 1999-2000
Outcome Approved objective Actual
Postsecondary admissions Overall 74% 73%Public 4-year 73% 71%Private 4-year 76% 72%2-year 73% 72%Community organizations 75% 76%
Postsecondary reentry Overall 64% 76%Public 4-year 60% 79%Private 4-year 60% 60%2-year 67% 86%Community organizations 67% 73%
SOURCE: U.S. Department of Education, Office of Federal TRIO Programs, Talent Search Performance Reports,1999-2000.
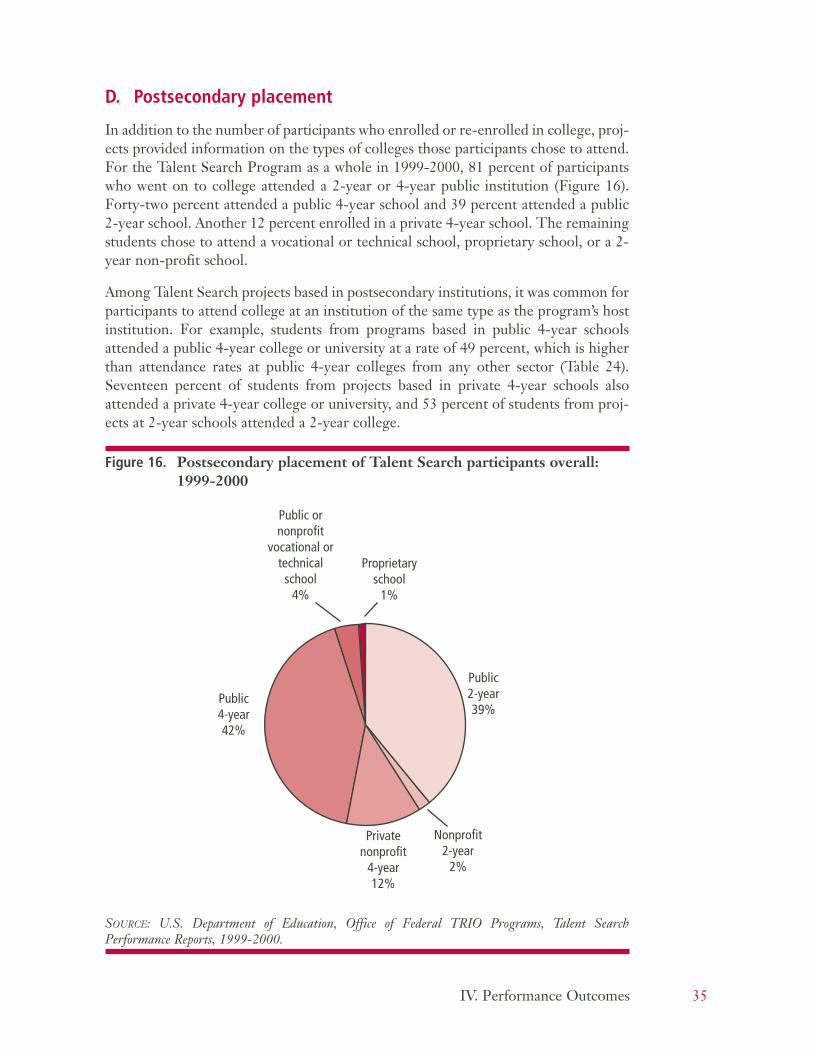
IV. Performance Outcomes 35
D. Postsecondary placement
In addition to the number of participants who enrolled or re-enrolled in college, proj-ects provided information on the types of colleges those participants chose to attend.For the Talent Search Program as a whole in 1999-2000, 81 percent of participantswho went on to college attended a 2-year or 4-year public institution (Figure 16).Forty-two percent attended a public 4-year school and 39 percent attended a public2-year school. Another 12 percent enrolled in a private 4-year school. The remainingstudents chose to attend a vocational or technical school, proprietary school, or a 2-year non-profit school.
Among Talent Search projects based in postsecondary institutions, it was common forparticipants to attend college at an institution of the same type as the program’s hostinstitution. For example, students from programs based in public 4-year schoolsattended a public 4-year college or university at a rate of 49 percent, which is higherthan attendance rates at public 4-year colleges from any other sector (Table 24).Seventeen percent of students from projects based in private 4-year schools alsoattended a private 4-year college or university, and 53 percent of students from proj-ects at 2-year schools attended a 2-year college.
Figure 16. Postsecondary placement of Talent Search participants overall:1999-2000
SOURCE: U.S. Department of Education, Office of Federal TRIO Programs, Talent SearchPerformance Reports, 1999-2000.
Proprietary school
1%
Public 2-year 39%
Nonprofit 2-year
2%
Private nonprofit
4-year12%
Public 4-year 42%
Public ornonprofit
vocational ortechnical
school 4%

36 A Profile of the Talent Search Program: 1999-2000
Table 24. Postsecondary placement of participants by sector: 1999-2000
Percentage Percentage Percentage Percentageadmitted to admitted to admitted to admitted to
public 4-year private 4-year 2-year other typesSector institutions institutions institutions* of institutions**
Public 4-year 49% 10% 34% 7%Private 4-year 44% 17% 34% 5%2-year 33% 8% 53% 5%Community organizations 41% 14% 41% 5%All projects 42% 12% 41% 5%
*Includes 2-year public and non-profit schools.**Includes vocational or technical schools and proprietary schools.SOURCE: U.S. Department of Education, Office of Federal TRIO Programs, Talent Search Performance Reports,1999-2000.

V. DATA ISSUES AND FUTURE PLANS
The following section highlights data issues, response rates, and possible future mod-ifications to the Talent Search performance report. The rates of completion for indi-vidual data items and sections on the performance report were uniformly high, rang-ing from 86 percent to 100 percent (Table 25).
All items related to demographics, with the exception of target schools (90 percent),had response rates of 100 percent. All items in the performance outcomes section, withthe exception of the percentage of participants reentering middle school, had responserates of 90 percent or higher. The response rates for items in the services section couldnot be determined from the given data. In this particular section, projects were givena list of 10 services to report on. They were asked to list the number of sessions theyprovided during the performance period and the number of participants servedthrough each activity. Because not all projects provided all 10 services, it was not pos-sible to determine whether a field was left blank because that particular service wasnever provided or because the project did not have the information on hand.
An additional difficulty in interpreting the services data was the lack of clarity abouthow the numbers of sessions and participants for a given service were calculated. Theinstructions on the performance report stated that “the number of sessions, activities,events, and organizations categories should reflect the total number of these provid-ed. For example, the project may have conducted 50 tutoring sessions for 15 adults.Thus, under the ‘Tutoring’ column, the project should indicate No. of Sessions—50,No. of Participants—15.” In the given example, it is not clear whether each of the 15 participants attended 50 group sessions, or whether 50 individual sessions wereheld and split among 15 students.
There were also some data inconsistencies in Sections III and IV of the performancereport. In Section III, some projects claimed to provide services to more participantsthan were included in Section II. For example, 22 projects (6 percent) reported thatthey provided tutoring activities to more middle school students than were listed asparticipants in the demographics section. In addition, some of the outcome data pro-vided in Section IV were inconsistent with demographic data in Section II. In somecases, projects stated that they had more participants in an outcome than was feasible.For example, 59 Talent Search projects (16 percent) claimed to have more high schoolstudents re-enroll in high school than they had secondary school drop-outs.
The U.S. Department of Education has added edit checks to the Web-based applica-tion that will correct both of these issues. It will require that the totals in each part ofSection III and Section IV cannot be larger than the totals in Section II. In addition,the Department has added edits to Section III that require a numeric value for eachservice or activity field to ensure complete reporting. Those projects not providing the
37

38 A Profile of the Talent Search Program: 1999-2000
service or activity must enter a zero in the field. The results of this change should beimmediately apparent in the 2000-01 performance data. The Department will contin-ue to clarify the directions for completing the reports and to make revisions based onfeedback from the project staff concerning the report form and instructions.
Table 25. Section and item response rates: 1999-2000
Section and item Response rate
Number of participants assisted 100%Participant distribution by eligibility 100%Participant distribution by ethnic background 100%Participant distribution by gender 100%Participant distribution by age 100%Veterans served 100%Participants of limited English proficiency 100%Target schools 90%
Approved objectives:Secondary school retention 100%Secondary school graduation 100%Secondary school reentry 94%Assistance in applying for postsecondary admissions 98%Assistance in applying for student financial aid 99%Postsecondary admissions 99%Postsecondary reentry 91%
Participant status at the end of the reporting period:Continued in middle school 99%Promoted from middle school to high school 99%Continued in high school 99%Re-entered middle school 86%Re-entered high school 90%Received high school diploma 99%Obtained a GED/high school equivalency degree 90%Applied for admission to programs of postsecondary education 99%Applied for student financial aid for postsecondary education 99%Admitted to (or enrolled in) a program of postsecondary education 99%Re-enrolled in a program of postsecondary education 91%Dropped out of middle school 94%Dropped out of high school 97%Other 96%Unknown 100%Postsecondary placements (types of institutions) 91%-100%
SOURCE: U.S. Department of Education, Office of Federal TRIO Programs, Talent Search Performance Reports,1999-2000.

39
APPENDIX A: TABLES
Table A1. Number of Talent Search projects and participants and percentage reportingperformance information, by federal region: 1999-2000
Total Number Numberprojects Project of of projects Response
Federal region in 1999 distribution participants reporting rate
Region I (Boston) 14 4% 12,255 14 100%Region II (New York) 33 9% 32,114 33 100%Region III (Philadelphia) 35 10% 43,521 35 100%Region IV (Atlanta) 88 24% 74,486 88 100%Region V (Chicago) 55 15% 42,556 55 100%Region VI (Dallas) 48 13% 44,650 48 100%Region VII (Kansas City) 20 6% 15,940 19 95%Region VIII (Denver) 18 5% 15,156 17 94%Region IX (San Francisco) 38 11% 38,956 38 100%Region X (Seattle) 12 3% 8,436 12 100%Total for nation 361 100% 328,070 359 99%
SOURCE: U.S. Department of Education, Office of Federal TRIO Programs, Talent Search Performance Reports,1999-2000.
Table A2. Participant distribution by eligibility status and federal region: 1999-2000
Low-income and Low-income First generationFederal Region first generation only only Other needs
Region I (Boston) 72% 9% 15% 4%Region II (New York) 78% 9% 8% 6%Region III (Philadelphia) 74% 6% 16% 5%Region IV (Atlanta) 72% 5% 16% 7%Region V (Chicago) 71% 8% 16% 5%Region VI (Dallas) 75% 6% 13% 5%Region VII (Kansas City) 73% 7% 17% 3%Region VIII (Denver) 73% 9% 12% 6%Region IX (San Francisco) 76% 5% 14% 5%Region X (Seattle) 72% 6% 18% 4%Percent for nation 74% 7% 14% 5%
Totals do not sum to 100 due to rounding.SOURCE: U.S. Department of Education, Office of Federal TRIO Programs, Talent Search Performance Reports,1999-2000.

40 A Profile of the Talent Search Program: 1999-2000
Table A3. Participant distribution by race and ethnicity and federal region: 1999-2000
Am. Black or Hisp. Haw. or Indian/ African or other Multi-
Federal Region Al. Nat. Asian Am. Latino White Pac Is. racial Unk.
Region I (Boston) 1% 6% 20% 30% 38% 0% 3% 2% Region II (New York) 1% 3% 34% 53% 8% 0% 2% 0% Region III (Philadelphia) 0% 2% 31% 34% 32% 0% 1% 0% Region IV (Atlanta) 2% 1% 57% 2% 37% 0% 0% 1% Region V (Chicago) 4% 4% 48% 9% 33% 0% 2% 0% Region VI (Dallas) 6% 2% 34% 24% 32% 0% 1% 0% Region VII (Kansas City) 2% 3% 26% 7% 60% 0% 2% 0% Region VIII (Denver) 28% 1% 1% 22% 48% 0% 0% 0% Region IX (San Francisco) 3% 15% 15% 44% 11% 9% 3% 0% Region X (Seattle) 12% 6% 6% 16% 56% 1% 3% 0% Percent for nation 4% 4% 35% 23% 31% 1% 1% < .5%
Table A3 includes “Unknown” response option so data do not not match totals in Figure 5.SOURCE: U.S. Department of Education, Office of Federal TRIO Programs, Talent Search Performance Reports,1999-2000.
Table A4. Participant distribution by grade level and federal region: 1999-2000
Secondary High school Post PostMiddle High school (GED) secondary secondary
Federal Region school school dropout graduate dropout student
Region I (Boston) 34% 63% 1% 1% 0% 0%Region II (New York) 25% 67% 3% 4% 1% 0%Region III (Philadelphia) 27% 67% 2% 2% 2% 0%Region IV (Atlanta) 34% 62% 2% 1% 0% 0%Region V (Chicago) 31% 60% 2% 6% 1% 0%Region VI (Dallas) 29% 69% 1% 1% 0% 0%Region VII (Kansas City) 32% 63% 3% 2% 1% 0%Region VIII (Denver) 32% 61% 3% 2% 2% 0%Region IX (San Francisco) 24% 72% 1% 1% 0% 1%Region X (Seattle) 35% 62% 1% 2% 0% 0%Percent for nation 30% 65% 2% 2% 1% <0.5%
Totals do not sum to 100 due to rounding.SOURCE: U.S. Department of Education, Office of Federal TRIO Programs, Talent Search Performance Reports,1999-2000.

Appendix A 41
Table A5. Percentage of projects providing academic support services, by federal region:1999-2000
Assisted Test-taking AcademicFederal Region Tutoring (computer) labs and study skills advising
Region I (Boston) 100% 79% 100% 100%Region II (New York) 91% 76% 94% 94%Region III (Philadelphia) 71% 77% 97% 97%Region IV (Atlanta) 84% 69% 99% 98%Region V (Chicago) 80% 71% 98% 98%Region VI (Dallas) 81% 69% 98% 98%Region VII (Kansas City) 89% 79% 95% 95%Region VIII (Denver) 76% 65% 100% 82%Region IX (San Francisco) 87% 58% 95% 95%Region X (Seattle) 83% 75% 92% 100%Percent for nation 83% 70% 97% 96%
SOURCE: U.S. Department of Education, Office of Federal TRIO Programs, Talent Search Performance Reports,1999-2000.
Table A6. Percentage of projects providing personal and career development services, byfederal region: 1999-2000
Cultural College FamilyFederal Region Counseling Mentoring activities orientation activities Referrals
Region I (Boston) 100% 79% 93% 100% 93% 93%Region II (New York) 97% 58% 94% 97% 88% 55%Region III (Philadelphia) 100% 69% 97% 97% 94% 60%Region IV (Atlanta) 98% 59% 94% 100% 91% 68%Region V (Chicago) 91% 60% 93% 100% 91% 71%Region VI (Dallas) 98% 75% 96% 98% 98% 77%Region VII (Kansas City) 100% 68% 100% 100% 89% 63%Region VIII (Denver) 100% 59% 100% 100% 82% 65%Region IX (San Francisco) 92% 58% 84% 95% 92% 79%Region X (Seattle) 92% 92% 100% 100% 100% 75%Percent for nation 96% 64% 94% 99% 92% 70%
SOURCE: U.S. Department of Education, Office of Federal TRIO Programs, Talent Search Performance Reports,1999-2000.

43
REFERENCES
Eisner, Elizabeth. “Analysis of Talent Search Performance Reports, 1986-87 and1990-91.” Paper included in the report from the Design Conference for theEvaluation of the Talent Search Program, hosted by the U.S. Department ofEducation, Office of Policy and Planning, September 30, 1992.


![International cal -Talent Search[1]](https://static.fdocuments.in/doc/165x107/577d2ac11a28ab4e1ea9ff9c/international-cal-talent-search1.jpg)