A PROFILE OF THE SOUTH AFRICAN BROILER MARKET …nda.agric.za/docs/AMCP/Broiler2012-13.pdf · A...
48
1 A PROFILE OF THE SOUTH AFRICAN BROILER MARKET VALUE CHAIN 2012 Directorate Marketing Private Bag X 15 Arcadia 0007 Tel: 012 319 8455/6 Fax: 012 319 8131 Email: [email protected] www.daff.gov.za
Transcript of A PROFILE OF THE SOUTH AFRICAN BROILER MARKET …nda.agric.za/docs/AMCP/Broiler2012-13.pdf · A...

1
A PROFILE OF THE SOUTH AFRICAN BROILER MARKET VALUE CHAIN
2012
Directorate Marketing Private Bag X 15
Arcadia 0007
Tel: 012 319 8455/6 Fax: 012 319 8131
Email: [email protected] www.daff.gov.za

2
TABLE OF CONTENTS 1. DESCRIPTION OF THE INDUSTRY. 3
1.1. Production areas. 3
1.2. Production trends. 4
1.3. Local consumption. 5
1.4. Employment. 6
2. MARKET STRUCTURE 6
2.2. Import – Export analysis. 9
2.2.1. Exports. 9
2.2.2. Share Analysis. 18
2.2.3. Imports. 21
3. BROILER MEAT MARKET VALUE CHAIN 26
4. MARKETING CHANNELS FOR BROILER MEAT. 27
5. EMPOWERMENT STRATEGIES BY THE INDUSTRY AND GOVERNMENT. 28
6. BARRIERS TO PARTICIPATION BY THE EMERGING SECTOR. 28
7. OPPORTUNITIES AND WEAKNESSES. 30
8. MARKET INTELLIGENCE 31
8.1. Export tariffs for broiler meat. 31
8.2. Import tariffs for broiler meat. 32
9. PERFORMANCE ANALYSIS OF SOUTH AFRICAN POULTRY INDUSTRY IN 2011. 35
10. ACKNOWLEDGEMENTS 47

3
1. DESCRIPTION OF THE INDUSTRY.
Broiler production, especially broiler meat production is the largest segment of South African agriculture by 17.5% in 2010 while all agricultural production in agriculture 35% of all animal products in South Africa (in Rand terms). The farm income from broiler meat for 2010 was R22, 940 billion. Broiler production dominates the agricultural sector and it is the main supplier in protein terms of food than all other animal proteins combined followed by beef. The growth had spill-over effects in the grain and chick industries. Broiler meat accounts for about 93.6% to the total poultry-meat production, with the rest made up of mature chicken slaughter (culls), small-scale and backyard broiler meat production and other specialized broiler meat products (geese, turkey, ducks and guinea fowl). Pure lines are imported at great-grandparent level. Currently 7.8 million parents are required to produce commercial progeny for the broiler meat industry from 212 000 grandparents and 4000 pure breed lines. The gross value of broiler meat is depended on the quantity produced and prices received by producers. The gross value moved at an increasing trend during the period under review. The average gross value of production amounted to R 15, 989, 389, 000 over ten years. The contribution to the gross value continued increasing due to higher production and price throughout the period under review. Figure 1 below shows the gross value of broiler meat production.
Source: Statistics and Economic Analysis, DAFF
1.1. Production areas.
Broiler meat is produced throughout South Africa with North West, Western Cape, Mpumalanga and KwaZulu–Natal Provinces being the largest producers accounting for approximately 81% of total production. Figure 2 below shows the distribution of production during 2010/11.
0
5 000 000
10 000 000
15 000 000
20 000 000
25 000 000
30 000 000
Th
ou
san
d R
an
ds
Years
Figure 1: Gross value of broiler meat production

4
Source: Statistics and Economic Analysis, DAFF
During 2010/11 North West Province produced 25% of the entire broiler meat in South Africa followed by Western Cape Province by 22%, Mpumalanga Province18% and KwaZulu–Natal Province 16%. Limpopo and Northern Cape Provinces were the least producers, producing 1% each of South African broiler meat
1.2. Production trends.
The number of birds slaughtered has significantly increased by about 49% in 2011 compared to the year 2002. This is mainly driven by the increasing demand. Figure 3 below shows the production trends from 2002 to 2011.
North West 25%
Western Cape 22%
Mpumalanga 18%
KwaZulu-Natal 16%
Eastern Cape 7%
Gauteng 5%
Free-State 5%
Limpopo 1%
Northern Cape 1%
Figure 2: Distribution of broilers in SA during 2011

5
Source: Agricultural Statistics and SAPA
Figure 3 above shows that production of broiler meat increased continuously from 2004 to 2011 excluding 2008 while birds slaughtered fluctuated slightly throughout the period under review. Both broiler meat production and birds slaughtered reached a new peak of 1.4 million kilograms of broiler meat produced and 978.9 million birds slaughtered during 2011. There is an increase of 36% of broiler meat produced in 2011 compared to the production in 2002.
1.3. Local consumption.
Figure 4 below depicts local consumption of broiler meat comparing it to total production for each year to determine if the country is self sufficient.
0
200 000
400 000
600 000
800 000
1 000 000
1 200 000
0
200
400
600
800
1 000
1 200
1 400
1 600
2002 2003 2004 2005 2006 2007 2008 2009 2010 2011
Bro
iler
s sl
augh
tere
d (
Mill
ion
s)
Mill
ion
Kilo
gram
s
Years
Figure 3: Broilers slaughtered and broiler meat production
Prod (million) Slaughterings (Million)

6
Source: SAPA
Figure 4 indicate that South Africa consume more broiler meat than what is produce locally, therefore South Africa became the net importer of broiler meat mainly to satisfy the local demand. The gap widened from 20/06 to 2011 as rising living standards are pushing larger numbers of consumers towards protein filled diets. The per capita of broiler meat consumed in South Africa has increased from 22.0 kg per person in 2002 to 35.8 kg per person in 2011. Broiler meat has the highest per capita consumption than all other animal protein sources.
1.4. Employment.
It is estimated that broiler hatchery and rearing industries employs 7 035 farm staff and 562 farm managers. This includes broiler-rearing sites, laying sites, hatcheries and parent-rearing sites. The processing sector employs a total of 18 709 people and related feed industry employs 1 000 workers.
2. MARKET STRUCTURE
The domestic market consists of approximately 265 formal abattoirs. These abattoirs sell mainly to 5 main retailers (Pick n Pay, Shoprite-Checkers, Spar, Woolworths and MassMart) and SMME’s in the retail sector. These retailers buy the largest share of domestic production. Figure 5 below shows the price movements from 2002 to 2011.
0
200
400
600
800
1 000
1 200
1 400
1 600
1 800
2 000
2002 2003 2004 2005 2006 2007 2008 2009 2010 2011
Mill
ion
Kilo
gram
s
Years
Figure 4: Broiler meat production and consumption
Production Consumption

7
Source: SAPA
The price increased from 2002 and reached the highest level in 2007 before declining in 2008, then increased slightly in 2009. The decline in 2010 might be due oversupply of eggs responding to the FIFA world cup held in South Africa. Figure 6 below shows the market shares in the broiler meat industry.
Source: UDA Foreign Agricultural Service
The broiler meat industry in South Africa is dominated by 2 large producers, namely Rainbow and Astral. Together these 2 companies produce 50% of the total broiler meat production. The other 4 medium-sized
0.00
2.00
4.00
6.00
8.00
10.00
12.00
14.00
16.00
2002 2003 2004 2005 2006 2007 2008 2009 2010 2011
Ran
ds
pe
r kg
Years
Figure 5: Annual producer prices
Figure 6: Market shares of larger commercial broiler producers
Rainbow 26%
Daybreak 4%
Chubby Chick 5%
Country Bird 8%Tydstroom 5%
Astral 24%
Rocklands 6%
others 22%

8
producers (Tydstroom, Daybreak, Chubby Chick and Rocklands) produce more than 400 000 broilers each per week or 15% of the market. Argyle owns 2% of the market with more than 300 000 broilers per week followed by approximately 49 smaller producers producing less than 200 000 broilers per week each and around 1745 subsistence farmers (selling approximately 500 live chickens per week).
Rainbow which owns the Rainbow, Bonny Bird and Farmer Brown brands is the largest vertically integrated broiler meat producer in South Africa holding an approximate market share of 36% and produces 4.1 million broilers per week.
Astral (27%) and Earlybird farm both broiler meat producers are subsidiaries of Astral Foods. On the 08th September 2004 the Competition Tribunal approved the merger of the two subsidiaries. Astral produces 3.4 million broilers per week and Country Bird produces 1.2 million broilers per week.
Tydstroom Pluimveeplaas which belongs to Pioneer Foods and holds 5% of the market share,
Daybreak farms subsidiary of AFGRI which owns the superior brand holds 4%. It currently processes 650 000 broilers per week.
Chubby Chicks (also known as Fourie’s poultry farm) based in Uitenhage holds 4% of the market share.
Rocklands is a subsidiary of JSE-listed Sovereign Food Investments. It is the seventh-largest broiler producer in South Africa and its broiler meat is marketed under the Crown label. Its market share is 4%.
Table 1: Total production, number of birds slaughtered, consumption, exports and imports.
Years
Broilers slaughtered Production Consumption
Exports
Imports
(Million Kilograms)
2001/02 719,430 1,004 1,089 7 87
2002/03 686,247 991 1,139 2 145
2003/04 701,605 1,017 1,166 2 160
2004/05 769,379 1,117 1,303 1 198
2005/06 831,441 1,210 1,467 1 251
2006/07 864,962 1,261 1,496 1 256
2007/08 8924,072 1,250 1,539 2 214
2008/09 931,443 1,357 1,551 18 209
2009/10 968,796 1,356 1,635 15 143
2010/11 978,873 1,367 1,717 9 202 Source: Agricultural Statistics, SAPA and Quantec EasyData.
Table 1 above shows that although the number of broilers slaughtered increases, South Africa still does not produce enough to satisfy the domestic demand and therefore, the shortfall is imported after exporting smaller quantities.

9
2.2. Import – Export analysis.
Figure 7 compares quantities of imports and exports of broiler meat from 2002 to 2011.
Source: Quantec EasyData
Figure 7 indicates that from 2002 to 2011 South African broiler meat exports were far less than the imports. South Africa is therefore a net importer of broiler meat. The situation might have been exaggerated by the alleged dumping of certain pieces of chicken from Brazil.
2.2.1. Exports.
The broiler meat industry is also an earner of foreign exchange through the export of broiler meat. South Africa experienced an increase of 25% of exports quantity and an increase of 42% in exports value. Figure 8 below indicates the export of broiler meat from 2002 to 2011.
0
50 000
100 000
150 000
200 000
250 000
300 000
2002 2003 2004 2005 2006 2007 2008 2009 2010 2011
Tho
usa
nd
Kilo
gram
s
Years
Figure 7: Broiler meat exports and imports quantity
Exports Quantity Imports Quantity

10
Source: Quantec EasyData
Broiler meat exports quantity and value followed the same trend throughout the decade. It has been more profitable to export broiler meat during the period under review because fewer quantities were exported with more values. Broiler meat exports reached its lowest level from 2005 to 2008 due to increased domestic demand. The broiler meat exports drastically increased in 2009 and started decreasing slightly in 2010 to 2011. Although there is a decreasing trend during the last two years of the decade exports are still higher than at the beginning of the decade. Figure 9 below shows the main export market of South Africa’s broiler meat from 2002 to 2011.
Source: Quantec EasyData
0
50 000
100 000
150 000
200 000
250 000
0
2 000
4 000
6 000
8 000
10 000
12 000
14 000
16 000
18 000
20 000
2002 2003 2004 2005 2006 2007 2008 2009 2010 2011
Tho
ud
san
d R
and
s
Tho
usa
nd
Kilo
gram
s
Years
Figure 8: Broiler meat exports
Quantity Value
0
2 000 000
4 000 000
6 000 000
8 000 000
10 000 000
12 000 000
14 000 000
16 000 000
18 000 000
2002 2003 2004 2005 2006 2007 2008 2009 2010 2011
Kilo
gram
s
Years
Figure 9: Broiler meat exports to SADC
Angola DRC
Mauritius Malawi
Mozambique Seychelles

11
Figure 9 above indicates that from SADC countries, Mozambique and Zimbabwe has been competing for dominance throughout the decade. Mozambique commanded the highest exports of South African broiler meat during the periods 2002- 2003; 2006-2008 and during 2011 while Zimbabwe was the highest commander of broiler meat from South Africa during 2004 -2005; 2009 and 2010. Even though Mozambique commanded the highest South African broiler meat exports for several years in total exports to Zimbabwe is still higher than exports to Mozambique during the past decade. Zimbabwe commanded and total of 30.7 million kilograms followed at a distance by Mozambique by 18.4 million kilograms.
Source: Quantec EasyData
It is clearly indicated from figure 10 above that Ghana commanded the highest broiler meat exports during 2002, 2005 and 2008 to 2011. Saint Helena commanded the second highest export shares of broiler meat from South Africa and commanded the highest exports during 2003 and 2007 but became the second highest during other years. Nigeria commanded the third highest shares but commanded the highest exports during 2004 and 2006. Figure 11 below shows the main export destinations of South Africa’s broiler meat in 2011. Most of South African broiler meat is exported to Mozambique which obtained 64% of South African broiler meat followed by Zimbabwe by 30%. Angola, Ghana, Democratic Republic of Congo and Zambia shared the 6% of South African broiler meat exports during 2011. It is noted that South African broiler meat is exported mostly to SADC countries.
0
20 000
40 000
60 000
80 000
100 000
120 000
140 000
160 000
180 000
2002 2003 2004 2005 2006 2007 2008 2009 2010 2011
Kilo
gram
s
Years
Figure 10: Broiler meat exports to Eastern, Western and Middle Africa
Congo Ghana Nigeria Saint Helena Uganda

12
Source: Quantec EasyData
Values of broiler meat exports from various provinces of South Africa are presented in Figure 12.
Source: Quantec EasyData
Angola 1%
DRC 2%
Ghana 2%
Mozambique 64%
Zambia 1%
Zimbabwe 30%
Figure 11: Broiler meat destinations during 2011
2002 2003 2004 2005 2006 2007 2008 2009 2010 2011
Western Cape 40 353 8 351 10 571 6 845 11 597 12 695 17 405 71 391 47 096 13 962
Eastern Cape 4 487 2 694 93 0 5 9 0 0 0 0
Northern Cape 0 517 0 0 0 0 0 0 0 0
Free State 0 0 0 0 0 0 709 111 098 58 878 0
Kwazulu-Natal 11 333 28 710 28 772 2 685 2 054 5 183 9 970 2 738 20 040 24 358
North West 0 0 0 129 305 232 191 68 379 210
Gauteng 69 104 31 756 16 378 11 546 10 550 11 288 21 606 41 402 101 680 63 308
Mpumalanga 96 2 042 226 773 3 250 38 807 11 509 30 124 46 482
Limpopo 383 0 0 0 0 323 50 2 138 14 478 3 729
0
20 000
40 000
60 000
80 000
100 000
120 000
Tho
usa
nd
Ran
ds
Figure 12: Values of broiler meat exports from Provinces

13
Broiler meat exports originate mainly from the Gauteng, Western Cape, Free State and KwaZulu-Natal Provinces. Gauteng Province has recorded the greatest values in broiler meat exports during the period under review with the highest values in 2002-2003, 2005, 2008 and 2010-2011. This is due to the fact that this province is the main exit point of exports. Western Cape is the second greatest exporter; it recorded its high values during 2006 to 2007 followed by Free State Province which recorded exports values only from 2008 to 2010. KwaZulu-Natal and Mpumalanga provinces recorded regular exports values while intermittent exports were recorded from Eastern Cape, North West and Limpopo Provinces. The following figures (Figures 13 - 21) show the values of broiler meat exports from the various districts in the nine provinces of South Africa.
Source: Quantec EasyData
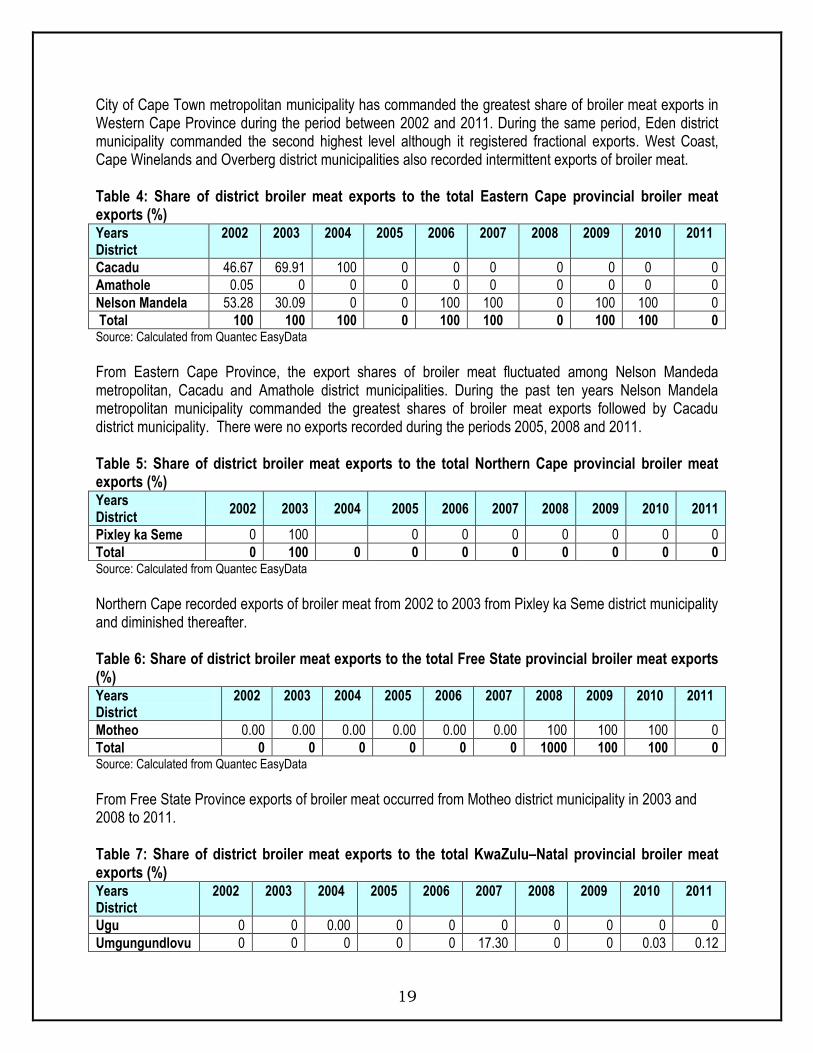
The greatest share of broiler meat exports value from Western Cape Province originates mainly from City of Cape Town Metropolitan municipality. Small intermittent export values were recorded in West Coast, Cape Winelands, Overberg and Eden district municipalities. West Coast district municipality recorded some exports during 2006 and 2007; Cape Winelands district municipality recorded in 2009 and 2010; Overberg recoded the value of R134 000 of broiler meat exports in 2002 only whereas Eden recorded during 2004 and 2008.
2002 2003 2004 2005 2006 2007 2008 2009 2010 2011
City of Cape Town 40 219 8 351 5 625 6 845 9 578 10 484 17 030 70 793 46 861 13 962
West Coast 0 0 0 0 2 020 2 210 0 0 0 0
Cape Winelands 0 0 0 0 0 0 0 598 235 0
Overberg 134 0 0 0 0 0 0 0 0 0
Eden 0 0 4 946 0 0 0 375 0 0 0
0
10 000
20 000
30 000
40 000
50 000
60 000
70 000
80 000
Tho
usa
nd
Ran
ds
Figure 13: Values of broiler meat exports from Western Cape Province
14
Source: Quantec EasyData
Broiler meat exports in Eastern Cape Province were from Cacadu district, Amatole district and Nelson Mandela metropolitan municipalities. All municipalities in the Eastern Cape Province recorded irregular exports of broiler meat. Nelson Mandela district municipality recorded the highest export values in 2002 and Cacadu district municipality commanded the highest values in 2003.
Source: Quantec EasyData
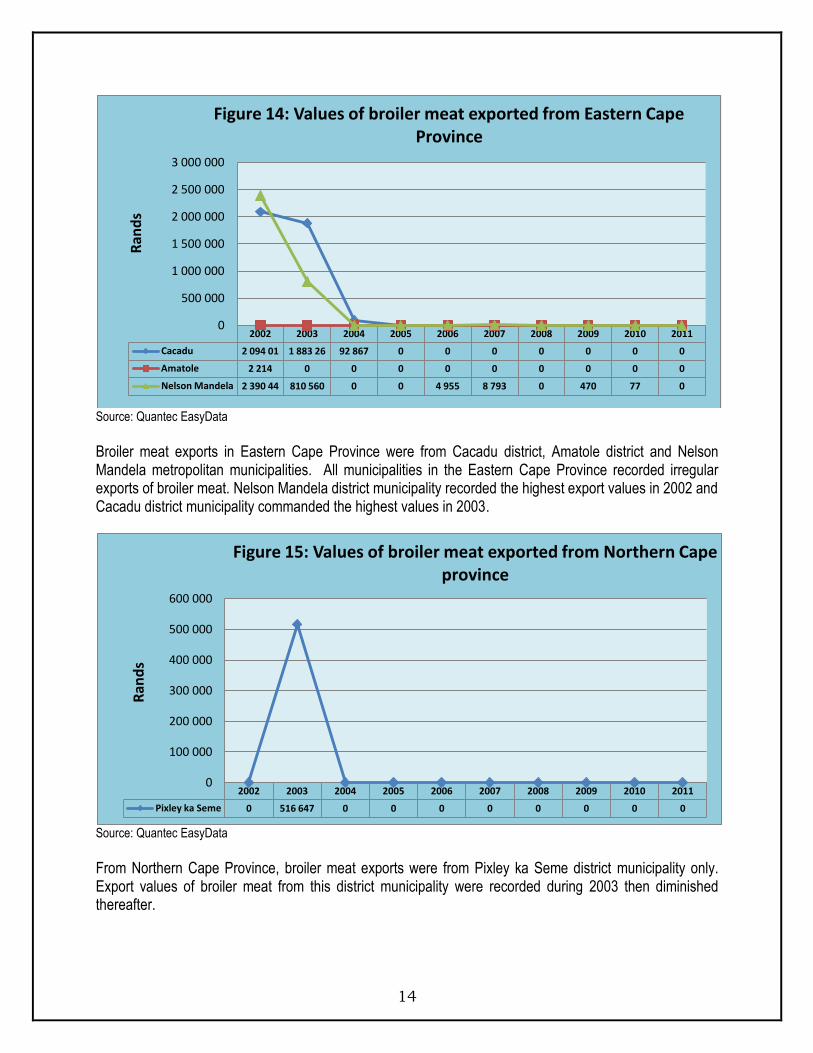
From Northern Cape Province, broiler meat exports were from Pixley ka Seme district municipality only. Export values of broiler meat from this district municipality were recorded during 2003 then diminished thereafter.
2002 2003 2004 2005 2006 2007 2008 2009 2010 2011
Cacadu 2 094 01 1 883 26 92 867 0 0 0 0 0 0 0
Amatole 2 214 0 0 0 0 0 0 0 0 0
Nelson Mandela 2 390 44 810 560 0 0 4 955 8 793 0 470 77 0
0
500 000
1 000 000
1 500 000
2 000 000
2 500 000
3 000 000
Ran
ds
Figure 14: Values of broiler meat exported from Eastern Cape Province
2002 2003 2004 2005 2006 2007 2008 2009 2010 2011
Pixley ka Seme 0 516 647 0 0 0 0 0 0 0 0
0
100 000
200 000
300 000
400 000
500 000
600 000
Ran
ds
Figure 15: Values of broiler meat exported from Northern Cape province

15
Source: Quantec EasyData
In Free State Province, broiler meat exports were mainly from Motheo district municipalities. Motheo district municipality recorded exports values of broiler meat from 2008 to 2010 and diminished during the other years.
Source: Quantec EasyData
From KwaZulu–Natal Province, the export of broiler meat was mainly from eThekwini district municipality. This municipality commanded the greatest value of R 132, 981, 311 during the past decade. Intermittent export values of broiler meat were recorded from Ugu district municipality (2004); Umgugundlovu district municipality (2007; 2010 & 2011); Uthukela district municipality (2003); Umzinyathi district municipality (2004-2005) and Uthungulu district municipality (2003-2004).
2002 2003 2004 2005 2006 2007 2008 2009 2010 2011
Motheo 0 0 0 0 0 0 708 554 111 097 5 58 877 54 0
0
20 000 000
40 000 000
60 000 000
80 000 000
100 000 000
120 000 000
Ran
ds
Figure 16: Values of broiler meat exported from Free State
2002 2003 2004 2005 2006 2007 2008 2009 2010 2011
Ugu 0 0 136 0 0 0 0 0 0 0
Umgungundlovu 0 0 0 0 0 896 885 0 0 5 627 29 442
Uthukela 0 14 051 0 0 0 0 0 0 0 0
Umzinyathi 0 0 696 828 1 216 494 0 0 0 0 0 0
Uthungulu 0 130 1 332 0 0 0 0 0 0 0
eThekwini 11 333 096 28 696 065 28 073 718 1 468 182 2 053 928 4 285 934 9 969 568 2 737 952 20 034 199 24 328 669
0
5 000 000
10 000 000
15 000 000
20 000 000
25 000 000
30 000 000
35 000 000
Ran
ds
Figure 17: Values of broiler meat exported from KwaZulu-Natal Province

16
Source: Quantec EasyData
Southern district municipality in North West commanded the highest export values during the past decade followed by Bojanala district municipality. Both municipalities recorded intermittent exports. Bojanala recorded in 2006 and 2009 while Southern district municipality recorded from 2005 to 2008 and 2010 to 2011.
Source: Quantec EasyData
In Gauteng province, broiler meat exports arose mainly from City of Johannesburg, Ekurhuleni and City of Tshwane district municipalities. City of Johannesburg dominated the export market of broiler meat in Gauteng province and commanded an export value of R 229,715,619 for the past ten years. It commanded
2002 2003 2004 2005 2006 2007 2008 2009 2010 2011
Bojanala 0 0 0 0 4 667 0 0 68 355 0 0
Southern 0 0 0 129 119 300 542 232 325 191 267 0 379 113 210 351
0
50 000
100 000
150 000
200 000
250 000
300 000
350 000
400 000
Ran
ds
Figure 18: Values of broiler meat exported from North West Province
2002 2003 2004 2005 2006 2007 2008 2009 2010 2011
Sedibeng 0 7 840 1 920 1 646 1 835 0 0 0 230 119
Metsweding 0 2 893 0 0 0 0 0 2 537 0 36
West Rand 1 316 266 0 10 812 7 1 171 1 443 1 630
Ekurhuleni 57 732 12 740 3 174 965 621 3 050 773 1 982 3 809 6 221
City of Johannesburg 6 242 7 875 10 661 8 382 6 991 7 929 19 115 34 967 91 029 36 525
City of Tshwane 3 814 142 623 542 290 302 1 717 1 745 5 170 18 777
0
10 000
20 000
30 000
40 000
50 000
60 000
70 000
80 000
90 000
100 000
Tho
usa
nd
Ran
ds
Figure 19: Values of broiler meatexported from Gauteng Province

17
the greatest values from 2004 to 2011. Irregular exports were recorded from Sedibeng, Metsweding and west Rand district municipalities..
Source: Quantec EasyData
In Mpumalanga Province, Ehlanzeni district municipality was the greatest commander of broiler meat export values. Ehlanzeni district municipality showed a continuous sharp increase from 2009 to 2011. Gert Sibande and Nkangala district municipalities recorded fractional exports. Gert Sibande district municipality recorded exports of broiler meat during 2009 and 2011 while Nkangala district municipality exported only in 2010.
Source: Quantec EasyData
2002 2003 2004 2005 2006 2007 2008 2009 2010 2011
Gert Sibande 0 0 0 0 0 0 0 297 234 0 7 277
Nkangala 0 0 0 0 0 0 0 0 735 0
Ehlanzeni 96 386 2 042 190 225 595 772 795 3 250 382 38 468 806 907 11 211 44 30 122 91 46 475 21
0 5 000 000
10 000 000 15 000 000 20 000 000 25 000 000 30 000 000 35 000 000 40 000 000 45 000 000 50 000 000
Ran
ds
Figure 20: Values of broiler meat exported from Mpumalanga Province
2002 2003 2004 2005 2006 2007 2008 2009 2010 2011
Mopani 0 0 0 0 0 323 150 0 0 0 0
Vhembe 382 633 0 0 0 0 0 49 651 0 1 633 241 1 428 067
Capricorn 0 0 0 0 0 0 0 2 138 404 12 845 04 2 300 557
0
2 000 000
4 000 000
6 000 000
8 000 000
10 000 000
12 000 000
14 000 000
Ran
ds
Figure 21: Values of broiler meat exported from Limpopo Province

18
Figure 21 indicates that Limpopo Province experienced intermittent exports of broiler meat from 2002 to 2011. Mopani district municipality recorded exports during 2007; Vhembe recorded during 2002, 2008 and 2010-2011; Capricorn district municipality recorded during 2009 to 2011.
2.2.2. Share Analysis.
The shares of provinces to the total export values for South African exports of broilers during the past ten years are presented in Table 2. Table 2: Share of Provincial broiler meat exports to the total RSA broiler meat exports (%) Years Province
2002 2003 2004 2005 2006 2007 2008 2009 2010 2011
Western Cape 32.09 11.28 18.86 31.14 41.77 42.65 34.30 29.70 17.27 9.18
Eastern Cape 3.57 3.64 0.17 0.00 0.02 0.03 0 0 0 0
Northern Cape 0 0.70 0 0 0 0 0 0 0 0
Free State 0 0 0 0 0 0 1.40 46.22 21.59 0.00
Kwazulu-Natal 9.01 38.76 51.34 12.22 7.40 17.41 19.65 1.14 7.35 16.02
North West 0 0.00 0 0.59 1.10 0.78 0.38 0.03 0.14 0.14
Gauteng 54.95 42.87 29.23 52.54 38.00 37.92 42.58 17.23 37.29 41.64
Mpumalanga 0.08 2.76 0.40 3.52 11.71 0.13 1.59 4.79 11.05 30.57
Limpopo 0.30 0 0 0 0 1.09 0.10 0.89 5.31 2.45
Total 100 100 100 100 100 100 100 100 100 100 Source: Calculated from Quantec EasyData
From Table 2 above, Gauteng Province commanded the greatest share of South African broiler meat exports followed by Western Cape and KwaZulu-Natal provinces. This is mainly due to the fact that most exporters of broiler meat are situated in these provinces and also that they are the exit points for exports. Mpumalanga province was a regular exporter while Northern Cape, Eastern Cape, Free State, North West and Limpopo provinces registered fractional exports of broiler meat. The accompanying Tables 3 to 11 shows a share of the various districts broiler meat exports to the various provincial broiler meat exports. Table 3: Share of district broiler meat exports to the total Western Cape provincial broiler meat exports (%) Years District
2002 2003 2004 2005 2006 2007 2008 2009 2010 2011
City of Cape Town 99.67 100 53.21 100 82.59 82.59 97.85 99.16 99.50 100
West Coast 0 0 0 0 17.41 17.41 0 0 0 0
Cape Winelands 0 0 0 0 0 0 0 0.84 0.50 0
Overberg 0.33 0 0 0 0 0 0 0 0 0
Eden 0 0 46.79 0 0 0 2.15 0 0 0
Total 100 100 100 100 100 100 100 100 100 100 Source: Calculated from Quantec EasyData
19
City of Cape Town metropolitan municipality has commanded the greatest share of broiler meat exports in Western Cape Province during the period between 2002 and 2011. During the same period, Eden district municipality commanded the second highest level although it registered fractional exports. West Coast, Cape Winelands and Overberg district municipalities also recorded intermittent exports of broiler meat. Table 4: Share of district broiler meat exports to the total Eastern Cape provincial broiler meat exports (%) Years District
2002 2003 2004 2005 2006 2007 2008 2009 2010 2011
Cacadu 46.67 69.91 100 0 0 0 0 0 0 0
Amathole 0.05 0 0 0 0 0 0 0 0 0
Nelson Mandela 53.28 30.09 0 0 100 100 0 100 100 0
Total 100 100 100 0 100 100 0 100 100 0 Source: Calculated from Quantec EasyData
From Eastern Cape Province, the export shares of broiler meat fluctuated among Nelson Mandeda metropolitan, Cacadu and Amathole district municipalities. During the past ten years Nelson Mandela metropolitan municipality commanded the greatest shares of broiler meat exports followed by Cacadu district municipality. There were no exports recorded during the periods 2005, 2008 and 2011. Table 5: Share of district broiler meat exports to the total Northern Cape provincial broiler meat exports (%) Years District
2002 2003 2004 2005 2006 2007 2008 2009 2010 2011
Pixley ka Seme 0 100 0 0 0 0 0 0 0
Total 0 100 0 0 0 0 0 0 0 0 Source: Calculated from Quantec EasyData
Northern Cape recorded exports of broiler meat from 2002 to 2003 from Pixley ka Seme district municipality and diminished thereafter. Table 6: Share of district broiler meat exports to the total Free State provincial broiler meat exports (%) Years District
2002 2003 2004 2005 2006 2007 2008 2009 2010 2011
Motheo 0.00 0.00 0.00 0.00 0.00 0.00 100 100 100 0
Total 0 0 0 0 0 0 1000 100 100 0 Source: Calculated from Quantec EasyData
From Free State Province exports of broiler meat occurred from Motheo district municipality in 2003 and 2008 to 2011. Table 7: Share of district broiler meat exports to the total KwaZulu–Natal provincial broiler meat exports (%) Years District
2002 2003 2004 2005 2006 2007 2008 2009 2010 2011
Ugu 0 0 0.00 0 0 0 0 0 0 0
Umgungundlovu 0 0 0 0 0 17.30 0 0 0.03 0.12

20
Years District
2002 2003 2004 2005 2006 2007 2008 2009 2010 2011
Uthukela 0 0.05 0 0 0 0 0 0 0 0
Umzinyathi 0 0 2.42 45.31 0 0 0 0 0 0
Uthungulu 0 0.00 0.00 0 0 0 0 0 0 0
eThekwini 100 99.95 97.57 54.69 100 82.70 100 100 99.97 99.88
Total 100 100 100 100 100 100 100 100 100 100 Source: Calculated from Quantec EasyData
From KwaZulu-Natal Province, eThekwini district municipality has commanded the greatest share of broiler meat exports throughout the period under analysis. Fractional exports of broiler meat were recorded in Ugu, Umgugundlovu, Uthukela, Umzinyathi and Uthungulu district municipalities. Table 8: Share of district broiler meat exports to the total North West provincial broiler meat exports (%) Years District
2002 2003 2004 2005 2006 2007 2008 2009 2010 2011
Bojanala 0 0 0 0 1.53 0 0 100 0 0
Southern 0 0 0 100 98.47 100 100 0 100 100
Total 0 0 0 100 100 100 100 100 100 100 Source: Calculated from Quantec EasyData
Southern district municipality has commanded the greatest share of broiler meat exports in North West Province during the past decade. Bojanala district municipality recorded the highest exports of broiler meat during 2009 and diminished during the other years. Table 9: Share of district broiler meat exports to the total Gauteng provincial broiler meat exports (%) Years District
2002 2003 2004 2005 2006 2007 2008 2009 2010 2011
Sedibeng 0 24.69 11.72 14.26 17.39 0 0 0 0.23 0.19
Metsweding 0 9.11 0 0 0 0 0 6.13 0 0.06
West Rand 1.90 0.84 0.00 0.08 7.70 0.06 0.00 0.41 1.42 2.57
Ekurhuleni 83.54 40.12 19.38 8.36 5.89 27.02 3.58 4.79 3.75 9.83
City of Johannesburg 9.03 24.80 65.09 72.60 66.27 70.24 88.47 84.46 89.52 57.69
City of Tshwane 5.52 0.45 3.81 4.70 2.75 2.68 7.95 4.21 5.08 29.66
Total 100 100 100 100 100 100 100 100 100 100 Source: Calculated from Quantec EasyData
In Gauteng Province, City of Johannesburg metropolitan municipality commanded the greatest share of broiler meat exports followed by Ekurhuleni, Sedibeng and City of Tshwane district municipalities. Intermittent exports of broiler meat were recorded in Sedibeng and Metsweding district municipalities.

21
Table 10: Share of district broiler meat exports to total Mpumalanga provincial broiler meat exports (%) Years District
2002 2003 2004 2005 2006 2007 2008 2009 2010 2011
Gert Sibande 0 0 0 0 0 0 0 2.58 0 0.02
Nkangala 0 0 0 0 0 0 0 0 0.00 0
Ehlanzeni 100 100 100 100 100 100 100 97.42 100.00 99.98
Total 100 100 100 100 100 100 100 100 100 100 Source: Calculated from Quantec EasyData
Ehlanzeni district in Mpumalanga Province commanded 100% share of all broiler meat exports during the periods 2005 to 2008 and 2010. This makes Ehlanzeni district municipality to be the main exporter of broiler meat in Mpumalanga Province. Gert Sibande and Nkangala district municipalities experienced fractional exports during the period under review. Table 11: Share of district broiler meat exports to the total Limpopo provincial broiler meat exports (%) Years District
2002 2003 2004 2005 2006 2007 2008 2009 2010 2011
Mopani 0 0 0 0 0 100 0 0 0 0
Vhembe 100 0 0 0 0 0 100 0 11.28 38.30
Capricorn 0 0 0 0 0 0 0 100 88.72 61.70
Total 100 0 0 0 0 100 100 100 100 100 Source: Calculated from Quantec EasyData
From Limpopo Province, exports of broiler meat were irregular during the period under analysis. There were no records of broiler meat exports during the period 2003 to 2006. Mopani recorded exports of broiler meat during 2007; Vhembe recorded its exports during 2008 and 2010 to 2011 then Capricorn district municipality in 2008 to 2011.
2.2.3. Imports.
South Africa imported approximately 202 million kilograms of broiler meat in 2011 at an estimated value of R 2.1 million. The import value showed a significant increase of 57% compared to 2002. This drastic increase might have caused by the alleged dumping of certain pieces of broiler meat from Brazil. The decline in 2008 might have been caused by global economic meltdown that occurred from August 2008. Figure 21 below show the imports of broiler meat from 2002 to 2011.

22
Source: Quantec EasyData
Broiler meat imports are exchange rate driven, when the Rand appreciates against US$, imports of broiler meat increases and when the Rand depreciates against US$ imports of broiler meat decreases. The import of broiler meat quantities increased significantly from 2002 and reached the highest level in 2007 before moving at a decreasing trend from 2008 to 2010 then increased drastically during 2011. The Rand appreciated (average of R7.66/US$) from the last six months of 2009 and led the broiler meat imports to accelerate then depreciated in 2010.During 2010 to 2011, it was more expensive to import broiler meat as less quantity was imported at a high value. Figure 23 below show the main suppliers of broiler meat to South Africa during the period 2002 to 2011.
Source: Quantec EasyData
0
500
1 000
1 500
2 000
2 500
0
50
100
150
200
250
300
2002 2003 2004 2005 2006 2007 2008 2009 2010 2011
Mill
ion
Ran
ds
Mill
ion
Kilo
gram
s
Years
Figure 22: Broiler imports
Quantity Value
0
5 000
10 000
15 000
20 000
25 000
30 000
35 000
2002 2003 2004 2005 2006 2007 2008 2009 2010 2011
Tho
usa
nd
Kilo
gram
s
Years
Figure 23: Quantities of broiler meat imported from EU
Belgium Germany Denmark France
United Kingdom Ireland Netherlands

23
Figure 23 clearly indicates that the highest quantity of broiler meat imports from 2002 to 2006 and 2010 originated from United Kingdom followed by Belgium which commanded the highest imports of broiler meat to South Africa during the periods 2007 to 2009 and Netherlands commanded the highest imports during 2011. The lowest imports received during the past decade were from Germany, Denmark and Ireland.
Source: Quantec EasyData
During the past decade Brazil commanded the highest quantities of South Africa’s import market of broiler meat. Its quantity increased drastically from 2002 to 2007 and dropped slightly from 2008 to 2011. The decrease was due to the world economic recession which led to a slow down of consumer demand. Canada became the second largest importer of broiler meat to South Africa followed by Argentina during the period under review. Generally, Brazil is the net exporter of broiler meat to South Africa.
0
20 000
40 000
60 000
80 000
100 000
120 000
140 000
160 000
180 000
200 000
2002 2003 2004 2005 2006 2007 2008 2009 2010 2011
Tho
usa
nd
Kilo
gram
s
Years
Figure 24: Quantities of broiler meat imported from South America, NAFTA and Carribean
Argentina Brazil Canada Chile Cayman Islands United States

24
Source: Quantec EasyData
Figure 25 shows that China was the main supplier of broiler meat to South Africa and it commanded the greatest share during 2003 followed by Israel which commanded the highest shares during 2005 to 2010. The least imports of broiler meat were from Thailand but it commanded the greatest shares during 2011.
Source: Quantec EasyData
It is clearly indicated from figure 26 above that from Oceania, Australia is the main importer of broiler meat to South Africa.. Australia reached the highest imports in 2007. South Africa received the least imports of broiler meat from New Zealand.
0
2 000
4 000
6 000
8 000
10 000
12 000
2002 2003 2004 2005 2006 2007 2008 2009 2010 2011
Tho
usa
nd
Kilo
gram
s
Years
Figure 25: Quantities of broiler meat imported from Asia
China Israel Thailand
0
2 000
4 000
6 000
8 000
10 000
12 000
2002 2003 2004 2005 2006 2007 2008 2009 2010 2011
Tho
usa
nd
Kilo
gram
s
Years
Figure 26: Quantities of broiler meat imported from Oceania
Australia New Zealand

25
Source: Quantec EasyData.
Figure 27 above shows the share of various suppliers to South Africa’s broiler meat in 2011. Brazil commanded the highest market share of broiler meat imports in South Africa, leading with 40% share followed at a distance by Netherlands with 15% and Canada by 9%.
Argentina 6%
Australia 3% Belgium
3%
Brazil 40%
Canada 9%
Germany 1%
Denmark 4%
Spain 1%
France 1%
United Kingdom 8%
Ireland 4%
Netherlands 15%
Thailand 1%
United States 4%
Figure 27: Origin of broiler meat exports in 2011

26
3. BROILER MEAT MARKET VALUE CHAIN
Figure 24: Structure of the broiler meat industry.
Source: Adapted from NAMC. South African broiler meat value chain consists of broiler meat farms and contract growers, feed companies and other input suppliers and breeders. In the secondary sector we have abattoirs, importers, exporters and retailers. There are around 48.6 million consumers with a per capita consumption of 35.80%. Production in kilograms is around 1 367 million, consumption around 1 717 million, Imports 202 million and Export 8.6 million.
Retail
Abattoirs
Abattoirs
A: 0 B: 29
C: 102
D: 60
E: 68
Total: 265
Domestic
Production Commercial
Production: 979
million broilers
slaughtered in 2010
Contract
growers
Feed companies
Breeders
Import Import: 201 906 812 Kg
37 Breeders: 3
primary: Cobb
Ross and Hybro
Multipliers: 34
207 Broiler meat contract growers:
Early Bird 82
Country Bird 56
Rainbow 42 SMMEs: 28% or
4 983 906
broiler meats
sold per week.
Export
Farms
27 Feed companies:
Afgri
Epol
Meadow
75% of industry
24 remaining mills: 25% of
industry
Export: 8 570
708 kg
Total Production: National DoA Sector for Agriculture/ Livestock 32% of the National
flock is contributed by SMME`s Indigenous fowls sustenance farming.
- SAPA Stats (Commercial only) 8 producers handle 72% of total Broiler
meatsupply to RSA SMMEs (<200 000 broiler meats slaughtered or sold per week) handle 28%
48.6 million Consumers (Estimate for 2011) Per Capita Consumption = 35.8 kg / year
17 % of Agricultural Production

27
4. MARKETING CHANNELS FOR BROILER MEAT.
Figure 25: Marketing Channels.
From Figure 25, broiler meat production is by two sectors; viz, commercial and small scale. Live broiler meat is marketed mainly through two channels, live broiler meat market and abattoirs. Majority of broiler meat from commercial is sold through abattoirs while small scale through live broiler meat market. Live broiler meat market depends on hawkers and small retailers for distribution to customers. Abattoirs slaughters broiler meat and sell it as carcass to processors and packers, who in turn may export, sell to retailers or further processors. Processors and packers and further processors also rely on imports for their supplies. Further processors sell to retailers for final distribution to the consumer.
Small Scale
Production Hawkers &
Retailers.
Live Broiler
meatMarket
Import
Commercial
Production.
Abattoirs
Processors
and Packers
Further
Processors.
Retailers Consumers
Export
28
5. EMPOWERMENT STRATEGIES BY THE INDUSTRY AND GOVERNMENT.
o The Land Bank sponsors the distribution of broiler meat bulletin to developing farmers. o Sector for Education and Training (SetaSA) sponsors training under the National Skills Broiler
Project Fund. o Rocklands broiler meat has entered into a R20-million joint venture with BEE company
Kamnandi Trading to produce 265 000 live birds every eight weeks in the Eastern Cape town of Loerie over 20 years.
o Vukanathi Broiler Project in North West is presently an out grower for Country Bird. Country Bird provides the day old chicks, medicine, feed and the market to the project. In 2006 the venture was transformed into black employment equity (BEE) entity that required Thembani’s assistance as guarantor to secure a working capital and growth line of credit. The Vukanathi project will own 72% of the equity of the business and effectively transform the venture into a BEE entity, with a strategic partner owning 28% of this venture.
o The South African Broiler Association (SAPA) was the catalyst in the formation of the Developing Broiler Farmers Organization (DPFO). The main objective of the DPFO is to serve as a conduit to the developing broiler farmers for information dissemination and to co-ordinate and address collective issues in the industry.
Possible market entry for SMME Contract growing. Empowerment purchases of existing operation’s farms by workers. Strategic partnerships – not for beginner farmers. Resource centres in the form of central distribution points that will allow farmers to
organize into buyer groups or small cooperatives.
6. BARRIERS TO PARTICIPATION BY THE EMERGING SECTOR.
The transaction costs of the emerging farmers are much higher than those of their large developed counterparts in the commercial sector. The availability of day-old chicks is a problem because the big producers are given preference. The long distances from the suppliers to the farms could result in high fatalities. The lack of abattoirs/slaughter houses to market/sell dressed chickens in the formal markets. The lack of bar coding facilities and proper freezers to store dressed birds. Most retail companies look for bar coded products for traceability. The volumes produced and their location places them at a disadvantage to supply to the retail sector. Hence many farmers sell live birds to the informal sector.

29
Other constraints that affect the industry
Low priced imports.
Sanitary and Phytosanitary Standards.
Exchange rate fluctuations.
Chick Costs are high.
Higher input costs, especially feed prices.
Lack of Finance as small scale farmers do not meet the requirements set by the commercial banks.
Lack of Health Control as state veterinarians are not trained in broiler or available when needed.
Lack of Marketing Skills.
Lack of Technical Training.
Lack of strong Farmer Organization, support structures and mentorship.
The significant growth in volume of imports into South Africa.
Continuous threat of poultry diseases, especially the new variant of IB prevalent in SA.
Negative media comments around the practice of brining are a potential crisis for the industry.

30
7. OPPORTUNITIES AND WEAKNESSES.
The per capita consumption increased from 22.0 kilograms per person in 2002 to 37.30 kilograms per person in 2011. If this trend continues this is an opportunity for new entrants and the growth of existing broiler farmers in the industry. The per capita broiler meat consumption is set to increase further with the redistribution of wealth, recovery of the economy and the increase in the level of disposable income. With the redistribution of wealth the per capita income of the nation has resulted in an upward movement of individuals in the pyramid of purchasing power. This thus results in the demands changing hence individuals would include more broiler meat in their regular meals. There are 35 producers who provide 61% of the total broiler meat market. Imports control 27% of the market. The balance 12% is being supplied by hundreds of small/emerging farmers. New entrants are free to enter but are limited in terms of capital, expertise and the availability of day-old chicks. Another inhibiting factor to the growth of the emerging sector is the lack of abattoirs to slaughter and sell their products to the retail sector. Their volumes are too small to warrant the capital outlay for the establishment of an abattoir. Thus many emerging farmers sell their products in the informal sector as live birds. The quality standards and bar coding are pre-requisites by most retail companies. This is thus an area that can be jointly addressed by government and the industry. This intervention could assist with the growth of the domestic supply and could ultimately reduce imports. Some farmers lack the knowledge/expertise on handling diseases on their farms.
31
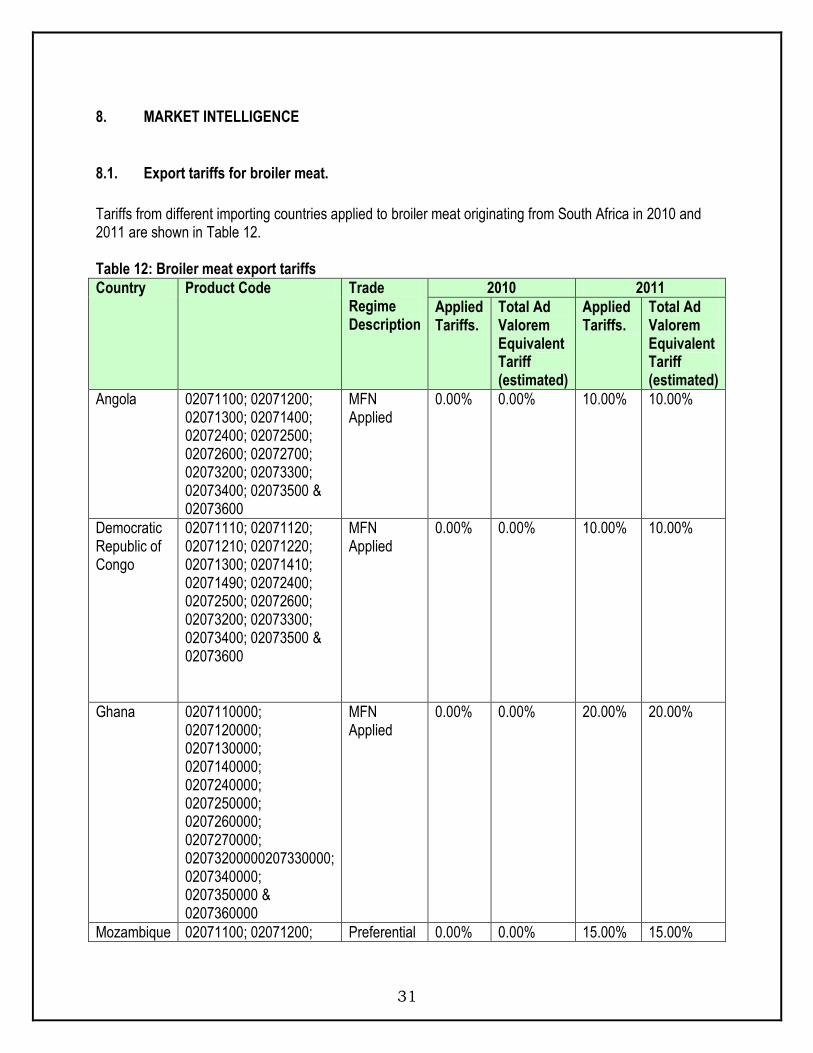
8. MARKET INTELLIGENCE
8.1. Export tariffs for broiler meat.
Tariffs from different importing countries applied to broiler meat originating from South Africa in 2010 and 2011 are shown in Table 12. Table 12: Broiler meat export tariffs
Country Product Code Trade Regime Description
2010 2011
Applied Tariffs.
Total Ad Valorem Equivalent Tariff (estimated)
Applied Tariffs.
Total Ad Valorem Equivalent Tariff (estimated)
Angola 02071100; 02071200; 02071300; 02071400; 02072400; 02072500; 02072600; 02072700; 02073200; 02073300; 02073400; 02073500 & 02073600
MFN Applied
0.00% 0.00% 10.00%
10.00%
Democratic Republic of Congo
02071110; 02071120; 02071210; 02071220; 02071300; 02071410; 02071490; 02072400; 02072500; 02072600; 02073200; 02073300; 02073400; 02073500 & 02073600
MFN Applied
0.00% 0.00% 10.00%
10.00%
Ghana 0207110000; 0207120000; 0207130000; 0207140000; 0207240000; 0207250000; 0207260000; 0207270000; 02073200000207330000; 0207340000; 0207350000 & 0207360000
MFN Applied
0.00% 0.00% 20.00%
20.00%
Mozambique 02071100; 02071200; Preferential 0.00% 0.00% 15.00% 15.00%

32
Country Product Code Trade Regime Description
2010 2011
Applied Tariffs.
Total Ad Valorem Equivalent Tariff (estimated)
Applied Tariffs.
Total Ad Valorem Equivalent Tariff (estimated)
02071300; 02071400; 02072400; 02072500; 02072600; 02072700; 02073200; 02073300; 02073400; 02073500 & 02073600
tariff for SADC
Zimbabwe 02071100; 02071200; 02071300; 02071400; 02072400; 02072500; 02072600; 02072700; 02073200; 02073300; 02073400; 02073500 & 02073600
MFN Applied
0.00% 0.00% 40.00%
40.00%
Source: MacMap
Most of South Africa’s broiler meat is exported to SADC. Most of the SADC countries removed the preferential tariffs, which was at 0% and apply different MFN tariffs. Angola and DRC apply the lowest 10% tariff to South African broiler meat exports. Zimbabwe applies the highest tariff of 40%, Ghana applies 20% and Mozambique applies 20% rate.
8.2. Import tariffs for broiler meat.
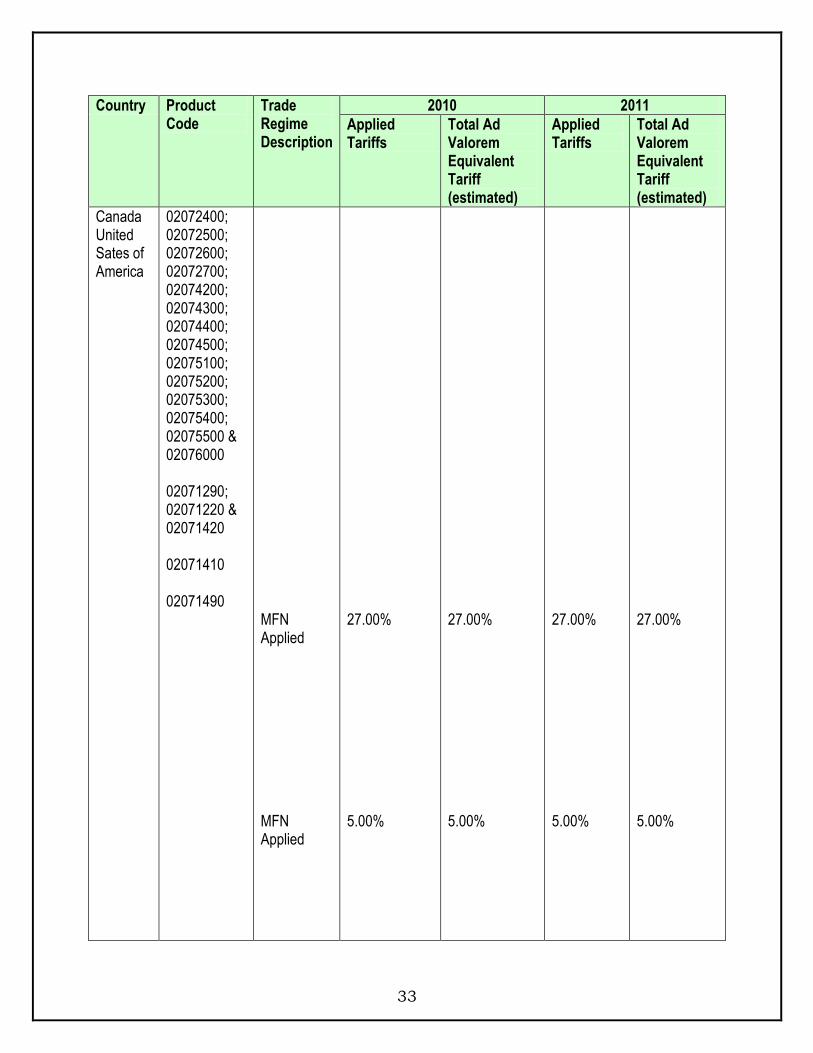
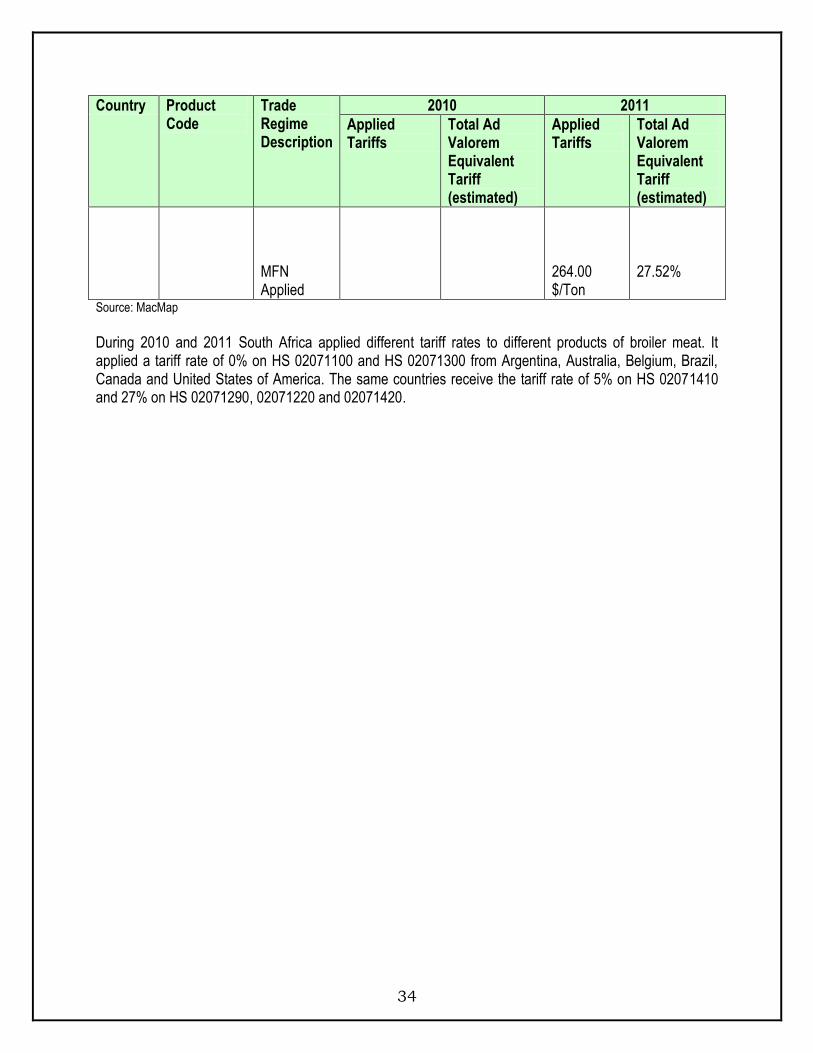
Tariffs that South Africa applied to imports of broiler meat originating from all possible countries in 2010 and 2011 are shown in Table 13. Table 13: Broiler meat import tariffs
Country Product Code
Trade Regime Description
2010 2011
Applied Tariffs
Total Ad Valorem Equivalent Tariff (estimated)
Applied Tariffs
Total Ad Valorem Equivalent Tariff (estimated)
Argentina Australia Brazil
02071100; 02071210; 02071300;
MFN Applied
0.00%
0.00%
0.00%
0.00%
33
Country Product Code
Trade Regime Description
2010 2011
Applied Tariffs
Total Ad Valorem Equivalent Tariff (estimated)
Applied Tariffs
Total Ad Valorem Equivalent Tariff (estimated)
Canada United Sates of America
02072400; 02072500; 02072600; 02072700; 02074200; 02074300; 02074400; 02074500; 02075100; 02075200; 02075300; 02075400; 02075500 & 02076000 02071290; 02071220 & 02071420 02071410 02071490
MFN Applied MFN Applied
27.00% 5.00%
27.00% 5.00%
27.00% 5.00%
27.00% 5.00%
34
Country Product Code
Trade Regime Description
2010 2011
Applied Tariffs
Total Ad Valorem Equivalent Tariff (estimated)
Applied Tariffs
Total Ad Valorem Equivalent Tariff (estimated)
MFN Applied
264.00 $/Ton
27.52%
Source: MacMap
During 2010 and 2011 South Africa applied different tariff rates to different products of broiler meat. It applied a tariff rate of 0% on HS 02071100 and HS 02071300 from Argentina, Australia, Belgium, Brazil, Canada and United States of America. The same countries receive the tariff rate of 5% on HS 02071410 and 27% on HS 02071290, 02071220 and 02071420.

35
9. PERFORMANCE ANALYSIS OF SOUTH AFRICAN POULTRY INDUSTRY IN 2011.
Table 14: List of importing markets for the Meat & edible offal of broiler exported by South Africa in 2011. South Africa’s exports represent 0.08% of world exports for Meat & edible offal of broiler, its ranking in world’s exports is 42.
Importers
Trade Indicators
Tariff (estimated)
faced by South Africa
(%)
Exported value 2011
(USD thousand)
Trade balance
2011 (USD thousand)
Share in South
Africa's exports
(%)
Exported quantity
2011
Quantity unit
Unit value (USD/unit)
Exported growth in
value between
2007-2011 (%, p.a.)
Exported growth in quantity between
2007-2011 (%, p.a.)
Exported growth in
value between
2010-2011 (%, p.a.)
Ranking of partner
countries in world imports
Share of partner
countries in world imports
(%)
Total import
growth in value of partner
countries between
2007-2011 (%, p.a.)
World 21590 -354670 100 10689 Tons 2020 58 62 -43 100 9
Mozambique 13894 13894 64.4 6533 Tons 2127 77 71 -9 78 0.1 30 15
Zimbabwe 5614 5614 26 3300 Tons 1701 165 150 -71 120 0 191 40
Ghana 612 612 2.8 166 Tons 3687 65 60 75 35 0.7 20 20
Democratic Republic of the Congo 399 399 1.8 222 Tons 1797 8 -2 -56 50 0.3 12 10
Zambia 293 293 1.4 215 Tons 1363 182 260 146 175 0 4.5
Angola 290 290 1.3 100 Tons 2900 -7 -10 -47 15 1.6 28 10
Saint Helena 116 116 0.5 40 Tons 2900 10 6 -26 199 0 -5
Nigeria 107 107 0.5 26 Tons 4115 -29 -25 346 149 0 39 20
French South Antarctic Territories 42 42 0.2 18 Tons 2333 111 203 0 -39
United Arab Emirates 40 -51 0.2 7 Tons 5714 -9 -20 -83 13 2.2 10 5
Netherlands 33 -43363 0.2 27 Tons 1222 -43 -22 10 3.2 -1 0
Source: ITC calculations based on COMTRADE statistics.

36
Table 14 shows that during 2011 South Africa exported a total of 10 689 tons of meat & edible offal of broiler at an average value of US$ 2 020/unit. The major export destinations for meat & edible offal of broiler originating from South Africa during 2011 were Mozambique, Zimbabwe, and Ghana. The greatest share of South Africa’s meat & edible offal of broiler exports were exported to Mozambique which commanded a share of 64.4% during the year 2011 followed by Zimbabwe which commanded 26%. South Africa’s meat & edible offal of broiler exports increased by 58% in value and 62% in quantity between the periods 2007 and 2011. During the same period, exports for meat & edible offal of broiler to Mozambique increased by 77% in value while in quantity it increased by 71%; and exports to Zimbabwe increased by 165% in value while quantity increased by 150%. Between the periods 2010 and 2011, South Africa’s exports value of meat & edible offal of broiler decreased by 43%. During the same period, exports value of meat & edible offal of broiler to Mozambique decreased by 9% and Zimbabwe experienced decreased by 71%. This shows that Mozambique and Zimbabwe are the net importer of South African meat & edible offal of broiler.

37
Figure 26: Growth in demand for poultry meat exported by South Africa in 2011
Source: Trademap, ITC

38
Figure 26 illustrates that between 2007 and 2011 South Africa’s meat & edible offal of broiler exports to Netherlands, United Arab Emirates, Democratic Republic of Congo, Angola, Nigeria, Seychelles and Uganda were growing at a rate that is less than their import growth from the rest of the world. They all represent gains in the dynamic markets of South African export for meat & edible offal of poultry except Netherlands which represent losses in the declining market. During the same period, South Africa’s meat & edible offal of broiler exports to United Kingdom, Ghana, Mozambique and Saint Helena were growing at a rate that is greater than their imports from the rest of the world. Further analysis shows that they all represent gains in the dynamic markets excluding United Kingdom which represent gains in the declining markets of South African export for meat & edible offal of poultry. The most growth in demand of South African meat & edible offal poultry is from Uganda and Malawi with annual import growth of 181% and 153% respectively.

39
Figure 27: Prospects for market diversification for poultry meat exported by South Africa in 2011
Source: Trademap, ITC

40
Figure 27 above shows the prospects for market diversification for meat & edible offal of broiler exports by South Africa in 2011. The analysis of the results as shown on the figure above shows that Mozambique commanded the greatest shares (64%) of South Africa’s meat & edible offal of broiler exports during the year 2011, and it further shows that Mozambique’s imports growth has also increased by 30% during the period under review. If South Africa is to diversify its meat & edible offal of broiler exports, the most attractive market for South Africa will be Zimbabwe and Uganda. Although Zimbabwe has a share of 26% of South Africa’s broiler meat exports, its import growth from the world is still greater than South Africa’s exports to Zimbabwe. Therefore, South Africa needs to penetrate the Zimbabwean market because its import growth is high (191%). Uganda is the small market but its import growth is at 181%, South Africa can therefore penetrate their market.

41
Table 14: List of supplying markets for Meat & edible offal of broiler imported by South Africa in 2011. South Africa’s imports represent 1.15% of world’s imports of Meat & edible offal of broiler, its ranking in world’s imports is 17.
Exporters
Trade Indicators
Tariff (estimate
d) applied
by South Africa (%)
Imported value 2011 (USD
thousand)
Trade balance
2011 (USD
thousand)
Share in
South Africa'
s imports (%)
Imported
quantity 2011
Quantity unit
Unit value
(USD/unit)
Imported
growth in value between 2007-
2011 (%, p.a.)
Imported
growth in
quantity between 2007-
2011 (%, p.a.)
Imported
growth in value between 2010-
2011 (%, p.a.)
Ranking of
partner countrie
s in world
exports
Share of partner countrie
s in world
exports (%)
Total export growth in value
of partner countrie
s between 2007-
2011 (%, p.a.)
World 376260 -354670 100 349417 Tons 1077 13 7 57 100 8
Brazil 202350 -202350 53.8 199370 Tons 1015 5 1 13 1 28.4 11 18.1
Netherlands 43396 -43363 11.5 30940 Tons 1403 469 355 10159 3 8.9 2 0
United Kingdom 24714 -24705 6.6 20951 Tons 1180 335 253 302 11 1.9 5 0
Argentina 22999 -22999 6.1 28924 Tons 795 11 7 16 14 1.2 2 18.1
Canada 21030 -21030 5.6 19036 Tons 1105 13 6 14 17 1 2 18.1
United States of America 13245 -13239 3.5 9416 Tons 1407 14 7 175 2 17.7 6 18.1
Denmark 9546 -9546 2.5 7086 Tons 1347 400 2566 19 0.8 -7 0
Ireland 8585 -8585 2.3 7473 Tons 1149 1283 655 23 0.5 -1 0
Belgium 8252 -8252 2.2 6517 Tons 1266 21 3 372 7 4 8 0
Australia 6859 -6859 1.8 6067 Tons 1131 -11 -19 33 31 0.2 12 18.1
France 4042 -4042 1.1 3990 Tons 1013 30 12 186 4 5.8 3 0
Thailand 3760 -3760 1 2425 Tons 1551 1133 24 0.5 27 18.1
Germany 3009 -3009 0.8 2855 Tons 1054 67 57 10276 6 4.3 4 0
Spain 2664 -2664 0.7 2351 Tons 1133 3549 16 1.1 16 0
Chile 714 -714 0.2 966 Tons 739 210 53 15 1.1 16 18.1
Sources: ITC calculations based on COMTRADE statistics.

42
Table 14 shows that during 2011 South Africa imported a total of 349 417 tons of meat & edible offal of broiler at an average value of US$ 1 077/unit. The major origins for meat & edible offal of broiler imported by South Africa during 2011 were Brazil, Netherland, United Kingdom, Argentina, Canada and United States of America. The greatest share of South African meat & edible offal of broiler imports were from Brazil which commanded 53.80% during 2011. There is an increase of 32% compared to last year (2010). South Africa’s meat & edible offal of broiler imports increased by 13% in value and decreased by 7% in quantity between the periods 2007 and 2011. During the same period, imports of meat & edible offal of broiler from Brazil also increased by 5% in value and decreased by 1% in quantity while imports from Netherlands increased by 469% in value and 355% in quantity. Broiler meat exports from United Kingdom increased by335% in value and 253% in quantity compared to the period 2007 and 2011. Between the periods 2010 and 2011 South Africa’s imports for meat & edible offal of broiler increased by 57% in value. During the same period, imports of meat & edible offal of broiler from Brazil increased by 13% and Netherlands experienced the highest increased by 10159% in value.

43
Figure 28: Competitiveness of suppliers to South Africa for poultry meat imported in 2011
Source: Trademap, ITC

44
Figure 28 illustrates that between 2007 and 2011 South Africa’s meat & edible offal of broiler imports from Brazil and Australia were growing at a rate that is less than their export growth to the rest of the world. During the same period, South Africa’s meat & edible offal of broiler imports from United States of America, Belgium, Canada, Argentina, France, Germany, United Kingdom, Netherlands and United Arab Emirates were growing at a rate that is greater than their exports to the rest of the world. Generally the most competitive market is Brazil followed by United States of America. Their share in the world market of meat & edible offal of broiler is 28.4% and 17.7% respectively and together they constitute a total of 46% of the world‘s meat & edible offal of broiler.

45
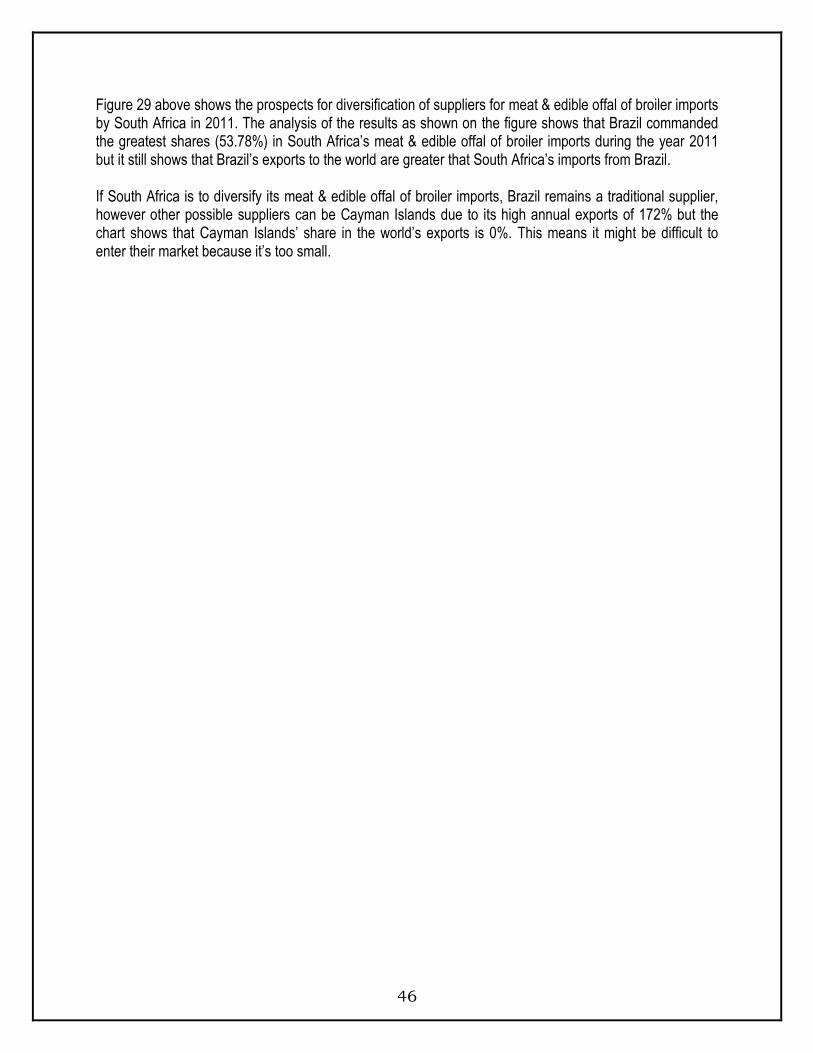
Figure 29: Prospects for diversification of suppliers for poultry meat imported by South Africa in 2011
Source: Trademap, ITC
46
Figure 29 above shows the prospects for diversification of suppliers for meat & edible offal of broiler imports by South Africa in 2011. The analysis of the results as shown on the figure shows that Brazil commanded the greatest shares (53.78%) in South Africa’s meat & edible offal of broiler imports during the year 2011 but it still shows that Brazil’s exports to the world are greater that South Africa’s imports from Brazil. If South Africa is to diversify its meat & edible offal of broiler imports, Brazil remains a traditional supplier, however other possible suppliers can be Cayman Islands due to its high annual exports of 172% but the chart shows that Cayman Islands’ share in the world’s exports is 0%. This means it might be difficult to enter their market because it’s too small.

47
10. ACKNOWLEDGEMENTS
Astral Foods Limited Tel: 012 347 5077 Fax: 012 347 5308 www.astralfoods.co.za Competition commission Tel: 012 394 3300 Fax: 012 394 0169 www.comptrib.co.za Agricultural Statistics Tel: 012 319 8453 Fax: 012 319 8031 www.daff.gov.za. Market Access Map www.macmap.org. National Agricultural Marketing Council Chicken Meat Industry Overview Research Report (2007 – 03) Tel: 012 341 1115 www.namc.co.za Broiler Site www.thepoultrysite.com Quantec Easydata www.easydata.co.za Rainbow P.O. Box 2734 Westville, 3630 Tel: 031 242 8500 Fax: 031 242 8890 www.rainbowchickens.co.za South African Poultry Association (SAPA), Zach Coetzee P.O. Box 1192 Honeydew, 2040 Tel: 011-795 2051 Fax: 011-795 3180 www.sapa.org.za.
TradeMap www.trademap.org. Tydstroom Klipheuwel Road Durbanville, 7550 Tel: 021 975 0162 Fax: 021 976 8987 www.tydstroom.co.za

48
Disclaimer: This document and its contents have been compiled by the Department of Agriculture, forestry and fisheries for the purpose of detailing the broiler meat industry. The views expressed in this document are those of the Department of Agriculture, forestry and fisheries with regard to agricultural industry, unless otherwise stated and, therefore the Department of Agriculture, forestry and fisheries does not accept responsibility for any errors in such information and anyone acting on such information does so entirely at his or her own risk.