A Production and Economic Model for Hedgerow …...A Production and Economic Model for Hedgerow...
15
A Producon and Economic Model for Hedgerow Hazelnut Producon in the Midwestern United States Jason Fischbach & Lois Braun February 2017
Transcript of A Production and Economic Model for Hedgerow …...A Production and Economic Model for Hedgerow...
A Production and Economic Model for
Hedgerow Hazelnut Production
in the Midwestern United States
Jason Fischbach & Lois Braun
February 2017
2
The Upper Midwest Hazelnut Development Initiative (UMHDI) is a collaboration of researchers at the
University of Wisconsin and University of Minnesota working with early-adopter growers and stakeholders
to develop a sustainable hazelnut industry in the Upper Midwest. The Hazelnut Improvement Program
(HIP) is a participatory hazelnut breeding program involving growers and University researchers. More
information about the UMHDI or HIP can be found at www.midwesthazelnuts.org or by calling 715-373-6104
ext 5.
This report could not have been possible without the great work of other members of the UMHDI Research
Team, in particular: Dr. Mike Demchik (University of Wisconsin—Stevens Point), Dr. Brent McCown (Knight
Hollow Nursery), and Dr. Don Wyse (University of Minnesota—St. Paul). Many thanks as well to the interns
and research assistants at U of MN and UW-Extension for their careful data collection. Finally, the emerging
hazelnut industry in the Upper Midwest is a product of the many early-adopter growers that have carried
the weight of developing their new industry.
This report was supported by grants from the United States Department of Agriculture — National Institute
of Food and Agriculture (USDA-NIFA) Specialty Crops Research Initiative (SCRI), Wisconsin Specialty Crop
Block Grant program (SCBG), and the Sustainable Agriculture Research and Education (SARE) Farmer/
Rancher Grant program.
Corresponding Author: Jason Fischbach, UW-Extension Food and Energy Woody Crop Specialist
[email protected] 715-373-6104 ext 5.
Publication design and layout by: Jason Fischbach
Cover photo credits: Photo of Lois Braun in Block C of the St. Paul Hazelnut Germplasm Performance Trial—Dave
Hansen
Editorial reviews provided by Mike Demchik and Brent McCown
3
Introduction
Efforts to develop suitable hazelnut genetics for the Eastern and Midwestern United States extend back more
than 100 years and have focused on combining the nut size and productivity of European hazelnut (Corylus
avellana) with the winter hardiness and Eastern Filbert Blight (EFB) resistance of American hazelnut (Corylus
americana) (Molnar et al, 2005). These efforts have been widespread over the years with breeding work
conducted in Pennsylvania, New York, Wisconsin, Minnesota, and Maryland by individuals with an interest
and passion for hazelnut breeding, but often lacking the resources and institutional longevity necessary to
bring proven cultivars to market. In the Upper Midwest, first Carl Weschke of River Falls, WI (Weschke, 1954)
and now Phil Rutter of Canton, MN (Rutter, 1991) and Mark Shepard of Viola, WI (Shepard, 2013) have been
establishing half-sibling populations of C. avellana x americana hybrid seedlings and saving seed from top
performing plants. Seedlings from these top plants have been sold to early-adopter growers throughout the
Midwest with at least 135 such growers in WI and MN alone growing a total of nearly 70,000 seedlings
(Fischbach, 2010).
Upper Midwest Hazelnut Development Initiative
In order to help develop a hazelnut industry in the Upper Midwest, we launched the Upper Midwest Hazelnut
Development Initiative (UMHDI) in 2007 with four primary objectives: 1) Develop proven hazelnut germplasm
capable of supporting an economically-viable hazelnut industry in the Upper Midwest, 2) Develop
propagation protocols necessary to provide clonal material of select genotypes to growers at reasonable
cost, 3) Develop appropriately-scaled harvesting and processing equipment tailored to the select germplasm,
and 4) Develop an agronomic and production system with a robust outreach education program to support
sustainable hazelnut production. In this paper we outline the
hedgerow production system we envision for the Upper
Midwest and present genotype performance and economic
data to support the system.
Hedgerow Production System
Commercial hazelnut production in the U.S. is centered in the
Willamette Valley of Oregon and is based on tree-form
cultivars of C. avellana where large in-shell nuts fall free from
the husk when ripe and are swept off the orchard floor. The
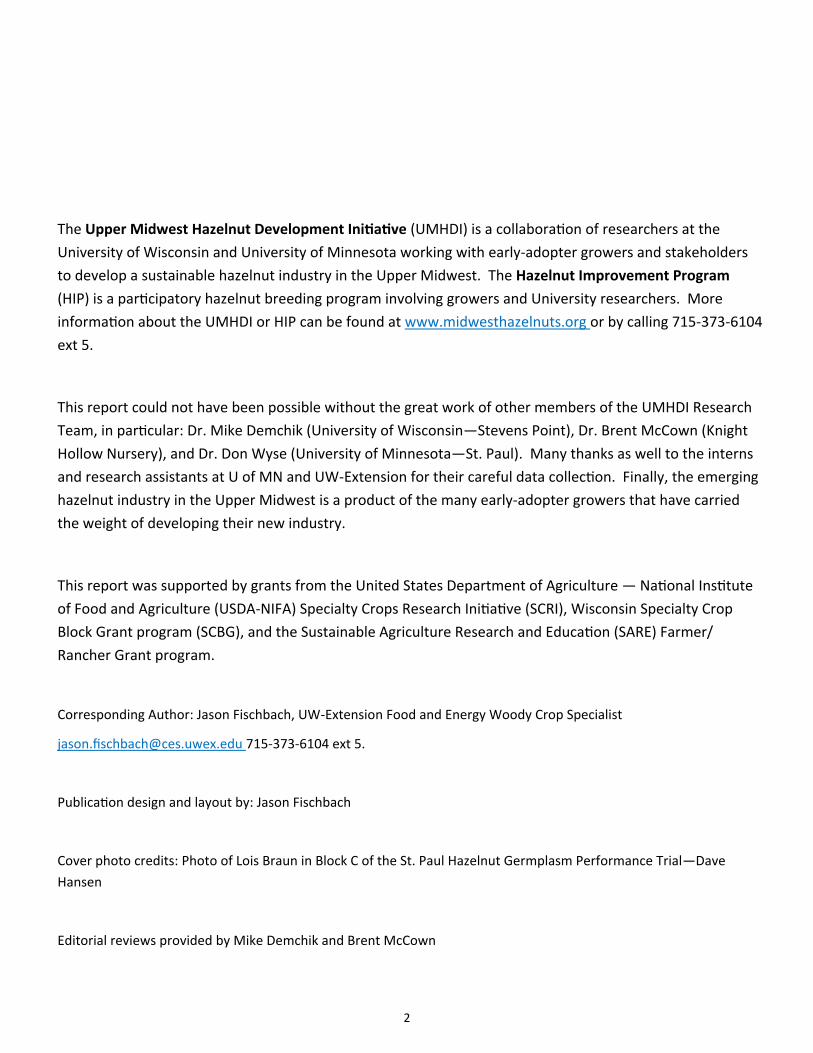
system we envision for the Upper Midwest is modelled after
bush-fruit systems with nut clusters mechanically harvested
direct from hazelnut hedgerows (Photo 1). We envision a
Midwest hazelnut industry based on high volume production
of relatively small but high-quality uniform kernels for fresh
and processing markets. Our focus has been to develop
precocious, high-yielding, compact, multi-stem genotypes
with the American hazelnut growth form (Photo 2). We are
working to adapt blueberry and Aronia harvesting equipment
Photo 1. In-husk nut clusters are harvested
directly from the hedgerows. Growers are
currently using blueberry harvesters, but work is
underway to develop more effective equipment.
Photo: Dave Bohnhoff
4
to remove the clusters of in-husk nuts from the hedgerow and mechanically remove the husk as part of the
harvest process. We are also developing mechanized pruning and hedgerow management systems.
The advantages of the hedgerow system we envision are threefold. First, a hedgerow system accommodates
the natural bushy growth habit of native C. americana and its hybrids, allowing us to select first generation
high-performing germplasm directly from existing on-farm and wild populations. Second, harvesting the
nuts directly from the hedgerow allows for a more biologically diverse orchard floor that better protects
water and soil quality. Finally, harvesting directly from the hedgerow avoids some of the food safety risks of
sweeping nuts off the ground. The primary disadvantage of the hedgerow system is a possible reduction in
per acre yields compared to the Oregon tree-based model due to the open row middles between hedgerows
necessary for harvesting and equipment access. At maturity, an Oregon planting has a closed canopy with
nearly 100% of the acre in production with estimated yields of over 2800 lbs of in-shell nuts per acre (Miller
et al., 2013). Even by maximizing fruiting area through narrow hedgerows and narrow row middles the
hedgerow system will utilize roughly only 50% of an acre. Whether per acre yields of the hedgerow system
will actually be lower than the Oregon tree-based system depends on the productivity of the germplasm, and
whether it matters economically depends ultimately on the per pound cost of production and market value
of the nuts.
Performance and Production Potential of Select Hybrids
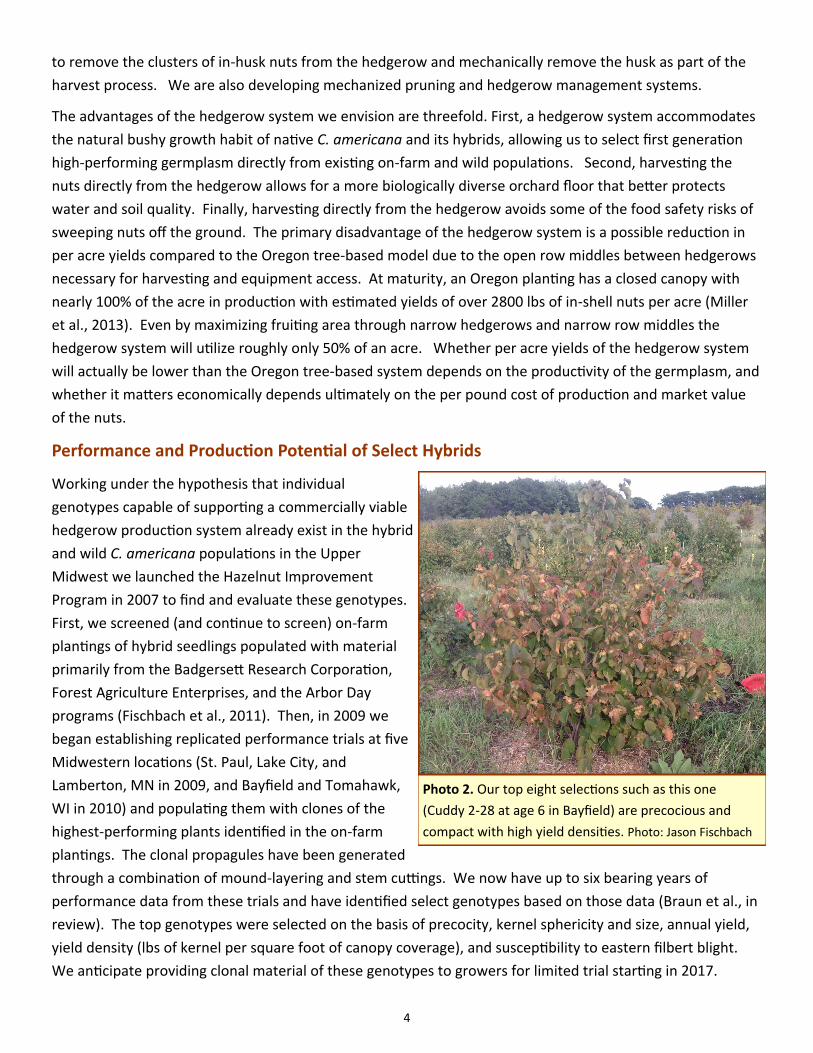
Working under the hypothesis that individual
genotypes capable of supporting a commercially viable
hedgerow production system already exist in the hybrid
and wild C. americana populations in the Upper
Midwest we launched the Hazelnut Improvement
Program in 2007 to find and evaluate these genotypes.
First, we screened (and continue to screen) on-farm
plantings of hybrid seedlings populated with material
primarily from the Badgersett Research Corporation,
Forest Agriculture Enterprises, and the Arbor Day
programs (Fischbach et al., 2011). Then, in 2009 we
began establishing replicated performance trials at five
Midwestern locations (St. Paul, Lake City, and
Lamberton, MN in 2009, and Bayfield and Tomahawk,
WI in 2010) and populating them with clones of the
highest-performing plants identified in the on-farm
plantings. The clonal propagules have been generated
through a combination of mound-layering and stem cuttings. We now have up to six bearing years of
performance data from these trials and have identified select genotypes based on those data (Braun et al., in
review). The top genotypes were selected on the basis of precocity, kernel sphericity and size, annual yield,
yield density (lbs of kernel per square foot of canopy coverage), and susceptibility to eastern filbert blight.
We anticipate providing clonal material of these genotypes to growers for limited trial starting in 2017.
Photo 2. Our top eight selections such as this one
(Cuddy 2-28 at age 6 in Bayfield) are precocious and
compact with high yield densities. Photo: Jason Fischbach
5
Kernel Yield
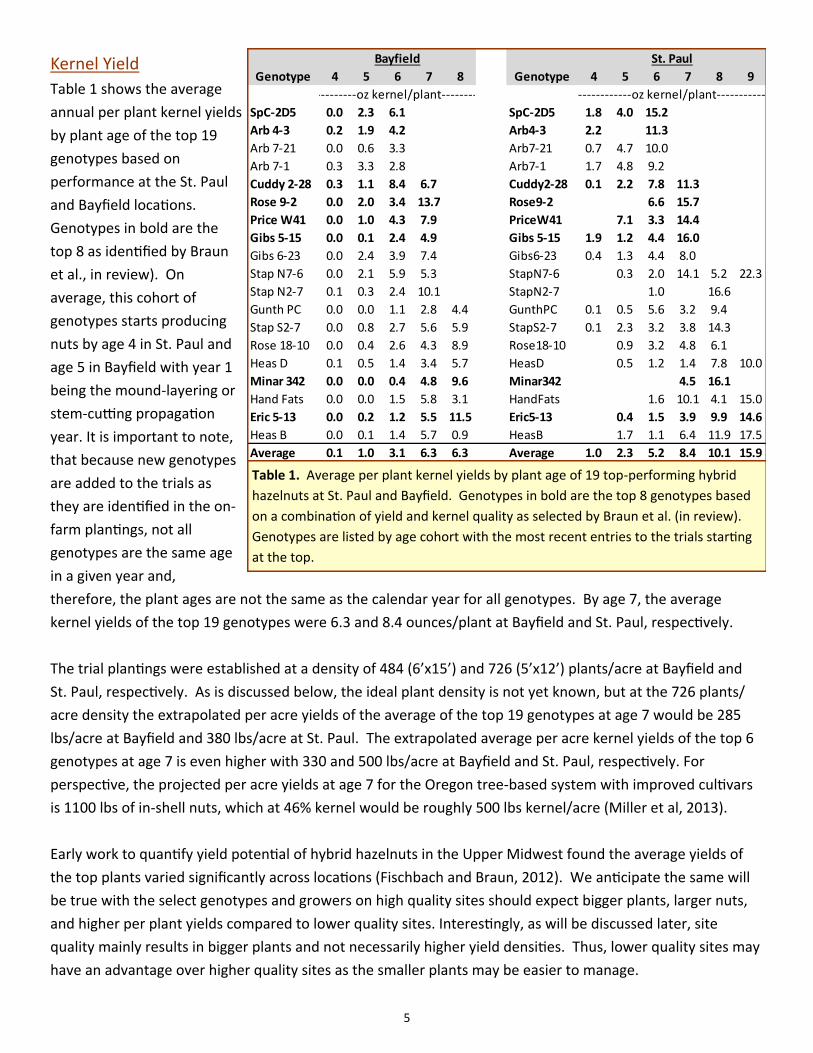
Table 1 shows the average
annual per plant kernel yields
by plant age of the top 19
genotypes based on
performance at the St. Paul
and Bayfield locations.
Genotypes in bold are the
top 8 as identified by Braun
et al., in review). On
average, this cohort of
genotypes starts producing
nuts by age 4 in St. Paul and
age 5 in Bayfield with year 1
being the mound-layering or
stem-cutting propagation
year. It is important to note,
that because new genotypes
are added to the trials as
they are identified in the on-
farm plantings, not all
genotypes are the same age
in a given year and,
therefore, the plant ages are not the same as the calendar year for all genotypes. By age 7, the average
kernel yields of the top 19 genotypes were 6.3 and 8.4 ounces/plant at Bayfield and St. Paul, respectively.
The trial plantings were established at a density of 484 (6’x15’) and 726 (5’x12’) plants/acre at Bayfield and
St. Paul, respectively. As is discussed below, the ideal plant density is not yet known, but at the 726 plants/
acre density the extrapolated per acre yields of the average of the top 19 genotypes at age 7 would be 285
lbs/acre at Bayfield and 380 lbs/acre at St. Paul. The extrapolated average per acre kernel yields of the top 6
genotypes at age 7 is even higher with 330 and 500 lbs/acre at Bayfield and St. Paul, respectively. For
perspective, the projected per acre yields at age 7 for the Oregon tree-based system with improved cultivars
is 1100 lbs of in-shell nuts, which at 46% kernel would be roughly 500 lbs kernel/acre (Miller et al, 2013).
Early work to quantify yield potential of hybrid hazelnuts in the Upper Midwest found the average yields of
the top plants varied significantly across locations (Fischbach and Braun, 2012). We anticipate the same will
be true with the select genotypes and growers on high quality sites should expect bigger plants, larger nuts,
and higher per plant yields compared to lower quality sites. Interestingly, as will be discussed later, site
quality mainly results in bigger plants and not necessarily higher yield densities. Thus, lower quality sites may
have an advantage over higher quality sites as the smaller plants may be easier to manage.
Genotype 4 5 6 7 8 Genotype 4 5 6 7 8 9
SpC-2D5 0.0 2.3 6.1 SpC-2D5 1.8 4.0 15.2
Arb 4-3 0.2 1.9 4.2 Arb4-3 2.2 11.3
Arb 7-21 0.0 0.6 3.3 Arb7-21 0.7 4.7 10.0
Arb 7-1 0.3 3.3 2.8 Arb7-1 1.7 4.8 9.2
Cuddy 2-28 0.3 1.1 8.4 6.7 Cuddy2-28 0.1 2.2 7.8 11.3
Rose 9-2 0.0 2.0 3.4 13.7 Rose9-2 6.6 15.7
Price W41 0.0 1.0 4.3 7.9 PriceW41 7.1 3.3 14.4
Gibs 5-15 0.0 0.1 2.4 4.9 Gibs 5-15 1.9 1.2 4.4 16.0
Gibs 6-23 0.0 2.4 3.9 7.4 Gibs6-23 0.4 1.3 4.4 8.0
Stap N7-6 0.0 2.1 5.9 5.3 StapN7-6 0.3 2.0 14.1 5.2 22.3
Stap N2-7 0.1 0.3 2.4 10.1 StapN2-7 1.0 16.6
Gunth PC 0.0 0.0 1.1 2.8 4.4 GunthPC 0.1 0.5 5.6 3.2 9.4
Stap S2-7 0.0 0.8 2.7 5.6 5.9 StapS2-7 0.1 2.3 3.2 3.8 14.3
Rose 18-10 0.0 0.4 2.6 4.3 8.9 Rose18-10 0.9 3.2 4.8 6.1
Heas D 0.1 0.5 1.4 3.4 5.7 HeasD 0.5 1.2 1.4 7.8 10.0
Minar 342 0.0 0.0 0.4 4.8 9.6 Minar342 4.5 16.1
Hand Fats 0.0 0.0 1.5 5.8 3.1 HandFats 1.6 10.1 4.1 15.0
Eric 5-13 0.0 0.2 1.2 5.5 11.5 Eric5-13 0.4 1.5 3.9 9.9 14.6
Heas B 0.0 0.1 1.4 5.7 0.9 HeasB 1.7 1.1 6.4 11.9 17.5
Average 0.1 1.0 3.1 6.3 6.3 Average 1.0 2.3 5.2 8.4 10.1 15.9
-----------------------oz kernel/plant----------------------
St. PaulBayfield
-----------------------oz kernel/plant----------------------
Table 1. Average per plant kernel yields by plant age of 19 top-performing hybrid
hazelnuts at St. Paul and Bayfield. Genotypes in bold are the top 8 genotypes based
on a combination of yield and kernel quality as selected by Braun et al. (in review).
Genotypes are listed by age cohort with the most recent entries to the trials starting
at the top.
6
Kernel Quality
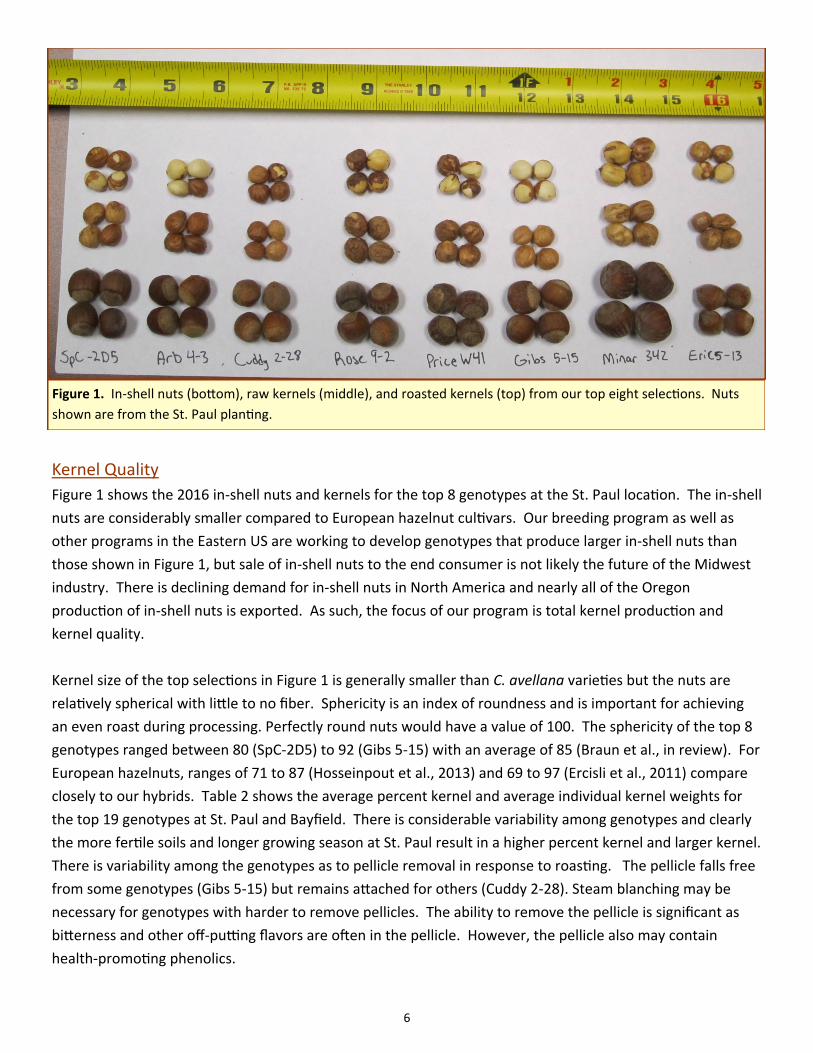
Figure 1 shows the 2016 in-shell nuts and kernels for the top 8 genotypes at the St. Paul location. The in-shell
nuts are considerably smaller compared to European hazelnut cultivars. Our breeding program as well as
other programs in the Eastern US are working to develop genotypes that produce larger in-shell nuts than
those shown in Figure 1, but sale of in-shell nuts to the end consumer is not likely the future of the Midwest
industry. There is declining demand for in-shell nuts in North America and nearly all of the Oregon
production of in-shell nuts is exported. As such, the focus of our program is total kernel production and
kernel quality.
Kernel size of the top selections in Figure 1 is generally smaller than C. avellana varieties but the nuts are
relatively spherical with little to no fiber. Sphericity is an index of roundness and is important for achieving
an even roast during processing. Perfectly round nuts would have a value of 100. The sphericity of the top 8
genotypes ranged between 80 (SpC-2D5) to 92 (Gibs 5-15) with an average of 85 (Braun et al., in review). For
European hazelnuts, ranges of 71 to 87 (Hosseinpout et al., 2013) and 69 to 97 (Ercisli et al., 2011) compare
closely to our hybrids. Table 2 shows the average percent kernel and average individual kernel weights for
the top 19 genotypes at St. Paul and Bayfield. There is considerable variability among genotypes and clearly
the more fertile soils and longer growing season at St. Paul result in a higher percent kernel and larger kernel.
There is variability among the genotypes as to pellicle removal in response to roasting. The pellicle falls free
from some genotypes (Gibs 5-15) but remains attached for others (Cuddy 2-28). Steam blanching may be
necessary for genotypes with harder to remove pellicles. The ability to remove the pellicle is significant as
bitterness and other off-putting flavors are often in the pellicle. However, the pellicle also may contain
health-promoting phenolics.
Figure 1. In-shell nuts (bottom), raw kernels (middle), and roasted kernels (top) from our top eight selections. Nuts
shown are from the St. Paul planting.
7
The average width of the hazelnut kernels from
our top selections range from 8 to 12mm (data
not shown), which means our Midwest-grown
hazelnuts would fall into the Medium, Small, or
Whole & Broken size classes used for Oregon
hazelnuts. As shown in Table 2, growing
conditions will affect kernel size with higher
fertility sites producing larger kernels, but even
on the best sites, kernel size will likely be
smaller than kernels from Oregon. The small
size kernels from these initial selections will
likely require aggressive marketing and
consumer education if selling whole kernels,
particularly if sold in competition with the larger
kernels from Oregon. In the short term when
production scale is relatively limited, growers
will likely have success with direct sales to
customers via farmers markets, CSA, on-farm
sales or to retailers with a customer base
valuing locally-produced and source-identified
foods. At a larger scale of production, the
Midwest industry will likely need to add value
to the hazelnuts with some sort of processing.
Producing oil, flour, confections, and spreads
are all possibilities, but will require entrepreneurs with the skills necessary to develop and market branded
food products. Large food processing companies might also find smaller kernels preferable for products such
as cereals or trail mixes. Selling the smaller kernels as whole kernels to consumers on a large scale might also
be possible, but will require aggressive marketing and
consumer education. For example, consumers are used
to eating handfuls of roasted salted peanuts, why not
handfuls of roasted salted hazelnuts?
Per Acre Production Potential
Whether some or any of the eight selections are
productive enough to support economically-viable
production will depend on a range of variables including
the productivity per unit area of the agronomic system
in which they are grown and the per pound cost of
production of that system. Most woody-perennial
specialty crop production systems are utilizing high-
density plantings to improve profitability by maximizing
Table 2. Five year (St. Paul) and three year (Bayfield) average
individual kernel weight and % kernel of 19 top-performing
hybrid hazelnuts. Genotypes in bold are the top 8 genotypes
based on a combination of yield and kernel quality as selected by
Braun et al. (in review). Genotypes are listed in decreasing St.
Paul kernel weight.
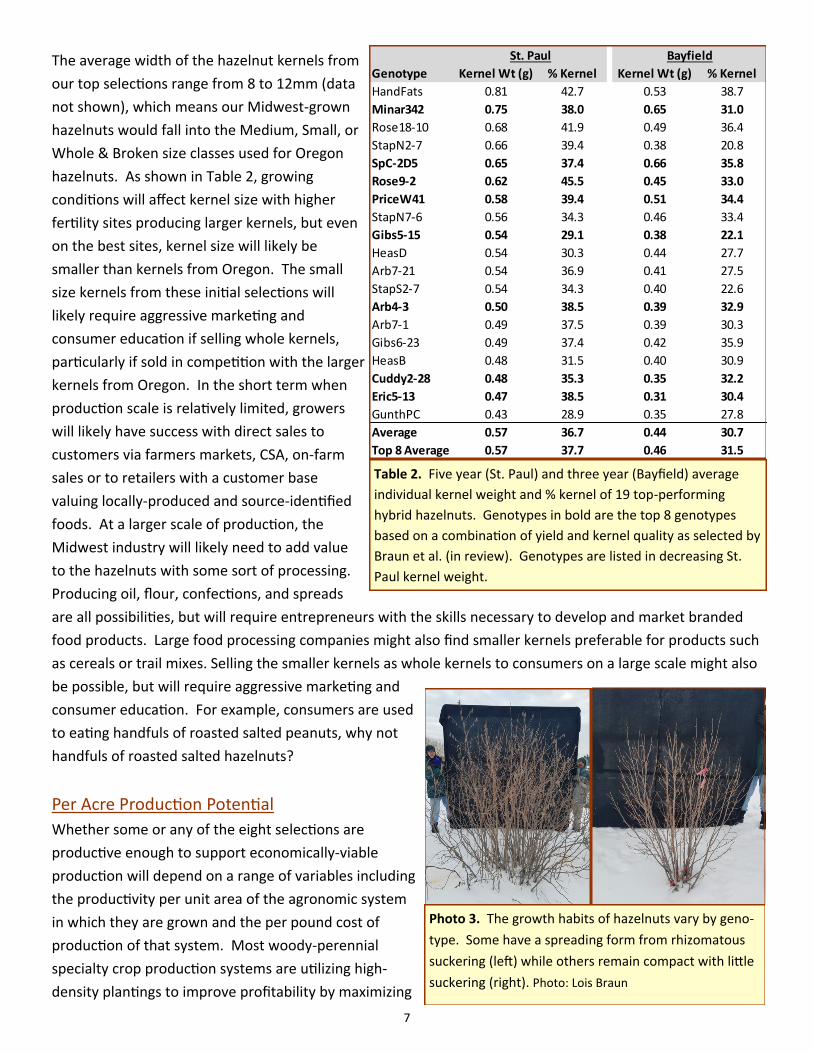
Photo 3. The growth habits of hazelnuts vary by geno-
type. Some have a spreading form from rhizomatous
suckering (left) while others remain compact with little
suckering (right). Photo: Lois Braun
Genotype Kernel Wt (g) % Kernel Kernel Wt (g) % Kernel
HandFats 0.81 42.7 0.53 38.7
Minar342 0.75 38.0 0.65 31.0
Rose18-10 0.68 41.9 0.49 36.4
StapN2-7 0.66 39.4 0.38 20.8
SpC-2D5 0.65 37.4 0.66 35.8
Rose9-2 0.62 45.5 0.45 33.0
PriceW41 0.58 39.4 0.51 34.4
StapN7-6 0.56 34.3 0.46 33.4
Gibs5-15 0.54 29.1 0.38 22.1
HeasD 0.54 30.3 0.44 27.7
Arb7-21 0.54 36.9 0.41 27.5
StapS2-7 0.54 34.3 0.40 22.6
Arb4-3 0.50 38.5 0.39 32.9
Arb7-1 0.49 37.5 0.39 30.3
Gibs6-23 0.49 37.4 0.42 35.9
HeasB 0.48 31.5 0.40 30.9
Cuddy2-28 0.48 35.3 0.35 32.2
Eric5-13 0.47 38.5 0.31 30.4
GunthPC 0.43 28.9 0.35 27.8
Average 0.57 36.7 0.44 30.7
Top 8 Average 0.57 37.7 0.46 31.5
BayfieldSt. Paul
8
fruiting area and early per acre yields. Simply
increasing plant density can improve early yields,
but can reduce yields long-term due to interplant
competition. Minimizing this competition is
typically done with a combination of dwarfing
rootstock and regular pruning, or as with double-
density hazelnut plantings in Oregon, by removing
a portion of the plants once the canopy closes.
Thus, the per acre production potential of our top
genotypes when grown in a more optimized
system than the spaced-plant system used in our
trials will likely be much higher.
Plant Density
Research is underway to determine exactly how
to optimize per acre yields of our hedgerow
system with our select genotypes, and we are
pursuing two strategies. First, we have selected
genotypes with compact size by selecting for high
precocity, annual bearing, and small plant size.
With such compact genotypes we anticipate an
initial in-row plant spacing of 4 feet and possibly
less. Just how large the select genotypes will get
remains to be seen and will depend on site
fertility, but if competition is severe, every other
or every third plant could be removed and a
continuous hedgerow still maintained. Of our top
genotypes, some have considerable rhizomatous
suckering (Photo 3) with a spreading growth habit, while others have little to no suckering (Photo 3) with a
compact growth habit. Thus, optimal planting density may vary depending on growth habit and we will be
conducting plant density trials to determine the optimal spacing.
Size Management
Once the plants fill the growing space within the hedgerow some form of pruning or mowing will be
necessary to control plant size and replace old wood with new wood. One option we are investigating is
renewal pruning where a portion of the oldest wood is removed periodically and the younger stems are
thinned. Such renewal pruning is common in high-bush blueberries, but is labor intensive and not likely
practical except for small plantings. Another option is whole plant coppicing at 8-12 year intervals. Such
coppicing is recommended by Rutter et al. (2015), however our preliminary trials with whole plant coppicing
have found that it eliminates two years of yield and a plant’s response to the coppicing is highly variable and
genotype dependent. To avoid losing 2-3 years of yield, we will be investigating a half-plant coppice
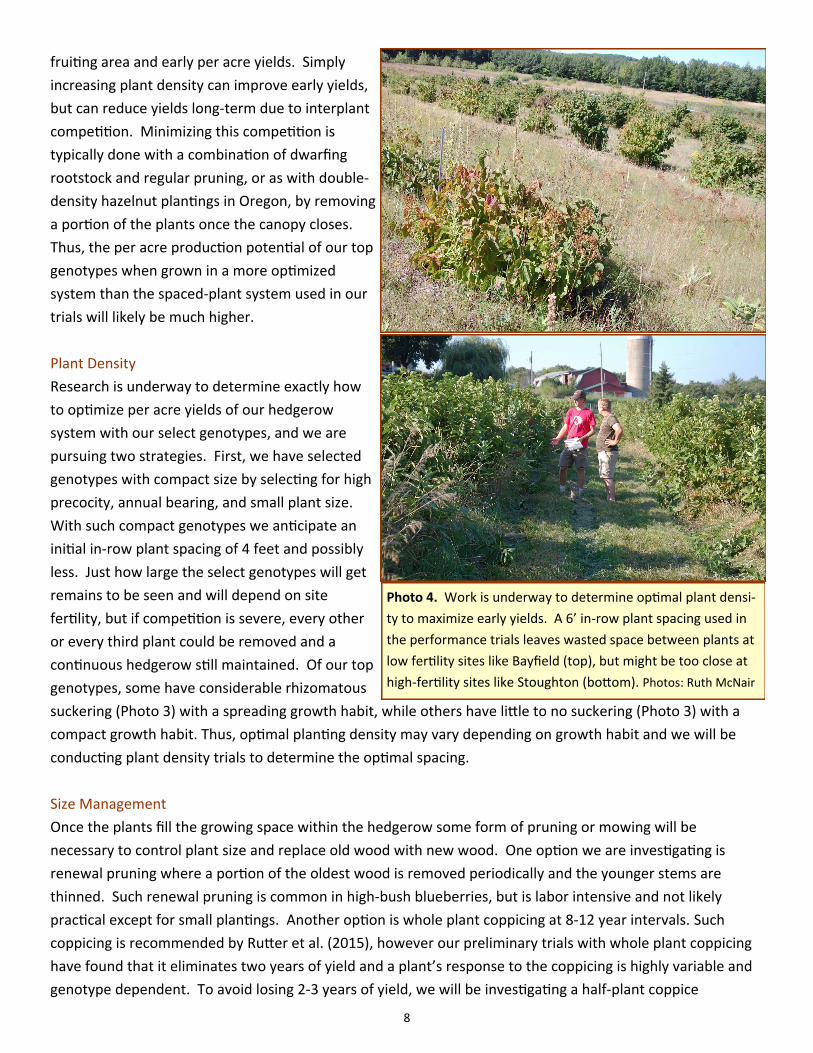
Photo 4. Work is underway to determine optimal plant densi-
ty to maximize early yields. A 6’ in-row plant spacing used in
the performance trials leaves wasted space between plants at
low fertility sites like Bayfield (top), but might be too close at
high-fertility sites like Stoughton (bottom). Photos: Ruth McNair
9
approach where half of each plant is coppiced
periodically. For our suckering genotypes this
method would involve using a sickle-bar
mower to narrow the hedgerow as is
sometimes done with summer pruning in
raspberries. In either case, our priority is to
develop size management and stem renewal
systems that can be implemented
mechanically.
Maximizing per acre production will require
minimizing non-productive acreage within a
planting such as in headlands and row-
middles. With over-the-top harvesting little
more than a tractor wheel width is needed
between rows. However, more space will be
needed if using a sickle-bar or other device to
maintain the hedgerow width. Another
approach to hedgerow hazelnut production
would be wide-row spacing as might be used
in alley-cropping systems. In such a scenario,
the hazelnuts would be one of multiple
revenue streams from the alley-cropping
system.
We established the performance trials with a spaced-plant system to give each plant room to grow and our
per acre yield extrapolations are based on multiplying the average per plant yields by the plant density. In a
hedgerow system using a high initial planting density and size-control practices, such an extrapolation
method may not be applicable and will likely underestimate the yield potential of the hedgerow system.
Yield Density
Evaluating the per acre yield potential of our genotypes, if grown and managed in a continuous hedgerow
system, is best done with extrapolations of yield density, which is calculated as the ounces of kernel per
square foot of canopy coverage with canopy coverage being the cross sectional area of the shrub at its widest
diameter. For the yield and enterprise budget projections that follow we will use an initial planting
arrangement of 4 feet within-row and 12 feet between-row. By age 7 on fertile and well-managed sites, we
anticipate continuous hedgerows that are 6 feet wide with 6 foot open row middles between the hedgerows
for a total per acre canopy coverage of 50% or 21,780 ft2 per acre. Extrapolating the performance of the
selections in the trials to per acre yields is then a matter of multiplying the measured yield density by the
canopy coverage.
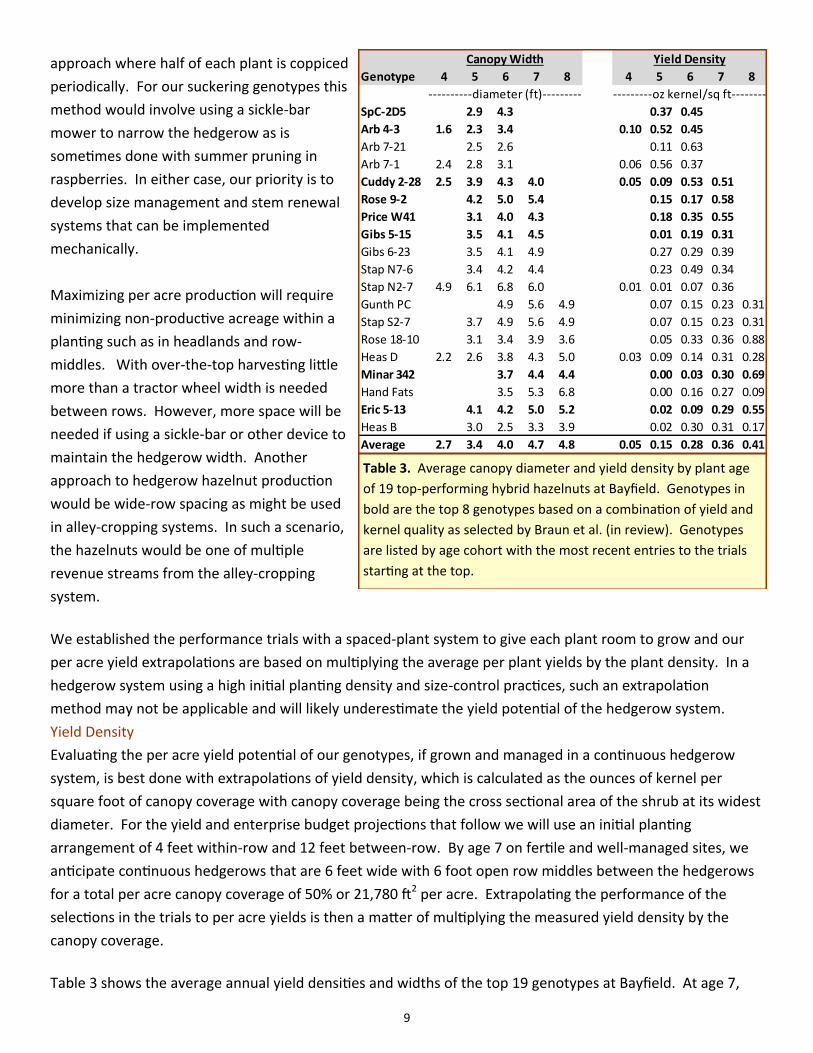
Table 3 shows the average annual yield densities and widths of the top 19 genotypes at Bayfield. At age 7,
Genotype 4 5 6 7 8 4 5 6 7 8
SpC-2D5 2.9 4.3 0.37 0.45
Arb 4-3 1.6 2.3 3.4 0.10 0.52 0.45
Arb 7-21 2.5 2.6 0.11 0.63
Arb 7-1 2.4 2.8 3.1 0.06 0.56 0.37
Cuddy 2-28 2.5 3.9 4.3 4.0 0.05 0.09 0.53 0.51
Rose 9-2 4.2 5.0 5.4 0.15 0.17 0.58
Price W41 3.1 4.0 4.3 0.18 0.35 0.55
Gibs 5-15 3.5 4.1 4.5 0.01 0.19 0.31
Gibs 6-23 3.5 4.1 4.9 0.27 0.29 0.39
Stap N7-6 3.4 4.2 4.4 0.23 0.49 0.34
Stap N2-7 4.9 6.1 6.8 6.0 0.01 0.01 0.07 0.36
Gunth PC 4.9 5.6 4.9 0.07 0.15 0.23 0.31
Stap S2-7 3.7 4.9 5.6 4.9 0.07 0.15 0.23 0.31
Rose 18-10 3.1 3.4 3.9 3.6 0.05 0.33 0.36 0.88
Heas D 2.2 2.6 3.8 4.3 5.0 0.03 0.09 0.14 0.31 0.28
Minar 342 3.7 4.4 4.4 0.00 0.03 0.30 0.69
Hand Fats 3.5 5.3 6.8 0.00 0.16 0.27 0.09
Eric 5-13 4.1 4.2 5.0 5.2 0.02 0.09 0.29 0.55
Heas B 3.0 2.5 3.3 3.9 0.02 0.30 0.31 0.17
Average 2.7 3.4 4.0 4.7 4.8 0.05 0.15 0.28 0.36 0.41
Yield Density
-----------------------oz kernel/sq ft----------------------
Canopy Width
-----------------------diameter (ft)----------------------
Table 3. Average canopy diameter and yield density by plant age
of 19 top-performing hybrid hazelnuts at Bayfield. Genotypes in
bold are the top 8 genotypes based on a combination of yield and
kernel quality as selected by Braun et al. (in review). Genotypes
are listed by age cohort with the most recent entries to the trials
starting at the top.
10
the average yield density at Bayfield
was 0.36 oz/ft2. At St. Paul it was 0.33
oz/ft2 (data not shown). Extrapolated
to a per acre basis the yields would
be 490 and 450 lbs/acre at Bayfield
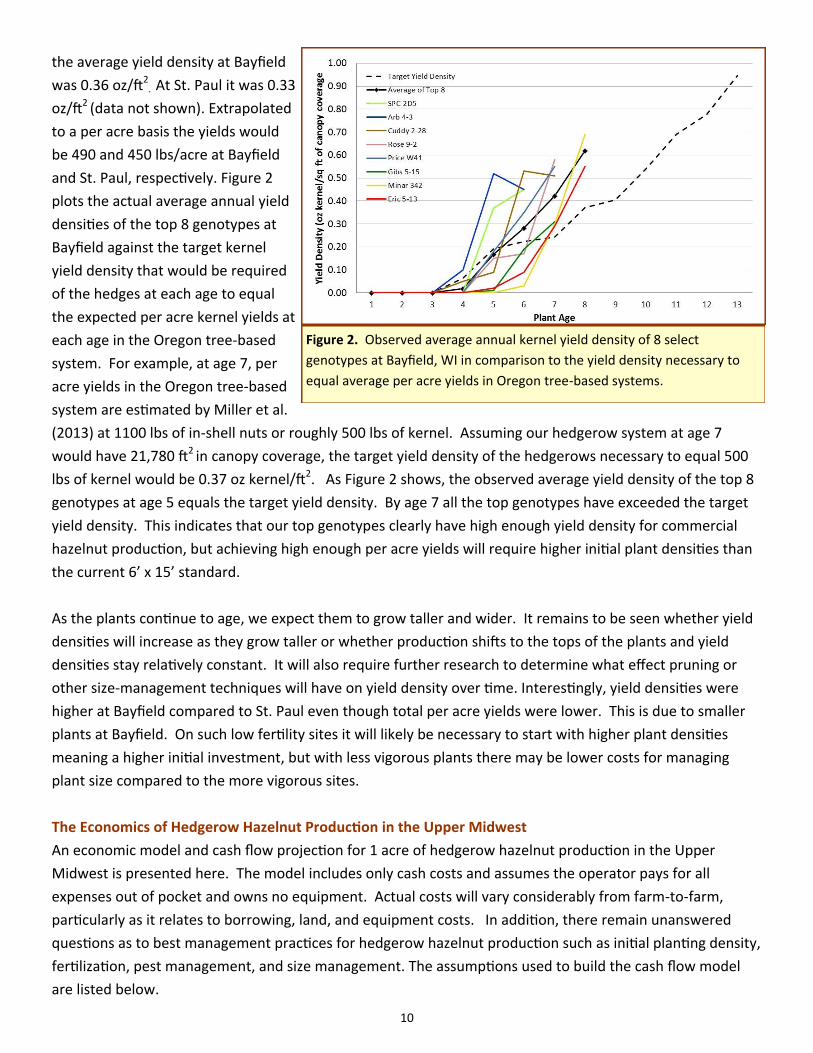
and St. Paul, respectively. Figure 2
plots the actual average annual yield
densities of the top 8 genotypes at
Bayfield against the target kernel
yield density that would be required
of the hedges at each age to equal
the expected per acre kernel yields at
each age in the Oregon tree-based
system. For example, at age 7, per
acre yields in the Oregon tree-based
system are estimated by Miller et al.
(2013) at 1100 lbs of in-shell nuts or roughly 500 lbs of kernel. Assuming our hedgerow system at age 7
would have 21,780 ft2 in canopy coverage, the target yield density of the hedgerows necessary to equal 500
lbs of kernel would be 0.37 oz kernel/ft2. As Figure 2 shows, the observed average yield density of the top 8
genotypes at age 5 equals the target yield density. By age 7 all the top genotypes have exceeded the target
yield density. This indicates that our top genotypes clearly have high enough yield density for commercial
hazelnut production, but achieving high enough per acre yields will require higher initial plant densities than
the current 6’ x 15’ standard.
As the plants continue to age, we expect them to grow taller and wider. It remains to be seen whether yield
densities will increase as they grow taller or whether production shifts to the tops of the plants and yield
densities stay relatively constant. It will also require further research to determine what effect pruning or
other size-management techniques will have on yield density over time. Interestingly, yield densities were
higher at Bayfield compared to St. Paul even though total per acre yields were lower. This is due to smaller
plants at Bayfield. On such low fertility sites it will likely be necessary to start with higher plant densities
meaning a higher initial investment, but with less vigorous plants there may be lower costs for managing
plant size compared to the more vigorous sites.
The Economics of Hedgerow Hazelnut Production in the Upper Midwest
An economic model and cash flow projection for 1 acre of hedgerow hazelnut production in the Upper
Midwest is presented here. The model includes only cash costs and assumes the operator pays for all
expenses out of pocket and owns no equipment. Actual costs will vary considerably from farm-to-farm,
particularly as it relates to borrowing, land, and equipment costs. In addition, there remain unanswered
questions as to best management practices for hedgerow hazelnut production such as initial planting density,
fertilization, pest management, and size management. The assumptions used to build the cash flow model
are listed below.
Figure 2. Observed average annual kernel yield density of 8 select
genotypes at Bayfield, WI in comparison to the yield density necessary to
equal average per acre yields in Oregon tree-based systems.
11
Economic Model Assumptions
• All labor is hired, hired on a custom-basis, or is provided
by the owner/manager as outlined below.
• The owner/manager owns the land, but leases it to his/
her hazelnut business at a rate of $50/ac/yr.
• The site is an average fertility site and the planting is
arranged with a 12 foot row spacing and 4 foot plant
spacing for a total initial plant density of 908 plants/acre.
The plants will fully occupy their space by age 7. Plants
cost $3.10 each.
• Site preparation is done in the summer prior to planting
with a burn-down herbicide application, followed by ripping and a finishing disk. The herbicide
application is custom-hired at a cost of $60/acre. The tillage is also custom-hired at a cost of $180/acre.
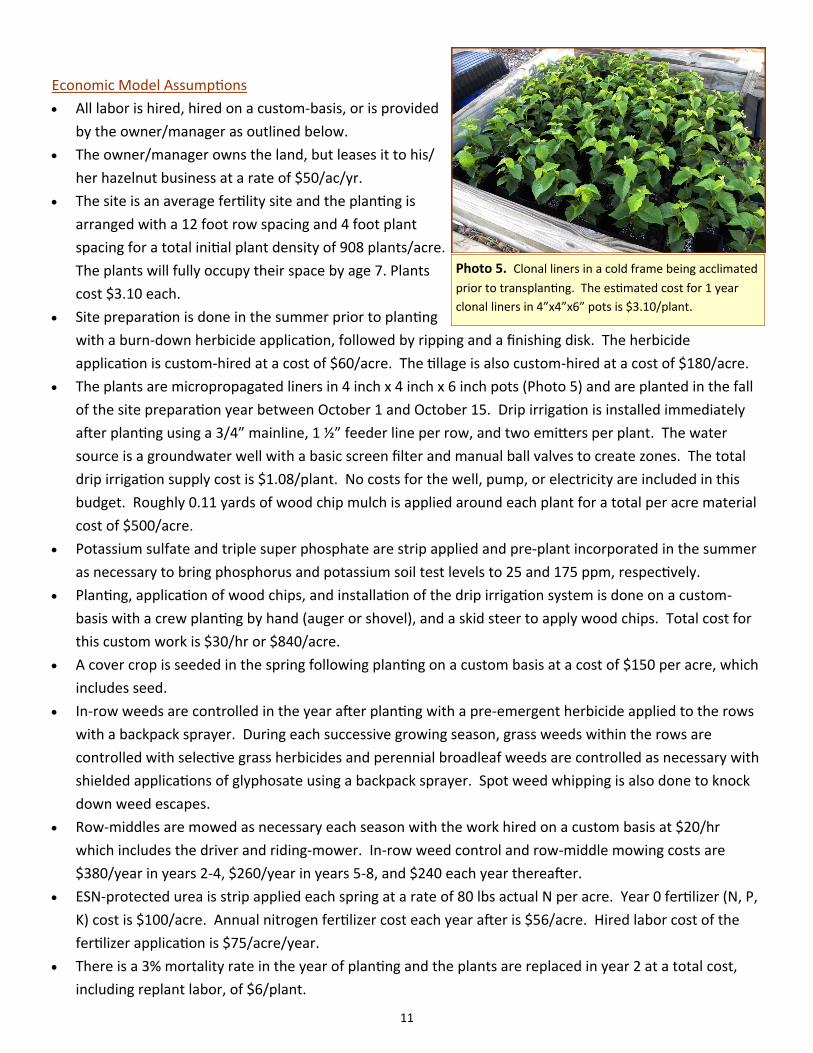
• The plants are micropropagated liners in 4 inch x 4 inch x 6 inch pots (Photo 5) and are planted in the fall
of the site preparation year between October 1 and October 15. Drip irrigation is installed immediately
after planting using a 3/4” mainline, 1 ½” feeder line per row, and two emitters per plant. The water
source is a groundwater well with a basic screen filter and manual ball valves to create zones. The total
drip irrigation supply cost is $1.08/plant. No costs for the well, pump, or electricity are included in this
budget. Roughly 0.11 yards of wood chip mulch is applied around each plant for a total per acre material
cost of $500/acre.
• Potassium sulfate and triple super phosphate are strip applied and pre-plant incorporated in the summer
as necessary to bring phosphorus and potassium soil test levels to 25 and 175 ppm, respectively.
• Planting, application of wood chips, and installation of the drip irrigation system is done on a custom-
basis with a crew planting by hand (auger or shovel), and a skid steer to apply wood chips. Total cost for
this custom work is $30/hr or $840/acre.
• A cover crop is seeded in the spring following planting on a custom basis at a cost of $150 per acre, which
includes seed.
• In-row weeds are controlled in the year after planting with a pre-emergent herbicide applied to the rows
with a backpack sprayer. During each successive growing season, grass weeds within the rows are
controlled with selective grass herbicides and perennial broadleaf weeds are controlled as necessary with
shielded applications of glyphosate using a backpack sprayer. Spot weed whipping is also done to knock
down weed escapes.
• Row-middles are mowed as necessary each season with the work hired on a custom basis at $20/hr
which includes the driver and riding-mower. In-row weed control and row-middle mowing costs are
$380/year in years 2-4, $260/year in years 5-8, and $240 each year thereafter.
• ESN-protected urea is strip applied each spring at a rate of 80 lbs actual N per acre. Year 0 fertilizer (N, P,
K) cost is $100/acre. Annual nitrogen fertilizer cost each year after is $56/acre. Hired labor cost of the
fertilizer application is $75/acre/year.
• There is a 3% mortality rate in the year of planting and the plants are replaced in year 2 at a total cost,
including replant labor, of $6/plant.
Photo 5. Clonal liners in a cold frame being acclimated
prior to transplanting. The estimated cost for 1 year
clonal liners in 4”x4”x6” pots is $3.10/plant.
12
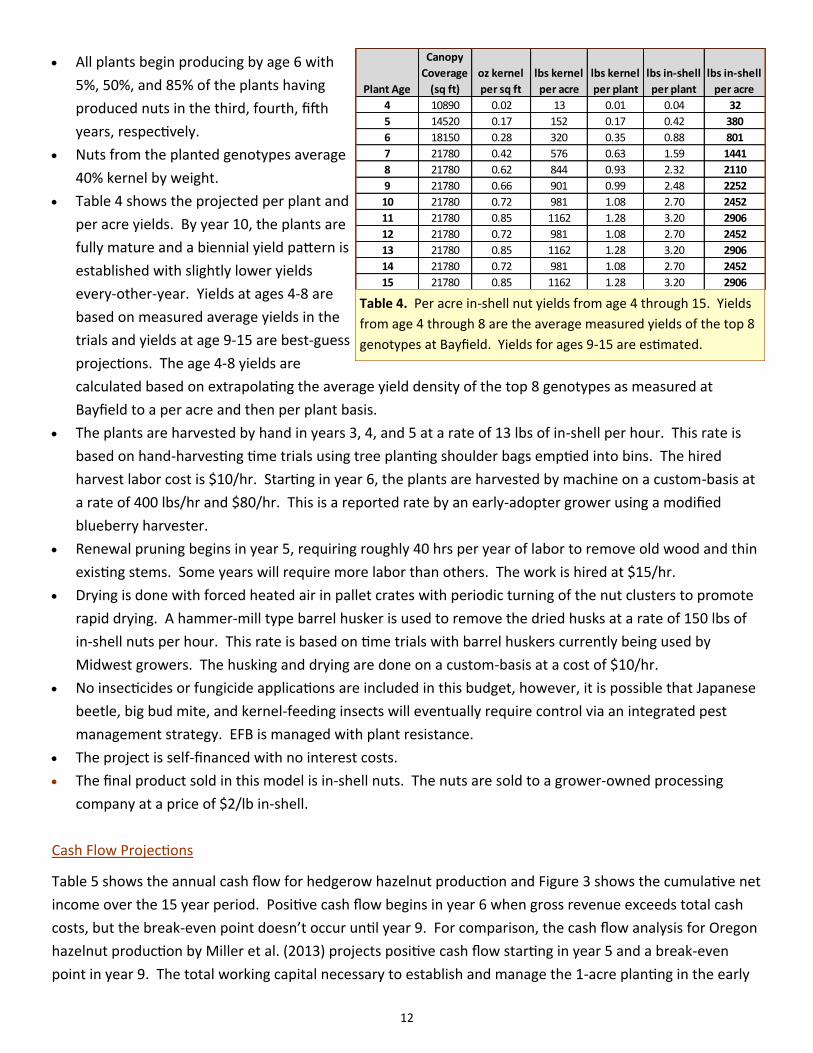
• All plants begin producing by age 6 with
5%, 50%, and 85% of the plants having
produced nuts in the third, fourth, fifth
years, respectively.
• Nuts from the planted genotypes average
40% kernel by weight.
• Table 4 shows the projected per plant and
per acre yields. By year 10, the plants are
fully mature and a biennial yield pattern is
established with slightly lower yields
every-other-year. Yields at ages 4-8 are
based on measured average yields in the
trials and yields at age 9-15 are best-guess
projections. The age 4-8 yields are
calculated based on extrapolating the average yield density of the top 8 genotypes as measured at
Bayfield to a per acre and then per plant basis.
• The plants are harvested by hand in years 3, 4, and 5 at a rate of 13 lbs of in-shell per hour. This rate is
based on hand-harvesting time trials using tree planting shoulder bags emptied into bins. The hired
harvest labor cost is $10/hr. Starting in year 6, the plants are harvested by machine on a custom-basis at
a rate of 400 lbs/hr and $80/hr. This is a reported rate by an early-adopter grower using a modified
blueberry harvester.
• Renewal pruning begins in year 5, requiring roughly 40 hrs per year of labor to remove old wood and thin
existing stems. Some years will require more labor than others. The work is hired at $15/hr.
• Drying is done with forced heated air in pallet crates with periodic turning of the nut clusters to promote
rapid drying. A hammer-mill type barrel husker is used to remove the dried husks at a rate of 150 lbs of
in-shell nuts per hour. This rate is based on time trials with barrel huskers currently being used by
Midwest growers. The husking and drying are done on a custom-basis at a cost of $10/hr.
• No insecticides or fungicide applications are included in this budget, however, it is possible that Japanese
beetle, big bud mite, and kernel-feeding insects will eventually require control via an integrated pest
management strategy. EFB is managed with plant resistance.
• The project is self-financed with no interest costs.
• The final product sold in this model is in-shell nuts. The nuts are sold to a grower-owned processing
company at a price of $2/lb in-shell.
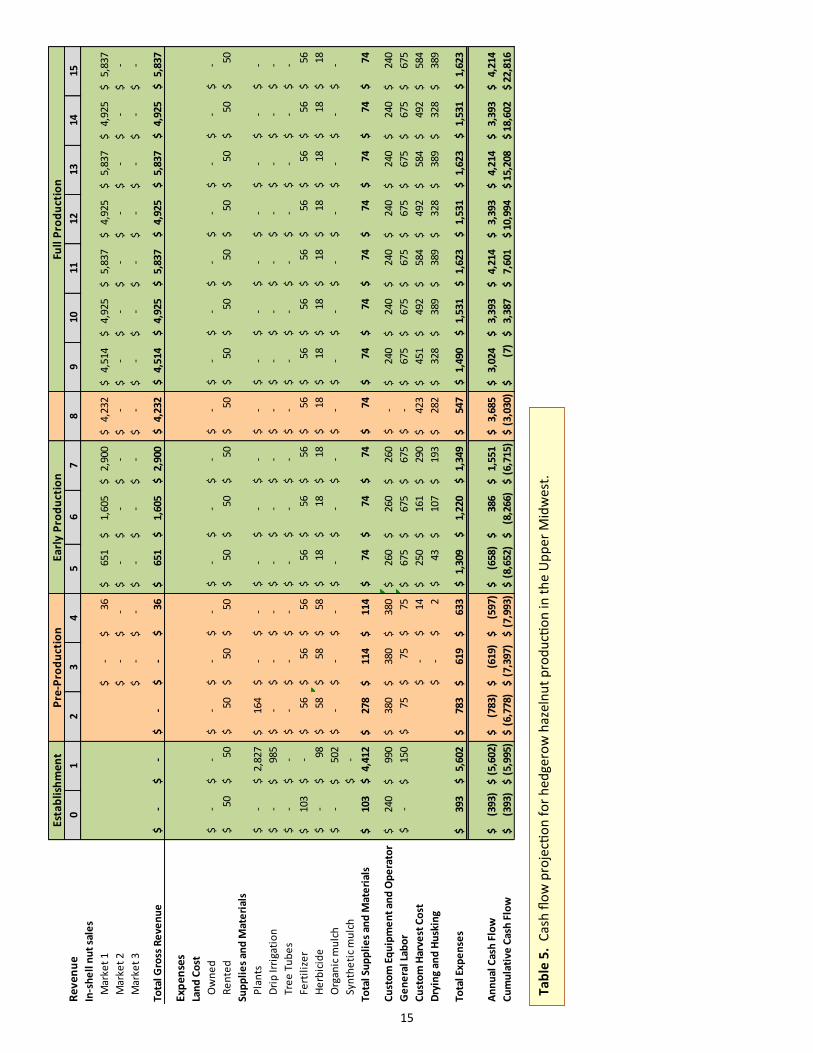
Cash Flow Projections
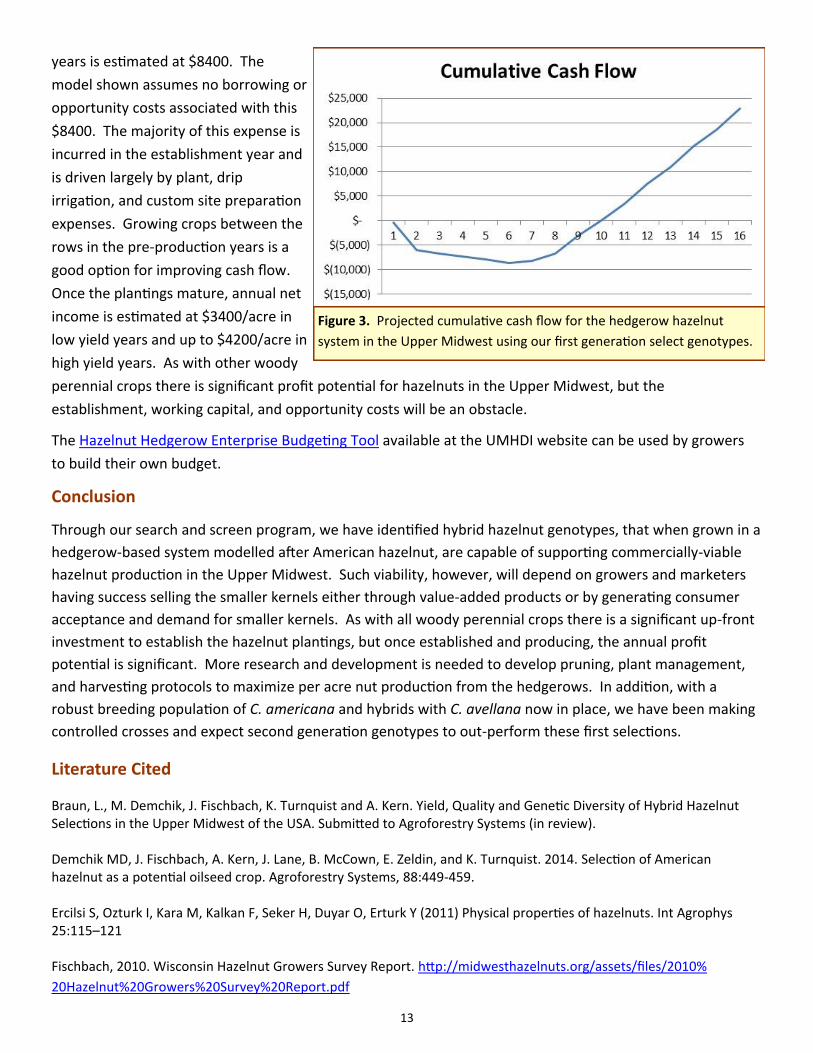
Table 5 shows the annual cash flow for hedgerow hazelnut production and Figure 3 shows the cumulative net
income over the 15 year period. Positive cash flow begins in year 6 when gross revenue exceeds total cash
costs, but the break-even point doesn’t occur until year 9. For comparison, the cash flow analysis for Oregon
hazelnut production by Miller et al. (2013) projects positive cash flow starting in year 5 and a break-even
point in year 9. The total working capital necessary to establish and manage the 1-acre planting in the early
Plant Age
Canopy
Coverage
(sq ft)
oz kernel
per sq ft
lbs kernel
per acre
lbs kernel
per plant
lbs in-shell
per plant
lbs in-shell
per acre
4 10890 0.02 13 0.01 0.04 32
5 14520 0.17 152 0.17 0.42 380
6 18150 0.28 320 0.35 0.88 801
7 21780 0.42 576 0.63 1.59 1441
8 21780 0.62 844 0.93 2.32 2110
9 21780 0.66 901 0.99 2.48 2252
10 21780 0.72 981 1.08 2.70 2452
11 21780 0.85 1162 1.28 3.20 2906
12 21780 0.72 981 1.08 2.70 2452
13 21780 0.85 1162 1.28 3.20 2906
14 21780 0.72 981 1.08 2.70 2452
15 21780 0.85 1162 1.28 3.20 2906
Table 4. Per acre in-shell nut yields from age 4 through 15. Yields
from age 4 through 8 are the average measured yields of the top 8
genotypes at Bayfield. Yields for ages 9-15 are estimated.
13
years is estimated at $8400. The
model shown assumes no borrowing or
opportunity costs associated with this
$8400. The majority of this expense is
incurred in the establishment year and
is driven largely by plant, drip
irrigation, and custom site preparation
expenses. Growing crops between the
rows in the pre-production years is a
good option for improving cash flow.
Once the plantings mature, annual net
income is estimated at $3400/acre in
low yield years and up to $4200/acre in
high yield years. As with other woody
perennial crops there is significant profit potential for hazelnuts in the Upper Midwest, but the
establishment, working capital, and opportunity costs will be an obstacle.
The Hazelnut Hedgerow Enterprise Budgeting Tool available at the UMHDI website can be used by growers
to build their own budget.
Conclusion
Through our search and screen program, we have identified hybrid hazelnut genotypes, that when grown in a
hedgerow-based system modelled after American hazelnut, are capable of supporting commercially-viable
hazelnut production in the Upper Midwest. Such viability, however, will depend on growers and marketers
having success selling the smaller kernels either through value-added products or by generating consumer
acceptance and demand for smaller kernels. As with all woody perennial crops there is a significant up-front
investment to establish the hazelnut plantings, but once established and producing, the annual profit
potential is significant. More research and development is needed to develop pruning, plant management,
and harvesting protocols to maximize per acre nut production from the hedgerows. In addition, with a
robust breeding population of C. americana and hybrids with C. avellana now in place, we have been making
controlled crosses and expect second generation genotypes to out-perform these first selections.
Literature Cited
Braun, L., M. Demchik, J. Fischbach, K. Turnquist and A. Kern. Yield, Quality and Genetic Diversity of Hybrid Hazelnut Selections in the Upper Midwest of the USA. Submitted to Agroforestry Systems (in review). Demchik MD, J. Fischbach, A. Kern, J. Lane, B. McCown, E. Zeldin, and K. Turnquist. 2014. Selection of American hazelnut as a potential oilseed crop. Agroforestry Systems, 88:449-459. Ercilsi S, Ozturk I, Kara M, Kalkan F, Seker H, Duyar O, Erturk Y (2011) Physical properties of hazelnuts. Int Agrophys 25:115–121 Fischbach, 2010. Wisconsin Hazelnut Growers Survey Report. http://midwesthazelnuts.org/assets/files/2010%
20Hazelnut%20Growers%20Survey%20Report.pdf
Figure 3. Projected cumulative cash flow for the hedgerow hazelnut
system in the Upper Midwest using our first generation select genotypes.

14
Fischbach, J., M. Demchik, L. Braun. 2011. Hazelnut production potential in the Upper Midwest: A report on hybrid
hazelnut yields. http://www.midwesthazelnuts.org/research.html
Hosseinpour A, Seifi E, Javadi D, Ramezanpour SS, Molnar TJ (2013) Nut and kernel characteristics of twelve hazelnutcultivars grown in Iran. Sci Hortic-Amst 150:410–413 Miller M, Seavert C, Olsen J (2013) Orchard economics: the costs and returns of establishing and producing hazelnuts in
the Willamette Valley. Oregon State University Extension Service, AEB 0043.
Molnar, T.J, J.C. Goffreda, C.R Funk. 2005. Developing Hazelnuts for the Eastern United States. Acta Hort. 686
Rutter PA, Wiegrefe S, Rutter-Daywater B (2015) Growing Hybrid Hazelnuts. Chelsea Green Pub, White River Junction, VT. Rutter M (1991) Variation in resistance to eastern filbert blight in hybrid hazels. Northern Nut Growers Association
Proceedings 82:159–162
Shepard, Mark. 2013. Restoration Agriculture. Acres USA. Austin, TX, USA
Weschke, C. 1954. Growing nuts in the north. Webb, St. Paul, MN.
15
Rev
enu
e0
12
34
56
78
910
1112
1314
15
In-s
he
ll n
ut
sale
s
Mar
ket
1-
$
36$
65
1$
1,
605
$
2,
900
$
4,23
2$
4,
514
$
4,92
5$
5,
837
$
4,92
5$
5,
837
$
4,92
5$
5,
837
$
Mar
ket
2-
$
-$
-
$
-$
-
$
-$
-
$
-$
-
$
-$
-
$
-$
-
$
Mar
ket
3-
$
-$
-
$
-$
-
$
-$
-
$
-$
-
$
-$
-
$
-$
-
$
Tota
l Gro
ss R
eve
nu
e-
$
-$
-
$
-$
36
$
651
$
1,60
5$
2,90
0$
4,
232
$
4,51
4$
4,
925
$
5,83
7$
4,
925
$
5,83
7$
4,
925
$
5,83
7$
Exp
ense
sLa
nd
Co
st
Ow
ne
d-
$
-$
-
$
-$
-
$
-$
-
$
-$
-
$
-$
-
$
-$
-
$
-$
-
$
-$
Re
nte
d50
$
50$
50
$
50$
50
$
50$
50
$
50
$
50$
50
$
50$
50
$
50$
50
$
50$
50
$
Sup
pli
es
and
Mat
eri
als
Pla
nts
-$
2,
827
$
164
$
-$
-
$
-$
-
$
-$
-
$
-$
-
$
-$
-
$
-$
-
$
-$
Dri
p Ir
riga
tio
n-
$
985
$
-$
-
$
-$
-
$
-$
-
$
-$
-
$
-$
-
$
-$
-
$
-$
-
$
Tre
e T
ub
es
-$
-
$
-$
-
$
-$
-
$
-$
-
$
-$
-
$
-$
-
$
-$
-
$
-$
-
$
Fert
iliz
er
103
$
-$
56
$
56$
56
$
56$
56
$
56
$
56$
56
$
56$
56
$
56$
56
$
56$
56
$
He
rbic
ide
-$
98
$
58$
58
$
58$
18
$
18$
18$
18
$
18$
18
$
18$
18
$
18$
18
$
18$
Org
anic
mu
lch
-$
50
2$
-
$
-$
-
$
-$
-
$
-$
-
$
-$
-
$
-$
-
$
-$
-
$
-$
Syn
the
tic
mu
lch
-$
Tota
l Su
pp
lie
s an
d M
ate
rial
s10
3$
4,
412
$
278
$
114
$
114
$
74$
74
$
74
$
74$
74
$
74$
74
$
74$
74
$
74$
74
$
Cu
sto
m E
qu
ipm
en
t an
d O
pe
rato
r24
0$
99
0$
38
0$
38
0$
38
0$
26
0$
26
0$
26
0$
-
$
240
$
240
$
240
$
240
$
240
$
240
$
240
$
Ge
ne
ral L
abo
r-
$
150
$
75$
75
$
75$
67
5$
67
5$
67
5$
-
$
675
$
675
$
675
$
675
$
675
$
675
$
675
$
Cu
sto
m H
arve
st C
ost
-$
14
$
250
$
161
$
290
$
423
$
451
$
492
$
584
$
492
$
584
$
492
$
584
$
Dry
ing
and
Hu
skin
g-
$
2$
43$
10
7$
19
3$
28
2$
32
8$
38
9$
38
9$
32
8$
38
9$
32
8$
38
9$
Tota
l Exp
en
ses
393
$
5,60
2$
78
3$
61
9$
63
3$
1,
309
$
1,22
0$
1,34
9$
54
7$
1,
490
$
1,53
1$
1,
623
$
1,53
1$
1,
623
$
1,53
1$
1,
623
$
An
nu
al C
ash
Flo
w(3
93)
$
(5
,602
)$
(7
83)
$
(6
19)
$
(5
97)
$
(6
58)
$
38
6$
1,
551
$
3,68
5$
3,
024
$
3,39
3$
4,
214
$
3,39
3$
4,
214
$
3,39
3$
4,
214
$
Cu
mu
lati
ve C
ash
Flo
w(3
93)
$
(5
,995
)$
(6
,778
)$
(7
,397
)$
(7
,993
)$
(8
,652
)$
(8
,266
)$
(6
,715
)$
(3
,030
)$
(7
)$
3,38
7$
7,
601
$
10,9
94$
15
,208
$
18,6
02$
22
,816
$
Esta
blis
hm
ent
Pre
-Pro
du
ctio
nFu
ll P
rod
uct
ion
Earl
y P
rod
uct
ion
Tab
le 5
. C
ash
flo
w p
roje
ctio
n f
or
hed
gero
w h
azel
nu
t p
rod
ucti
on
in t
he
Up
per
Mid
wes
t.