
A Process Model for Remote Sensing Data Analysislandgreb/Madhok9_01.pdfTGRS-00007-2001 Madhok &...
10
A Process Model for Remote Sensing Data Analysis Varun Madhok and David A. Landgrebe, Life Fellow, IEEE Copyright © 2002 IEEE. Reprinted from IEEE Transactions on Geoscience and Remote Sensing. Vol. 40, No. 3, pp 680-686, March 2002. This material is posted here with permission of the IEEE. Such permission of the IEEE does not in any way imply IEEE endorsement of any of Purdue University’s products or services. Internal or personal use of this material is permitted. However, permission to reprint/republish this material for advertising or promotional purposes or for creating new collective works for resale or redistribution must be obtained from the IEEE by sending a blank email message to [email protected]. By choosing to view this document, you agree to all provisions of the copyright laws protecting it.
Transcript of A Process Model for Remote Sensing Data Analysislandgreb/Madhok9_01.pdfTGRS-00007-2001 Madhok &...

A Process Model forRemote Sensing Data Analysis
Varun Madhok and David A. Landgrebe, Life Fellow, IEEE
Copyright © 2002 IEEE. Reprinted from IEEE Transactions on Geoscienceand Remote Sensing. Vol. 40, No. 3, pp 680-686, March 2002.
This material is posted here with permission of the IEEE. Such permissionof the IEEE does not in any way imply IEEE endorsement of any of PurdueUniversity’s products or services. Internal or personal use of this material ispermitted. However, permission to reprint/republish this material foradvertising or promotional purposes or for creating new collective works forresale or redistribution must be obtained from the IEEE by sending a blankemail message to [email protected].
By choosing to view this document, you agree to all provisions of thecopyright laws protecting it.

TGRS-00007-2001 Madhok & Landgrebe, “A Process Model for Remote Sensing Data Analysis”
2
A Process Model forRemote Sensing Data AnalysisVarun Madhok and David A. Landgrebe, Life Fellow, IEEE
Abstract -- Remote sensing data is collected and analyzed toenhance understanding of the terrestrial surface– incomposition, in form or in function. One approach toaccomplishing this is by designing the analysis process as aniterated composite of several analyst-directed modules. Thispaper proposes such a modular design for the data analysis.The proposed methodology was applied in a project to obtainthe thematic map for a flightline over Washington D.C. withvery satisfactory results– the qualification being in both thevisual and the statistical sense. The project execution ispresented as a case study in this paper.
Index Terms -- methodology, masking, segmentation, digitalelevation map, human-computer interaction, holistic solution,hyperspectral data classification.
I. INTRODUCTION
HE foundation of this paper is the proposition thateffective multispectral image data analysis is an analyst
driven placement of algorithms in which mathematicalrigor, though of fundamental importance, is secondary tothe analysis process. Practical engineering applicationsdemand solutions that are robust across diverse projects.However, the performance of an analysis algorithm isdictated by its fit to the problem context. An algorithmtuned in to a particular context is unlikely to be as effectivein another scenario. Such practical issues nearly alwayspreclude the existence of turn-key solutions for practicalproblems requiring remote sensing data analysis. On theother hand, principles of solution design are equallyapplicable across diverse projects. Identification andorganization of these principles into an analysismethodology is the motivation for this paper.
Section II of this paper discusses related research andproposes a methodology for remote sensing data analysis.Section III demonstrates how this methodology has beensuccessfully applied in a classification analysis of datacollected for a flightline over Washington D.C.
Manuscript received February 23, 2001. The work described in this
paper was sponsored in part by the U.S. Army Research Office underGrant Number DAAH04-96-1-0444.
Varun Madhok is with the Analytic Value Creation Practice, IBMCanada Ltd., Markham, ON L3R9Z7, Canada (e-mail:[email protected]).
David A. Landgrebe is with the School of Electrical and ComputerEngineering, Purdue University, West Lafayette, IN47907-1285, USA (e-mail: [email protected]).
II. REMOTE SENSING DATA ANALYSIS
A. Related Work
The philosophy of this paper’s discussion is embodied ina work by Kushnier, et al. [1] in the context of militarystrategizing. The authors state that the task of makingtactical decisions in naval operations is too complex to beaccomplished by humans alone or by computers alone, andpresent several examples in support of the statement. Thepaper highlights the division of responsibilities betweenperson and machine with the proposition that the humanuses judgment and native intuition to make decisions whilethe assessment of the situational physics is a highlymathematical endeavor best left to the computer. Also ofnote is the work of McKeown, et al. [2] for cartographicfeature extraction. Their design echoes the methodologyand the principles discussed in this paper.
B. Design principles
Mathematical modeling on the computer serves a usefulpurpose, in that the system dynamics can be reduced to themanipulation of a few parameters. If applicable, thecomplexity of the ensuing analysis can be significantlyreduced, and thus be synthesized by the user into a suite ofanalysis-routines. In contrast, the factor invaluable to thesuccessful application of laboratory models of terrestrialphenomena is the human ability to learn and to adapt theanalysis to the peculiarities of the problem. Successfulanalysis is thus a balance between perceptive insights andmathematics. The principles at core of the proposedmethodology are listed as axioms below.
Axiom 1: Human abilities are different from those of thecomputer.Consider Table I, adapted from [3]. The conclusions drawnfrom Table I are that the inferential aspects of the analysisare best left to the human. On the opposite side, thecomputer's superiority lies in executing number crunchingapplications of analyst design.
Multispectral1 remote sensing image data conveyinformation at the elemental level through energyspectral/spatial measurements, and at the composite levelthrough inter-pixel relationships. The subjective evaluationsafforded by the image representation are the interfacebetween the human and the computer - thus the
1 By multispectral image data is meant data gathered over a scene on a
pixel by pixel basis to constitute an image in which measurements aremade for each pixel in a few to perhaps several hundred individual regionsof the electromagnetic spectrum.
T

TGRS-00007-2001 Madhok & Landgrebe, “A Process Model for Remote Sensing Data Analysis”
2
computational analysis is guided by analyst assessment ofthe visualization. This perspective is key to initiating andguiding remote sensing data analysis. The ensuingdiscussion does not suggest a design of intelligent/learningalgorithms or of automated solutions. The emphasis lies onthe recognition of human-computer interaction as a master-drudge relationship and the utilization of the respectivestrengths in the design of a holistic solution.
Axiom 2: The machine (in)validates the user'shypothesis.
In various applications, the output of the algorithm is ameasure of belief in the hypothesis posed by the analyst. Apoor output does not necessarily imply algorithmicdeficiencies. Failure is often a result of the algorithm and/orthe performance metric being unsuitable to the objective.Mathematical analysis is usually directed by theoptimization of a user-defined performance measure.Incompatibility between this measure and the objective isunlikely to produce the desired results. In regard to analysesthat seek a visual interpretation of the data, this is anespecially important issue. Algorithms that process spatiallyorganized data through the optimization of mathematicalcriteria are often sub-optimal in the sense that the outputimage is cluttered (or fuzzy or noisy) and is visuallyunpleasing.
Axiom 3: Every analysis usually requires at least onerevision.
Usually, analysis is comprised of various algorithmic'objects', selected from a suite of procedures, linked in theappropriate sequence by the analyst. The optimal selectionand ordering of these objects is often not known.Occasionally, algorithm parameterization is also dependenton human input. Any test run of the process is likely toproduce results that can be improved upon throughexperimentation. Furthermore, analytical models for naturalphenomena are approximations to an ideal that is neverencountered in practice. Their performance in remotesensing data analysis is sub-optimal.
The corollary to Axiom 3 is that practical engineeringproblems cannot be solved perfectly. The termination ofanalysis depends largely on the tolerance level for errors,the available resources, and the available time. Solutionimplementation requires experimentation with a multitudeof analysis algorithms. The best solution is often apatchwork of several techniques pieced together to meet thecritical success factors. Additionally, this postulate does notdownplay the need for fundamental research for newalgorithms and techniques. It proposes that the performanceof the ‘best’ automated solution always can benefit fromtuning to fit the problem context.
C. The methodology
There are three phases to the implementation of everyremote sensing data analysis project. Each of the phasescomprises several activities. These phases (bulleted with‘P’), and the associated activities (bulleted with ‘A’) arelisted below, in order of occurrence.
P Problem Definition.A Objective identification.A Success metrics definition / statement of
completion criteria.A Constraints identification.
P Solution Definition.A Data source(s) identification.A Algorithm-suite compilation.
P (Iterative) Solution Implementation.A Data preparation.A Algorithm implementation.A Results assessment.
The phases and the associated activities listed above willbe explained through the case study in the next section.
III. CASE STUDY – ANALYZING THE D.C. FLIGHTLINE
A. Preface
The standard assumption in remote sensing data analysisis that measurements on the energy reflected or emittedfrom the Earth’s surface contain the information fromwhich the corresponding terrain-type or land-usage can beidentified. Under the belief that the scene comprises adefinite set of scene-classes, these data can be processedand each element (pixel) assigned a label from this set. Acolor representation of the output is known as a thematicmap or a classification map, the colors used in therepresentation being mapped one-to-one with the set ofscene-classes. The project described in this sectiongenerated a thematic map from the remote sensing data andthe Digital Elevation Map (DEM) for a flightline overWashington D.C. using the proposed process model toguide its execution.
B. Project design
P Problem DefinitionA Objective – The project requires the classification
of data collected on a flightline over WashingtonD.C. into a set of scene-classes that spans thethematic content of the scanned region. For thegiven data, the thematic content is spanned by theclass-set {ROOF, ROAD, SHADOW, TREE, GRASS,WATER, PATH}.
A Success metrics – The primary criterion for taskcompletion is ‘picture quality’ of the thematic mapbased on subjective evaluation for correspondenceof the results with analyst understanding of thescene, and for absence of speckle2
misclassifications. This qualitative assessment issupplemented with a quantitative comparison ofthe output thematic map and regions in the
2 The term ‘speckle’ is used in a sense different from that used by
researchers in radar data processing. In this context, speckle noiserepresents the ‘salt and pepper’ effect of isolated pixels classified distinctlyin a large patch of the scene labeled a certain scene-class. The clutter neednot be a spectral misclassification, but may be a logical aberration, e.g.speckle noise due to rain puddles on rooftops.

TGRS-00007-2001 Madhok & Landgrebe, “A Process Model for Remote Sensing Data Analysis”
3
flightline identified by an independent observer asspecific scene-types.
P Solution DefinitionA Data sources – The data for this case study were
collected using an airborne scanner overWashington D.C. The spatial representation of thisdata is a region 1310 pixels ¥ 265 pixels. Theairborne scanner gathered data in each pixel over210 channels (samples of the energy spectrum)between 0.4 and 2.4 m m. A three colorrepresentation of these data is shown in Fig. 1. Anadditional source of information was the DigitalElevation Map (DEM) of the scene. The grayscalerepresentation of the DEM is shown in Fig. 2. Therange for the elevation map was 0.5m to 55m.
A Algorithm suite – The analysis suite comprised analgorithm for quadratic maximum likelihoodclassification, an algorithm for segmentation ofspectral data using a stochastic image model, andseveral improvisations to process the thematic mapand the DEM. Details on these techniques areobtainable at [4].
P Solution ImplementationA Data preparation– The 210 spectral channels3 of
data were individually examined for noise. It wasobserved that physical defects in the scanner,detector saturation and water absorption bands hadcorrupted several spectral channels. These datawere excluded from the analysis. 104 of theoriginal 210 channels were retained for theanalysis.
A Algorithm implementation– The solution requiredseveral iterations of algorithm implementation andoutput assessment. The output assessment at theend of each cycle was a visual examination of thethematic map generated at the end of the algorithmexecution. The quality issues were addressed in thesame sequence. An important design innovationwas a “masking” scheme to exclude data that hadbeen correctly classified from subsequentprocessing. This innovation enabled a consistentimprovement in output quality in stepping throughthe analysis-assessment cycles. A representation ofthe solution implementation is shown in Fig. 3.Each oval in the graph corresponds to a particularimplementation-assessment cycle, and is labeled a‘Node’. The analysis was initiated at the ‘Rootnode’. Successive nodes are labeled ‘Node 1’,‘Node 2’, ‘Node 3’, … These nodes are brieflydescribed in the Appendix. Further details may beobtained at [4].
A Output assessment - The output at each iteration ofthe analysis is a thematic map that was generated
3The channel number, as in this usage, signifies a specific wavelength at
which the spectrum of energy reflected from the Earth has been sampled.Correspondingly, the 210 channels for the scanner are representative ofsamples at 210 distinct wavelengths.
using MultiSpec [5]. The iterations wereterminated after Node 8. The final output is shownin Fig. 4. It passed the subjective evaluationcriteria- absence of clutter, verification by regionalexpert for absence of logical aberrations inclassifications. This output was validated againsttest data identified in Fig. 5. These test data weregathered by a researcher4 independent of theanalysis presented here, as representative samplesof each scene-class in the flightline. The output inFig. 4 could thus be compared to the test dataidentified in Fig. 5 to evaluate the accuracy of theanalysis. The final classification at Node 8 isassessed in Table II for each of the scene-classes.For comparison, Table II also lists theclassification performance at the Root Node. Notethe jump in classification accuracy from 87.3% to94.3%5. Note also that the accuracy improvementin the proposed design is a directed approach – thepixels whose classification accuracy is to beimproved are processed independent of theremaining data. This explains why the nodes arelisted along with the scene class in the listing forthe final output.
IV. DISCUSSION
The premise of the proposed methodology is that thecurrent suite of analysis algorithms is sufficient to handlepractical remote sensing data analysis problems. Indeed,minor modifications to existing algorithms for specificprojects are samples of the innovation driven approachemphasized in this paper, rather than new inventions.
The proposed methodology is also important in twopractical respects.
· It promotes collaboration across diverse disciplinesby focusing the respective specialists on specificissues in the project. For instance, the School ofCivil Engineering at Purdue University, usingtechnology of BAE Systems of San Diego,California, generated the DEM for the projectpresented as a case study in this paper.
· It enables project management in practical industrialapplications of remote sensing data. The projectbreakdown proposed here can be used to balancetimelines, money and human resources against theachievement of the success criteria.
We believe that the incremental value of developingsophisticated data analysis algorithms is negated by thedifficulty of disseminating the knowledge required to use
4 Y. Zheng, private communication. Y. Zheng was with Purdue
University.5 The scene-class ROOF, has been characterized in the functional sense
in Node 8. If scene-class ROOF-RESIDUE is merged with ROOF, the numberof pixels in Node 8 correctly identified as the functional class 'roof' jumpsto 1174, and the overall classification accuracy improves to 97.19%.

TGRS-00007-2001 Madhok & Landgrebe, “A Process Model for Remote Sensing Data Analysis”
4
them effectively. In order for remote sensing science toyield the greatest value to society and to business, it iscritical that data analysis becomes accessible to thelayperson who may have the data access and the analyticalability but not necessarily the mathematical background todelve into algorithmic minutiae. Such a user should be ableto design applications around solution objects whoseworkings need not be understood so long as they producedvalue. In any case the incremental value produced by a not-perfect analysis would be a quantum leap over the statusquo. This is not to say that currently there are no practical(and effective) implementations of remote sensing science.We are proposing that given the few ‘experts’ in the field,the penetration of this technology would be much greater ifthe non-expert could use remote sensing data analysis tohis/her advantage without ‘expert’ guidance. A robustprocess model is thus far more important to the solutionthan tinkering with analysis algorithms. It is hoped that thispaper will influence the thinking in the community into thesame direction.
APPENDIX
Root Node – spectral classification
A three-color representation of the multispectral datausing channels 60, 17 and 27 (data gathered at wavelengths0.75µm, 0.46µm and 0.5µm respectively) is shown in Fig.1. The analysis for the Root Node stepped through thefollowing path.· A comprehensive set of scene-classes was identified -
{ROOF, RO A D , SHADOW, TREE, GRASS, WATER,PATH}.
· Training data representative of each of the scene-classes was selected. The scene-classes ROOF andROAD were realized as being a cumulative of severalspectrally distinct sub-classes. Consequently, the set ofscene-classes was enlarged to {ROOF1, ROOF2, ROOF3,ROOF4, RO O F5, RO O F6, RO O F7, RO O F8, ROAD1,ROAD2, SHADOW, TREE, GRASS, WATER, PATH}. Fig.6 is a representation of the training data.
· The discriminant analysis feature extraction technique[6][7] was used to reduce the dimensionality of the dataon a class-conditional basis.
· The method of quadratic maximum likelihoodclassification was used to classify the spectral data togenerate the thematic map. The results of theclassification are shown as a thematic map in Fig. 7.Note that the sub-classes of ROOF, and those of ROAD,have been merged into their respective groups.
· Sections of Fig. 7 are enlarged as Fig. 3.7b-e, tohighlight the errors that need to be rectified insubsequent iterations of the analysis. The errors inclassification are surmised to be a result of spectralsimilarities among various groups of scene classes,namely {ROAD, ROOF, PATH}, {WATER, SHADOW}and {TREE, GRASS}. Output quality could also be
improved by ridding the thematic map of speckleclutter.
Node 1 - WATER + SHADOW separation
Though there was confusion in separating WATER fromSHADOW, the discrimination of these from other classes wasaccurate. To enhance the quality of separation betweenWATER and SHADOW, the data for these spectral classeswere ‘masked’ out from the remainder of the data and runthrough several iterations of binary segmentation.
Node 2 – SHADOW segmentation
SHADOW was identified as a composite of several sub-classes comprising low energy responses on diversematerials. It was decided to process the data labeledSHADOW in isolation and separate them into spectrallydistinct sub-classes. As before these data were masked outand the binary segmentation scheme was applied. Severaliterations were performed, and visual quality of the outputwas the evaluation criterion in each cycle. One of theSHADOW sub-classes corresponded uniquely to waterbodies. This new scene-class was labeled WATER2.
Node 3 - GRASS and TREE separation
From the output at the Root Node, Fig. 7e, it was evidentthat there was confusion in separating GRASS and TR E E
data. The data for these scene-classes were masked outfrom the remainder of the scene and the unsupervisedsegmentation algorithm was applied to re-separate themerged classes into TREE and GRASS.
Node 4 – Rooftop extraction
While the definition of a roof implies "the cover of anybuilding" [8], such a functional characterization iscomplicated to implement via spectral analysis. The ROOF
identification in the output of Fig. 7 is mediocre. The digitalelevation map (DEM) of the scene captured the functionalaspect of the scene-class and was used to enhance theoutput in this node. A grayscale representation of the DEMis shown in Fig. 2. The lighter pixels in the imagecorrespond to elements at higher elevations in the scene.
The DEM provided information on the rise in elevationof a given area-element in relation to its neighbor. Pixelsclassified as ROAD, PATH, ROOF or SHADOW were filteredon the corresponding elevation data to isolate rooftops (inthe functional sense). Data that had previously beenspectrally labeled as ROOF, but were not so labeled after thefiltering operation were assigned the class label ROOF-RESIDUE. Details on this analysis are available in [9].
Node 5 – Removal of PATH clutter
To clean the output of speckle clutter, it was decided toforego the use of the spectral data completely. Data qualityis a function of the objective, and in this project, debris andtraffic (for instance) contributed to noise. While thestatistical classification was true to the remote sensing data,the returned output was visually cluttered. In this case, all

TGRS-00007-2001 Madhok & Landgrebe, “A Process Model for Remote Sensing Data Analysis”
5
PATH classification outside a strip running through thecenter of the flightline were considered erroneous. Thesemis-classifications were re-labeled the scene-class that wasnext closest in spectral similarity.
Node 6 – Removal of WATER2, WATER clutter
It was decided to restrict the spectral classification ofscene-classes W ATER and WATER2 to the large waterbodies that could be visually identified in Figure 1. Thesewater bodies are spatially restricted to two rectangularregions on the left and to a small patch in the right part ofthe flightline. As at Node 5, any data labeled as WATER orWATER2 outside these regions were re-assigned to the nextmost similar scene-class.
Node 7 - SHADOW re-assignment
It was concluded that the scene-class SHADOW wastemporal, was non-informative, and had to be removedfrom the output. The maximum likelihood classificationalgorithm was used to re-assign data labeled SHADOW toother scene-classes.
Node 8 – Removal of WATER clutter
Because of the high spectral similarity (low magnitude ofresponse) between the class SHADOW and WATER, most ofthe re-assigned data in Node 7 got classified as WATER. Theoperation similar to that at Node 6 was applied to removethe occurrences of water classification outside the regionsidentified as water bodies.
REFERENCES
[1] S. D. Kushnier, C. H. Heithecker, J. A. Ballas and D. C.McFarlane, "Situation assessment through collaborativehuman-computer interaction", Naval Engineers Journal, vol.108, no. 4, pp. 41-51, July 1996.
[2] D. M. McKeown, Jr. , S. D. Cochran, S. J. Ford, J. C.McGlone, J. A. Shufelt and D. A. Yocum, "Fusion ofHYDICE hyperspectral data with panchromatic imagery forcartographic feature extraction", IEEE Transactions onGeoscience & Remote Sensing, vol. 37, no. 3, pp. 1261-1277,May 1999.
[3] B. Schniederman, Designing the User Interface: Strategiesfor Effective Human-Computer Interaction, 2nd ed., ReadingMA: Addison-Wesley, 1992.
[4] V. Madhok, "Spectral-spatial analysis of remote sensing data:An image model and a procedural design", Ph.D. dissertation,School of Electrical and Computer Engineering, PurdueUnivers i ty , Augus t 1999 . Avai lab le f romhttp://dynamo.ecn.purdue.edu/~landgreb/publications.html
[5] L. Biehl, and David Landgrebe, "MultiSpec - A Tool forMultispectral-Hyperspectral Image Data Analysis", 13thPecora Symposium, Sioux Falls, SD, August 20-22, 1996.See also http://dynamo.ecn.purdue.edu/~biehl/MultiSpec/
[6] D. A. Landgrebe, "Information extraction principles andmethods for multispectral and hyperspectral image data", inInformation Processing for Remote Sensing, C. H. Chen, Ed.New Jersey: World Scientific Publishing Co., 2000. Alsoa v a i l a b l e f r o mhttp://dynamo.ecn.purdue.edu/~landgreb/publications.html
[7] C. Lee and D. A. Landgrebe, "Analyzing high-dimensionalmultispectral data", IEEE Transactions on Geoscience &
Remote Sensing, vol. 31, no. 3, pp. 792-800, July 1993. Alsoavailable fromhttp://dynamo.ecn.purdue.edu/~landgreb/publications.html
[8] Webster's Ninth New Collegiate Dictionary, Springfield MA:Merriam-Webster, 1993.
[9] V. Madhok and D. Landgrebe, "SupplementingHyperspectral Data with Digital Elevation", Proceedings ofthe International Geoscience & Remote Sensing Symposium(IGARSS), June 28 - July 2, 1999. Also available from
http://dynamo.ecn.purdue.edu/~landgreb/publications.html

TGRS-00007-2001 Madhok & Landgrebe, “A Process Model for Remote Sensing Data Analysis”
6
The human The computer• Can draw upon
experience and adaptdecisions to unusualphenomena.
• Can reasoninductively, andprocess hierarchically.
• Can generalize fromobservations to buildanalytical models ordecision rules fornatural phenomena.
• Can generate outputdepending onsubjectiveinterpretation of task.
• Is a source of data,information.
• Can perform repetitivepre-programmed actions.Can executecomputationally complexalgorithms.
• Can process several itemssimultaneously.
• Can implement thegeneralizations.
• Generates outputconforming to doctrinesand performance indicesbased on a quantitativegoal interpretation.
• Has short response time,high speed ofcomputation, and cheapdata storage.
TABLE ITHE HUMAN VERSUS THE COMPUTER IN DATA ANALYSIS.
Output at Root NodeScene-class
Number oftest
samplesIdentifiednumber
%accura
cyROAD 1 056 1 018 96.4WATER 1 566 1 456 93.0PATH 261 246 94.3TREE 450 429 95.3GRASS 1 378 1 029 74.7ROOF 1 192 974 81.7
All classes 5 903 5 152 87.3
Final Output afterNode 8
Scene-class (withNode(s) at whichprimary cleansingwas performed)
Number oftest
samples Identifiednumber
%accura
cyROAD (Nodes 4, 7) 1 056 1 016 96.2WATER (Nodes 6, 8) 1 566 1 556 99.4PATH (Node 5) 261 238 91.2TREE (Node 3) 450 428 95.1GRASS (Node 3) 1 378 1 270 92.2ROOF (Node 4) 1 192 1 059 88.8
All classes 5 903 5 622 94.3
TABLE IIQUANTITATIVE COMPARISON OF CLASSIFICATION ACCURACIES
FOR THE OUTPUTS AT THE ROOT NODE AND AT NODE 8.

TGRS-00007-2001 Madhok & Landgrebe, “A Process Model for Remote Sensing Data Analysis”
7
Fig. 1: Three-color simulated color IR film representation of D.C. flightline. (Original in color).
Fig. 2: Representation of the Digital Elevation Map. Note that the high elevation regions appear in a lighter shade of gray.
Fig. 3: Graph representation of the D.C. data analysis.
Node 3 - TREE& GRASSseparation
Node 4 - ROOFextraction
Root Node – spectralclassification
Node 5 –Removal of PATH
clutter
Node 1 - WATER +SHADOW separation
Node 2 – SHADOWsegmentation
Node 6 – Removalof WATER2,
WATER clutter
Node 7 - SHADOW re-assignment Node 8 – Removal of
WATER clutter

TGRS-00007-2001 Madhok & Landgrebe, “A Process Model for Remote Sensing Data Analysis”
8
TreeWaterRoofRoadPathRoof-residueGrass
Groups
Fig. 4: Thematic map generated at Node 8 of the analysis, used as final output. (Original in color).
backgroundWaterRoadShadowPathTreeGrassRoof
Classes
Fig. 5: Representation of test data used in assessing performance of classification analysis. (Original in color).
backgroundRoof1Roof2Roof3Roof4Roof5Roof6Roof7RoadRoad2PathTreesGrassWaterShadowRoof8
Classes
Fig. 6: Training data. Note that there are eight sub-classes to ROOF, and two sub-classes to ROAD. (Original in color).
TGRS-00007-2001 Madhok & Landgrebe, “A Process Model for Remote Sensing Data Analysis”
9
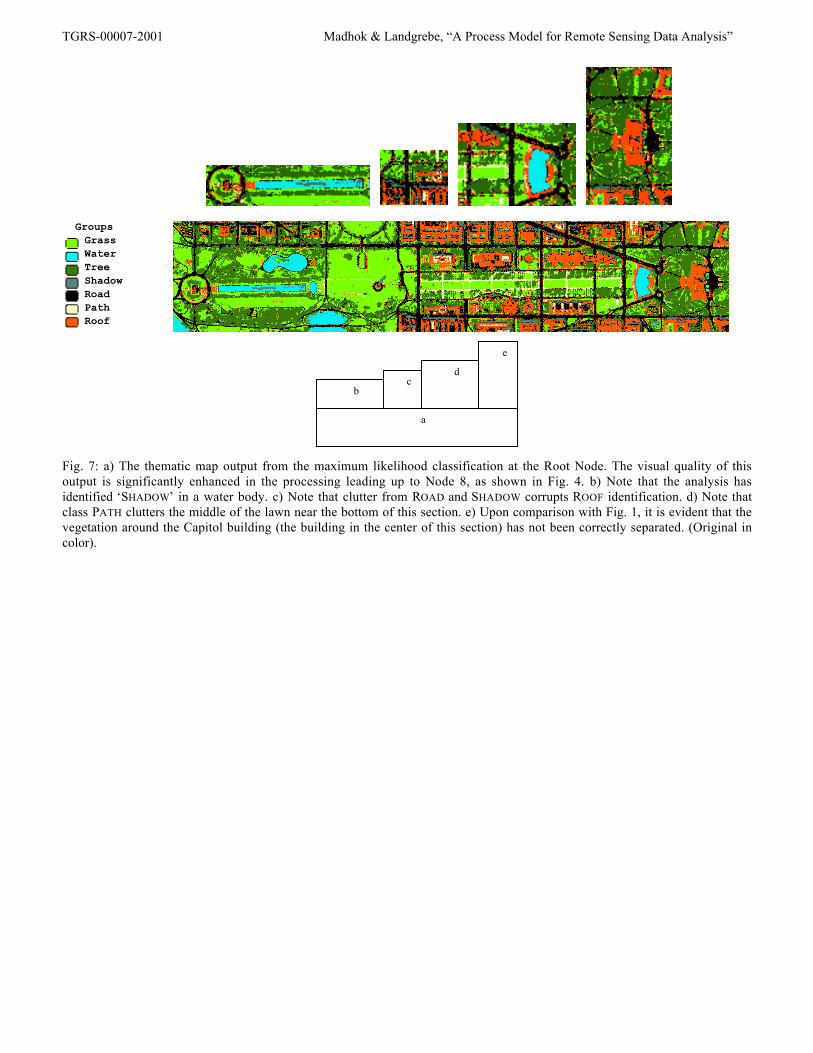
GrassWaterTreeShadowRoadPathRoof
Groups
Fig. 7: a) The thematic map output from the maximum likelihood classification at the Root Node. The visual quality of thisoutput is significantly enhanced in the processing leading up to Node 8, as shown in Fig. 4. b) Note that the analysis hasidentified ‘SHADOW’ in a water body. c) Note that clutter from ROAD and SHADOW corrupts ROOF identification. d) Note thatclass PATH clutters the middle of the lawn near the bottom of this section. e) Upon comparison with Fig. 1, it is evident that thevegetation around the Capitol building (the building in the center of this section) has not been correctly separated. (Original incolor).
a
d
e
bc


![[REMOTE SENSING] 3-PM Remote Sensing](https://static.fdocuments.in/doc/165x107/61f2bbb282fa78206228d9e2/remote-sensing-3-pm-remote-sensing.jpg)
