A procedure for the immunoanalysis of samples containing one or more members of a group of...
9
ANALYTICA CHIMICA ACTA Analytica Chimica Acta 336 (1996) 175-183 A procedure for the immunoanalysis of samples containing one or more members of a group of cross-reacting analytes Geoffrey Jonesa, Monika Wortbergb, Bruce D. Hammockc, David M. Rockea2* ‘Graduate School of Management, University of California, Davis, CA 95616, USA b BASFAG, Agricultural Research Station, APVUS, D-67144 Limburgerhoj Germany ‘Department of Entomology and Environmental Toxicology, UniversiQ of California, Davis, CA 95616. USA Received 12 April 1996; revised 23 July 1996; accepted 30 July 1996 Abstract The information obtained from a single-antibody immunoassay can be ambiguous when the identity of the analyte is unknown and could be one of a group of compounds all having different affinities for the antibody. If we allow the possibility of mixtures of analytes the difficulty of the situation is aggravated. However, additional information can sometimes be obtained by assaying with a number of different antibodies. We demonstrate a rationale for identifying and quantifying analytes from a group of candidates, and illustrate the application of our method with an example from the class of s-triazine herbicides. Using a four-antibody array, correct identification and accurate quantification were usually achieved for single- analytes samples in the low ppb range. Mixtures of analytes were recognized as such but were more difficult to classify correctly, with some confusion arising between members of subgroups, particularly within the methoxy/methylthio substituted triazines. The mathematical perspective is used to suggest directions for improving the experimental performance of multianalyte immunoassay. Keywords; Immunoassay; Cross-reactivity; Multianalyte 1. Introduction In analytical chemistry, the identity of a compound is not usually proven directly: rather one attempts to disprove it under conditions of increasing rigor. When those conditions become sufficiently rigorous we then accept the resulting data as proof of identity. The problem of proof extends to all aspects of analytical chemistry, including immunoassay. Since * Corresponding author. Tel.: (+l 916) 752-7399; fax: (+I 916) 752-2924. 0003-2670/96/$15.00 Q 1996 Elsevier Science B.V. All rights reserved PII SOOO3-2670(96)00394-7 immunoassays are not commonly coupled to chro- matographic systems which might separate the compounds prior to analysis, one has the added complexity of wanting to being able to determine mixtures with detector systems of varying degrees of selectivity for analytes. The quantitative data obtained from a single immunoassay only have a valid interpretation when either the antibody used is monospecific for a particular analyte or if the sample is known not to contain any possible cross-reactants; otherwise, it is impossible to tell whether the signal obtained is due
-
Upload
geoffrey-jones -
Category
Documents
-
view
213 -
download
1
Transcript of A procedure for the immunoanalysis of samples containing one or more members of a group of...

ANALYTICA CHIMICA ACTA
Analytica Chimica Acta 336 (1996) 175-183
A procedure for the immunoanalysis of samples containing one or more members of a group of cross-reacting analytes
Geoffrey Jonesa, Monika Wortbergb, Bruce D. Hammockc, David M. Rockea2*
‘Graduate School of Management, University of California, Davis, CA 95616, USA
b BASFAG, Agricultural Research Station, APVUS, D-67144 Limburgerhoj Germany
‘Department of Entomology and Environmental Toxicology, UniversiQ of California, Davis, CA 95616. USA
Received 12 April 1996; revised 23 July 1996; accepted 30 July 1996
Abstract
The information obtained from a single-antibody immunoassay can be ambiguous when the identity of the analyte is unknown and could be one of a group of compounds all having different affinities for the antibody. If we allow the possibility of mixtures of analytes the difficulty of the situation is aggravated. However, additional information can sometimes be obtained by assaying with a number of different antibodies. We demonstrate a rationale for identifying and quantifying
analytes from a group of candidates, and illustrate the application of our method with an example from the class of s-triazine herbicides. Using a four-antibody array, correct identification and accurate quantification were usually achieved for single- analytes samples in the low ppb range. Mixtures of analytes were recognized as such but were more difficult to classify correctly, with some confusion arising between members of subgroups, particularly within the methoxy/methylthio substituted triazines. The mathematical perspective is used to suggest directions for improving the experimental performance of multianalyte immunoassay.
Keywords; Immunoassay; Cross-reactivity; Multianalyte
1. Introduction
In analytical chemistry, the identity of a compound is not usually proven directly: rather one attempts to disprove it under conditions of increasing rigor. When those conditions become sufficiently rigorous
we then accept the resulting data as proof of identity. The problem of proof extends to all aspects of analytical chemistry, including immunoassay. Since
* Corresponding author. Tel.: (+l 916) 752-7399; fax: (+I 916)
752-2924.
0003-2670/96/$15.00 Q 1996 Elsevier Science B.V. All rights reserved
PII SOOO3-2670(96)00394-7
immunoassays are not commonly coupled to chro- matographic systems which might separate the compounds prior to analysis, one has the added
complexity of wanting to being able to determine mixtures with detector systems of varying degrees of selectivity for analytes.
The quantitative data obtained from a single immunoassay only have a valid interpretation when
either the antibody used is monospecific for a particular analyte or if the sample is known not to contain any possible cross-reactants; otherwise, it is impossible to tell whether the signal obtained is due

176 G. Jones et al./Analytica Chimica Acta 336 (1996) 175-183
to an amount of the analyte under investigation or a
different amount of some other analyte which also has an affinity for the antibody being used. There are many ways to address this problem including the use of a completely different analytical system for validation of the results or the coupling of immuno-
chemical detection methods with chromatographic separation [ 11. One could also work on the develop-
ment of antibodies which are more specific for the analytes of interest using either monoclonal or
recombinant technology or careful hapten design and a collection of polyclonal antibodies. However,
the use of a library of antibodies to look at the same group of analytes in different ways presents an alternative solution which offers several advantages.
In case of s-triazine herbicides, for example, there are so many possible commercial compounds that it is not economical to make a separate immunoassay for each compound. An array of less specific antibodies that can recognize overlapping classes of materials has the potential to be more efficient than a
large batch of separate assays, while retaining the advantages of speed and low cost over conventional systems such as GC-MS.
A number of authors have examined the possibility of using an array of antibodies to enable identification and quantification from within a group of similar
analytes. The general approach is discussed by Kauvar [2]. Cheung et al. [3] demonstrate the use of some multivariate statistical methods in analyzing the responses from several antibodies. Karu et al. [4] give an overview and evaluation of various statistical
approaches. Wortberg et al. [5] describe the con- struction and application of an immunoarray in the case of s-triazine herbicides. The preceding deal
chiefly with single-analyte samples. Analysis of mixtures of cross-reacting analytes, when the identity of each analyte in the mixture is known, has been demonstrated by Muldoon et al. [6]. A model for such mixture analysis was proposed by Jones et al. [7] and implemented successfully for mixtures of two, three or four analytes [8].
We describe below an assay procedure for samples which might contain one or more of a class of cross- reacting analytes, combining the work by earlier authors on pattern recognition and mixture analysis. First, we present a mathematical and statistical rationale for our procedure. Then we illustrate its
application by using a four-antibody assay for eight s- triazine herbicides, including mixtures. Our examples and illustrations use competitive immunoassays with
a coating hapten format [8]; the approach, however, is general and easily adapted to other formats.
2. Response paths
First consider the case of two cross-reacting analytes assayed with two different antibodies, with
dose-response curves as shown in Fig. 1. In the absence of experimental error, we would know exactly the positions of the calibration curves. Given the responses (Yi, Y,) from an unknown sample containing one or the other of the analytes, we could take each candidate analyte in turn and calculate an estimated concentration from each assay. In one case the estimates would be consistent and, in the other,
they would not, provided that the analytes showed different patterns of cross-reactivity to the two
antibodies. Thus we could identify the analyte as the one which gave a consistent estimate, and this estimate would be the true concentration. Further-
more, we could add more possible analytes and always, provided that the cross-reactivity patterns are sufficiently different, correctly identify the unknown using only two antibodies. Unfortunately experimen- tal variation is unavoidable, so we have to pick the analyte which gives the most consistent estimates. In this section we consider how this consistency should be measured, by taking into account how experi-
1.2 Antibody 1 0.8 Antibody 2
0.0001 0.01 1 x 100 10,000 0.0001 0.01 1 x 100 10,000
Fig. I. Responses (optical densities) of two cross-reacting analytes
to two different antibodies. The identity of a single-analyte
unknown with responses (Y,, Y2) is that which gives a consistent
concentration estimate X.
G. Jones et al./Analytica Chimica Acta 336 (1996) 175-183 177
mental error impinges on the estimated concentra- tions. The situation becomes clearer if we represent the assay responses in another fashion.
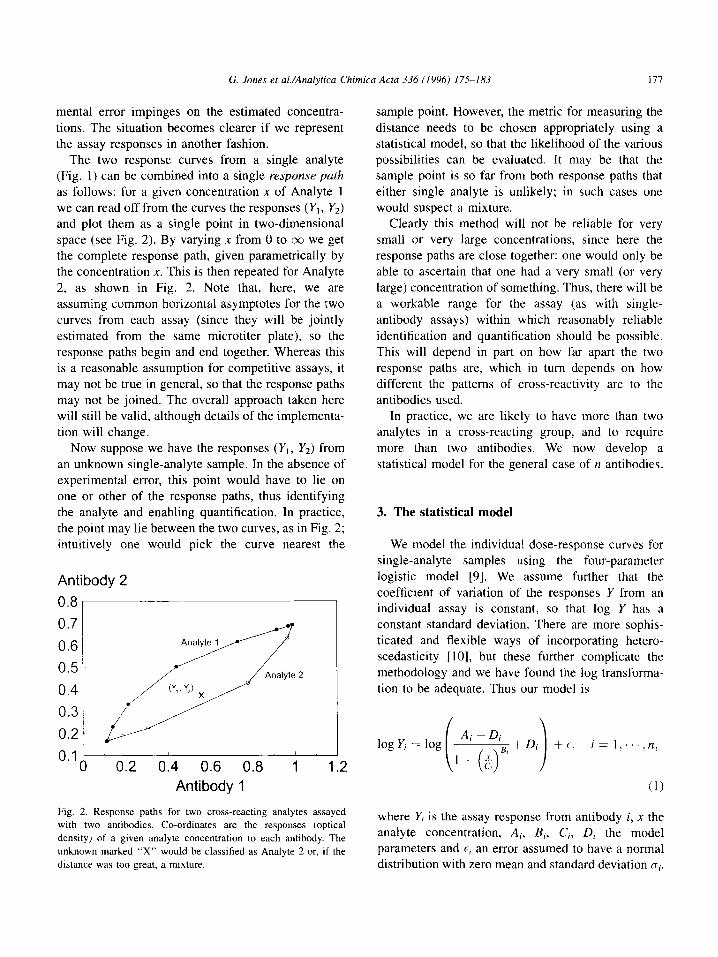
The two response curves from a single analyte (Fig. 1) can be combined into a single response path as follows: for a given concentration x of Analyte 1
we can read off from the curves the responses (Y,, YJ and plot them as a single point in two-dimensional
space (see Fig. 2). By varying x from 0 to 03 we get the complete response path, given parametrically by the concentration X. This is then repeated for Analyte 2, as shown in Fig. 2. Note that, here, we are assuming common horizontal asymptotes for the two curves from each assay (since they will be jointly
estimated from the same microtiter plate), so the response paths begin and end together. Whereas this is a reasonable assumption for competitive assays, it
may not be true in general, so that the response paths may not be joined. The overall approach taken here will still be valid, although details of the implementa- tion will change.
Now suppose we have the responses (Y, , Y,) from
an unknown single-analyte sample. In the absence of experimental error, this point would have to lie on one or other of the response paths, thus identifying the analyte and enabling quantification. In practice,
the point may lie between the two curves, as in Fig. 2; intuitively one would pick the curve nearest the
Antibody 2
0.8
0.7
0.6
0.5
0.4
0.3
-. 0 0.2 0.4 0.6 0.8 1 1.2
Antibody 1
Fig. 2. Response paths for two cross-reacting analytes assayed
with two antibodies. Co-ordinates are the responses (optical
density) of a given analyte concentration to each antibody. The
unknown marked “X” would be classified as Analyte 2 or, if the
distance was too great, a mixture.
sample point. However, the metric for measuring the
distance needs to be chosen appropriately using a statistical model, so that the likelihood of the various possibilities can be evaluated. It may be that the sample point is so far from both response paths that either single analyte is unlikely; in such cases one would suspect a mixture.
Clearly this method will not be reliable for very small or very large concentrations, since here the response paths are close together: one would only be able to ascertain that one had a very small (or very
large) concentration of something. Thus, there will be a workable range for the assay (as with single- antibody assays) within which reasonably reliable
identification and quantification should be possible. This will depend in part on how far apart the two response paths are, which in turn depends on how
different the patterns of cross-reactivity are to the antibodies used.
In practice, we are likely to have more than two analytes in a cross-reacting group, and to require more than two antibodies. We now develop a
statistical model for the general case of n antibodies.
3. The statistical model
We model the individual dose-response curves for single-analyte samples using the four-parameter logistic model [9]. We assume further that the
coefficient of variation of the responses Y from an individual assay is constant, so that log Y has a
constant standard deviation. There are more sophis- ticated and flexible ways of incorporating hetero- scedasticity [IO], but these further complicate the methodology and we have found the log transforma-
tion to be adequate. Thus our model is
log Y, = log +t, i= I:...n.
(1)
where Y, is the assay response from antibody i, x the analyte concentration, A;, B,, C,, D, the model parameters and E; an error assumed to have a normal distribution with zero mean and standard deviation g,.

178 G. Jones et al./Analytica Chimica Acta 336 (1996) 175-183
Here, Ai and Di represent, respectively, the assay sample were indeed Analyte 2, would be less than response at zero and infinite analyte concentration, Ci 0.01, and we would probably conclude that it was not the 1Csa (the concentration giving 50% inhibition), Analyte 2. If both distances were improbably large, and Bi a slope parameter. we could next consider the possibility of a mixture.
The values of A, B, C, D and IT would, in fact, be estimated by assaying a set of standard concentra-
tions along with the unknowns. We assume here that this estimation is precise, so that the parameter values are known. It is convenient now to write
4. Mixture analysis
log Yi =fi(x) + Ei, (2)
wherefi(x) is a known function as given in Eq. (1). By assumption, log x is normally distributed with mean fi(x) and standard deviation gi, so we now find that
The possibility of a multi-analyte sample can be
explored using the extended four-parameter logistic model of Jones et al. [7]. The response Y, from a
binary mixture of analytes with concentrations (xi, x2) is modeled by
(3) ci
log Yi = log
which represents the error distance in terms of multiples of its standard deviation, follows a standard
normal distribution. Since the assays with different antibodies can be regarded as statistically indepen- dent these variables are independent for each i.
Statistical theory then suggests ([ll], p.177) that
+ fi, i = l;..,n, (5)
where Ai, Bij, Co, Di are the parameters of the calibration curve for analytej with antibody i, and Bi*
is the geometric mean of Bil and Bi2.
(4)
i.e. the quantity d2 as defined here should follow a
known distribution: the chi-square distribution with n degrees of freedom. Furthermore, d can be regarded as a distance in n-dimensional space. If in Fig. 2, we
re-scale each axis by taking logs and dividing by the estimated cr, then d becomes the ordinary Euclidean
distance between the sample point and the curve. The true value x is, in fact, not-known, so we
estimate it by the value X which gives the closest distance to the curve. This is found analytically by minimizing over x the expression for d2 in Eq. (4). The resulting minimum distance should approxi- mately follow a Xi-i distribution (one degree of freedom is lost because of the estimation of x). Thus
tabulated values of the chi-square distribution can be used to decide if the distance from the sample point to a given response path is improbably large. For example, if the distance from the sample point to Analyte 2 in Fig. 2 gave d=7.0, tables (XT) tell us that the probability of obtaining such a result, if the
If we use two antibodies, we solve a pair of non- linear simultaneous equations for the estimation of (xi, x2); if there are more than two antibodies, we choose (xi, x2) to minimize d2 of Eq. (4), with fi(x) replaced byfi(xi, x2) as in Eq. (5). As before, if we are using the correct pair of analytes for a given sample, d2 will follow a chi-squared distribution. Since we are now estimating two extra parameters, xl
and x2, the appropriate distribution will be Xi_*. Our proposed analysis, having obtained estimates
of the curve parameters using standard concentrations of all analytes in the group, is to first calculate the distance from a sample point to each of the single-
analyte response paths. If any of these are plausible when referred to the appropriate chi-square distribu- tion, the corresponding analyte and concentration are considered as plausible determinations of the un- known sample (there may be more than one plausible analyte within the group). If all single analytes give implausible answers, we search all possible binary combinations until a set of plausible solutions is
found. In practice this may produce several possibilities
for the composition of the unknown sample, but these

G. Jones et al./Analytica Chimica Acta 336 (I 996) 175-l 83 179
will be ranked in order of plausibility by their d2
value. Strict adherence to the maximum likelihood principle ([ 1 I], p.254) would suggest that we accept the solution with the smallest d2, but it is important to be aware of other close alternatives. It may therefore be worthwhile proceeding with the binary mixture analysis even if we obtain a satisfactory solution at the first stage. One could go a stage further and examine possible ternary mixtures, but without a large number of discriminating antibodies this is
likely to produce a confused picture since there may be many acceptable combinations of analytes. Further
refinement of the experimental procedure, particu- larly in the careful choice of suitable antibodies, will be necessary for the successful analysis of complex mixtures.
5. Examples
We now illustrate and evaluate this method of analysis using single analytes and binary mixtures
chosen from the class of s-triazine herbicides and their metabolites (see Fig. 3). For each unknown
Cl
“azines”
Cl Cl
NAN NAN ANJaN_ _NgEN_ ~N‘NNQAN_
H H H H H H
Atrazine Simazine Cyanazine
metabolites of “azines”
27 NnN 2 NnN
Hydroxyatrazine Deethylatrazine
“trynsltons”
OCH3
Promebyn Terbubyn Prometon
Fig. 3. Some of the s-triazines and their metabolites.
sample there are three decisions to be made: is the
unknown a single analyte or a mixture, which analytes are present, and at what concentrations?
5.1. Single analyte
Here, we re-analyze the data given in Wortberg et al. [5]. Standard curves were obtained for prometon, atrazine, simazine, cyanazine, hydroxyatrazine, pro- metryn, terbutryn and deethylatrazine on a single
microtiter plate, together with fourteen unknown samples in duplicate (see Fig. 4). Four such plates
were treated with four different antibodies: AM7B2.1 [12], KlF4 [13], #2652 [14] and #4653 1151. This was repeated with another set of four plates using different unknowns, thus giving a total of 28
unknown samples to be determined. The unknowns were all single analytes at concentrations of 0.75, 1.5
or 5 ppb, excepting two samples per plate which were negative controls. A full description of the assay procedure is given in Wortberg et al. [5].
In the analysis, we first assume a single analyte and
calculate the minimum distance to each of the eight response paths, using Eq. (4). These distances are
referred to a xi distribution (e.g. the 95th percentage point is 7.81) for assessing their likelihood. For example, one sample contained simazine at 5 ppb.
The results for this sample are shown in Table 1. The only acceptable possibility is that the sample contains simazine, and the estimated concentration of 4.65 ppb turns out to be quite accurate.
A less successful example is given by the sample containing 0.75 ppb terbutryn. The results are shown
* STANDARDS iNKNOWN%
Prcxlleton so1 so1 ‘SO2 so2 ‘SO3 IS03 so4 so4 UOI uo2 uo3 so5
so1 ,SOl so2 so2 so3 so3 so4 so4 UOl uo2 uo3 so5 I I --- ~--- 10000
A,MZl%?
Slmaztne SO1 SO1 SO2 SO2 SO3 SO3 SO4 SO4 “04 UO5 U06 SO6
11 zero Cya”ar,“e so1 so1 so2 so2 so3 so3 so4 so4 UO4 uo5 UO6 SO6
OHa,rar,ne SO1 SO, so2 so2 SO3 so3 so4 SO4 uo7 UO8 uo9 u13 _~~~
prometryn so1 so1 so2 so2 so3 so3 so4 so4 uo7 UO8 uo9 VI3
:- _~ 1_
Teibutryn SO1 so1 so2 so2 so3 so3 SO4 so4 UlO “11 “12 u14
lJEa,,az,“e so1 so1 so2 ‘SO2 $03 so3 so4 so4 VI0 Ull u12 Ul4 1 --c--c-
0.5 1 .o 2.0 10.0 pr.‘b
Fig. 4. Template for the first experiment showing locations of
standards (Sxx) and unknowns (Uxx).

180 G. Jones et al./Analytica Chimica Acta 336 (1996) 175-183
Table 1 Table 3
Results for a sample containing 5 ppb simazine. d*=squared
distance from the sample response to the response path of the
assumed analyte; p=probability of getting d* as large as this
assuming a x: distribution
Assumed analyte Cont. (ppb) d2
Prometon 0.33 173.99
Atrazine 1.15 10.39
Simazine 4.65 2.11
Cyanazine 1.34 15.93
Ohatrazine 0.00 233.87
Prometryn 0.50 166.80
Terbutryn 0.45 166.72
Deatrazine 0.00 233.80
P
<O.OOOl
0.0155
0.5500
0.0012
<0.0001
<0.0001
<0.0001
<0.0001
Summary of results from assaying 24 single-analyte samples,
showing whether the correct single analyte was chosen (based on
lowest d’), whether the d* statistic was acceptably low (at 5%
significance level) and whether assumption of a binary mixture
gave significant improvement.
Add 2nd No 10 2 1 3
Analyte Yes - 7 I
Table 2
Results for a sample containing 0.75ppb terbutryn. All of the d* values seem improbably large, so we would next try a binary
mixture analysis
was causing a false positive. Spatial trends can sometimes be observed on microplate data [ 161, variously ascribed to inhomogeneity of the plate material, temperature gradients, misalignment of the plate reader and other effects.
Assumed analyte
Prometon
Atrazine
Simazine
Cyanazine
OHatrazine
Prometryn
Terbutryn
Deatrazine
Cont. (ppb) d*
0.52 16.99
0.76 67.79
3.23 88.82
0.53 137.96
0.00 162.17
0.84 13.93
0.73 15.97
1 .I3 155.43
P
0.0007
<0.0001
<0.0001
<0.0001
<0.0001
0.0030
0.0012
<0.0001
in Table 2. None of the single-analyte possibilities is
really acceptable, and the distances for prometon, prometryn and terbutryn are similar. (The difficulty of distinguishing between these three with this array of
antibodies was noted by Wortberg et al. [5]). We now search through all possible binary combinations, and
find that the fit can be improved significantly by including a small amount of hydroxyatrazine, although the resulting distance is still rather large. Our conclusion would probably be that the sample contains either prometon, prometryn or terbutryn, with perhaps a small amount of hydroxyatrazine. The estimate for hydroxyatrazine in the mixture analysis was 0.05 pbb, a seemingly negligible amount, but the antibody here, #4653, was extremely sensitive to
hydroxyatrazine (ZCSO=O.l ppb), enough to reduce the d2 value from 15.97 to 7.64. Close examination of the data revealed that a few adjacent samples had the same characteristic of wanting to add hydroxyatra- zine; apparently, a spatial effect on one of the plates
A summary of the results for the 24 positive
samples is given in Table 3, showing whether the correct analyte was identified at the first stage,
whether the distance statistic at this stage was acceptably small, and whether this could be improved
using binary mixture analysis. Out of the 24 samples, 19 succeeded in identifying the correct analyte at the
first stage, but in nine of those cases the distance from the model, d2, was unacceptably large and in seven of those the addition of a second analyte (i.e. a binary
mixture) gave a significant improvement in fit. Four of the five incorrect identifications arose from confusion between prometon, prometryne and terbu-
tryn. The fifth was actually 0.75ppb simazine, and the d2 value of 4.19 was acceptable for simazine but a better fit was achieved by assuming cyanazine
(d*=2.60).
5.2. Binary mixtures
The goal here was to identify and quantify binary mixtures of triazine herbicides out of a pool of eight possibile candidates. These herbicides were atrazine, simazine, cyanazine, prometryn, prometon, terbutryn and the two atrazine metabolites hydroxyatrazine and
deisopropylatrazine. For this experiment, we used the antibodies AM7B2.1, KlF4, #4652 [15] and #2282
[ 171. The plate template and the general assay procedure were as in the single-analyte experiment above. Again two sets of plates were used, giving a total of 28 unknown samples to be determined. All
Correct identity Incorrect identity
Acceptable d2 too high Acceptable d2 too high

G. Jones et al./Analytica Chimica Acta 336 (IYY6) 175-183 181
were binary mixtures of 1 ppb of each of two
analytes, except for two negative controls and one sample of 1 ppb atrazine only.
Analysis procceeded as above, first assuming a single analyte and comparing the d2’s with a x: distribution, then, if this assumption proved unten- able, assuming a binary mixture and comparing with xl. We illustrate here with the results from a sample containing 1 ppb simazine and 1 ppb
prometon. Single-analyte analysis gave the shortest distance to any of the response paths as 29.7, which,
when referred to xi, has a probability less than 0.00001. Mixture analysis indicates three possible binary mixtures (with acceptably small d2) as shown in Table 4. The rather high estimate for deisopropylatrazine reflects the lower sensitivity to
this analyte in our chosen array of antibodies. We would probably conclude that the unknown contained either atrazine and prometon or simazine and prometon. We can illustrate the uncertainty in the estimated concentrations by calculating d2 over an
array of values near the estimates and drawing a contour plot as in Fig. 5. The use of such plots for producing confidence regions for the estimates is under investigation.
A summary of the results of the analysis of the 25 mixtures is given in Table 5. As noted by Wortberg
et al. [5], the analytes tend to fall into groups with respect to their cross-reactivities: the chloro-s- triazines (atrazine, simazine, cyanazine), the meth-
oxy/methylthio-s-triazines (prometon, prometryn
and terbutryn) and hydroxymetabolites (hydroxya-
trazine). The dealkylated chloro-s-triazine (deisopro-
pylatrazine) was relatively unreactive with all our antibodies but tended to behave like the first group, and its presence was often masked by the other analytes. As the overall results show, the assay
Table 4
Results for binary mixture analysis of a sample containing I ppb
simazine and 1 ppb prometon. Only three assumed mixtures are
shown; the other 25 combinations gave p-values less than 0.0007.
Assumed analytes Cont. (ppb) d2 P
I 2 I 2
Atrazine Prometon 0.42 0.67 2.05 0.36
Simazine Prometon 0.67 0.72 3.53 0.17
Dtatrazine Prometon 12.76 0.72 5.94 0.05
0.0 0.5 1 .o 1.5
Prometon ppb
Fig. 5. Contour plot of log(d*) for a sample containing I ppb
simazine and lppb prometon, assuming a binary mixture of
simazine and prometon.
Table 5
Summary of results from assaying 25 binary mixtures showing the
outcome and whether the d2 statistic was acceptably low
Correct correct Single Incorrect
mixture group analyte group
Acceptable 3 7 4 0
d2 too high 1 8 2 0
was quite successful at indicating the correct group or groups, but less successful at distinguishing between possible combinations within groups. Thus,
for example, a mixture of atrazine and prometryn was identified as cyanazine and prometon, or possibly
cyanazine and terbutryn. A mixture of prometon
and terbutryn appeared to contain terbutryn only. The estimated concentrations using the correct
identities were reasonably accurate, whether or not this was identified as one of the possible answers.
6. Discussion
We have illustrated a methodology for immunoa-
nalysis of samples which might contain one or more from a group of cross-reacting analytes. One obvious application is in cases where a complete set of monospecific antibodies for each of the analytes does not exist. However, this approach

182 G. Jones et al./Analytica Chimica Acta 336 (1996) 175-183
might be useful even when there are monospecific antibodies available. If samples could be placed into groups using a small number of antibodies
with significant cross-reactivities, and individual members of each group could then be identified
using a smaller number of more specific antibodies, then the resulting assay procedure could generally use less antibodies and, hence, be more efficient. We
could thus have a hierarchical system starting with a single screening assay, then a multiple assay for positive samples sorting them into groups, and a final assay for each group to distinguish between its members.
Our results suggest that the method has potential,
but we are still far from reliable identification in every case. Further difficulties could be expected in
applying the method to mixtures of more than two analytes, or binary mixtures in which one component was at a much higher concentration than the other.
Although some success has already been achieved in this area in cases where the number of candidate
analytes is small [8], the difficulty is compounded here by having a large number of possible candidates. In the present situation, our particular antibody array lacked the power to discriminate between certain combinations of analytes and we now consider some reasons for this.
Firstly, the pattern of cross-reactivities has to be sufficiently different for each analyte. We have noted
the difficulty in separating prometon, prometryn and
terbutryn: this occurs because they all had similar cross-reactivity patterns across the antibodies. We are
developing antibodies with more discriminatory power which should increase the utility of our approach.
Secondly, ranges of sensitivity were different. For example, in the first assay the lowest Kso for deethylatrazine was 12 ppb: for hydroxyatrazine it was 0.1 ppb. The assay could perhaps be improved by decreasing the sensitivity of some of the assays to get
a similar dynamic range to each analyte. Another and possibly preferable solution would be to use a dilution series for each unknown.
Thirdly, the size of experimental error (coefficient of variation) can be crucial for multi-analyte analysis. If the individual assays are not very precise this can seriously degrade the performance of the multiple assay. We have noted above a problem
with spatial effects, which have the potential to give rise to very misleading conclusions (see also [16]). Precision could be greatly improved if spatial variations could be eliminated. Another factor contributing to low precision is the limited space
available on the microtiter plate, so that there has to be a small number of standards for the calibration curves, and few replicates of each unknown. A
possible solution is to use separate plates as suggested by Jones et al. [18]. Analytical chemists can certainly encourage manufacturers to work in
these directions. As we look into the future of immunoassay technology it is likely that we will see miniaturized immunoassays which among other
things will allow more replicates of each assay and many assays to be run on a single plate (see [ 191). This will certainly increase precision as computer averaging systems have done in other branches of analytical chemistry such as mass spectrophotometry
WI. Finally, the assumptions made in deriving the
distribution of the minimum d* statistic were probably not valid for our data, particularly our assumption that the curve parameters A, B, C, D and
0 are precisely estimated. This would explain why our d* statistic was sometimes too large. The use of separate plates, enabling more standards to be used for each curve, might improve this; otherwise a more
complicated statistical argument would be required. We are currently investigating all of the above
possibilities, and hope that some of these approaches can be extended more generally to assist in the interpretation of results from a variety of methods in multi-analyte analysis.
Acknowledgements
This research was supported by NIEHS Superfund
2P42-ES04699, NSF DMS 93-01344, 94-06193 and 9510511, US EPA CR 819047, USDA Forest Service NAPIAP R8-27, Center for Ecological Health Research CR 819658, NIEHS Center for Environ- mental Health Sciences IP30-ES05707 and Water Resources Center grant No. W-840. B.D. Hammock is a Burroughs Wellcome Toxicology Scholar. M. Wortberg is a fellow of the Deutsche Forschungsge- meinschaft.

G. Jones et al./Analytica Chimica Acta 336 (1996) 175-183 183
References
Ill
121
131
L41
151
161
[71
[Xl
L91
IlO1
II II
P.M. Kramer, Q.X. Li and B.D. Hammock, Journal of AOAC
International, 77(5) (1994) 1275.
L.M. Kauvar, in D.A. Kurtz, J.H. Skerritt and L. Stanker
(Eds.), Toxic-chemical detection by pattern recognition, New
Frontiers in Agrochemical Immunoassay, AOAC Intema-
tional, Arlington, VA, 1995.
P.Y.K. Cheung, L.M. Kauvar, A.E. Karu and L.S. Ramos,
Anal. Chim. Acta, 282 (1993) 18 I. A.E. Kant, T.H. Lin, L. Breiman, M.T. Muldoon and J. Hsu,
Food Agric. Immunol., 6 (1994) 371.
M. Wortberg, G. Jones, S.B. Kreissig, D.M. Rocke, S.J. Gee
and B.D. Hammock, Anal. Chim. Acta, 319 (1996) 291.
M.T. Muldoon, G.F. Friese and J.O. Nelson, J. Agric. Chem.,
41 (1993) 322.
G. Jones, M. Wortbeg, S.B. Kreissig, S.J. Gee, B.D. Hammock and D.M. Rocke, J. Immunol. Meth., 177 (1994)
1.
M. Wortberg, S.B. Kreissig, G. Jones, D.M. Rocke and B.D.
Hammock, Anal. Chim. Acta, 304 (1994) 339.
D. Rodbard, in J. Langan and J.J. Clapp (Eds.), Mathematics
and statistics of ligand assays: An illustrated guide, Ligand
Assay: Analysis of International Developments on Isotopic
and Nonisotopic Immunoassay, Masson, New York, 1981.
M.A. O’Connell, B.A. Belanger and P.D. Haaland, Chemo-
metrics and Intelligent Laboratory Systems, 20 (1992) 97.
J.A. Rice, Mathematical Statistics and Data Analysis, 2nd
edn., Duxbury Press, Belmont, CA, 1995.
A.E. Kant, R.O. Harrison, D.J. Schmidt, C.E. Clarkson, J.
Grassman, M.H. Goodrow, A.D. Lucas, B.D. Hammock,
J.M. Van Emon and R.J. White, in M. Vanderlaan, L.H.
Stanker, B.E. Watkins and D.W. Roberts (Eds.), Monoclonal
immunoassay of triazine herbicides, Immunoassays for Trace
Chemical Analysis; ACA Symposium Series No. 45 1; ACS,
Washington, DC, 1991, p.59.
T. Giersch and B. Hock, Food Agric. Immunol., 2 (1992) 85.
A.D. Lucas, M.H. Goodrow, J.N. Seiber and B.D. Hammock,
Food Agric. Immunol., 7(3) (1995) 27-241.
H. Kido, M.H. Goodrow. V. Griffeth. A.D. Lucas, S.J. Gee
and B.D. Hammock, J. Agric. Food Chem.. submitted for
publication.
I.C. Shekarchi, J.L. Sever, Y.J. Lee, G. Castellano and G.L. Madden, J. Clin. Microbial., 19 (1984) 89.
M. Wortberg, M.H. Goodrow, S.J. Gee and B.D. Hammock,
J. Agric. Food Chem., 44 (1996) 2210-2219.
G. Jones, M. Wortberg, S.B. Kreissig. B.D. Hammock and
D.M. Rocke, Anal. Chim. Acta, 313 (1995) 197.
R.P. Ekins and F.W. Chu, in J.O. Nelson, A.E. Karu and R.B.
Wong (Eds.), Miniaturized Microspot Multianalyte Immu-
noassay System, Immunoanalysis of Agrochemicals: Emer-
ging Technologies; ACS Symposium Series No. 586: ACS,
Washington, DC, 1995, p. 153.
B.D. Hammock and SC. Gee, in J.O. Nelson, A.E. Karu and
R.B. Wong (Eds.), Impact of Emerging Technologies on
Immunochemical Methods for Environmental Analysis,
Immunoanalysis of Agrochemicals: Emerging Technologies;
ACS Symposium Series No. 586, ACS. Washington. DC,
1995, p. 1.