A Probabilistic Framework for Modelling and Real …qji/Papers/smc_fatigue.pdf · A Probabilistic...
24
1 A Probabilistic Framework for Modelling and Real-Time Monitoring Human Fatigue Peilin Lan, Qiang Ji, Carl G. Looney Abstract—In this paper, we introduce a probabilistic framework based on the Bayesian Networks (BNs) for modelling and real-time inferring human fatigue by inte- grating information from various visual cues and certain relevant contextual information. We first present a static Bayesian network that captures the static relationships between fatigue, significant factors that cause fatigue, and various visual cues that typically result from fatigue. The static fatigue model is subsequently parameterized based on the statistics extracted from recent studies on fatigue and on subjective knowledge. Such a model provides mathematically coherent and sound basis for systemati- cally aggregating visual evidences from different sources, augmented with relevant contextual information. The static model, however, fails to capture the dynamic aspect of fatigue. Fatigue is a cognitive state that is developed over time. To account for the temporal aspect of human fatigue, the static BNs model is extended based on the Dynamic Bayesian Networks (DBNs). The dynamic fatigue model allows to integrate fatigue evidences not only spatially but also temporally, therefore leading to a more robust fatigue modelling and inference. This paper also includes a review of modern phys- iological and behavioral studies on human fatigue and a detailed critical review of the existing techniques for Peilin Lan, Department of Computer Science, University of Nevada at Reno, NV 89557, USA. Qiang Ji, Department of Electrical, Com- puter, and Systems Engineering, Rensselaer Polytechnic Institute, Troy, NY 12180, USA. Carl G. Looney, Department of Computer Science, University of Nevada at Reno, NV 89557, USA. Questions about this paper, please address to Dr. Qiang Ji at [email protected] fatigue monitoring and detection. The paper ends with a discussion of the interface program we developed, that combines our computer vision system for visual cues extraction with the fatigue inference engine for real-time non-intrusive human fatigue monitoring and detection. Index Terms— Bayesian Networks, human fatigue mon- itoring, information fusion, Dynamic Bayesian Networks I. I NTRODUCTION Fatigue has been widely accepted as a significant fac- tor in a variety of transportation accidents [5]. Although it is difficult to determine the exact number of accidents due to fatigue, it is much likely to be underestimated. In aviation, the Federal Aviation Administration (FAA) revealed that 21% of the reports in the Aviation Safety Reporting System (ASRS) were related to general is- sues of fatigue and 3.8% of them were directly related with fatigue [5]. A survey from 1,488 corporate crew members in US Corporate/Executive Aviation operation discovered that about 61% of these crew-members ac- knowledged the common occurrence of fatigue during operation. Furthermore, 71% of these pilots had “nodded off” during some flights [38]. In highway, the National Highway Traffic Safety Administration (NHTSA) esti- mates that 100,000 crashes are caused by drowsy drivers, which results in more than 1,500 fatalities and 71,000 injuries each year in US. This amounts to about 1.6%
Transcript of A Probabilistic Framework for Modelling and Real …qji/Papers/smc_fatigue.pdf · A Probabilistic...

1
A Probabilistic Framework for Modelling and Real-Time Monit oring
Human Fatigue
Peilin Lan, Qiang Ji, Carl G. Looney
Abstract— In this paper, we introduce a probabilistic
framework based on the Bayesian Networks (BNs) for
modelling and real-time inferring human fatigue by inte-
grating information from various visual cues and certain
relevant contextual information. We first present a static
Bayesian network that captures the static relationships
between fatigue, significant factors that cause fatigue, and
various visual cues that typically result from fatigue. The
static fatigue model is subsequently parameterized based
on the statistics extracted from recent studies on fatigue
and on subjective knowledge. Such a model provides
mathematically coherent and sound basis for systemati-
cally aggregating visual evidences from different sources,
augmented with relevant contextual information. The static
model, however, fails to capture the dynamic aspect of
fatigue. Fatigue is a cognitive state that is developed over
time. To account for the temporal aspect of human fatigue,
the static BNs model is extended based on the Dynamic
Bayesian Networks (DBNs). The dynamic fatigue model
allows to integrate fatigue evidences not only spatially but
also temporally, therefore leading to a more robust fatigue
modelling and inference.
This paper also includes a review of modern phys-
iological and behavioral studies on human fatigue and
a detailed critical review of the existing techniques for
Peilin Lan, Department of Computer Science, University of Nevada
at Reno, NV 89557, USA. Qiang Ji, Department of Electrical, Com-
puter, and Systems Engineering, Rensselaer Polytechnic Institute,
Troy, NY 12180, USA. Carl G. Looney, Department of Computer
Science, University of Nevada at Reno, NV 89557, USA. Questions
about this paper, please address to Dr. Qiang Ji at [email protected]
fatigue monitoring and detection. The paper ends with a
discussion of the interface program we developed, that
combines our computer vision system for visual cues
extraction with the fatigue inference engine for real-time
non-intrusive human fatigue monitoring and detection.
Index Terms— Bayesian Networks, human fatigue mon-
itoring, information fusion, Dynamic Bayesian Networks
I. I NTRODUCTION
Fatigue has been widely accepted as a significant fac-
tor in a variety of transportation accidents [5]. Although
it is difficult to determine the exact number of accidents
due to fatigue, it is much likely to be underestimated.
In aviation, the Federal Aviation Administration (FAA)
revealed that 21% of the reports in the Aviation Safety
Reporting System (ASRS) were related to general is-
sues of fatigue and 3.8% of them were directly related
with fatigue [5]. A survey from 1,488 corporate crew
members in US Corporate/Executive Aviation operation
discovered that about 61% of these crew-members ac-
knowledged the common occurrence of fatigue during
operation. Furthermore, 71% of these pilots had “nodded
off” during some flights [38]. In highway, the National
Highway Traffic Safety Administration (NHTSA) esti-
mates that 100,000 crashes are caused by drowsy drivers,
which results in more than 1,500 fatalities and 71,000
injuries each year in US. This amounts to about 1.6%

2
of all crashes and about 3.6% of fatal crashes [5]. In
marine, a 1996 US Coast Guard (USCG) analysis of
279 incidents showed that fatigue contributed to 16% of
critical vessel casualties and 33% of personal injuries
[5]. In railroad, an analysis from the Safety Board of
Federal Railroad Administration (FRA) reported that
there were also 18 cases which were coded ”operator fell
asleep” as a causal or contributing factor from January
1990 to February 1999 [5]. Therefore, it is hard to
overstate that human fatigue prevention is very essential
to improving transportation safety.
Since several decades ago, much research has been
conducted on human fatigue prevention, focusing on
two main thrusts. The first one is to understand the
physiological mechanism of human fatigue and how to
measure fatigue level [43] [37] [11]. The second
thrust focuses on developing human fatigue monitors
for commercial transportation based on the achievements
from the first effort [28] [43]. So far, these fatigue
monitoring systems can be classified into two categories
[51]: (a) measuring the extent and time-course of loss
of driver alertness and (b) developing real-time, in-
vehicle drowsy driver detection and alerting systems.
However, human fatigue results from a very complicated
mechanism and many factors affect fatigue in interacting
ways [38] [9] [43] [39]. Up to now, the fatigue
mechanism is still not well understood and few of these
existing monitoring systems are effectively used in real
world. The main drawback of them is that most of the
present safety systems only acquire information from
limited sources (often just one). Therefore, as pointed
by some researchers [21], many more efforts are still
needed to develop systems for fatigue prevention in
commercial transportation.
In our previous study [28] [27], we developed a non-
invasive computer vision system for extracting various
visual parameters that typically characterize human fa-
tigue. The systematic integration of these visual param-
eters, however, requires a fatigue model that models the
fatigue generation process and is able to systematically
predict fatigue based on the available visual observations
and the contextual information. In this paper, based on
the modern research achievements of fatigue studies [38]
[9] [51] [43] [39] and our previous successful studies
[28] [27], we present a probabilistic and dynamic frame-
work based on the Bayesian Networks for human fatigue
modeling and monitoring. The framework combines dif-
ferent information sources spatially and temporally to
monitor and infer human fatigue.
II. L ITERATURE REVIEW
A. Significant causes for fatigue
From the physiological view, it is widely accepted that
fatigue, alertness and performance are physiologically
determined [38] [9] [39] [37]. Two physiological
factors - sleep and circadian, are thought fundamental
to the determination of fatigue and alertness. Therefore,
all the factors that affect sleep and circadian system have
the potential to contribute to fatigue.
The modern scientific research has proved that sleep
is a vital physiological human being need like food,
water and air. The difference between sleep and other
physiological needs is that sleepiness is such a pow-
erful biological signal that you will fall asleep in an
uncontrolled and spontaneous way regardless of your
situation [37]. Although the world record of staying
awake is up to 264 hours, the average sleep time of a
person requires about 8 hours every day regardless of
the change of seasons [38] [9] [39] [37].

3
Sleep is a very complicated physiological process. Its
quantity and quality are influenced by many factors,
including wakefulness, time of day, age, environment,
psycho-physiological state, and the individual’s innate
and learned ability to sleep. The more complicated thing
is that these factors often interact with each other [38]
[9] [37]. A survey [38] from the corporate flight
crew members in U.S. corporate/executive aviation op-
erations by Ames Research Center at NASA revealed
that the most often identified factors that interfere with
their home sleep are: anxiety/worry (19%), heat/high
temperature (17%), high humidity (15%), random noise
events (9%), and background light (8%). The surveys
of sleep quantity and quality in the On-Board crew rest
facility by Ames Research Center at NASA [39] [43]
reported more detailed but similar information on the
factors that affect the sleep in home and bunk. Napping
is identified by the drivers in truck transportation [51]
[13] as one of the significant factors that prevent fatigue.
Some investigations showed that naps of 20-30 minutes
have very important benefits by increasing alertness and
reducing fatigue. 44% of the drivers took at least one nap
during a duty cycle. These naps increased their principal
sleep periods an average of 27 minutes, for an 11%
increase in average daily sleep time [51] [13].
A sleep loss results in essentially degradation of all
aspects of functioning, including cognitive processes,
vigilance, physical coordination, judgment and decision
making, communication, outlook, and numerous other
parameters [38] [9]. For example, the investigation
[51] [13] in real-life commercial truck transportation
revealed that the average quantity of sleep obtained by
the drivers during their principal sleep periods was an
average of two hours less sleep than their daily ”ideal”
requirements. Although the quality of their sleep period
was high, probably due to their lack of sufficient time in
bed, laboratory tests show that a sleep loss of as little as
two hours can affect alertness and performance. In fact,
these drivers were later detected drowsy while driving
about 5% of the time. 14% of the drivers accounted for
54% of all observed drowsiness episodes in video tapes.
The circadian rhythm has been found to virtually
control all physiological functions of the body, including
sleep/wake, digestion, and immune function. The circa-
dian rhythm is regulated by the circadian clock that has
been found at a certain place in the brain [38] [9]
[37] [11]. Generally, sleep is programmed at night and
awake is programmed during daytime. In addition, it is
found that there are two peaks of sleepiness and alertness
each day [38] [11]. The two sleepiness peaks appear
at approximately 3-5 a.m. and 3-5 p.m. respectively.
During the sleepiness periods, sleep may come more
easily and fatigue may reach the highest level. The two
alertness peaks come about 9-11 a.m. and 9-11 p.m..
During this period, human may be difficult to fall sleep
even if his sleep was deprived in the previous night [38]
[9] [37] [11]. These concepts are soundly supported
by the fact that there was a 16 fold increase of the
risk of single vehicle truck accidents during the time
between 3-6 a.m. [11] [20]. This is further verified
by a large scale study of fatigue factors in the North
American commercial truck transportation [51] [13],
which also showed that the strongest and most consistent
factor influencing driver fatigue and alertness was time
of day. Even the hours of driving was not a strong or
consistent predictor of observed fatigue compared with
time of day.
The circadian system is very difficult to adjust to the
need of work/rest schedule or time zone changes in a
short time. Circadian disruption can cause sleep loss and

4
finally results in fatigue [38] [9] [11].
Besides sleep and circadian, there are many environ-
mental or contextual factors that may contribute/cause
human fatigue. Recent years, a series of large-scale
survey of fatigue factors in aviation and land trans-
portation [38] [9] [43] [39] [51] identified some
important fatigue-causing factors. In aviation, the survey
from 1,488 corporate flight crew members in U.S. cor-
porate/executive aviation operations by Ames Research
Center at NASA [38] showed that besides sleep loss and
time of day of operation, the most often cited factors that
affect their fatigue in flight are: greater than 7 flying seg-
ments in the same duty, severe turbulence, illness, heavy
workload, late arrival, 4-6 flight legs, high temperature,
early morning departure, and no auto-pilot. The study
also discovered that besides sleeping or napping (73%),
the most often mentioned pre-trip strategies to prevent
fatigue were: healthy diet (41%), exercise (28%), flight
planning activities(26%), and caffeine (16%). Another
survey of fatigue factors from 1,424 crew members in
U.S. regional airline operation by Ames Research Center
at NASA [9] obtained similar results.
In land transportation, the US Federal Highway Ad-
ministration’s Office of Motor Carriers, in cooperation
with the Trucking Research Institute, and Safety and
Security Transport Canada, conducted the largest and
most comprehensive over-the-road study on driver fa-
tigue and alertness in North America from 1993 to 1996
to evaluate driver fatigue, alertness, and physiological
and subjective states of drivers as they performed in
real-life trips [51]. The study showed that although some
details were different, the main factors, which affected
the pilot’s fatigue in aviation, also contributed to the
fatigue of drivers in commercial truck transportation.
In railroad, the on-line research report [43] by Univer-
sity of Denver,Fatigue Countermeasures in the Railroad
Industry-Past and Current Developments, reported the
study results of the past and current fatigue countermea-
sures projects in almost all of the railroad companies
in North America. It presented much similar statistical
information about fatigue in the railroad industry to those
in aviation and highway transportation.
In addition to the above factors, some clinical stud-
ies [43] found that about one third of the population
suffers from several different types of clinical distur-
bances of sleep, which meet various diagnostic crite-
ria and significantly affect fatigue and alertness. These
disturbances are insomnia, which refers to too little
sleep, hypersomnia, which refers to too much sleep, and
parasomnia, which refers to a deviation from normal
sleep patterns. Insomnia is believed to be present in
about 5-6% population and mostly caused by high lev-
els of anxiety associated with worries, traumatic event
or prolonged stress from work, depression or other
sources [43]. Hypersomnia usually demonstrates itself as
a difficulty to stay awake in typical daily activity such as
travelling as a passenger in a car, watching TV, listening
to a lecture, or reading a newspaper. Snoring and sleep
apnea are thought as the common signs of hypersom-
nia [43]. Parasominas are disturbances during sleep and
are mostly caused by nightmares, sleep walking, restless
legs and bruxism or gnashing of teeth [43]. Sleep inertia
is also found to have effect on fatigue and there have
been many studies on it [43]. Usually it is thought to
have negative effect on fatigue but since it does not last
long time, it does not significantly interfere with people’s
work, such as driving.
In summary, the major causes for human fatigue
include sleep quality, circadian rhythm, and physical
fitness (e.g. sleep disorders). Furthermore, circumstan-

5
tial factors such as weather, temperature, and type of
work, will also directly contribute to human fatigue. All
of these factors should be considered while modelling
fatigue.
B. Fatigue Measurement
Before performing human fatigue detection and pre-
diction, a metric should be established to measure fa-
tigue. Numerous studies have been conducted on it.
Many studies have shown that measuring fatigue in any
situation is a complex process and no easy method is
available. Up to now, several types of fatigue measures
have been typically used in laboratories and have varying
level of utility in the workplace [43]. The typical ones
are physiological, behavioral, visual, and subjective per-
formance measures.
Physiological Measures[43] [17] [35] [7]: This
method has been thought to be accurate, valid and
objective to determine fatigue and sleep, and significant
efforts have been made in laboratory to measure it.
The popular physiological measures include the elec-
troencephalograph (EEG) [17] and the multiple sleep
latency test (MSLT) [7]. EEG is found to be useful
in determining the presence of ongoing brain activity
and its measures have been used as the reference point
for calibrating other measures of sleep and fatigue.
MSLT measures the amount of time a test subject falls
asleep in a comfortable, sleep-inducing environment.
Unfortunately, most of these physiological parameters
are obtained intrusively, making them inapplicable in real
world applications.
Behavioral Measure[43] [40]: This method has been
also thought to be accurate and objective, and gained
popularity in recent years. This category of devices, most
commonly known as actigraph [40], is used to measure
sleep based on the frequency of body movement. The
information collector is a wristwatch-like recording de-
vice that detects wrist movement and is worn by the test
subject. The number of body movement recorded during
a specified time period, or epoch, has been found to
significantly correlate with the presence of sleep and has
a significant correlation with EEG. The disadvantages of
this method is that they are troublesome to administer
and expensive.
Visual Measures: People in fatigue exhibit certain vi-
sual behaviors, which are easily observable from changes
in facial features like the eyes, head, and face. Visual
behaviors that typically reflect a person’s level of fatigue
include eyelid movement, head movement, gaze, and
facial expression. Various studies [48] [15] have shown
that eyelid activities are the bio-behavior that encodes
critical information about a person’s level of vigilance,
intention, and needs. In fact, based on a recent study
by the Federal Highway Administration [49] [15],
PERCLOS has been found to be the most reliable and
valid measure of a person’s alertness level among many
drowsiness-detection measures. PERCLOS measures the
percentage of eyelid closure over the pupil over time
and reflects slow eyelid closures (droops). Another po-
tentially good fatigue indicator is the average eye closure
and opening speed. Since eye open/closing is controlled
by the muscle near the eyes, a person in fatigue may
open/close eyes slowly due to either tired muscles or
slower cognitive processing.
Other invalidated but potentially good fatigue pa-
rameters include various parameters that characterize
pupil movement, which relates to one’s gaze and his/her
awareness of the happenings in surroundings. The move-
ment of a person’s pupil (gaze) may have the potential
to indicate one’s intention and mental condition. For ex-
6
ample, for a driver, the nominal gaze is frontal. Looking
at other directions for an extended period of time may
indicate fatigue or inattention. Furthermore, when people
are drowsy, their visual awareness cannot cover a wide
enough area, concentrating on one direction. Hence, gaze
(deliberate fixation) and saccade eye movement (con-
scious eye movement) may contain information about
one’s level of alertness. Besides eye activities, head
movement like nodding or inclination is a good indicator
of a person’s fatigue or the onset of a fatigue [3]. It could
also indicate one’s attention. Head movement parameters
such as head orientation, movement speed, frequency,
etc. could potentially indicate one’s level of vigilance.
Finally, facial expression may also provide information
about one’s vigilance. For example, a typical facial
expression that indicates the onset of fatigue is yawning.
Our recent effort [28] [27] produces a computer vision
system that can extract various parameters in real time
to characterize eyelid movement, gaze, head movement,
and facial expression. The major benefits of the visual
measures are that they can be acquired non-intrusively.
Performance Measures[43] [50]: This method uses
a number of performance tasks to determine the effects
of sleep and sleep deprivation. In the test, various tasks
ranging from simple to complex have been examined
including reaction time to visual and auditory stimuli and
vigilance tests. This method has been extensively used
by various studies including Walter Reed Performance
Assessment Battery (PAB) and the Denver Fatigue In-
ventory (a computer assisted cognitive test battery)
[46]. The advantage of this method is indirect and the
drawbacks are non-self-administered, need expert data
analysis, and is limited to laboratory studies.
Subjective performance[43] [23]: Also called Self-
Report Measures. A variety of subjective performance
measures have been developed to determine fatigue
sleepiness and alertness. The most famous ones include
the Stanford Sleepiness Scale (SSS) [23], Visual Analog
Scale (VAS) [34], mood descriptors [45], and diary
method [36]. SSS [23] method consists of seven grades
of fatigue, ranging from “wide awake” to “cannot stay
awake” and has been validated against performance mea-
sures as a function of sleep deprivation. SSS is thought as
the most widely used subjective measure of sleepiness.
VAS [34] consists of a single horizontal line presented
on a piece of paper. At either end of the lines, an
anchoring descriptor is displayed such as “wide awake”
or “about to fall asleep”. In the test, the participants are
instructed to place an X on the horizontal line between
the anchors to indicate the extent to which they best
describe their current state. VAS was initially developed
for use in educational research and has also been used in
symptom measurement. The mood descriptor lists a se-
ries of adjectives that indicate a variety of different mood
states. Subjects must then choose the adjective that best
describes their current state. The typical mood descriptor
is Thayer Activation-Deactivation Adjective Checklist
[45]. The diary method [36] requires the participants to
keep detailed logs of their activities including work and
sleep. These dairies are then used to develop descriptions
of the sleep-wake cycle of the participants and develop
a baseline for further studies. The advantages of these
methods are inexpensive, practical and readily accepted.
The drawbacks are less accurate and cannot be used for
monitoring real-time fatigue.
Multiple Measures: Since a single measurement al-
ways has some limitations or drawbacks, multiple mea-
surements are often taken to obtain comprehensive pa-
rameters in a single study. For example, in the over-the-
road study on driver fatigue in US and Canada [51],

7
many measures were taken at the same time. These
measures included driving task performance (lane track-
ing and steering wheel movement), driving speed and
distance monitoring, performance on three surrogate
tests of tasks related to safe driving performance (code
substitution, critical tracking test, simple response vigi-
lance test). Moreover, the drivers were under continuous
video monitoring. During the same test, various phys-
iological measures were taken. The measures include
Polysomnography (PSG) during sleep, Electroencephalo-
gram (EEG), Electrooculogram (EOG), Electromyogram
(EMG), Respiratory effort (sensors on chest), Oxygen
saturation of arterial blood, finger probe, PSG during
driving (EEG and EOG only), body temperature during
waking hours, and Electrocardiography (ECG) during
driving and sleep. Other data collected include driver-
supplied information (pre-participation questionnaire on
sleep habits, daily log (stops, meals, noteworthy driving
events, etc.), and Stanford Sleepiness Scale (SSS) rating.
Environmental factors such as cab temperature, relative
humidity, 8-hour concentrations of carbon monoxide
and nitrogen dioxide were also recorded. Doing so, a
comprehensive research results were obtained in the
study.
C. Fatigue Detection, Prediction and Monitoring
Knowing what causes fatigue and how to measure
fatigue, the next step (also is the most important part for
human fatigue research) is to detect, predict and monitor
real-time human fatigue. Up to now, many efforts have
been made in this field and the results were reviewed
by [28] [21] etc.. Generally, all of the efforts on the
fatigue detection can be classified into the following four
groups [15] [21].
(1). Readiness-to-perform and fitness-for-dutytech-
nologies: this type of effort is to assess the vigilance
or alertness capacity of an operator before the work
is performed. The main aim of this technology is to
establish whether the operator is fit for the duration of the
duty period, or at the start of an extra period of work.
They include Truck Operator Proficiency System [44],
FACTOR 1000 [2], ART90 [8], FITR 2000 Workplace
Safety Screener [21], OSPAT [21], and Psychomotor
Vigilance Test (PVT) [21] [32].
(2). Mathematical models of alertness dynamics joined
with ambulatory technologies: they are related to the
application of mathematical models that predict oper-
ator alertness/performance at different times based on
interactions of sleep, circadian, and related temporal
antecedents of fatigue. The key issue for these models
is their predictive validity. Three of the most common
systems are the Fatigue Audit Interdyne system [12]
[21], the US Army’s Sleep Management System [4], and
the Three-Process Model of Alertness [1] [21].
(3). Vehicle-based performance technologies. These
technologies are directed at measuring the behavior of
the driver by monitoring the transportation hardware
systems under the control of the operator, such as truck
lane deviation, or steering or speed variability. All of
these systems assume the driver behavior or the vehicle
behavior deviates from their nominal behaviors when a
driver is in fatigue. The measurements include driver
steering wheel movements, systems measuring driver’s
acceleration system on braking, gear changing, lane
deviation and distances between vehicles. These systems
include the Steering Attention Monitor (S.A.M.) [52],
which monitors micro-corrective movements in the steer-
ing wheel using a magnetic sensor that emits a loud
warning sound when it detects ”driver fatigue” by the
absence of micro-corrections to steering; the DAS 2000

8
Road Alert System [10], which detects and warns
drivers that they have inadvertently crossed the center
line or right shoulder lines; ZzzzAlert Driver Fatigue
Warning System [16], which is a small computerized
electronic device that monitors corrective movements of
the steering wheel with a magnetic sensor; TravAlert
Early Warning System [21] [24], which loudly notifies a
motor vehicle operator that the driver has lost attention
to proper steering; and the SAVE system [21] [32]
(System for effectiveAssessment of the driver state and
Vehicle control inEmergency situations) detects in real
time impaired driver states and undertakes emergency
handling.
(4). In-vehicle, on-line, operator status monitoring
technologies. This category of technologies seeks to
record bio-behavioral dimension(s) of an operator, such
as parameters characterizing eye movements, head move-
ments, facial expressions, heart activities, brain electrical
activity, reaction time etc., on-line (i.e., continuously,
during driving). They include Electroencephalograph
Measures (such as Electroencephalograph (EEG)) for
monitoring brain activity, ocular measures to characterize
eyelid movement (such as PERCLOS) and characterize
pupil movement (such as saccade movement v.s. fixation
time). Other visual measures include parameters charac-
terizing facial muscles, body postures, and head nodding.
In recent years, an increasing research interest has
focused on developing systems that detect the visual
facial feature changes associated with fatigue with a
video camera. These facial features include eyes, head
position, face or mouth. This approach is non-intrusive
and becomes more and more practical with the speedy
development of camera and computer vision technology.
Several studies have demonstrated their feasibility and
some of them claimed that their systems perform as
effectively as the systems detecting physiological signals
[6] [25] [41] [47] [19] do. However, efforts in this
direction are often directed to detecting a single visual
cue such as eyelid movement. Since a single visual
cue is often ambiguous, uncertain with the change in
time, environment or different persons, its validity is
questioned [22]. Therefore, developing new systems
that can detect the change of multiple visual cues and
systematically combine them over time is essential in
future. In the sections to follow, we introduce such a
system.
In summary, although many devices and technologies
currently being developed show considerable promise in
detection, prediction and monitoring fatigue, it is widely
believed that satisfactory fatigue monitoring technologies
for real world applications are not yet available, and may
not be available for some time [21].
III. FATIGUE MODELLING WITH STATIC BAYESIAN
NETWORKS (SBNS)
As we discussed above, human fatigue generation is
a very complicated process. Several challenges present
with fatigue modelling and monitoring. First, fatigue
is not observable and it can only be inferred from
the available observations. Second, the sensory obser-
vations are often ambiguous, incomplete, uncertain, and
dynamically evolving over time. Furthermore, human’s
visual characteristics vary significantly with age, height,
health, and shape of face. Third, many factors can cause
fatigue. These factors include sleep quality and quan-
tity, circadian, working environments, health etc. Their
effects on fatigue are often interacting and complex. To
effectively monitor fatigue, a fatigue model is necessary.
The fatigue model should be systematically account for
various factors causing fatigue and various observations

9
that reflect fatigue. In addition, the model should be
able to handle the uncertainties and dynamics associated
with fatigue. A probabilistic fatigue model based on the
Bayesian Networks (BNs) model is the best option to
deal with such an issue.
A BN is a state-of-the-art knowledge representation
scheme dealing with probabilistic knowledge. Also re-
ferred to as graphical model, a BN is a graphical
representation of the joint probability of a set of random
variables, with the conditional independence assump-
tion explicitly embedded in the network. Its nodes and
arcs connect together forming a directed acyclic graph
(DAG). Each node can be viewed as a domain variable
that can take a set of discrete values or continuous value.
An arc represents a probabilistic dependency between the
parent node and the child node. So, a BN is said to be a
graphical model resulted from a marriage between proba-
bility theory and graph theory, and provides a natural tool
for dealing with uncertainty, knowledge representation,
and inference [29]. Many of the classic multivariate
probabilistic systems in fields such as statistics, systems
engineering, information theory, pattern recognition and
statistical mechanics are found to be the special cases
of the general BNs. These examples include mixture
models, factor analysis, hidden Markov models, Kalman
filters and Ising models.
Since the introduction of the BNs in late 70’s, numer-
ous studies have been conducted and many systems have
been constructed based on this paradigm in a variety
of application areas, including industrial applications,
military, medical diagnosis and many other commercial
applications [31]. BNs can be classified into static BNs
(SBNs) and dynamic Bayesian Networks (DBNs). While
SBNs is limited to modelling static events, DBNs can
be used to model both static and dynamic events. In
this paper, we first introduce a fatigue model based on
SBNs to capture the static aspect of fatigue modelling.
The static fatigue model is subsequently extended based
on DBNs to account for the temporal aspect of fatigue
modelling.
A. Static Bayesian Network for Fatigue Modelling
The main purpose of a BNs model is to infer the
unobserved events from the observed or contextual data.
So, the first step of BNs modelling is to identify those
hypothesis events and group them into a set of mutually
exclusive events to form the target hypothesis variables.
The second step is to identify the observable data that
may reveal something about the hypothesis variables
and then group them into information variables. There
are also other hidden states that are needed to link the
hypothesis node with the information nodes.
For fatigue modelling, fatigue is obviously the target
hypothesis variable that we intend to infer while other
contextual factors, which could cause fatigue, and visual
cues, which are symptoms of fatigue, are information
variables. Since so many factors affect human fatigue
as we discussed before, it is impossible to include
all of them into a BN model. Hence, only the most
significant ones are incorporated in the model. As dis-
cussed in section II-A, the most significant causes for
fatigue are identified as sleep quality (Sleepquality),
circadian, work condition (Workcondition), work en-
vironment (Workenvironment) and physical condi-
tion(Physicalcondition). The most profound factors that
affect work environment include temperature, weather
and noise. The most significant factors affecting one’s
physical condition are sleep disorders (Sleepdisorders).
The factors affecting work conditions include work-
load and type of work (Worktype). Factors seri-
10
ously affecting sleep quality include sleep environment
(SleepEnviornment), napping, sleep time (Sleeptime)
and sleep state (Sleepstate). Sleep state refers to the
mental state during sleep such as worry or anxiety.
Factors affecting sleep environment includes random
noise (Randomnoise), background light (Light), heat
(Heat) and humidity around the bed (Humidity).
On the other hand, when a person is fatigue,
he tends to exhibit various visual behaviors that
deviate from the nominal behaviors. The behav-
iors that typically capture the cognitive state of a
person include eye movement(Eyemovement), head
movement(Headmovement), and facial expression (Fa-
cial Exp). Our current efforts [28] in computer vi-
sion research has led to various non-invasive tech-
niques that can compute in real time various parameters
to characterize these behaviors. Specifically, for eye
movement, the parameters characterize eyelid movement
(Eyelid movement) and gaze (Gaze). For eyelid move-
ment, the parameters are PERCLOS and the average eye
closure/open speed (AECS). For gaze, the parameters
include gaze fixation distribution (Fixationdis), which
measures spatial distribution of gaze over time, and Fix-
ation Saccade ratio(Fixationsaccaderatio), which mea-
sures the ratio between amount of time on purposive eye
movement (fixation) to amount of time of random (sac-
cade) eye movement. For head movement, the parameter
we compute is head tilt frequency (Headtilt freq), which
measures frequency of head tilt to characterize head nod.
And finally, for facial expression, we monitor mouth
movement to detect yawning. We use YawnFreq to
measure the occurrence frequency of yawning. Putting
all of these factors together, the Static Bayesian Network
for modelling fatigue is constructed as shown in Fig. 1.
The target node in this model is fatigue and the nodes
above the target node represent various factors that could
lead to fatigue. They are collectively referred to as
the contextual information. The nodes below the target
node represent visual observations from the output of
computer vision system. These nodes are collectively
referred to as observation nodes.
B. Construction of conditional probability tables (CPTs)
Before using the BNs model for fatigue inference,
the network need be parameterized. This requires to
specify the prior probability for the root nodes and the
conditional probabilities for the links. The conditional
probabilities for each node are the conditional probabil-
ities of a node given its parents. Given a node with K
parents, the number of probabilities needed are2K , if
we assume all nodes are binary. Subjective estimation of
these probabilities are difficult and inaccurate. Usually,
probability is obtained from statistical analysis of a
large amount of training data. Large amount of data is,
however, difficult to acquire for this study. Fortunately,
several series of large-scale subjective surveys [38] [9]
[43] [39] provide the clues of such data. Despite
the subjectivity of these data, we use them to help
the parametrization of our fatigue model. Since these
surveys were not designed for the parametrization of our
BNs model, not all needed probabilities are available
and some conditional probabilities are therefore inferred
using the so-callednoisy-or principle [26].
The noisy-or principle states that assumingA1, . . . ,
An are binary variables (’yes’ (y) or ’no’ (n)) rep-
resenting all the causes of the binary variableB and
each eventAi = y causesB=y unless an inhibitor (also
called preventing factor, which prevents a state of the
variable to happen and has the complement probability
of other state for a binary state variable) state prevents

11
Random_noise Light Heat Humidity Anxiety
Sleep_Enviornment Sleep_time Napping Sleep_state Time_zone Time
Temperature Weather Noise Sleep_disorders Workload Work_type
Work_enviornment Sleep_quality Physical_condition Circadian Work_condition
Fatigue
Facial_Exp Eye_movement Head_movement
YawnFreq Facial_Muscle Eyelid_movement Gaze Head_tilt_freq
PERCLOS AECS Fixation_dis Fixation_saccade_ratio
Fig. 1. A Static Bayesian Network for Modelling Human Fatigue.
it, and the probability for that isqi (see Fig. 2), e.g.
P (B=n|Ai=y)=qi, and all inhibitor states are indepen-
dent, i.e.,
P (B = n|A1, A2, . . . , An) =∏
1≤j≤n
qj
A 2
A 1
A n
B
1-q 1
1-q 2
1-q n
Fig. 2. The graphical explanation of thenoisy-or principle
With the noise-or principle, it is possible for the
number of the estimating conditional probabilities to
grow linearly with the number of parents, therefore to
significantly reduce the number of conditional proba-
bilities in the child nodes. The validity of thenoise-
or principle, however, remains to be validated for our
application.
Still some prior or conditional probabilities are lack-
ing in our model and they are obtained by subjective
estimation method [26]. With these, all the prior and
conditional probabilities in our SBNs model are obtained
and are listed in Tables I, II, III, IV, V, VI, VII,
VIII, and IX.
1Inferred from [9]. Given ’high’ humidity, the probability of
poor sleepenvironment is 39.5%; given background light ’on’, the
probability of poor Sleepenvironment is 38.5%; given ’high’ Ran-
dom noise, the probability of poor Sleepenvironment is 44.5%. As-
suming that the relationship between children nodes and parent node
is a noisy or, all the conditional probabilities of Sleepenvironment
given its parents variables are estimated withnoisy orprinciple [26].

12
TABLE I
PRIOR PROBABILITY TABLE
Nodes State Probability Notes
Randomnoise yes 0.15 average of [38] [9]
no 0.85
Light on 0.13 average of [38] [9]
off 0.87
Heat high 0.24 average of [38] [9]
normal 0.76
Humidity high 0.19 average of [38] [9]
normal 0.81
Sleeptime sufficient(> 6h) 0.90 [9]
loss(< 6h) 0.1
Napping > 30min. 0.22 [9]
No 0.78
Anxiety yes 0.28 average of [38] [9]
no 0.72
Sleepdisorder yes 0.08 average of [38] [9]
no 0.92
Workload heavy 0.15 [9]
normal 0.85
Time drowsy time 0.26 [38]
Active time 0.74
Time zone changed 0.17 [38]
no 0.83
Temperature high 0.15 average of [38] [9]
normal 0.85
Weather abnormal 0.10 average of [38] [9]
normal 0.90
Noise high 0.15 average of [38] [9]
normal 0.85
Work type tedious 0.2 average of [38] [9]
normal 0.8
TABLE II
CONDITIONAL PROBABILITIES FOR SLEEP ENVIRONMENT NODE
Parent Nodes Sleepenvironment1
Light Randomnoise Heat Humidity poor normal
on yes high high 0.87 0.13
normal 0.78 0.22
normal high 0.79 0.21
normal 0.65 0.35
no high high 0.76 0.24
normal 0.61 0.39
normal high 0.61 0.39
normal 0.36 0.64
off yes high high 0.80 0.20
normal 0.68 0.32
normal high 0.68 0.32
normal 0.47 0.53
no high high 0.65 0.35
normal 0.42 0.58
normal high 0.43 0.57
normal 0.05 0.95
TABLE III
CONDITIONAL PROBABILITIES FOR SLEEP QUALITY NODE
Parent Nodes Sleepquality2
Sleeptime Sleepenv Sleepcondition Napping poor fair
sufficient poor good > 30min. 0.34 0.66
No 0.37 0.66
bad > 30min. 0.73 0.27
No 0.75 0.25
normal good > 30min. 0.05 0.95
No 0.10 0.90
bad > 30min. 0.62 0.38
No 0.64 0.36
loss poor good > 30min. 0.73 0.27
No 0.75 0.25
bad > 30min. 0.89 0.11
No 0.95 0.05
normal good > 30min. 0.62 0.38
No 0.64 0.36
bad > 30min. 0.85 0.15
No 0.86 0.14
TABLE IV
CONDITIONAL PROBABILITIES FOR PHYSICAL CONDITION NODE
& SLEEP CONDITION NODE
Parent Nodes Physicalcondition3
Sleepdisorder poor healthy
yes 0.95 0.05
no 0.1 0.90
Parent Nodes Sleepcondition3
Anxiety good bad
Yes 0.30 0.70
No 0.90 0.10
2Inferred from [9]. Given ’bad’ Sleepcondition, the probability
of ’poor’ sleepquality is 59%. Estimated by experience, given
’poor’ Sleepenvironment, the probability of ’poor’ Sleepquality
is 59%; given ’loss’ (< 6h) Sleeptime, the probability of ’poor’
Sleepquality is 40%; given ’No’ Napping, the probability of ’poor’
Sleepquality is 5%. Assuming that the relationship between children
nodes and parent node is anoisy or, all the conditional probabilities
of Sleepquality given its parent variables are estimated withnoisy
or principle [26].3All of the conditional probabilities are estimated by experience.

13
TABLE V
CONDITIONAL PROBABILITIES FOR WORK ENVIRONMENT NODE
Parent Nodes Work environment4
Temperature Noise Weather poor fair
high high normal 0.94 0.06
abnormal 0.99 0.01
normal normal 0.80 0.20
abnormal 0.96 0.04
normal high normal 0.73 0.27
abnormal 0.95 0.05
normal normal 0.10 0.90
abnormal 0.82 0.18
TABLE VI
CONDITIONAL PROBABILITIES FOR CIRCADIAN NODE
Parent Nodes Circadian3
Time zone Time drowsy awake
changed drowsy time 0.90 0.10
active time 0.30 0.70
no drowsy time 0.60 0.40
active time 0.05 0.95
TABLE VII
CONDITIONAL PROBABILITIES FOR WORK CONDITION NODE
Parent Nodes Work condition5
Workload Work type poor normal
heavy tediousmonotonous 0.89 0.11
normal 0.62 0.38
normal tediousmonotonous 0.72 0.28
normal 0.05 0.95
4Inferred from [9]. Given ’high’ temperature, the probability of
’poor’ Work environment is 77.5%; given ’abnormal’ weather, the
probability of ’poor’ Work environment is 80%. Assuming that the
relationship between children nodes and parent node is anoisy or, all
of the conditional probabilities of Workenvironment given its parent
variables are estimated withnoisy or principle [26].
TABLE VIII
CONDITIONAL PROBABILITIES FOR FATIGUE NODE
Parent Nodes Fatigue6
Work Sleep Physical Circadian Work yes no
env quality condition condition
poor poor poor drowsy poor 0.98 0.02
normal 0.95 0.05
awake poor 0.96 0.04
normal 0.89 0.11
healthy drowsy poor 0.97 0.03
normal 0.91 0.09
awake poor 0.94 0.06
normal 0.83 0.17
fair poor drowsy poor 0.96 0.04
normal 0.87 0.13
awake poor 0.91 0.09
normal 0.74 0.26
healthy drowsy poor 0.93 0.07
normal 0.79 0.21
awake poor 0.85 0.15
normal 0.57 0.43
fair poor poor drowsy poor 0.96 0.04
normal 0.88 0.12
awake poor 0.92 0.08
normal 0.77 0.33
healthy drowsy poor 0.93 0.07
normal 0.81 0.19
awake poor 0.87 0.13
normal 0.62 0.38
fair poor drowsy poor 0.90 0.10
normal 0.71 0.29
awake poor 0.80 0.20
normal 0.43 0.57
healthy drowsy poor 0.83 0.27
normal 0.53 0.47
awake poor 0.67 0.33
normal 0.05 0.95
5Inferred from [38],
given ’heavy’ workload, ’poor’ Workcondition is 60%; given ’te-
diousmonotonous’ Worktype, ’poor’ Work conditionis 70%. As-
suming that the relationship between child nodes and parent nodes
is a noisy or, all of the conditional probabilities of Workcondition
given its parent variables are estimated by thenoisy-orprinciple [26].6Inferred from [9]. Given ’poor’ Sleepquality, Fatigue is 60%;
given ’drowsy’ Circadian, Fatigue 70%; given ’poor’ Workcondition,
Fatigue is 65%; Estimated by experience that given ’poor’
Work environment, Fatigue is 55%; given ’poor’ Physicalcondition,
Fatigue is 40%; Assuming that the relationship between children
nodes and parent node is anoisy or, all of the conditional probabilities
of Fatigue given its parent variables are estimated withnoisy or
principle [26].7Some of these conditional probabilities are obtained from the
experiment results in [14].

14
TABLE IX
CONDITIONAL PROBABILITIES FOR THECHILDREN NODES OF
FATIGUE NODE
Nodes Name Parent Node Parent State Child State Condition3
Variable Variable Probability
FacialExp Fatigue yes drowsyexp 0.30
yes normal 0.70
no drowsyexp 0.05
no normal 0.95
YawnFreq FacialExp drowsyexp high 0.95
drowsyexp normal 0.05
normal yawn 0.05
normal normal 0.95
FacialMuscle FacialExp drowsyexp lagging 0.80
drowsyexp normal 0.20
normal lagging 0.02
normal normal 0.98
Eye mov Fatigue yes abnormal 0.50
yes normal 0.50
no abnormal 0.02
no normal 0.98
Eyelid Eye abnormal abnormal 0.99
movement movement abnormal normal 0.01
normal abnormal 0.05
normal normal 0.95
Gaze Eye abnormal normal 0.05
movement abnormal abnormal 0.95
normal normal 0.90
normal abnormal 0.10
Head Fatigue yes abnormal 0.40
movement yes normal 0.60
no abnormal 0.05
no normal 0.95
PERCLOS7 Eyelid abnormal abnormal 0.98
movement abnormal normal 0.02
normal abnormal 0.05
normal normal 0.95
AECS Eyelid abnormal slow 0.97
movement abnormal normal 0.03
normal slow 0.05
normal normal 0.95
Fixation dis Gaze normal narrow 0.90
normal diffusive 0.10
abnormal narrow 0.90
abnormal diffusive 0.10
Fixation Gaze normal high 0.10
saccade normal low 0.90
ratio abnormal high 0.85
abnormal low 0.15
Head Head abnormal high 0.60
tilt movement abnormal normal 0.40
freq normal high 0.05
normal normal 0.95
IV. FATIGUE MONITORING MODELLING WITH
DYNAMIC BAYESIAN NETWORKS
As pointed by recent studies [51], fatigue has an ac-
cumulative property and fatigue is developed over time.
For example, a driver’s fatigue level in the beginning of
driving may be low, but it will became higher and higher
as the time passes. This fact indicates that, in addition
to sleep, circadian and some other environment factors,
fatigue status at the previous time instant is also a factor
for the fatigue status at the present time. Furthermore, for
fatigue detection, it is the persistent presence of certain
visual behaviors over time instead of the presence of
the behavior at a particular instance that leads to the
detection of fatigue. It is, therefore, important to account
for the temporal aspect of fatigue and integrate fatigue
evidences over time. Obviously, the static model fails to
capture these dynamic aspects. since it does not provide
a direct mechanism for implementing such properties.
Therefore, in order to more effectively monitor human
fatigue, the creation of a dynamic fatigue model based on
the DBNs is necessary. A dynamic fatigue model allows
to monitor and detect fatigue by integrating fatigue
evidences both spatially and temporally.
A. Dynamic Bayesian Networks
In Artificial Intelligence (AI) field, a DBNs model
describes a system that dynamically changes or evolves
over time and that enables the user to monitor and
update the system as time proceeds, and even predicts
the behavior of the system over time. Its utility lies
in explicit modelling events that are not detected on
a particular point of time, but they can be described
through multiple states of observation that produce a
judgment of one complete final event. Usually, there are
three broad categories of approaches to achieve this [33]:

15
(1) models that use static BNs and formal grammars
to represent temporal dimension (known as Probabilistic
Temporal Networks (PTNs)); (2) models that use a mix-
ture of probabilistic and non-probabilistic frameworks;
and (3) models that introduce temporal nodes into static
BNs structure to represent time dependence. The third
category is most widely used and we will base it to
construct our dynamic fatigue model. In this category, a
time slice is used to represent the snapshot of an evolving
temporal process at a time instant and the DBNs can be
considered to consist of a sequence of time slices, each
representing the system at a particular point or interval
of time. These time slices are interconnected by temporal
relations, which are represented by the arcs joining
particular variables from two consecutive slices. Such
a DBNs is usually regarded as a generalization of the
singly connected BNs, specifically aiming at modelling
time series [33]. States of any system described as a
DBN satisfy the Markovian condition: the state of a
system at timet depends only on its immediate past, i.e.,
its state at timet−1. Hence, DBNs are often regarded as
a generalization of the Hidden Markov Models [18]. As
an extension of the traditional static Bayesian Networks,
DBNs describes a system that is dynamically evolving
over time and enables the user to monitor and update the
system as time proceeds. It even predicts the behavior of
the system over time. Therefore, a fatigue model based
on the DBNs is naturally the best option to model and
predict fatigue over time.
A simple illustrative DBNs is showed in Figure 3
and it’s joint probability distribution function on the
sequence ofT time slices consists of a hypothesis node
Ht, hidden statesSt, and observationsOt. Given the
DBN topology as shown in Fig. 3, we assume that, the
hidden state variablesS = {s0, ..., sT−1}, observable
variablesO = {o0, ..., oT−1}, and hypothesis variables
H = {h0, ..., hT−1}, where T is the time boundary.
The probability distribution of DBNs can be theoretically
expressed as
P (H, S, O) = P (H0)T−1∏
t=1
P (Ht|Ht−1)
T−1∏
t=0
P (St|Ht)T−1∏
t=1
P (St|St−1)T−1∏
t=0
P (Ot|St). (1)
So, in order to completely specify a DBNs, we need
to define four sets of parameters:
• State transition probability distribution functions
(pdfs) Pr(St|St−1) and Pr(Ht|Ht−1), that speci-
fies time dependencies between the states
• Hypothesis generation pdfsPr(St|Ht), that speci-
fies how the hidden states relate to the hypothesis.
• Observation pdfsPr(Ot|St), that specifies depen-
dencies of observation nodes regarding to other
nodes at time slicet.
• Initial state distributionPr(H0), that brings initial
probability distribution in the beginning of the pro-
cess.
Except for the transitional probabilities, the specifica-
tion of other parameters remains the same for all time
slices as the static BNs since they characterize the static
aspect of the DBNs. The transitional probabilities specify
the state transition between two neighboring time slices.
Theoretically, they may be stationary or dynamically
vary over time.
Based on general DBNs principles [26] [33] [42] and
the above considerations, a DBNs model for modeling
human fatigue is constructed as shown in Figure 4.
The basic idea of this model is that some hidden nodes
(also referred to as temporal nodes) at the previous time
slice are connected to the corresponding nodes at current
time. The previous nodes, therefore, provide a diagnostic

16
H(t-1) H(t) H(t+1) H(T)
S(t-1) S(t) S(t+1) S(T)
O(t+1) O(t) O(t-1) O(T)
Temporal
Dependencies
Cau
sal
Dep
end
enci
es
Fig. 3. A generic DBN structure, whereH(t) represents the hypothesis to infer at timet; S(t) represent hidden states at time
t; O(t) represents sensory observations at timet; andT is the time boundary.
Fatique
Facial_Exp Eye_movement
Facial_Exp Eye_movement Head_movement
YawnFreq Facial_muscle Eyelid_movement Gaze
PERCLOS AECS Fixation_dis
Fixation_saccade_ratio
Head_tilt_freq
Head_movement
YawnFreq Facial_muscle Eyelid_movement Gaze
PERCLOS AECS Fixation_dis Fixation_saccade_ratio
Head_tilt_freq
Time Slice t-1
Time Slice t
Random_noise Light Heat Humidity Anxiety
Sleep_Enviornment Sleep_time Napping Sleep_state Time_zone Time
Temperature Weather Noise Sleep_disorders Workload Work_type
Work_enviornment Sleep_quality Physical_condition Circadian Work_condition Random_noise Light Heat Humidity Anxiety
Sleep_Enviornment Sleep_time Napping Sleep_state Time_zone Time
Temperature Weather Noise Sleep_disorders Workload Work_type
Work_enviornment Sleep_quality Physical_condition Circadian Work_condition
Fatigue
Fig. 4. A Dynamic Bayesian Networks Model for Monitoring Human Fatigue. While static nodes repeat in slices, corresponding temporal
nodes in neighboring slices are connected via temporal causality.
support for the corresponding variables at present time.
Thus, fatigue at current time is inferred from fatigue at
the previous time, along with current observations. These
changes allow to perform fatigue estimation over time
by integrating information over time. It also affords to
predict fatigue over time by the temporal causality of
DBNs.
The DBNs are implemented by keeping in memory
two slices at any one time, representing previous time
interval and current time interval respectively. The slice
at the previous time interval provides diagnostic support
for current slice. The two slices are such programmed
that they rotate as old slices are dropped and new slices
are used as time progresses. Specifically, at the start
17
time slice, fatigue is inferred from the static fatigue BNs
model in Figure 1. Starting from the second time slice,
the static fatigue model is expanded dynamically with
additional temporal links that connect the intermediate
nodes at previous time slice to the corresponding nodes
at current time slice. Fatigue inference is then performed
on the expanded static fatigue model. This repeats with
different probabilities for the previous nodes that are
connected to current model. All the CPTs in the model
is time-invariant. Part of the CPTs and prior probabilities
in the model are adopted from the previous SBNs model
and the transitional probabilities are specified subjec-
tively.
V. EXPERIMENTS
In this section, we present our experimental results to
evaluate the proposed fatigue model.
A. The Experiment Results of SBNs Model
Given the parameterized model, the fatigue inference
can commence upon the arrival of visual evidences via
belief propagation. MSBNx software [30] is used to
perform the inference in this static model and both top-
down and bottom-up belief propagations are performed.
Given the network shown in Figure 1, with 22
evidence nodes and two states for each node, theoret-
ically, there are222 possible inference results. So, it
is very difficult to enumerate all possible combinations
of evidences. Here only those typical combinations of
evidences, which are related to fatigue node and that are
most likely to occur in the real world, are instantiated in
the model and their results are summarized in Table X.
From Table X, it can been seen that the prior probability
of fatigue (e.g. when there is not any evidence) is
0.57 (ref. No.1), representing the the average fatigue
level for the commercial pilots or truck drivers in their
normal working time. The observation of a single visual
evidence (ref. No. 2-8in table X) does not provide con-
clusive finding since the estimated fatigue probability is
less than the critical value 0.95. Even when the evidence
of eyelid movement (e.g. PERCLOS) is instantiated, the
fatigue still fails to reach the critical level, despite the
fact that the eyelid movement has been regarded as the
most accurate measurement of fatigue [28] [27]. The
same is true if only a single contextual factor (ref. No.
9-18) is given. The combination of PERCLOS and any
other visual evidences (ref. No. 20, 21) leads to critical
fatigue level. Any combination of three visual cues
guarantees the estimated fatigue probability to exceed
the critical value (ref. No. 24). With some contextual
evidences, any two visual cue evidence combinations
achieve the same purpose (ref. No. 25). This demon-
strates the importance of contextual information. In fact,
the simultaneous presence of all contextual evidences
only almost guarantees the occurrence of fatigue (ref.
No. 26). These inference results, though preliminary
and subjective, demonstrate the utility of the proposed
framework for predicting and modelling fatigue, through
systematic fusion of information from different sources.
B. Evaluation of Dynamic Bayesian Network Model for
Monitoring Fatigue
The typical evaluating results from the dynamic BNs
models and their comparisons with the static BNs model
are shown in Figures 5 6 and 7.
From Figure 5, it can been seen that if there is
not any evidence observed, the fatigue level basically
monotonically increases as time passes by. But for SBN
model, the fatigue index remains unchanged over time.
From the view of driving in the real world, the situation

18
TABLE X
THE INFERENCERESULTS OFSTATIC FATIGUE BAYESIAN
NETWORK MODEL
No. Evidences Fatigue (yes)
1 No any evidence 0.57
2 YawnFreq (high) 0.82
3 FacialMuscle (lagging) 0.81
4 PERCLOS (high) 0.86
5 AECS (abnormal) 0.86
6 Fixation dis(narrow) 0.81
7 Fixation saccaderatio (low) 0.80
8 Headtilt freq (high) 0.85
9 Temperature (high) 0.72
10 Weather(abnormal) 0.72
11 Noise (high) 0.70
12 Time zone (changed) 0.63
13 Sleepdisorders (yes) 0.72
14 Napping (No) 0.58
15 Workload (heavy) 0.72
16 Work type (tediousmonotonous) 0.74
17 Anxiety (yes) 0.64
18 RandomNoise (yes) 0.60
19 YawnFreq (high),Facialmuscle (drowsy ) 0.90
20 PERCLOS (high), Fixationdis(abnormal) 0.95
21 PERCLOS (abnormal), YawnFreq(high) 0.96
22 Fixation dist (abnormal), 0.95
Facialmuscle (lagging)
23 AECS (slow), Headtilt freq(high) 0.96
24 PERCLOS(high),Headtilt freq(high), 0.99
AECS (slow)
25 Headtilt freq(high), YawnFreq(high), 0.98
Temperature (high), Anxiety (yes)
26 Time (drowsytime), Heattilt freq(high),humidity(high) 0.90
Sleepdisorders(yes), Sleeptime (loss(¿6h)),
Work type (tediousmonotonous),
Weather(abnormal),Anxiety(yes),Workload(heavy)
in DBNs model is more reasonable. The driver may feel
alert at the start of driving but as the time passes by,
fatigue begins to get built up gradually.
Figure 6 plots the fatigue index for both models
over time, with the observation of high PERCLOS value
at different time slices. It is clear that the two models
respond to evidences differently. In general, the fatigue
curve for dynamic fatigue model changes gradually
upon the arrival of an evidence or disappearance of an
evidence. On the other hand, the fatigue curve for the
static model changes drastically with evidence arrival
or disappearance, as represented by sharp turns. The
curves also show that the presence of high PERCLOS
at one time slice (slice 2) does not cause a significant
fatigue change for the dynamic model while it can lead
to a sudden change for the static model. However, if
high PERCLOS value is observed continuously (e.g.
from time 11 to 20), this will cause a gradual increase
of fatigue for the dynamic model. The fatigue index
of static model stays unchanged over this period. As
soon as disappearance of the PERCLOS evidence, the
fatigue index of static model drops immediately while
the fatigue index of dynamic model gradually decreases.
Therefore, the dynamic fatigue model is more compatible
with fatigue development. And, the dynamic model is
more tolerant to external signal disturbance. The fatigue
index from the dynamic fatigue model begins to change
only after persistent and continuous observations of
certain visual behavior.
We can reach the similar conclusion from Figure 7,
where multiple fatigue parameters may be instantiated
simultaneously. In addition, it is observed that after the
disappearance of evidences from frame 26 and on, the
fatigue index of DBN model fatigue number begins to
increase to reflect time factor while the fatigue index of
SBN fatigue number remains unchanged. In summary,
the DBN model demonstrates more powerful capabil-
ity to model and monitor human fatigue. It can more
accurately characterize and monitor human fatigue. In
addition, the dynamic fatigue model is less sensitive
to external signal disturbance and to erroneous sensory
observations.
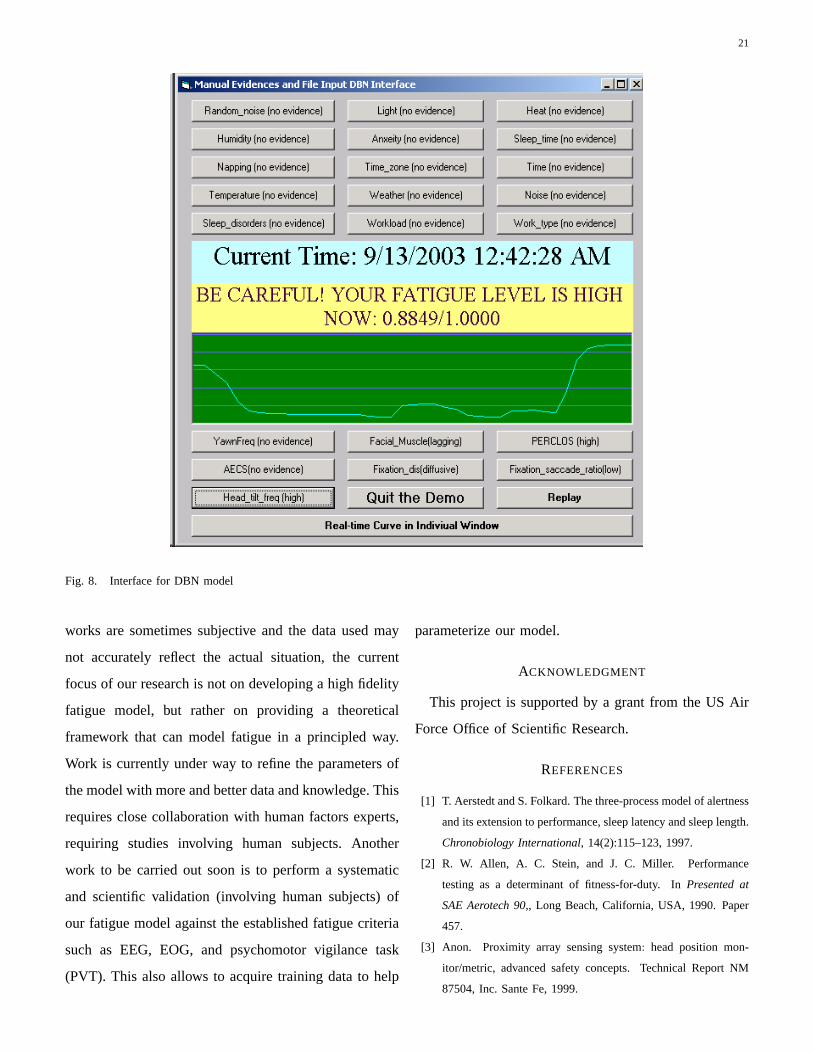
C. Interfacing with the Vision System
To perform real-time driver’s fatigue monitoring, the
visual module from computer vision technology and
the fatigue model must be combined via an interface
program such that the output of the vision system can be

19
0 2 4 6 8 10 12 14 16 180.5
0.52
0.54
0.56
0.58
0.6
0.62
0.64
0.66
0.68
Time Slices
Fatig
ue Le
vel /1
.0000
DBN model
SBN Model
Fig. 5. Fatigue level plot over time for SBN and DBN models without any evidence observed.
0 5 10 15 20 25 30 350.55
0.6
0.65
0.7
0.75
0.8
0.85
0.9
Time Slices
Fatig
ue Le
vel /1
.0000
DBN model
SBN Model
PERCLOS evidence (high)PERCLOS evidence (high)
Fig. 6. Fatigue level changes over time for both the static and dynamic fatigue models with observation of high PERCLOS value at time
slice 1 and between time slice 12 and 20.
used by the fatigue model to update its belief of fatigue
in real time. Such interfaces have been built. Figure 8
shows the appearance of the interface program. Basically,
the interface program periodically (every 1 second or
shorter time interim) examines the output (evidences) of
the vision module and detects any evidence change. If a
change is detected, the interface program instantiates the
corresponding observations nodes in the fatigue model,
which then activates its inference engine, and obtain
the new fatigue level. In the interface, the inference
result (fatigue level) is displayed as a real-time curve
in a window as shown in figure 8. In addition, the
interface appearance also varies with user fatigue level.
When the fatigue level is within the normal range (e.g.
below 0.85), it displays a comfortable green background
color screen. If the fatigue level is between 0.85 and
0.95, which is close to the dangerous level, it displays a
yellow background color screen with an alerting prompt
accompanied by a notifying sound. If the fatigue level
is at the critical level or higher, the color of the screen

20
0 10 20 30 40 50 600
0.1
0.2
0.3
0.4
0.5
0.6
0.7
0.8
0.9
1
Time Slices
Fatig
ue Le
vel /1
.0000
DBN model
SBN Model
PERCLOS(high)+YawnFreq(high)
PERCLOS(normal)+YawnFreq(normal)
PERCLOS(high)+YawnFreq(high)
PERCLOS(normal)+YawnFreq(normal)
no evidence
Fig. 7. Fatigue level changes over time for both the static and dynamic fatigue models with observation of multiple evidences at different
time slices. The evidence from PERCLOS (high) and YawnFreq (high) are observed at time slice 2 and between 22 and 29, and the evidences
from PERCLOS(normal) and YawnFreq (normal) are observed at timeslice 3 and between time slice 30 and 36
become red and the warning color flashes continuously,
accompanied by a warning sound to alert the driver.
Also displayed in the interface are the buttons for both
visual evidences and contextual factors. These buttons
allow the visual evidences and the contextual factors be
input manually. Finally, the interface program allows to
record the fatigue index and the visual parameters for
subsequent analysis and display.
VI. CONCLUSION AND FUTURE WORK
Fatigue is one of the most important safety concern
in modern commercial transportation industry. Moni-
toring and preventing fatigue are crucial to improving
the safety. Fatigue is affected by many complicated
factors. Sleep and circadian are two of the fundamental
physiological factors. For the commercial transportation
drivers and pilots, many other factors, such as environ-
ment factors, physical conditions, type of works, will
also significantly affect their fatigue. In addition, fatigue
exhibits different observations, varying over time and
with uncertainties. Through the research presented in this
paper, we propose a probabilistic framework based on
the Bayesian network to model fatigue and the associated
factors and observations in a principled way. Specifically,
a static fatigue model based on the static Bayesian Net-
works model was developed to model the static aspects
of fatigue and to allow to integrate the relevant contextual
information and the available visual cues spatially. The
static fatigue model is then extended based on DBNs to
better model the dynamic and evolutionary aspects of
fatigue development.
Experimental results demonstrate the importance of
simultaneous combination of various parameters as well
as the advantage of dynamic fatigue model over the static
fatigue model to more accurately and robustly model and
detect human fatigue and produce more accurate fatigue
prediction. The inference results, though preliminary and
still subjective, demonstrate the utility of the proposed
framework for consistently, robustly, and accurately pre-
dicting and modelling fatigue under uncertainty.
Though the parameters used to parameterize the net-
21
Fig. 8. Interface for DBN model
works are sometimes subjective and the data used may
not accurately reflect the actual situation, the current
focus of our research is not on developing a high fidelity
fatigue model, but rather on providing a theoretical
framework that can model fatigue in a principled way.
Work is currently under way to refine the parameters of
the model with more and better data and knowledge. This
requires close collaboration with human factors experts,
requiring studies involving human subjects. Another
work to be carried out soon is to perform a systematic
and scientific validation (involving human subjects) of
our fatigue model against the established fatigue criteria
such as EEG, EOG, and psychomotor vigilance task
(PVT). This also allows to acquire training data to help
parameterize our model.
ACKNOWLEDGMENT
This project is supported by a grant from the US Air
Force Office of Scientific Research.
REFERENCES
[1] T. Aerstedt and S. Folkard. The three-process model of alertness
and its extension to performance, sleep latency and sleep length.
Chronobiology International, 14(2):115–123, 1997.
[2] R. W. Allen, A. C. Stein, and J. C. Miller. Performance
testing as a determinant of fitness-for-duty. InPresented at
SAE Aerotech 90,, Long Beach, California, USA, 1990. Paper
457.
[3] Anon. Proximity array sensing system: head position mon-
itor/metric, advanced safety concepts. Technical Report NM
87504, Inc. Sante Fe, 1999.

22
[4] G. Belenky, T. J. Balkin, D. P. Redmond, H. C. Sing, M. L.
Thomas, D. R. Thorne, and N. J. Wesensten. Sustained
performance during continuous operations: The us armys sleep
management system. In L. R. Hartley, editor,Managing Fa-
tigue in Transportation. Proceedings of the Third International
Conference on Fatigue and Transportation, Fremantle, Western
Australia, Oxford UK, 1998. Elsevier Science Ltd.
[5] National Transportation Safety Board. Evaluation of u.s. depart-
ment of transportation efforts in the 1990s to address operator
fatigue. Safety Report NTSB/SR-99/01, National Transportation
Safety Board, May 1999. PB99-91 7002 Notation 7155.
[6] S. Boverie and et al. Intelligent systems for video monitoring of
vehicle cockpit. In1998 International congress and exposition
ITS: Advanced controls and vehicle navigation systems, pages
1–5, 1998.
[7] M. A. Carskadon and W. C. Dement. The multiple sleep latency
test: what does it measure?Sleep, 5:67–72, 1982.
[8] S. G. Charlton and M. E. Ashton. Review of fatigue manage-
ment strategies in the transport industry. Technical report, Land
Transport Safety Authority, Wellington, New Zealand, 1998.
[9] E. L. Co, K. B. Gregory, J. M. Johnson, and M. R. Rosekind.
Crew factors in flight operations xi: A survey of fatigue factors
in regional airline operations. Technical Report NASA/TM-
1999-208799, National Aeronautics and Space Administration,
Ames Research Center Moffett Field, California 94035, October
1999.
[10] Premier Systems Com. The das 2000 road alert system.
www.premiersystems.com/market/.
[11] C. A. Czeisler. Lecture on fatigue. InFatigue Symposium
Proceedings, page 59. National Transportation Safety Board and
NASA Ames Research Center, November 1995.
[12] D. Dawson, N. Lamond, K. Donkin, and K. Reid. Quantita-
tive similarity between the cognitive psychomotor performance
decrement associated with sustained wakefulness and alcohol
intoxication. In L. R. Hartley, editor,Managing Fatigue in
Transportation. Proceedings of the Third International Con-
ference on Fatigue and Transportation, Fremantle, Western
Australia, Oxford UK, 1998. Elsevier Science Ltd.
[13] The Hartford Loss Control Department. Fatigue: Its impact on
motor vehicle accidents. Technical Report TIPS S 331.002,
2000.
[14] D. F. Dinges and R. Grace. Perclos: A valid psychophys-
iological measure of alertness as assessed by psychomotor
vigilance. Technical Report Publication No. FHWA-MCRT-
98-006, US Department of Transportation, Federal Highway
Administration, October 1998.
[15] David F. Dinges, M. Mallis, G. Maislin, and J. W. Powell.
Evaluation of techniques for ocular measurement as an index
of fatigue and the basis for alertness management. Technical
Report 808 762, Department of Transportation Highway Safety
publication, April 1998.
[16] Inc. DrivAlert Systems. Zzzzalert driver fatigue warning sys-
tem. http://www.zzzzalert.com, 2003.
[17] J. Empson.Human Brainwaves: The Psychological Significance
of the Electroencephalogram. The Macmillan Press Ltd., 1986.
[18] Z. Ghahramani. Introduction to hidden markov models and
bayesian networks.International Journal of Pattern Recognition
and Artificial Intelligence, 15(1):9–12, 2001.
[19] Richard Grace. Drowsy driver monitor and warning system. In
International Driving Symposium on Human Factors in Driver
Assessment, Training and Vehicle Design, August 2001.
[20] W. Harris. Fatigue, circadian rhythm, and truck accidents.
In R.R. Mackie, editor,Vigilance: Theory, operational perfor-
mance and physiological correlates, pages 133–146, New York,
1997. Plenum.
[21] L. Hartley, T. Horberry, N. Mabbott, and G. P. Krueger. Review
of fatigue detection and prediction technologies. Technical
Report ISBN 0 642 54469 7, National Road Transport Com-
mission, Level 5/326 William Street MELBOURNE VIC 3000,
September 2000. www.nrtc.gov.au.
[22] A. Heitmann, R. Guttkuhn, U. Trutschel, and M. Moore-
Ede. Technologies for the monitoring and prevention of
driver fatigue. InProceedings of the first international driving
symposium on human factors in driving assessment, training,
and vehicle design., pages 81–86, Snowmass Village at Aspen,
Colorado, 2001.
[23] E. Hoddes, V. Zarcone, H. Smythe, R. Phillips, and W. C.
Dement. Quantification of sleepiness: A new approach.Psy-
chophysiology, (10):431–436, 1973.
[24] TravAlert Safety International. Travalert early warning system.
http://www.travalert.com/, 2003.
[25] T. Ishii and et al. Automatic recognition of driver’s facial
expression by image analysis.Journal of JSAE, 41.12:1398–
1403, 1987.
[26] F. V. Jensen.Bayesian Networks and Decision Graphs, Statistics
for Engineering and Information Science. Springer, 2001.
[27] Qiang Ji and Xiaojie Yang. Real time visual cues extraction

23
for monitoring driver vigilance. InInternational Workshop on
Computer Vision Systems, Vancouver, Canada, July 2001.
[28] Qiang Ji and Xiaojie Yang. A computer vision system for real
time driver alertness monitoring.Real Time Imaging, 2002. in
Press.
[29] M. I. Jordan, editor.Learning in Graphical Models. MIT press,
1999.
[30] C. M. Kaldie, D. Hovel, and E. Horvitz. online MSBNx
Editor Manual. Microsoft Research Center, One Microsoft Way,
Redmond, WA 98052, July 2001.
[31] C. G. Looney. Bayesian/belief networks.
http://ultima.cs.unr.edu/cs773c/, October 2001. Lecture for CS
773c - Intelligent Systems Applications: Information Fusion.
[32] N. A. Mabbott, M. Lydon, L. Hartley, and P. Arnold. Procedures
and devices to monitor operator alertness whilst operating
machinery in open-cut coal mines. stage 1: State-of cthe-art
review. InARRB Transport Research Report, number RC 7433,
1999.
[33] V. Mihaljlovic and M. Petkovi. Dynamic bayesian networks:
A state of the art, computer science department. Technical
report, Computer Science Department, University of Twente,
The Netherlands, 2001.
[34] T. H. Monk. Circadian aspects of subjective sleepiness: A
behavioural messenger? In T.H. Monk, editor,Sleep, Sleepiness
and Performance, Chichester, England, 1991. John Wiley &
Sons.
[35] T.H. Monk, D.J. Buysse, and L.R Rose. Wrist actigraphic
measures of sleep in space.Sleep, 22(7):948–54, Nov. 1999.
[36] J. K. Pollard. Locomotive engineerłs activity diary. Technical
Report DOT/FRA/RRP-96/02, US DOT, 1996.
[37] M. R. Rosekind. Physiological considerations of fatigue. In
Fatigue Symposium Proceedings, page 17. National Transporta-
tion Safety Board and NASA Ames Research Center, November
1995.
[38] M. R. Rosekind, E. L. Co, Gregory, K. B., and D. L. Miller.
Crew factors in flight operations xiii: A survey of fatigue factors
in corporate/executive aviation operations. Technical Report
NASA/TM-2000-209610, Ames Research Center Moffett Field
at National Aeronautics and Space Administration, California
94035, September 2000.
[39] M. R. Rosekind, K. B. Gregory, E. L. Co, D. L. Miller,
and D. F. Dinges. Crew factors in flight operations xii: A
survey of sleep quantity and quality in on-board crew rest
facilities. Technical Report NASA/TM-2000-209611, National
Aeronautics and Space Administration, Ames Research Center
Moffett Field, California 94035, September 2000.
[40] A. Sadeh, K. M. Sharkey, and M. A. Carskadon. Activity-based
sleep-wake identification: an empirical test of methodological
issues.Sleep, 7(3):201–7, April 1994.
[41] H. Saito and et al. Applications of driver’s line of sight to
automobiles-what can driver’s eye tell. InProceedings of 1994
Vehicle navigation and information systems conference, pages
21–26, Yokohama, Japan, August 1994.
[42] R. Schafer and T. Weyrath. Assessing temporally variable user
properties with dynamic baysian networks. InUser Modelling:
Proceeding of the Sixth International Conference, pages 377–
388, 1997.
[43] P. Sherry. Fatigue countermeasures in the railroad industry-
past and current developments. Technical report, Counselling
Psychology Program, Inter-modal Transportation Institute, Uni-
versity of Denver, June 2000.
[44] A. C. Stein, Z. Parseghian, R. W. Allen, and J. T. Haynes. The
development of a lowcost portable system for the detection of
truck driver fatigue. In34th Annual Proceedings, Association
for the Advancement of Automotive Medicine, Scottsdale, Ari-
zona, USA, 1990.
[45] R. E. Thayer. Measurement of activation through self-report.
Psychological Reports, (20):663–668, 1967.
[46] D. R. Thorne, S. G. Genser, H. C. Sing, and F. W. Hegge. The
walter reed performance assessment battery.Neurobehavioral
Toxicology and Teratology, (7):415–418, 1985.
[47] H. Ueno and et al. Development of drowsiness detection system.
In Proceeding of 1994 Vehicle navigation and information
systems conference, pages 15–20, Yokohama, Japan, August
1994.
[48] W. W. Wierville. Overview of research on driver drowsiness
definition and driver drowsiness detection. InESV, Munich,
1994.
[49] W. W. Wierville, L. A. Ellsworth, and et al. Research on
vehicle based driver status/performance monitoring: develop-
ment, validation, and refinement of algorithms for detection of
driver drowsiness. Technical Report DOT HS 808 247, National
Highway Traffic Safety Administration, 1994.
[50] F. Wimmer, R. F. Hoffmann, R. A. Bonato, and A. R. Moffitt.
The effects of sleep deprivation on divergent thinking and
attention processes.J. Sleep Res., 1(4):223–230, 1992.
[51] C. D. Wylie, T. Shultz, J. C. Miller, M. M. Mitler, and
R. R. Mackie. Commercial motor vehicle driver fatigue and

24
alertness study: Technical summary. Technical Report FHWA-
MC-97-001, Trucking Research Institute, American Trucking
Associations Foundation, Transportation Development Center,
Safety and Security Transport Canada, November 1996. TC
report number: TP 12876E.
[52] K. Yabuta, H. Iizuka, T. Yanagishima, Y. Kataoka, and T. Seno.
The development of drowsiness warning devices. InProceed-
ings 10th International Technical Conference on Experimental
Safety Vehicles, Washington, USA, 1985.