A Primer on the Canadian Bankers’ Acceptance Market€¦ · HSBC, Christian Gaucher and Devra...
42
Bank of Canada staff discussion papers are completed staff research studies on a wide variety of subjects relevant to central bank policy, produced independently from the Bank’s Governing Council. This research may support or challenge prevailing policy orthodoxy. Therefore, the views expressed in this paper are solely those of the authors and may differ from official Bank of Canada views. No responsibility for them should be attributed to the Bank. www.bank-banque-canada.ca Staff Discussion Paper/Document d’analyse du personnel 2018-6 A Primer on the Canadian Bankers’ Acceptance Market Kaetlynd McRae and Danny Auger
Transcript of A Primer on the Canadian Bankers’ Acceptance Market€¦ · HSBC, Christian Gaucher and Devra...

Bank of Canada staff discussion papers are completed staff research studies on a wide variety of subjects relevant to central bank policy,
produced independently from the Bank’s Governing Council. This research may support or challenge prevailing policy orthodoxy. Therefore, the views expressed in this paper are solely those of the authors and may differ from official Bank of Canada views. No responsibility for them should be attributed to the Bank.
www.bank-banque-canada.ca
Staff Discussion Paper/Document d’analyse du personnel 2018-6
A Primer on the Canadian Bankers’ Acceptance Market
Kaetlynd McRae and Danny Auger

2
Bank of Canada Staff Discussion Paper 2018-6
June 2018
A Primer on the Canadian Bankers’ Aceptance Market
by
Kaetlynd McRae and Danny Auger
Financial Markets Department
Bank of Canada Ottawa, Ontario, Canada K1A 0G9
[email protected] [email protected]
ISSN 1914-0568 © 2018 Bank of Canada

i
Acknowledgements
This paper could not have been written without the valuable contributions of the
Canadian Dollar Offered Rate (CDOR) submitting banks. We are grateful to Ian Currie
and Ezio Da Dalt at BMO, Julia Moynihan at CIBC, Maral Zakarian and Marc Viola at
HSBC, Christian Gaucher and Devra Ouimet at NBC, John Popelas at RBC, Mike van
Hees at BNS and Frank McGillicuddy and Mario Reffo at TD for their invaluable
knowledge and insight. We thank Harri Vikstedt for his guidance and all the colleagues at
the Bank of Canada who also contributed to this paper.
We appreciate the time and effort the Office of the Superintendent of Financial
Institutions (OSFI), the Investment Industry Regulatory Organization of Canada
(IIROC), the Montréal Exchange, and the Ontario and British Columbia Securities
Commissions gave in reviewing the paper and providing helpful comments. All errors
and omissions are our own. The views expresssed in this paper are those of the authors
and do not necessarily reflect those of the Bank of Canada.
ii
Abstract
This paper discusses how the bankers’ acceptance (BA) market in Canada is organized
and its essential link to the Canadian Dollar Offered Rate (CDOR). Globally, BAs are a
niche product used only in a limited number of jurisdictions. In Canada, BAs provide a
key source of funding for small and medium-sized corporate borrowers that may not
otherwise have direct access to the primary funding market because of their size and
credit ratings. More recently, BAs have also become an increasingly important funding
source for large corporate borrowers because of credit-rating downgrades in certain
sectors and industry consolidation. With the market’s continued growth, BAs account for
the greatest portion of money market instruments issued by non-government entities and
are the second-largest money market instrument overall in Canada, averaging just over
25 per cent of the total domestic money market in 2017. For the investment community in
Canada, BAs provide a source of short-term income and liquidity because of their
relatively attractive yield, liquidity and credit ratings.
The BA market is intrinsically linked to CDOR, which was originally developed to
establish a daily benchmark reference rate for BA borrowings. This rate is quite nuanced
compared with rates in other jurisdictions in that it is not directly a bank borrowing rate.
Instead, it is a committed lending rate at which banks are contractually willing to lend
cash to corporate borrowers with existing BA facilities. CDOR is also used as the main
interest rate benchmark for calculating the floating-rate component of both over-the-
counter and exchange-traded Canadian-dollar derivative products. Another use of CDOR
is to determine interest payments on floating-rate notes.
Bank topics: Financial institutions; Financial markets; Financial system regulation and
policies; Market structure and pricing
JEL codes: G, G1, G18, G2, G21, G23
Résumé
Le présent article analyse l’organisation du marché des acceptations bancaires (AB) au
Canada et ses liens essentiels avec le Canadian Dollar Offered Rate (CDOR). À l’échelle
du monde, les AB constituent un produit spécialisé utilisé seulement dans un nombre
restreint de pays. Au Canada, les AB procurent une source de financement de premier
plan aux petites et moyennes sociétés emprunteuses qui n’ont pas nécessairement un
accès direct au marché du financement primaire en raison de leur taille et de leur cote de

iii
crédit. Récemment, les AB sont également devenues une source de financement de plus
en plus importante pour les grandes sociétés emprunteuses à la suite des révisions à la
baisse des cotes de crédit dans certains secteurs et des fusions de sociétés. Le marché
allant croissant, les AB représentent maintenant le plus gros segment des instruments du
marché monétaire émis par des entités non gouvernementales et constituent le deuxième
segment en importance du marché monétaire canadien dans son ensemble : en 2017, leur
part s’établissait en moyenne à un peu plus de 25 % du marché monétaire intérieur total.
Au Canada, les AB procurent une source de revenus et de liquidité à court terme aux
investisseurs parce qu’elles sont relativement attrayantes du point de vue du rendement,
de la liquidité et de la notation de crédit.
Le marché des AB est intrinsèquement lié au CDOR, créé à l’origine en vue d’établir un
taux de référence quotidien pour les emprunts sous forme d’AB. Ce taux est plutôt
nuancé, par comparaison à ceux observés dans d’autres pays, en ce sens qu’il ne s’agit
pas directement d’un taux bancaire régissant les emprunts, mais d’un taux engagé
régissant les prêts. C’est le taux auquel les banques sont prêtes, aux termes d’un contrat, à
faire crédit aux sociétés emprunteuses disposant déjà de facilités de crédit par voie d’AB.
Le CDOR est également le principal taux d’intérêt de référence servant au calcul du taux
d’intérêt variable pour les produits dérivés libellés en dollars canadiens, qu’ils soient
négociés de gré à gré ou en bourse. Le CDOR sert aussi à déterminer les intérêts à verser
sur les obligations à taux variable.
Sujets : Institutions financières; Marchés financiers; Réglementation et politiques
relatives au système financier; Structure de marché et fixation des prix
Codes JEL : G, G1, G18, G2, G21, G2

1
Introduction This paper provides an overview of the bankers’ acceptance (BA) market in Canada, including a brief summary of the market’s history, evolution and lending mechanics. The paper also explains the essential link between BAs and the Canadian Dollar Offered Rate (CDOR), which is the main benchmark used to calculate the floating interest rate for both over-the-counter and exchange-traded Canadian-dollar derivative products.
Established in Canada in the early 1960s, BAs are part of the suite of money market products that are integral to the real economy and the transmission of monetary policy. In contrast to their more traditional use to finance international trade, BAs were introduced to the Canadian marketplace to develop a more active domestic money market. More than fifty years after their introduction, BAs account for the largest share of money market instruments issued by non-government entities and are the second-largest money market instrument overall in Canada, averaging just over 25 per cent of the total domestic money market in 2017.
As is evident by the continued growth in the BA market, these instruments are a key source of funds for small and medium-sized corporations that may not have direct access to primary funding markets because of their size and credit ratings. Recently, BAs have also become a more important funding source for large corporate borrowers because of credit-rating downgrades in certain sectors and industry consolidation. These products also fit within the investment policies of many institutional investors, which rely on BAs as a source of short-term income and liquidity.
The beginnings of bankers’ acceptances in Canada
BAs were introduced to the Canadian marketplace on June 11, 1962. They provided corporate borrowers with an alternative source of short-term funding, complementing other money market products available at the time, such as commercial paper (CP) and prime-based loans.1
A BA is a direct and unconditional order from a corporate borrower (client) to draw down against its established line of credit (called a “BA facility”) at a Canadian bank. Once the drawdown occurs, the accepting (or lending) bank guarantees the principal and interest by stamping the paper, thus becoming fully liable for the payment upon maturity in case of non-payment by the underlying corporate borrower. The accepting bank charges a fee, called the “stamping fee,” for this guarantee. The stamping fee has been bilaterally agreed to and is
1 The prime rate is the interest rate set by banks based on their cost of short-term funds and competitive pressures among them. Banks can charge rates above or below prime to their customers, depending on their creditworthiness.

2
dependent on the credit quality of the borrower. Once stamped, the BA is transferred to the bank’s (or dealer’s) stock of money market inventory, where it can be sold to investors in the secondary market. These products receive the same short-term credit rating as that of the accepting bank.
When first introduced, BAs were issued in physical (paper) form (Figure 1). The borrower would write the required drawdown amount and deliver the paper form to the accepting bank. The bank would then “accept” (stamp) the paper and return it to the borrower to sign the reverse, without making it payable to any other party (i.e., endorsing it in blank). This process allowed the BA to be payable to the bearer if it was sold to an investor by an investment dealer before maturity. Once the form was stamped, the borrower had full use of the funds while the BA was outstanding but was responsible for providing payment of the maturing amount at the main branch of the accepting bank in either Toronto or Montréal on the date of maturity. BAs could only be drawn in Canadian dollars and only for Canadian customers of domestic banks. Because the stamped BA was a direct and unconditional liability of the accepting bank, banks would normally only accept BA draws from corporate borrowers that had an established line of credit with that bank (Merrett, 1981).
Figure 1: Specimen of a bankers’ acceptance paper in physical form
A significant development in the BA market was moving from paper to electronic settlement of BAs through the Canadian Depository for Securities in the mid-1990s, eliminating the need for paper BAs. Electronic settlement also resulted in more anonymity for the borrower, whose name no longer appears on the BA. Only the name of the accepting bank is now disclosed.
3
The evolution of the Canadian BA market In Canada, BAs were introduced to encourage a more active domestic money market. This usage differs significantly from their more common use to finance international trade and importing activities (notably in the United Kingdom and the United States).2 BAs were a logical addition to the Canadian money market and a constructive step to broaden credit facilities and promote the efficient employment of funds available for short-term investment. BAs complement CP and bank loans as a source of financing for domestic activities, as well as non-government paper, treasury bills and other short-term government securities, which are short-term liquidity and income instruments used by domestic investors.
The original BA guidelines were developed over many years through extensive consultations with Canadian banks, investment dealers and the Bank of Canada. To support the market in its infancy and to help investment dealers finance the inventories necessary to create an active market, BAs were added to the list of eligible collateral for the Bank of Canada’s regular liquidity operations.3 To further support the market, the Bank was also prepared, on occasion, to buy and sell BAs for its own account if they met the legal restrictions under the prevailing Bank of Canada Act and had a maturity not exceeding 90 days.
To satisfy the legal restrictions, all BAs originally complied with these criteria, with banks only accepting BAs that were less than 90 days to maturity and from firms that used the funds to finance activities described in section 18 of the 1954 Bank of Canada Act.4 The terms to maturity of BAs initially ranged from 30 to 90 days, with a minimum face value of $200,000. The amounts available for drawdowns were $200,000, $300,000, $500,000 and $1 million. A combination of these amounts could be used, if required. Banks also initially limited BAs to the highest quality borrowers, since the paper was an unconditional liability of the bank.
Following their introduction, BAs outstanding averaged only around $10 million for the first three years they were available (Chart 1). The market continued to grow slowly during the early 1960s, in part owing to the large minimum face value of $200,000 and the high stamping fees charged by the banks. The minimum effectively excluded smaller corporate borrowers from participating in the market, and the high stamping fees made BAs less competitive than CP.5
2 This section draws heavily on Merrett (1981). 3 BAs were made eligible for purchase and resale agreements and for day-to-day loans from banks with the Bank of Canada. There was one stipulation: the bank accepting the day loan could not also be the bank stamping the BA. 4 At the time of their introduction, these restrictions allowed the funds to be used only for the production or marketing of goods, wares and merchandise, including agricultural and forest products, and products of quarries and mines as well as of the sea, lakes and rivers. 5 CP is issued by large, well-rated corporations that can issue securities in their own name in the primary market. Typically, CP is issued with a term of three months or less. CP does not require a stamping fee, and the

4
Chart 1: Canadian-dollar bankers’ acceptances and commercial paper outstanding since 1964
Dealers also preferred to hold the BAs that they had stamped for their own account rather than offering them in the secondary market, which limited secondary market trading volumes. Because the underlying borrower’s name was directly tied to the physical BA, dealers closely guarded the names of the clients, presumably to limit competition with other dealers.
It was not until the 1980s that the BA market gained significant traction among domestic participants. Part of the increase in BA activity was likely caused by major changes that occurred in the market during the late 1970s, including expanding activities that banks would finance using BAs and offering terms exceeding 90 days. Although these changes could have been introduced by banks at any time, there had been some hesitation, as these revised BAs would not be eligible for the Bank of Canada facilities. Nonetheless, one major bank took the initiative in 1978 and announced that it would stamp BAs for terms ranging from 10 to 180 days with no restrictions on how the funds would be used. Other major banks later followed suit. Further changes during the 1970s helped to support the growth of the BA market. For example,
requirement for a standby facility depends on the creditworthiness of the issuer. See the DBRS website for additional details.
0
10,000
20,000
30,000
40,000
50,000
60,000
70,000
80,000
90,000
1964 1968 1972 1976 1980 1984 1988 1992 1996 2000 2004 2008 2012 2016
Millions ($)
Bankersʼ acceptances Commercial paper
Last observation: February 2018Source: Bank of Canada Banking and Financial Statistics and Bank of Canada staff calculations

5
the amount borrowed through BAs became less restrictive, permitting any multiple of $100,000. As well, tightening credit conditions forced many borrowers to the BA market as an alternative to CP as a source of funds.
By the late 1980s, BAs outstanding exceeded $7 billion, and it was apparent that an active market for them was developing in Canada, reducing the need for continued support. As such, the Bank of Canada removed BAs from its eligible collateral list but continued to have the authority to buy and sell BAs that had a maturity not exceeding 180 days for its own balance sheet.6
Since the 1980s, BAs outstanding have generally been increasing, although three distinct cycles (i.e., peaks in 1990, 2000 and 2008) are apparent (Chart 1). These cycles follow the last three large stress events for financial markets, with the declines in BAs outstanding likely reflecting periods of more restrictive credit lending policies by banks. For example, following the 2007–09 global financial crisis, the stock of BAs outstanding fell by nearly 30 per cent as banks collectively reduced the amount of BA credit available. The full impact on the number of BAs outstanding was delayed by two to three years, since only 20 to 30 per cent of BA facilities come due each year. Unless otherwise stated in the loan agreement, the BA facility itself (i.e., the line of credit) and its terms are only renewed on the expiry of the facility.
In today’s market, BA maturities range anywhere from 1 to 365 days, depending on the terms of the loan agreement governing the borrower’s BA facility. The actual term of the BA is determined by the borrower, based on the desired maturity of the funds required. BAs are included as eligible collateral for the Bank of Canada’s Standing Liquidity Facility, and the Bank also has the authority under subsection 18(g) of the Bank of Canada Act to buy or sell a broad range of private sector debt securities, including BAs, for the purpose of conducting monetary policy or promoting the stability of the Canadian financial system. 7
The lending mechanics of bankers’ acceptances A variety of tools are available to corporate borrowers to meet their short-term funding requirements. These tools include primary market issuance, such as CP, or drawdowns against lines of credit based on the prime rate (with or without a spread) or BAs.
6 On December 1, 1980, the Bank of Canada announced that BAs would no longer be eligible as collateral for day loans and purchase and resale agreements (PRAs). The change became effective on February 1, 1981. 7 A full list of assets eligible as collateral under the Bank of Canada’s Standing Liquidity Facility can be found on the Bank of Canada website.

6
The funding tools available to corporate borrowers depend on their credit rating
A corporate borrower’s ultimate ability to access different funding tools depends heavily on its short-term credit rating.8 Table 1 provides an overview of the primary means for corporate borrowers to receive funding, which are based on short-term debt ratings issued by DBRS. The DBRS ratings are only used as a guideline in the illustration below. There can be exceptions and flexibility within each credit-rating category, depending on issuer name and market conditions. It should be noted as well that preferences for ratings are also in part due to regulatory considerations.
Table 1: Illustrative breakdown of the primary means of receiving short-term funding, by rating1
Credit quality DBRS short-term debt rating1 Ability to issue/access short-term funding products2
Highest quality R-1 (high)
CP and BA facility3 Superior R-1 (mid)
Good R-1 (low)
Adequate protection R-2 (high), R-2 (mid) and R-2 (low) BA facility
Lower end of adequate R-3 Prime or Prime+
Speculative R-4 1 See the DBRS website for rating definitions. 2 Most customers have access to a prime-based loan facility, regardless of their short-term credit rating. Some
borrowers with lower credit quality may also have access to BA facilities, but likely with a higher stamping fee. They may also be constrained by the bank’s internal limits on exposure to specific credit tiers (e.g., dollar limits for overall R-4 exposures).
3 CP refers to commercial paper, and BA facility refers to facilities for bankers’ acceptances.
Corporate entities that are highly rated by credit-rating agencies generally have favourable access to primary funding markets. Thus, they prefer to issue CP to meet most of their short-term funding needs under normal market conditions. CP is an unsecured promissory note that is supported by a standby line of credit as a liquidity backstop. The ability to raise funds directly in the primary market generally results in a lower cost of funding compared with drawdowns against lines of credit. It also establishes the borrower’s name in capital markets.
8 These credit ratings may be assigned by an external credit-rating agency in the case of large corporate borrowers, or by the corporate banking department of a financial institution in the case of smaller corporate borrowers that generally do not face the market for funding.

7
A wide range of corporate borrowers issue CP, including non-bank financial institutions, pipeline and utilities companies, auto manufacturers, and natural resource companies. These corporate borrowers generally also have access to the primary bond market and mainly use CP to raise additional working capital or to smooth seasonal cash flows. However, some large corporate borrowers with access to primary markets (approximately 10 to 15 per cent) also borrow against BA facilities to diversify their funding sources.
Corporate borrowers that face less favourable access to primary funding markets or that are privately held, unrated entities may rely more heavily on BA-based borrowings or on a prime-based line of credit to raise funds.9 For example, corporate borrowers with short-term debt ratings in the R-2 category (externally or internally rated) likely rely primarily on BA facility drawdowns for funding. However, exceptions do apply, as some borrowers in this rating category may still have favourable access to the CP market. Borrowers with short-term ratings below R-2 probably rely primarily on prime-based lines of credit at a reference rate of prime plus a credit spread (“prime+”).
Some corporate borrowers also fund themselves by originating and selling assets (receivables) into bank-sponsored conduits, who then repackage them into asset-backed commercial paper (ABCP) for distribution in the secondary market.
What is the difference between a bankers’ acceptance facility and a prime-based line of credit? While BA facilities and prime-based lines of credit are both revolving loan agreements used by corporate borrowers for funding purposes, significant differences exist. For a summary of the differences between BA- and prime-based loans, see Table 2.
The credit quality of the corporate borrower is a key differentiating factor between prime-based lines of credit and BA facilities. Most corporate borrowers with access to a BA facility also have access to a prime-based line of credit, although the reverse is not necessarily true. Clients with prime-based lines of credit are typically less creditworthy and, hence, will typically pay a higher rate of interest on their borrowings, as outlined in the loan agreement.
In large banks, corporate banking services is responsible for negotiating the terms of the loan with the corporate borrower and for managing the loan agreement. The loan agreement specifies the terms of the borrowing, including the duration of the committed facility, the maximum amount that can be outstanding at a time, the reference rate used to determine the base interest rate, any additional spread relative to the base rate and the term of borrowings
9 Access to lines of credit (BA or prime-based) are generally assessed on internal credit ratings managed by the bank’s corporate banking department because many clients are private, non-rated entities.

8
that can be conducted against the facility. In general, BA facilities have a slightly longer commitment period than prime-based facilities.
Table 2: Illustrative Differences between BA and prime-based borrowings
Prime-based line of credit Bankers’ acceptance facility
Credit quality of borrower (DBRS short-term ratings) R-3 and lower1 R-2 (low) and higher2
Term of committed facility 1 to 3 years Up to 5 years
Reference rate (interest rate) Prime CDOR3
Standby fee Yes Yes
Commitment fee Yes Yes
Additional fees4 Credit spread relative to prime Stamping fee
Term of the loan/drawdown Floating, pricing resets daily Term, 1 to 365 days
1 Most customers with this rating will have the option of a prime-based line of credit. 2 Some borrowers with lower credit quality may also have access to BA facilities, but likely with a higher stamping
fee, and may be constrained by institutional tier limits. 3 Not all bankers’ acceptance facilities reference the Canadian Dollar Offered Rate. 4 Arrangement and agency fees are also applicable to both prime- and BA-based lines of credit.
Most BA facilities reference CDOR as the interest rate benchmark for establishing the base borrowing rate to which the stamping fee is added.10 For BA facilities referencing CDOR, the effective borrowing rate is the prevailing CDOR set at 10:15 Eastern Time (ET) published by Thomson Reuters on the date of the drawdown plus the “stamping fee.” The stamping fee is charged by the accepting bank to guarantee the BA, and it varies across clients, depending on their credit rating. These fees can range from a few basis points (bps) for highly rated entities (e.g., R-1 [high]) to well over 100 bps for entities with a weaker rating. The stamping fee is negotiated with the corporate banking department when the facility is originally established or when the loan agreement is renegotiated on the facility’s maturity. In general, the stamping fee remains unchanged throughout the term of the facility, although it can be updated based on
10 CDOR represents the rate at which the submitting bank would be willing to lend (offer) funds against primary BA issuances to clients with existing credit facilities that reference CDOR and that have terms to maturity of approximately 1, 2, 3, 6 and 12 months. Additional details on CDOR can be found on page 20.

9
periodic tests of credit quality. Unlike the stamping fee, CDOR reflects general market conditions and can vary daily. However, CDOR tends to be relatively stable when no changes to the Bank of Canada overnight rate are expected by the market.11
In contrast, prime-based lines of credit reference the bank’s prime rate as the benchmark lending rate. Prime is the interest rate set by banks based on their cost of short-term funds and competitive market pressures. Unlike CDOR, the prime rate charged by banks is generally only updated following changes to the Bank of Canada policy rate. Financial institutions can charge rates above or below prime to their customers, depending on their creditworthiness.
Both types of revolving loans charge the borrower additional fees to maintain these facilities. For example, the borrower pays a commitment fee to hold the facility available for drawdowns. This fee is generally a set number of basis points per year for the duration of the facility and is payable up front. A standby fee also is paid on the undrawn portion of the facility to partly compensate banks for holding capital and liquidity against the entire facility for regulatory purposes. Arrangement and agency fees may also apply to both lines of credit.
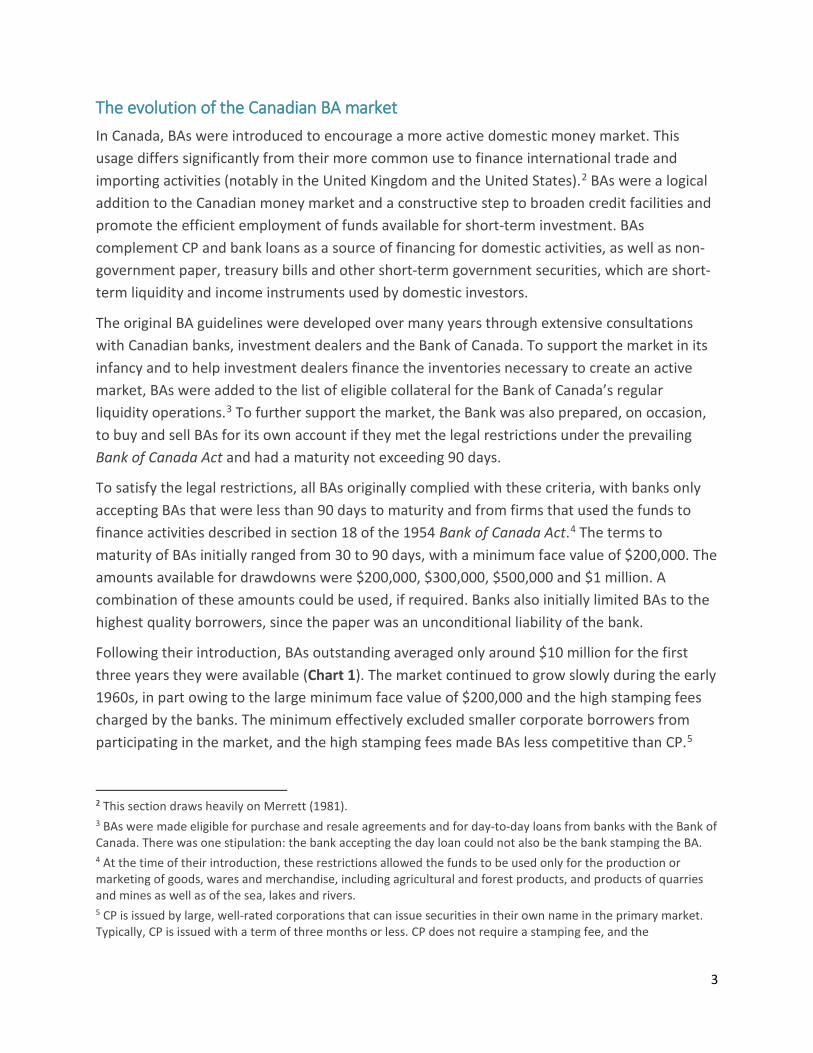
The loan agreement for a BA facility also specifies whether the creation of the BA is by syndication. Non-syndicated BAs involve only one dealer in their creation, whereas a syndicated BA involves multiple banks. For example, if a client asks to draw down $80 million against its BA facility, a non-syndicated transaction would require the one accepting bank to create an $80 million BA contract to match the drawdown. In a syndicated transaction, however, the accepting banks would split the issuance amount based on a predetermined ratio included in the loan agreement (Figure 2).
We estimate that around 20 to 30 per cent of existing BA facilities do not use CDOR as their reference base rate. Non-CDOR reference rates can include, for example, the CDOR submission of the individual bank at 10:15 ET on the day of the transaction (e.g., for non-syndicated BAs), an average of the CDOR submissions for the banks in the syndicate (e.g., if not all submitting banks are in the syndicate), an internal bank charge or any other market rate agreed to in the loan agreement.12
A further difference between BA facilities and prime-based lines of credit is the term of the loan. With a BA facility, clients can borrow cash for a set term, ranging anywhere from 1 to 365 days, but the actual maximum term is specified in the loan agreement. Clients have discretion to choose the length of the borrowing (subject to the loan agreement) to match their cash flow needs, typically 90 days or less. When the drawdown term does not match the existing CDOR 11 See Chart 5 on page 21. 12 Some large clients can “shop around” large drawdowns to multiple banks to receive a rate lower than CDOR for their BA. This process is usually conducted through a “jump ball” approach, where banks bid competitively on the rate the corporate borrowers will pay on the BA issuance. Sometimes the resulting rate provided by the winning bank is less than the prevailing CDOR. Banks may provide a lower rate if there are existing client relationships.
10
benchmark maturities, the actual underlying benchmark rate used is generally interpolated from the nearest CDOR settings. In contrast, the rate on prime-based borrowings is floating and resets daily to prime plus or minus their credit spread for the duration of the loan.
Figure 2: Illustrative example of syndicated and non-syndicated issuance of bankers’ acceptances1
1 Allocation amounts for syndicated banker’s acceptances (BA) issuance are determined by the underlying loan agreement. 2 Not all BA facilities reference the Canadian Dollar Offered Rate (CDOR) in their loan agreement.
How the accepting bank funds the loan also differs. Funding for prime-based draws comes from the general pool of bank funding, which provides the bank treasury with additional flexibility in determining the term and instrument used to raise the funds. In contrast, draws against a BA facility trigger the creation of a BA security with a matching term that can be sold to investors in the secondary market to fund the drawdown. However, the bank advances the funds to the borrower regardless of whether it sells the BA in the secondary market; thus, the loan may be initially funded centrally from the general pool of bank funding.
How do corporate clients borrow against a bankers’ acceptance facility? Corporate borrowers with access to both BA- and prime-based facilities decide which to use, based on (i) the spread between their prime-based lending rate, plus or minus a credit spread; and (ii) the daily benchmark CDOR interest rate (in most cases), plus the stamping fee. Generally, if the CDOR rate plus the stamping fee is less than the borrower’s all-in prime-based lending rate, the borrower will choose to borrow against its BA facility rather than drawing against its prime-based line of credit.
If the decision is made to draw down against the BA facility, the client gives notice to its account manager at the financial institution (or the syndicate lead) providing the funds,

11
specifying the drawdown term and amount. After notice is provided, the bank has a contractual obligation to supply the requested funds within one business day in exchange for the agreed reference rate plus the pre-negotiated stamping fee. For facilities that reference CDOR, the borrower only knows the complete rate on the loan once the underlying CDOR benchmark interest rate is published at 10:15 ET. After that time, the BA is created and the funds are advanced to the client.
The term of the borrowing requested depends on the corporate borrower’s cash flow requirements and interest rate expectations, as well as the shape of the CDOR benchmark curve. In general, corporate clients tend to borrow at the shortest CDOR tenor (1 month), owing to the short-term nature of the cash flow requirements and their desire to minimize their interest rate expense because of the generally upward-sloping CDOR curve. Although the tenor of some client borrowings is longer than 1 month, almost all are below 3 months (or 90 days). As such, most issuance volume (and thus stamped BAs) is in the 1-month tenor, with a lesser amount in the 3-month term. Given the committed nature of the BA facility, clients have minimal refinancing risk. If necessary, the underlying borrower rolls over the BA at maturity to meet funding requirements (e.g., accounts payable and payroll), with the largest drawdowns occurring around the 1st, 15th and last day of the month.
Once the draw is approved by corporate banking services, a BA is created by the investment bank/dealer, typically at the CDOR reference rate. Corporate banking services retains the stamping fee to cover the corporate borrower’s credit risk, while the investment bank/dealer may sell the BA to investors in the secondary market (at the offer side of the market) or hold it in inventory on its balance sheet. Figure 3 illustrates this process.

12
Figure 3: How bankers’ acceptances are created and sold to investors
1 The reference rate, Canadian Dollar Offered Rate (CDOR), is set daily at 10:15 ET. 2 This transfer generally takes place at CDOR set, at 10:15 ET.
Bankers’ acceptances in the modern era
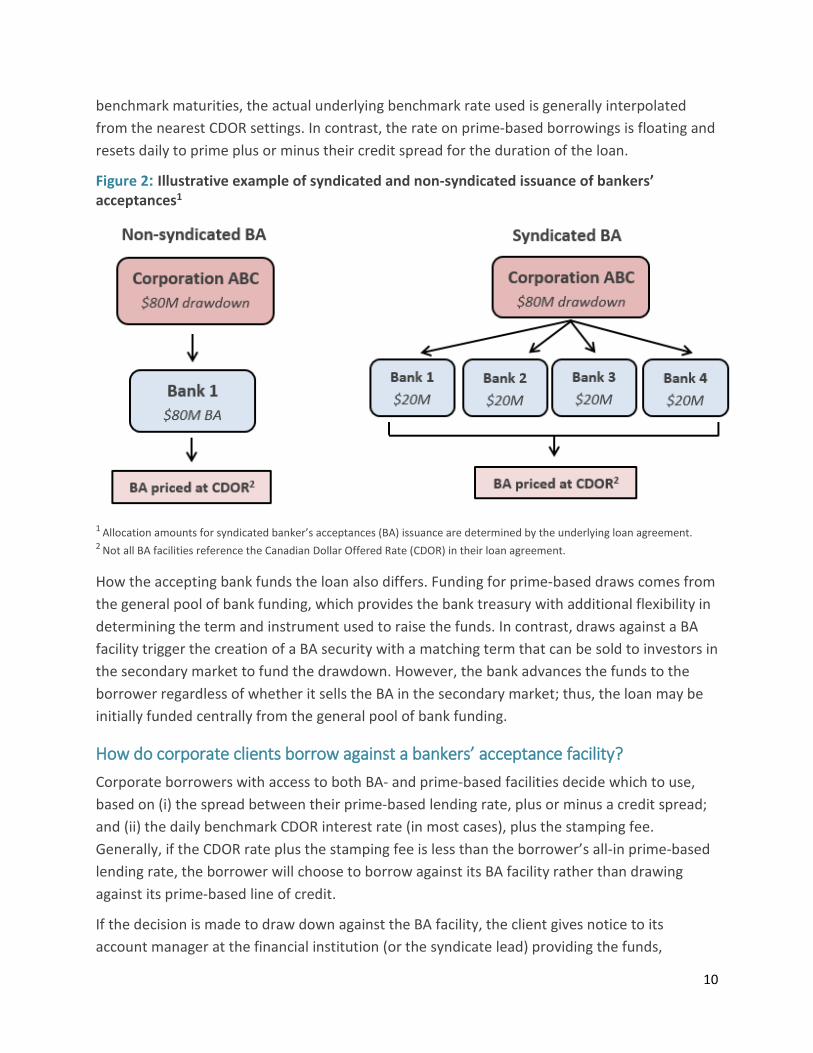
The bankers’ acceptance market is larger than the markets for other privately issued short-term instruments In Canada, wholesale short-term funding instruments can be categorized by issuer type and funding type (secured or unsecured). Public sector money market securities are those issued by all levels of government. These securities are primarily unsecured instruments (i.e., not guaranteed by specific assets), such as treasury bills and cash-management bills issued by the federal or provincial governments. Public sector issuance constitutes the largest share of money market instruments outstanding. In 2017, Government of Canada treasury bills accounted for just over 40 per cent of the money market, with slightly more than $115 billion outstanding, on average, while provincial treasury bills accounted for just over 15 per cent outstanding (or just under $50 billion), on average (Chart 2).
13
Chart 2: Total outstanding money market instruments since 1995
Securities issued by non-government entities form the remaining money market supply. In Canada, short-term secured funding instruments include secured assets such as asset-backed commercial paper (ABCP) and repurchase agreements. Unsecured, non-government funding instruments include BAs, CP, bearer deposit notes (BDNs)13 and certificates of deposit (CDs).14 Corporate borrowers primarily rely on CP and BAs to raise funds, and, in some cases, ABCP.
BAs account for the largest share of money market instruments issued by non-government entities, representing just over 25 per cent of the total money market, or slightly more than $75 billion outstanding, on average, in 2017. While the BA market declined after the financial crisis, it has rebounded, increasing by slightly less than 70 per cent since its trough in 2010. Since the stock of BAs outstanding is mainly cyclical, the most recent growth (since 2010) can be partly attributed to new, larger corporate clients tapping BA-based lines of credit, including Canadian
13 It is difficult to estimate the amount of bearer deposit notes outstanding because they are not tracked independently on banks’ balance sheets. 14 For detailed descriptions of the individual funding instruments, see Truno et al. (2017).
0
20
40
60
80
100
120
140
160
180
20019
95
1996
1997
1998
1999
2000
2001
2002
2003
2004
2005
2006
2007
2008
2009
2010
2011
2012
2013
2014
2015
2016
2017
2018
Can$ billions
Bankers' acceptances Asset-backed commercial paperCommercial paper Provincial treasury billsGovernment of Canada treasury bills
Last observation: February 2018Sources: Bank of Canada Banking and Financial Statistics, Statistics Canada and Bank of Canada staff calculations

14
oil and pipeline companies and utilities and telecommunications companies. Owing to credit-rating downgrades following the collapse in oil prices and the accumulation of debt to fund large merger and acquisition activities, as well as shareholder-friendly dividend and leverage profiles, these companies have become more reliant on BA facilities in lieu of bond and CP issuance. In addition, use of BA-based facilities by commercial borrowers who were not previously eligible has also risen.
Securitizations (or ABCP) are the second-largest money market instrument issued by the private sector, with just over 10 per cent, or about $35 billion, outstanding in 2017. The size of the ABCP market in Canada has remained relatively small since the financial crisis owing to the reduced number of issuers and decreased investor interest in this sector.15 Since the crisis, only bank-sponsored programs that hold assets sold to them by corporate borrowers, including insured mortgages, home equity lines of credit, consumer loans, credit card receivables and commercial leases, have issued ABCPs. However, asset-backed issuance has increased more recently owing to the rise in insured mortgages and auto and equipment loans.
CP accounted for just over 5 per cent (or around $20 billion, on average) of money market instruments outstanding in 2017. The size of the CP market has been relatively stagnant since the financial crisis in Canada (Chart 2). The lack of growth in CPs outstanding can be partly attributed to the lack of supply, which has reduced issuance. For example, credit-rating downgrades to telecommunication and oil and pipeline companies have reduced supply in this sector and triggered a general consolidation of issuers through merger and acquisition activity. Active issuers in this market tend to be large non-bank financial services and real estate companies and utility companies.16
Bankers’ acceptances are primarily issued by the Big Six Canadian banks BAs are primarily issued by the banks that submit rates for CDOR. In 2017, there were seven submitting banks, which originated close to 98 per cent of the total value of BAs issued in Canadian dollars. This issuance has been split relatively evenly between domestic banks: the Toronto-Dominion (TD) Bank, the Royal Bank of Canada (RBC) and the éeal (BMO) issued the most BAs in 2017 (Chart 3). Currently, there are six CDOR-submitting banks: BMO, the Bank of
15 During the financial crisis, the market for third-party asset-backed commercial paper (ABCP) froze, and issuers were forced to take these securities back onto their balance sheets. Non-bank-sponsored ABCP was ultimately restructured through a proceeding under the Companies’ Creditors Arrangement Act and is no longer being issued in Canada. 16 Owing to the heightened risk aversion by investors during the 2007–09 period, other short-term credit markets, such as CP, showed signs of stress as investors were concerned about the underlying borrowers. The BA market was affected to a lesser extent. Based on data from the Market Trade Reporting System (MTRS) 1.0, secondary market trade volume for CP fell by almost 90 per cent from peak to trough, while BA trading volume fell by just over 60 per cent, peak to trough, during the financial crisis. Since the crisis, the CP market has been relatively stagnant, averaging around $10 billion outstanding annually.

15
Nova Scotia (BNS), the Canadian Imperial Bank of Commerce (CIBC), the National Bank Canada (NBC), RBC and TD. The composition of BA originations has been relatively stable among the CDOR-submitting banks over time.
Chart 3: Total Canadian-dollar issuance of bankers’ acceptances (liabilities), in 2007 and 2017, per cent
Clients typically draw anywhere from $10 million to $100 million against their BA facility although the draw can vary from as low as $100,000 to as high as $1.5 billion, depending on the client’s size and borrowing needs. Total BAs outstanding for each bank generally range from $8 billion to $14 billion and, as such, a +/- $2 billion change in drawdowns can have a material effect on the market price of BAs and the size of a dealer’s BA inventory.
Like other money market securities, BAs are issued and quoted on a discounted basis to the face value of the security, since they do not pay a coupon. For example, a 30-day BA with a face value of $1 million and a yield of 1.35 per cent would have a price at issue of $99.889 and a cash value of $998,890.00. This contrasts with interest-bearing instruments, such as bonds that at issue have a price equal or close to their face or par value. Money market securities pay the face value at maturity, and the investor’s return is the difference between the original discounted purchase price and the face value.
16
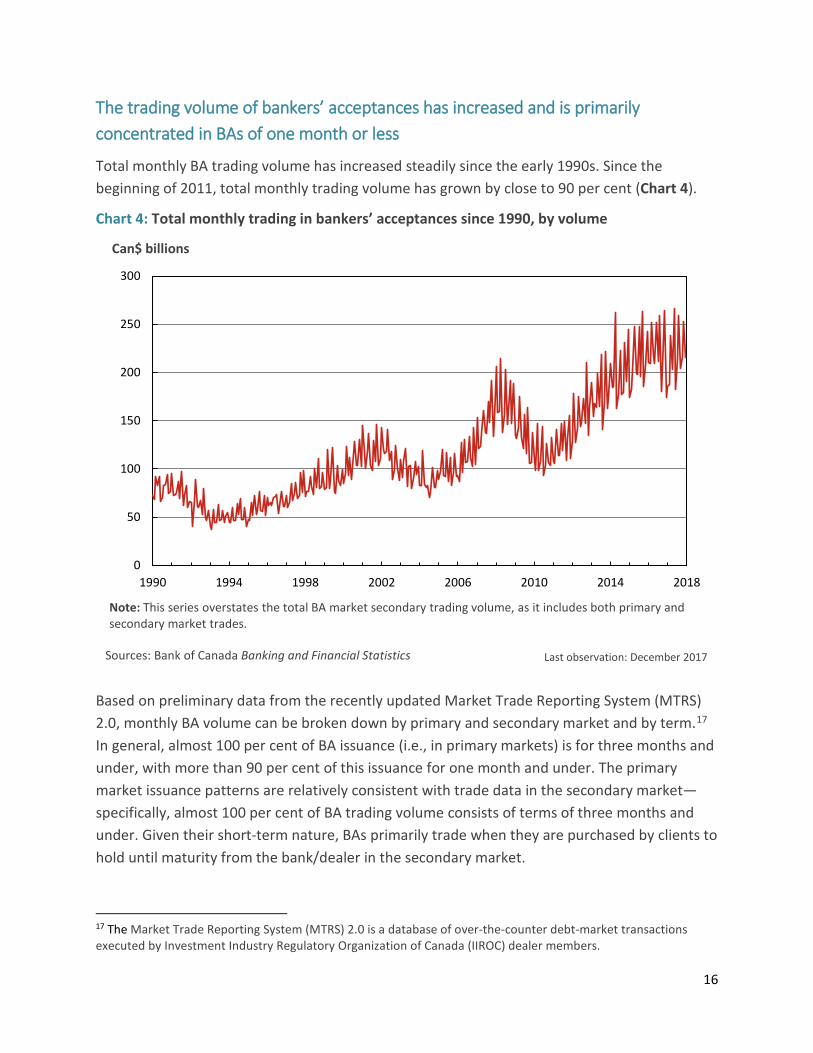
The trading volume of bankers’ acceptances has increased and is primarily concentrated in BAs of one month or less
Total monthly BA trading volume has increased steadily since the early 1990s. Since the beginning of 2011, total monthly trading volume has grown by close to 90 per cent (Chart 4).
Chart 4: Total monthly trading in bankers’ acceptances since 1990, by volume
Based on preliminary data from the recently updated Market Trade Reporting System (MTRS) 2.0, monthly BA volume can be broken down by primary and secondary market and by term.17 In general, almost 100 per cent of BA issuance (i.e., in primary markets) is for three months and under, with more than 90 per cent of this issuance for one month and under. The primary market issuance patterns are relatively consistent with trade data in the secondary market—specifically, almost 100 per cent of BA trading volume consists of terms of three months and under. Given their short-term nature, BAs primarily trade when they are purchased by clients to hold until maturity from the bank/dealer in the secondary market.
17 The Market Trade Reporting System (MTRS) 2.0 is a database of over-the-counter debt-market transactions executed by Investment Industry Regulatory Organization of Canada (IIROC) dealer members.
0
50
100
150
200
250
300
1990 1994 1998 2002 2006 2010 2014 2018
Can$ billions
Last observation: December 2017
Note: This series overstates the total BA market secondary trading volume, as it includes both primary and secondary market trades.
Sources: Bank of Canada Banking and Financial Statistics

17
For investors, bankers’ acceptances provide a pickup over the yields of other money market instruments in the secondary market
For the investment community, the money market space offers a variety of instruments to meet short-term income and liquidity needs. The investment decision depends on the investor’s specific investment mandate, but is generally based on liquidity and return requirements as well as overall credit exposure to individual issuers or types of issuers. Given the predominantly short-term nature of BAs, they are generally viewed as assets to buy and hold to maturity, but they can be traded for cash-management needs, term extensions and credit constraints. BA investors typically include insurance companies, pension funds, money market mutual funds, corporations, bank treasuries, government agencies and asset managers.
Table 3 illustrates the relative spread of 3-month Canadian money market products over Government of Canada 3-month treasury bills in the secondary market. These spreads will vary based on supply and demand dynamics and may be influenced by the issuer name, product liquidity, relative credit rating and general market conditions.
Table 3: Illustrative spread of money market securities over Government of Canada treasury bills
Money market product (secondary market)
Spread over Government of Canada 3-month treasury bills
(basis points)
Government of Canada treasury bills 0
Provincial treasury bills +10
Commercial paper +30
Bankers’ acceptances +30
Bearer deposit notes +30
Asset-backed commercial paper +40
Note: Spreads will vary, based on the issuer name, product liquidity, relative credit rating and market conditions, and are rounded to within five basis points for illustrative purposes. For example, during the 2007–09 financial crisis, the spread between 3-month commercial paper (CP) and bankers’ acceptances (BAs) widened significantly because of concerns about the underlying CP borrowers.
Source: Primary dealer indicative quotes Observation period: 2017
Provincial paper generally demands the smallest spread over Government of Canada treasury bills because they are backed by a provincial government rather than a private entity. In contrast, bank-sponsored ABCP demands the highest spread in the market, since there are fewer investors with investment mandates that include asset-backed paper, owing to reduced appetite to hold structured paper since the financial crisis.

18
BAs offer a relatively attractive yield pickup in the secondary market over treasury bills while still being highly liquid and well rated. For example, over the past year, the average pickup has averaged around 30 basis points for 3-month BAs over the yield for treasury bills. Since these instruments receive the credit rating of the accepting bank, the clear majority of BA issuance receives the highest short-term DBRS credit rating of R-1 (high), reflecting the strong credit position of the banks issuing them.
Also available to investors in the money market space are bearer deposit notes (BDNs). Unlike BA issuance, which is triggered by a corporate draw on its BA facility, BDNs are issued directly by the bank in its own name, typically to fulfill a bank’s general funding need.18 As well, BDNs can trade at a slightly wider spread over treasury bills compared with BAs. BDNs may be issued by reverse inquiry from investors seeking a specific BA maturity date that is not available from the bank’s current BA inventory. As such, BDNs allow for greater flexibility than BAs in terms of the size and maturity term, with typical maturities that are longer than BAs and range from three months to one year.
New products and regulations have altered the money market landscape Increased competition from higher-yielding short-term assets resulting from the gradual implementation of new banking regulations and the low interest rate environment has eroded some traditional demand for BAs. Products such as high-interest corporate savings accounts, guaranteed investment certificates and term deposits are being offered at higher rates than BAs. This is partly because of their more beneficial regulatory treatment, which has crowded out some of the demand from the traditional investor base and led to higher yields and spreads than those for overnight index swaps (OIS).
New banking regulations, such as the Liquidity Coverage Ratio (LCR) and the Net Cumulative Cash Flow (NCCF), have also made holding BA inventory (both BAs in their own name and those issued by other banks) on balance sheets more capital- and liquidity-intensive. As such, anecdotally, dealers have reduced their BA inventories at month- and quarter-end, leading to higher BA secondary market offer yields to entice client demand and manage inventory levels. The regulatory treatment of BAs under the LCR and the NCCF and the upcoming Net Stable Funding Ratio (NSFR) are briefly outlined in Box 1.19
18 Depending on their corporate structure, some banks can issue BAs directly for their own funding instead of issuing BDNs. 19 Additional information on the LCR, NCCF and NSFR is available on the websites of the Office of the Superintendent of Financial Institutions and the Basel Committee on Banking Supervision.

19
Box 1: Regulatory treatment of bankers’ acceptances
LCR–Liquidity Coverage Ratio - The LCR aims to ensure that institutions have an adequate stock of unencumbered
high-quality liquid assets (HQLA) to meet their liquidity needs for a liquidity stress event that lasts 30 calendar days.
𝑺𝑺𝑺𝑺𝑺𝑺𝑺𝑺𝑺𝑺 𝑺𝑺𝒐𝒐 𝑯𝑯𝑯𝑯𝑯𝑯𝑯𝑯𝑻𝑻𝑺𝑺𝑺𝑺𝑻𝑻𝑻𝑻 𝒏𝒏𝒏𝒏𝑺𝑺 𝑺𝑺𝑻𝑻𝒄𝒄𝒄𝒄 𝑺𝑺𝒐𝒐𝑺𝑺𝒐𝒐𝑻𝑻𝑺𝑺𝒐𝒐𝒄𝒄 𝑺𝑺𝒐𝒐𝒏𝒏𝒐𝒐 𝒏𝒏𝒏𝒏𝒏𝒏𝑺𝑺 𝟑𝟑𝟑𝟑 𝑺𝑺𝑻𝑻𝑻𝑻𝒏𝒏𝒏𝒏𝒄𝒄𝑻𝑻𝒐𝒐 𝒄𝒄𝑻𝑻𝒅𝒅𝒄𝒄
≥ 𝟏𝟏𝟑𝟑𝟑𝟑 𝒑𝒑𝒏𝒏𝒐𝒐 𝑺𝑺𝒏𝒏𝒏𝒏𝑺𝑺
- Bankers’ acceptances (BAs) are not considered part of HQLA and, therefore, holding them on the balance sheet once their term falls below 30 days is punitive.
NCCF–Net Cumulative Cash Flow - The NCCF is a liquidity-horizon metric that measures an institution’s net cumulative
cash flow to capture the risk posed by funding mismatches between assets and liabilities over 12 months.
𝑵𝑵𝑵𝑵𝑵𝑵𝑵𝑵 (𝒐𝒐𝒏𝒏𝒏𝒏𝑺𝑺𝒄𝒄) = �(𝑰𝑰𝒏𝒏𝒐𝒐𝑻𝑻𝑺𝑺𝒐𝒐𝒄𝒄 − 𝑶𝑶𝒐𝒐𝑺𝑺𝒐𝒐𝑻𝑻𝑺𝑺𝒐𝒐𝒄𝒄),𝑵𝑵𝒐𝒐𝑪𝑪𝒐𝒐𝑻𝑻𝑻𝑻𝑺𝑺𝑪𝑪𝒐𝒐𝒏𝒏
- Under NCCF, 75 per cent of the outstanding reported BA liabilities on the balance sheet are recorded as outflows. This means that only 25 per cent of the BAs held on the balance sheet are assumed to be rolled over by the borrower monthly.
NSFR–Net Stable Funding Ratio
- The intent of the NSFR1 is to enhance the stability of the bank’s funding profile by limiting its over-reliance on short-term wholesale funding. The calibration reflects the stability of liabilities across multiple dimensions: funding tenor, funding type and counterparty.
𝑯𝑯𝒐𝒐𝑻𝑻𝑪𝑪𝑻𝑻𝑻𝑻𝑨𝑨𝑻𝑻𝒏𝒏 𝑻𝑻𝑪𝑪𝑺𝑺𝒐𝒐𝒏𝒏𝑺𝑺 𝑺𝑺𝒐𝒐 𝒄𝒄𝑺𝑺𝑻𝑻𝑨𝑨𝑻𝑻𝒏𝒏 𝒐𝒐𝒐𝒐𝒏𝒏𝒄𝒄𝑪𝑪𝒏𝒏𝒇𝒇 (𝑯𝑯𝑺𝑺𝑵𝑵)𝑹𝑹𝒏𝒏𝑹𝑹𝒐𝒐𝑪𝑪𝒐𝒐𝒏𝒏𝒄𝒄 𝑻𝑻𝑪𝑪𝑺𝑺𝒐𝒐𝒏𝒏𝑺𝑺 𝑺𝑺𝒐𝒐 𝒄𝒄𝑺𝑺𝑻𝑻𝑨𝑨𝑻𝑻𝒏𝒏 𝒐𝒐𝒐𝒐𝒏𝒏𝒄𝒄𝑪𝑪𝒏𝒏𝒇𝒇 (𝑹𝑹𝑺𝑺𝑵𝑵)
≥ 𝟏𝟏𝟑𝟑𝟑𝟑 𝒑𝒑𝒏𝒏𝒐𝒐 𝑺𝑺𝒏𝒏𝒏𝒏𝑺𝑺
- As drafted by the Basel Committee on Banking Supervision, the ASF factor is 0 per cent if the institution cannot determine who is the beneficial owner of the BA in the secondary market. The RSF factor, meanwhile, is either 50 per cent or 85 per cent, depending on the remaining term to maturity of the BA facility (less than one year versus longer than one year) for the on-balance-sheet share of the facility.
1 On February 6, 2018, OSFI extended the domestic implementation timeline of the NSFR from January 2019 to January 2020. In October 2014, the Basel Committee on Banking Supervision published revisions to its NSFR with an international implementation date of January 1, 2018.
20
The intrinsic link between bankers’ acceptances and the Canadian Dollar Offered Rate CDOR represents the rate at which the submitting bank would be willing to lend (offer) funds against primary BA issuances with terms to maturity of approximately 1, 2, 3, 6 and 12 months to clients with existing credit facilities that reference CDOR. This represents the bid side of primary BA issuance. It is worth noting that the submitted CDOR rate is not specific to a type of borrower or an amount but is, rather, a benchmark rate for each respective tenor. This contrasts with the offer-side rate (for cash BAs), which is the secondary market rate offered by banks to entice investor demand and manage BA inventory levels once the BAs have been issued.
CDOR is closely tied to overall money market conditions, specifically market expectations for the Bank of Canada’s target overnight rate, as determined by the overnight index swap rate (OIS) (Chart 5). The OIS is an over-the-counter derivative in which two parties agree to exchange, or swap, for a specified period, a fixed interest rate for a floating rate, the Canadian Overnight Repo Rate Average (CORRA). Also evident in Chart 5 is the relative stability of CDOR during periods when little to no rate expectations are priced in by the market (via the OIS), which was the case between 2011 and 2015. During this period, the 1-month CDOR-OIS spread averaged just under 30 basis points. More recently, this spread has drifted wider, largely due to dealers’ higher cost of funding, the cost of holding inventory on the balance sheet and more stringent regulatory requirements for HQLA.
Many factors may influence CDOR: regulatory costs; credit market conditions; seasonal funding pressures, such as month- or quarter-end, and the supply-demand dynamics for BAs, including secondary market trading activity.
CDOR was first developed by the banks to facilitate the calculation of a reference rate for syndicated BAs.20 In the 1980s, it was adopted by the newly developed Canadian interest rate swap market for calculating the floating-rate payment of the Canadian-dollar interest rate swap. In 1988, the 3-month CDOR rate became the reference rate for BA futures contracts (known as BAX) when these were launched on the Montréal Exchange.
CDOR is still calculated and used for its original purpose—pricing syndicated BAs. The market has evolved, however, and today the daily CDOR settings are used to price a variety of Canadian-dollar instruments. These include futures contracts on BAs, forward-rate agreements
20 CDOR was originally known as the Canadian Dollar Offered Rate, but in 2008 it began to be called the Canadian Dealer Offered Rate. In June 2014, the name reverted to the Canadian Dollar Offered Rate, reflecting the fact that all CDOR panel members were now banks. See IIROC (2014) for additional information.

21
(FRAs) and floating-rate notes (FRNs).21 Most financial products that reference CDOR (specifically, interest rate swaps, BAX contracts and most FRNS) also reference the 3-month CDOR rate. Other terms, such as the 6- and 12-month CDOR, are rarely used as reference rates.
Chart 5: Canadian Dollar Offered Rates generally track expectations for the Bank of Canada target rate, 1-month CDOR
Governance of the Canadian Dollar Offered Rate Until July 10, 1988, the Bank of Canada Jobber Committee was responsible for the CDOR survey, with Reuters Inc. (now Thomson Reuters) acting as the calculation and publication agent (IDA 1998). After July 10, 1988, responsibility for the survey fell to the Investment Dealers Association of Canada (IDA), a self-regulatory organization. The survey results continued to be calculated and published by Reuters. In 2003, the CDOR Working Group was created by the IDA as a forum for discussing matters related to setting and disseminating CDOR. This working group consisted of representatives from the submitting banks and the IDA; the Bank of Canada was an observer.
In 2008, the IDA and Market Regulations Services Inc., which was an independent regulation services provider for Canadian equity marketplaces, merged to form the Investment Industry
21 US-dollar LIBOR is also used as the benchmark for US-dollar swaps and euro-dollar futures, as well as for other US-dollar derivatives, loans, mortgages and FRNs.
0
1
2
3
4
5
6
2005 2006 2007 2008 2009 2010 2011 2012 2013 2014 2015 2016 2017 2018
Per cent
Overnight swap index 1-month Canadian Dollar Offered Rate
Bank of Canada overnight rate
Last observation: April 2018Source: Bloomberg
22
Regulatory Organization of Canada (IIROC). IIROC assumed the oversight of and administrative responsibility for CDOR, while the calculation and administration of the benchmark continued to be conducted by Thomson Reuters.22
In August 2012, IIROC began a review of CDOR. This timing coincided with the Wheatley Review of LIBOR, published in September 2012.23 The IIROC review focused primarily on the governance of supervisory practices around the CDOR submissions. The CDOR review report was published in January 2013.24 While the review found that the supervisory practices related to CDOR submitters were adequate overall, they recommended several improvements, including the following:
• specific documented criteria for participation in the rate-setting process; • more explicit documentation related to CDOR’s calculation methodology, definition and
transparency; and • documented criteria for the participation in and supervision of the CDOR-setting
process and controls to prevent potential manipulation.
In July 2013, the International Organization of Securities Commissions (IOSCO) published “Principles for Financial Benchmarks” following investigations into and enforcement actions regarding attempted manipulation of major interest rate benchmarks. IOSCO’s principles, which were endorsed by the G20 and the Financial Stability Board (FSB), outline the framework for the governance and administration of financial benchmarks.25
Numerous steps have been taken to improve Canadian reference rates, taking into account the recommendations from IIROC’s 2013 review of CDOR and the introduction of the 2013 IOSCO principles.26 These include the following:
• In June 2014, IIROC published a voluntary code of conduct developed by an industry panel of CDOR-submitting banks in consultation with IIROC and the Bank of Canada.27 The code includes minimum standards for submission methodology, internal oversight
22 The IDA’s trade association role was eliminated in 2006 with the creation of a separate and independent trade association called the Investment Industry Association of Canada (IIAC). 23 In June 2012, the UK government tasked Martin Wheatley, managing director of the Financial Services Authority (FSA) and co-designate of the Financial Conduct Authority, to conduct an independent review into the setting and use of LIBOR. See Wheatley (2012) for further information. 24 See IIROC (2013) for more information on the IIROC review of CDOR supervisory practices. 25 See IOSCO (2013) for further information on the principles for financial benchmarks. 26 See Lane (2014) and Thorn (2014) for more information on the steps taken to strengthen the governance of CDOR. 27 See IIROC (2014) for the IIROC news release.

23
and record retention. The code was later adopted by Thomson Reuters when it became the administrator at the end of 2014 and has been updated several times since.28
• The responsibility for CDOR submissions moved from the dealer to the bank side of the business for all submitters to better reflect the fact that BA-based lending is a banking activity. Consistent with this move, in January 2014, OSFI assumed a supervisory role on the effectiveness of governance and risk controls surrounding banks’ CDOR-submission process.29 In September 2014, OSFI published the final guidelines (E-20) for CDOR benchmark-setting submissions.30 Full implementation of the guideline was expected no later than December 31, 2014.
• In summer 2014, the CDOR panel member banks conducted a Request for Proposals process to create an IOSCO-compliant administrator for CDOR.31 Thomson Reuters was appointed the CDOR administrator on December 31, 2014, after previously being the calculating and publishing agent. As administrator, Thomson Reuters is responsible for calculating, administering, distributing and commercializing the rate.
• In 2015, the CDOR and CORRA Oversight Committee was formed by Thomson Reuters, the administrator of the two benchmarks. The Oversight Committee meets three to four times each year to discuss matters related to Canadian financial benchmarks, including reviewing the definition, scope and methodology of the benchmarks to ensure that they remain optimal and reflective of all relevant regulations and guidance. A full list of the roles and responsibilities of the Independent Oversight Committee can be found in the Terms of Reference for the CDOR and CORRA Oversight Committee on the Thomson Reuters website.
How is the Canadian Dollar Offered Rate calculated? Each day, before 10:15 ET, the submitting banks provide Thomson Reuters32 with the rate at which they are willing to lend their balance sheet to corporate borrowers with existing BA facilities (the primary bid-side quote) referencing CDOR, for five different maturities of 1-, 2-, 3-, 6- and 12-month terms.33 The highest and lowest quotes are dropped, and a simple arithmetic average of the remaining quotes is calculated to set the daily CDOR benchmark. The CDOR for each maturity term is annualized, based on a 365-day year. The five calculated CDOR
28 See Thomson Reuters (2018a) for the code of conduct for the CDOR administrator and CDOR submitter. 29 See OSFI (2014) for additional information on OSFI’s role in the oversight of CDOR benchmark setting. 30 For additional information, see OSFI Final Guideline E-20 – CDOR Benchmark-Setting Submissions. 31 IIAC, with three interdealer brokers, conducted a similar RFP for an IOSCO-compliant administrator for CORRA. 32 See Thomson Reuters (2018b) for further information on the CDOR methodology. 33 CDOR is calculated with maturity terms of 1, 2, 3, 6 and 12 months but, in general, bank clients can draw down against their credit facility for terms ranging from 1 to 365 days.

24
benchmark rates and all the submitted quotes are published by Thomson Reuters by 10:15 ET on the same day for subscribers to the real-time feed and are available on a delayed basis for free at 16:00 ET.
The submitting banks include the Bank of Montreal (BMO), Bank of Nova Scotia (BNS), National Bank of Canada (NBC), Toronto-Dominion (TD) Bank, Royal Bank of Canada (RBC) and the Canadian Imperial Bank of Commerce (CIBC). Previously, Merrill Lynch Canada Inc., Deutsche Bank Securities Limited and the Hong Kong and Shanghai Banking Corporation (HSBC) were participants in the voluntary daily CDOR survey. Merrill Lynch Canada withdrew from the CDOR-setting process on December 5, 2012, while Deutsche Bank Securities withdrew effective January 31, 2014, and HSBC withdrew effective January 8, 2018.
While only six banks make up the current submission panel, they represent the top six BA issuers, originating close to 92 per cent of the BAs outstanding in 2017.
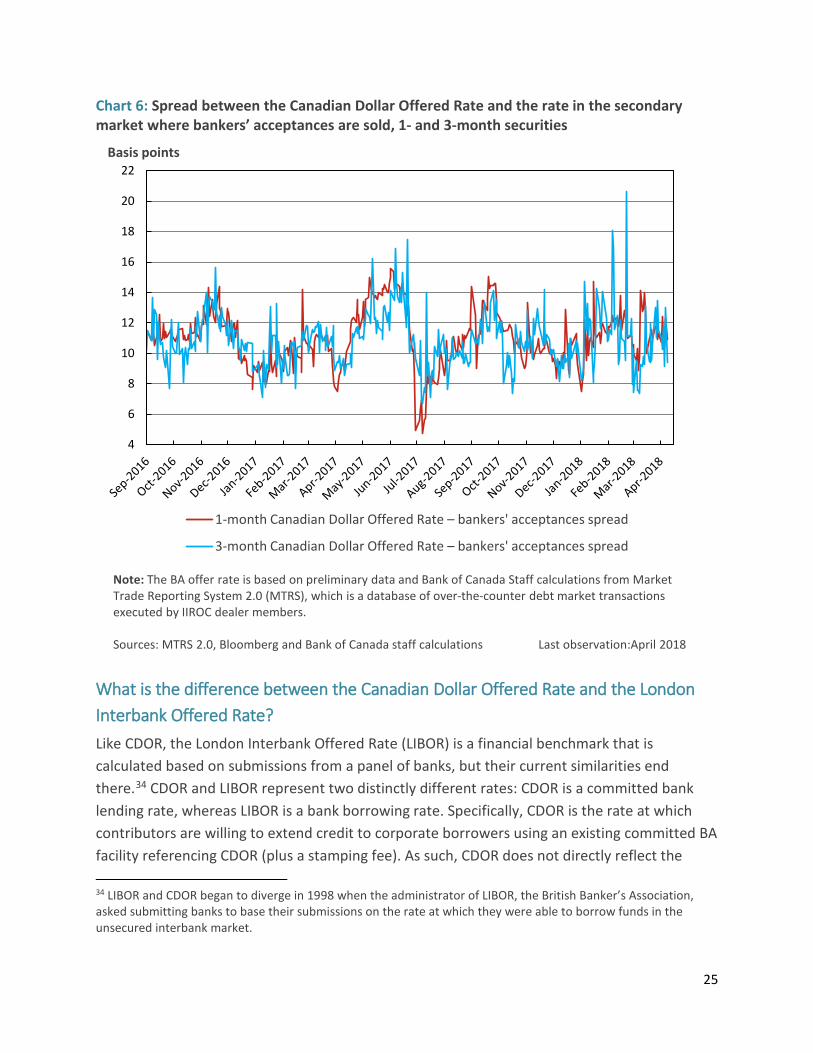
Why is there a spread between the Canadian Dollar Offered Rate and the bankers’ acceptance rate? The CDOR-BA offer spread reflects the difference between the CDOR rate and the rate in the secondary market where dealers are offering those BAs. Said another way, it is the difference between the rate at which banks lend their balance sheet to corporate borrowers with existing BA facilities and the rate at which the dealers offer (sell) the created BA from inventory on their balance sheet to investors in the secondary market.
Many factors influence the spread between the primary and secondary markets for BAs. For example, structural factors due to regulatory requirements affect a bank’s ability to warehouse inventory over month- and quarter-ends. The spread can also vary on a short-term basis, depending on seasonality and client demand.
Before the financial crisis, the spread of CDOR to cash BAs was around 2 to 3 basis points. Owing to the additional regulatory costs following the crisis (Box 1), especially those affecting committed credit facilities, the spread between CDOR and cash BAs has increased, averaging around 8 to 12 basis points. Using preliminary data from MTRS 2.0, which include transactions executed by IIROC dealer members, the spread of CDOR over cash BAs for both the 1- and 3-month terms averaged around 11 basis points from September 2016 to December 2017 (Chart 6). The higher regulatory costs are related to both trading and balance sheet use of both BAs and the BA facilities. This spread also tends to move in tandem with BA dealer inventories, especially around month- and quarter-end as banks try to reduce their BA inventory.
25
Chart 6: Spread between the Canadian Dollar Offered Rate and the rate in the secondary market where bankers’ acceptances are sold, 1- and 3-month securities
What is the difference between the Canadian Dollar Offered Rate and the London Interbank Offered Rate? Like CDOR, the London Interbank Offered Rate (LIBOR) is a financial benchmark that is calculated based on submissions from a panel of banks, but their current similarities end there.34 CDOR and LIBOR represent two distinctly different rates: CDOR is a committed bank lending rate, whereas LIBOR is a bank borrowing rate. Specifically, CDOR is the rate at which contributors are willing to extend credit to corporate borrowers using an existing committed BA facility referencing CDOR (plus a stamping fee). As such, CDOR does not directly reflect the 34 LIBOR and CDOR began to diverge in 1998 when the administrator of LIBOR, the British Banker’s Association, asked submitting banks to base their submissions on the rate at which they were able to borrow funds in the unsecured interbank market.
4
6
8
10
12
14
16
18
20
22Basis points
1-month Canadian Dollar Offered Rate – bankers' acceptances spread
3-month Canadian Dollar Offered Rate – bankers' acceptances spread
Note: The BA offer rate is based on preliminary data and Bank of Canada Staff calculations from Market Trade Reporting System 2.0 (MTRS), which is a database of over-the-counter debt market transactions executed by IIROC dealer members.
Sources: MTRS 2.0, Bloomberg and Bank of Canada staff calculations Last observation:April 2018

26
creditworthiness of the submitter. In contrast, LIBOR is an estimate of the rate at which the contributor believes it can borrow in the unsecured interbank market from other banks at various maturities and in different currencies.35
Following the publication of the final report of the Wheatley Review in September 2012, the British Bankers’ Association implemented several changes to LIBOR recommended by the Review. These changes included discontinuing LIBOR fixings for five out of the ten currencies and reducing the number of terms published from fifteen to seven.36 The Wheatley Review found that usage of LIBOR was concentrated in a few core currencies and maturities. As such, there were a number of published LIBOR benchmarks that were difficult to support using trade data, since little interbank lending occurred in these currencies in the London market. These rates were also not readily used as benchmarks by market participants. As of May 2013, the Canadian-dollar LIBOR was discontinued, with no market-related issues associated with its discontinuation.37
What is the difference between the Canadian Dollar Offered Rate and the Australian Bank Bill Swap Rate?
BAs are a niche product used only in the markets of a limited number of Canada’s sovereign peers. For example, Australia’s bank bill facilities are also an important means of extending credit to corporate borrowers. By accepting a drawdown on a bill facility, the bank extends its credit to the borrower and guarantees to repay the holder of the bill at maturity. As in Canada, corporate drawdowns tend to be very short term, typically one month and less. These bill facilities are also committed lines of credit, generally functioning as revolving lines of credit for corporate borrowers.38
Although the bank bill market also underpins Australia’s financial benchmark, the Bank Bill Swap Rate (BBSW), this benchmark represents where banks trade funds between themselves on the interbank market. This differs from the Canadian reference rate, CDOR, which represents where banks offer funds to corporate borrowers with existing BA facilities. Given its financial benchmark status, the BBSW is used as the reference rate for most Australian-dollar derivatives and other contractual payments. As of June 2015, the stock of paper issued and
35 LIBOR currently has five major currencies: the US dollar, euro, British pound sterling, Japanese yen and Swiss franc and serves seven different maturities: overnight, 1 week, 1, 2, 3, 6 and 12 months. 36 The discontinued currencies were the Canadian dollar, New Zealand dollar, Australian dollar, Swedish krona and Danish krone. 37 The Canadian-dollar LIBOR was the average interbank interest rate at which panel banks were prepared to lend unsecured funds in Canadian dollars to one another. See ISDA LIBOR Currency/Maturities Discontinuations – Guidance Note for further information. 38 For more information, see Boge and Wilson (2011).

27
accepted by prime banks (Australia’s major banks) was approximately AU$150 billion. Of this amount, only around 15 per cent (or just over AU$22 billion) was composed of bank bills, while approximately 85 per cent (or just over AU$127 billion) was composed of negotiable certificates of deposits.39 For comparison, BAs in Canada represent close to 65 per cent (or around Can$75 billion) of all corporate money market issuance.
What is the Canadian Dollar Offered Rate–Overnight Index Swap spread? An overnight index swap (OIS) is an interest rate swap whose floating leg is tied to an overnight reference rate (CORRA in Canada) compounded over a specific term. In some jurisdictions, this is an unsecured rate (e.g., UK Sterling Overnight Index Average, SONIA interest rate), whereas in others it is a secured rate (e.g., CORRA in Canada). CORRA is the weighted average of rates on overnight general collateral repo transactions conducted though designated interdealer brokers between 6:00 am and 4:00 pm. The OIS can be used as a guide for market expectations of future monetary policy changes.40 The CDOR-OIS spread essentially isolates the credit component of the CDOR fixing but is closely tied to overall money market conditions.41
A common misunderstanding is that Canadian banks are experiencing funding pressures when the spread between CDOR and OIS widens, but this is not necessarily the case. This interpretation is based on LIBOR-OIS, which has traditionally been used as a measure of the relative strength of the banking sector because LIBOR is generally used as an estimate of where banks believe they can borrow in the unsecured interbank market. Since the recent implementation of the US money market reform, this impact and spread relationship has been significantly altered.42 However, as CDOR is where banks offer their balance sheet to corporate borrowers with existing BA facilities, it incorporates the regulatory costs associated with the facility.
Before the financial crisis, the spread between CDOR and OIS was relatively stable, averaging around 10 basis points. Like LIBOR-OIS, this spread widened during the financial crisis as liquidity decreased and the availability of bank balance sheets was at a premium. As such, this higher lending cost was passed on to corporate borrowers with existing BA facilities because banks were less willing to lend funds. In Canada, the immediate effects of the financial crisis on CDOR were significantly less volatile than those on the US-dollar LIBOR, given the strong credit
39 For more information, see AFMA (2016). 40 Additional information on CORRA and its calculation methodology can be found at Thomson Reuters Canadian Interest Rate Benchmarks. 41 The OIS does not represent a true term rate because it is calculated as the average of daily general collateral rates over a specific term, whereas the CDOR rate has both credit and term premiums embedded. 42 Additional information on the US money market reform can be found on the US Securities and Exchange Commission website, including their 2014-143 press release, SEC Adopts Money Market Fund Reform Rules.

28
standing of the Canadian banks, which had sound risk management, strong capitalization and stable funding sources.43, 44 At its peak, CDOR-OIS widened to around 128 bps, whereas LIBOR-OIS widened to around 364 bps (Chart 7). The Bank of Canada’s response to the financial crisis was to provide extraordinary liquidity directly to financial market participants to stabilize the financial system. For example, the Bank reintroduced term purchase and resale agreements (term PRAs) in September 2008 and within four weeks had injected over $20 billion of term liquidity into the financial system.45
Chart 7: Three-month spread between CDOR, the US-dollar LIBOR and the overnight index swap rate since 2004
Following the crisis, the CDOR-OIS spread drifted higher than its pre-crisis levels, averaging around 30 to 40 basis points (Chart 7). It is theorized that this drift was largely due to the
43 The reduced volatility of CDOR compared with LIBOR during the financial crisis may have also been due to the composition of the submitting banks. Specifically, the CDOR-submitting panel is more homogeneous, mainly consisting of large Canadian institutions that originate more than 90 per cent of BA issuance. In contrast, the LIBOR panel is made up of a diverse set of international institutions. 44 During the financial crisis, Canadian bank equity indexes outperformed comparable European and US bank equity indexes. 45 The Government of Canada introduced other initiatives, including the Insured Mortgage Purchase Program (IMPP). Under the IMPP, the government purchased (through the Canada Mortgage and Housing Corporation) pools of insured residential mortgages from Canadian financial institutions. For a summary of measures taken by the Bank of Canada and the Government of Canada during the financial crisis, see Zorn and Wilkins (2009).
-50
0
50
100
150
200
250
300
350
400
2005 2006 2007 2008 2009 2010 2011 2012 2013 2014 2015 2016 2017 2018
Basis points
Canadian Dollar Offered Rate – overnight index swapsLondon Interbank Offered Rate – overnight index swaps
Last observation: April 2018Source: Bloomberg

29
modestly higher BA offer rates in the secondary market (and therefore CDOR). The higher BA offer rates, and thus CDOR, partly stem from a decreased willingness by dealers to hold BAs in inventory in light of higher HQLA requirements, especially around month- and quarter-end, and the higher regulatory cost of committed facilities. In addition, competition from higher interest deposit alternatives has decreased demand for BA products. Banks have been more willing to offer higher interest deposits to institutional clients, as the deposits have a more favourable regulatory treatment.
The drift higher is also consistent with the widening seen in the spread of CDOR to other money market instruments, such as Government of Canada treasury bills. For example, before the crisis, the spread between 3-month CDOR and treasury bills averaged around 15 bps. This spread has increased to around 35 bps since the crisis (Chart 8). Again, the widening spread is largely believed to be to the result of higher regulatory costs embedded in CDOR and the demand for HQLA (i.e., demand for treasury bills, which are defined as HQLA for regulatory purposes).46
Chart 8: Three-month spread between CDOR and Government of Canada treasury bills and between the LIBOR and US Government Treasury bills, since 2005
46 During the financial crisis, demand for Government of Canada treasury bills increased significantly, owing to the flight to quality by investors. As such, the spread between Government of Canada 3-month treasury bills and 3-month OIS became significantly negative, reaching a low of around -120 basis points in 2008.
-50
0
50
100
150
200
250
300
350
400
450
500
2005 2006 2007 2008 2009 2010 2011 2012 2013 2014 2015 2016 2017 2018
Basis Points
Canadian Dollar Offered Rate -treasury bill ratesLondon Interbank Offered Rate-Treasury bill rates
Last observation: April 2018Source: Bloomberg

30
Products using CDOR as a reference benchmark As of the end of 2017, CDOR was used to determine interest payments on about Can$170 billion in floating-rate notes, payments on about Can$12 trillion in Canadian-dollar interest rate swaps, Can$17 billion in forward-rate agreements, Can$180 billion in basis swaps, around Can$750 billion in BA exchange-traded derivatives and just under Can$90 billion in floating-rate National Housing Act Mortgage-Backed Securities (Chart 9). In total, financial instruments using CDOR as the reference rate were valued at more than Can$13 trillion at the end of 2017.
Chart 9: Products referencing CDOR, Can$ billions
Note: Interest rate swaps and floating-rate agreements outstanding are from the Bank for International
Settlements as of November 2, 2017. Futures on bankers’ acceptances outstanding from Bloomberg as of December 21, 2017. Basis swaps outstanding are from the Depository Trust and Clearing Corporation as of December 15, 2017. Floating-rate notes outstanding are from Bloomberg as of December 21, 2017. Bankers’ acceptances outstanding are from Statistics Canada as of October 2017. Floating-rate NHA Mortgage-Backed Securities outstanding are from the Canada Mortgage and Housing Corporation as of April 2018. No adjustments have been made for double counting, and transactions cleared through a central counterparty clearing house may not be fully captured. Further, CDOR affects a broader range of products not captured in this figure, since all major Canadian banks use derivative products based on CDOR for internal transfer pricing.
Role of the Canadian Dollar Offered Rate in the BAX market A futures contract is a standardized exchange-traded agreement in which two counterparties agree to buy and sell an asset at a set price and date. A BAX contract is a futures contract based on the 3-month CDOR rate for quarterly settlements with a nominal value of Can$1 million. BAX
Interest rate swaps, $12,200
Futures on bankers' acceptances, $752
Floating-rate agreements, $17
Basis swaps, $180
Floating-rate notes, $172
Bankers' acceptances, $83
National Housing Act Mortgage-BackedSecurities, $88

31
futures contracts were the first interest rate contracts to be listed on the Montréal Exchange in April 1988 and are recognized as the standard for Canadian short-term interest rates.47
Three years of quarterly BAX contracts are listed on the exchange at all times. The standard quarterly schedule is March, June, September and December. Trades occur on the exchange between 6:00 and 16:30 ET and are marked to market daily by the central clearer, the Canadian Derivatives Clearing Corporation. The minimum price fluctuations (or tick size) for the 10 nearest listed contract months is 0.005 (1/2 basis point), which equals Can$12.50 per contract. For all other contracts, the minimum price fluctuation is 0.01 (1 basis point), or Can$25.00 per contract.
BAX futures contracts are traded on an index basis. The annualized implied yield, based on a 365-day count, is 100 minus the price of the BAX future. For example, if the March 2018 contracts were offered at $98.54, this would imply an annual yield of 100 – 98.54 = 1.46 per cent. At maturity, this future would cash settle at the 3-month CDOR on that day.
In the futures market, actual payment for the contract is not required because the purchaser posts initial and variation margin for the trade covering the risk of daily profit and loss movements. The profit or loss on the position is represented by the difference between the purchase and sale prices, if sold before expiry, or the difference between the purchase price and the final settlement, if held to expiry. Because these contracts are standardized by the Montréal Exchange, they mature at 10:00 ET two banking days before the third Wednesday of the contract months of March, June, September and December. BAX are cash-settled on expiration at the 3-month CDOR rate on the last trading day at 10:15 ET. Over the life of the contract, the price of the 3-month BAX futures contract converges to the published 3-month CDOR rate at maturity, and the spread between the front BAX contract and the 3-month CDOR rate narrows as the last trading day of the BAX contract draws nearer. BAX are settled on a cash basis (as opposed to physical delivery) when the contract expires.
Since the 2008 crisis, BAX open interest and daily average trades on the Montréal Exchange have steadily increased because of the ease of execution through the electronic trading platforms and favourable derivative treatment for balance sheet purposes. In 2017, an average of around 115,000 BAX futures contracts were traded on the Montréal Exchange daily, with month-end open interest amounting to just under 860,000 contracts (Chart 10).
47 See the Montréal Exchange (2009) or Harvey (1996) for more information on the 3-month banker’s acceptance futures.
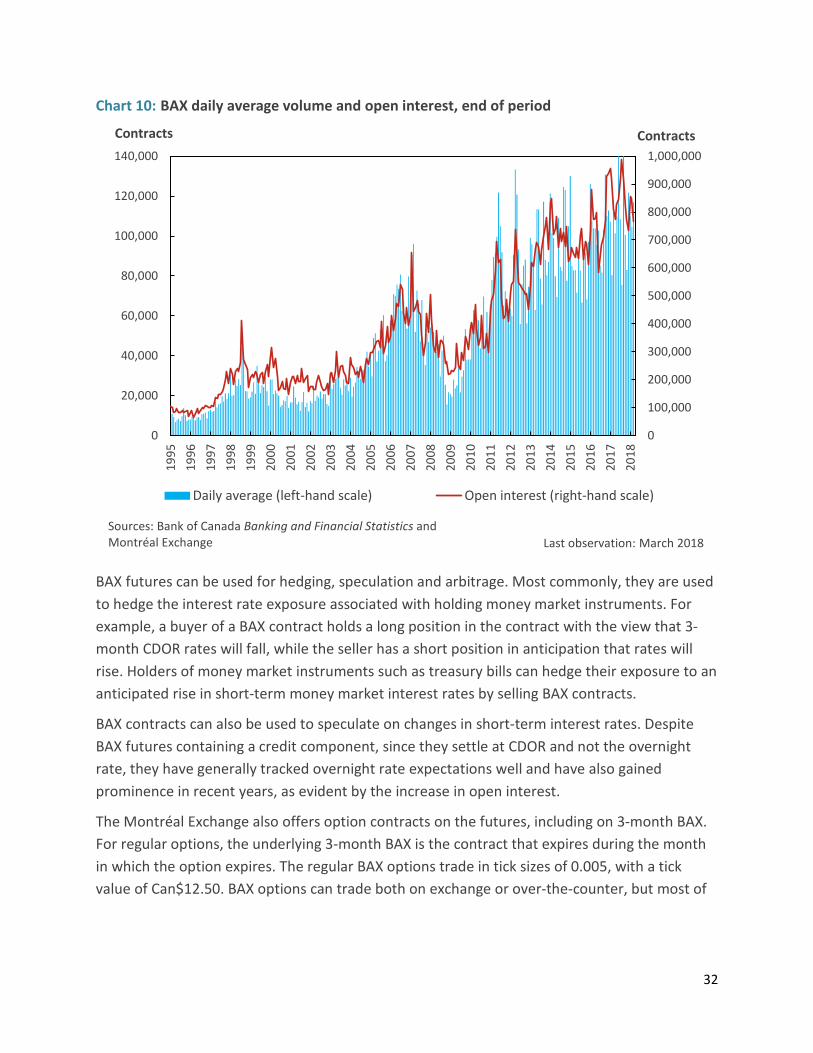
32
Chart 10: BAX daily average volume and open interest, end of period
BAX futures can be used for hedging, speculation and arbitrage. Most commonly, they are used to hedge the interest rate exposure associated with holding money market instruments. For example, a buyer of a BAX contract holds a long position in the contract with the view that 3-month CDOR rates will fall, while the seller has a short position in anticipation that rates will rise. Holders of money market instruments such as treasury bills can hedge their exposure to an anticipated rise in short-term money market interest rates by selling BAX contracts.
BAX contracts can also be used to speculate on changes in short-term interest rates. Despite BAX futures containing a credit component, since they settle at CDOR and not the overnight rate, they have generally tracked overnight rate expectations well and have also gained prominence in recent years, as evident by the increase in open interest.
The Montréal Exchange also offers option contracts on the futures, including on 3-month BAX. For regular options, the underlying 3-month BAX is the contract that expires during the month in which the option expires. The regular BAX options trade in tick sizes of 0.005, with a tick value of Can$12.50. BAX options can trade both on exchange or over-the-counter, but most of
0
100,000
200,000
300,000
400,000
500,000
600,000
700,000
800,000
900,000
1,000,000
0
20,000
40,000
60,000
80,000
100,000
120,000
140,00019
9519
9619
9719
9819
9920
0020
0120
0220
0320
0420
0520
0620
0720
0820
0920
1020
1120
1220
1320
1420
1520
1620
1720
18
ContractsContracts
Daily average (left-hand scale) Open interest (right-hand scale)
Last observation: March 2018Sources: Bank of Canada Banking and Financial Statistics and Montréal Exchange

33
the volume is transacted on the Montréal Exchange. The options are American-type, which means they can be exercised anytime on or before the expiration date.48
Role of the Canadian Dollar Offered Rate in the interest rate swap market An interest rate swap is an over-the-counter derivative agreement between two parties to exchange one stream of cash flows (or interest payments) for another on a specified date with no exchange of principal. CDOR is the interest rate benchmark used for calculating the floating leg of the interest rate swap in Canada. Historically, these contracts were negotiated bilaterally, and swaps were subject to counterparty risk. In recent years, swaps have become largely centrally cleared, with collateral exchanged daily based on market moves, thus reducing counterparty risk.
In a plain “vanilla” Canadian-dollar interest rate swap, a fixed-rate payment is exchanged for a floating-rate payment, which is the 3-month CDOR set at 10:15 ET on the day of the floating reset. Swaps have many purposes, including managing interest rate exposures and speculation. Because this market is global and over-the-counter, surveys such as the semi-annual OTC derivatives statistics by the Bank for International Settlements (BIS) can be used to estimate the size of the market. As of November 2, 2017, Canadian-dollar interest rate swaps outstanding as reported by the BIS were valued at Can$12,200 billion.49
A forward-rate agreement (FRA) is an over-the-counter interest rate contract that is primarily used to hedge against fluctuations in short-term interest rates. FRAs represent an agreement negotiated between two counterparties to exchange a fixed-rate and a floating-rate payment, with the difference in the two amounts exchanged at settlement. Like other over-the-counter products, FRAs involve no exchange of cash up front. The reference rate for the floating side of the FRA is typically the 3-month CDOR. As of November 2, 2017, FRAs in Canadian dollars outstanding, as reported by the BIS, were Can$17 billion.50
The Canadian Dollar Offered Rate basis market Basis swaps can be used to take directional views on CDOR between tenors, or they can transform its payments to other currencies. These swaps allow the exchange of interest rate payments based on two different interest rates and possibly in different currencies (i.e., a floating-for-floating swap). The most commonly used CDOR basis markets in Canada include the Canadian-dollar cross-currency basis between CDOR and LIBOR, the basis between different CDOR tenors, and the CDOR-OIS spread. The basis market allows participants to hedge the basis
48 Additional information on options on 3-month BAX can be found on the Montréal Exchange website. 49 For statistics on interest rate swaps and FRNs, see the BIS semi-annual over-the-counter derivatives statistics, Table 7. 50 Ibid.

34
risk (i.e., the risk that the futures contract will not move in line with that of the underlying asset) or to take a directional view.
Market participants track the CDOR-LIBOR basis spread for cross-currency exposure. In a cross-currency basis swap, two parties initially exchange notional principal denominated in two different currencies and, during the life of the swap, exchange the respective floating interest rate payments to each of the currencies exchanged. For example, in a Canadian-dollar cross-currency basis swap into US dollars (“CAD basis swap”), the floating-rate payments exchanged are based on 3-month CDOR and 3-month LIBOR. Many investors or issuers who have exposures on both sides of the border use this basis for funding and to hedge potential risk. Since the financial crisis, this swap has generally been negative, illustrating an excess demand for US dollars (Chart 11). For example, if the 3-month CAD basis swap is quoted at –35 basis points, the borrower of Canadian-dollar funds will pay CDOR less 35 basis points in exchange for receiving US-dollar LIBOR flat from its US-dollar loan. The basis can shift for technical reasons or because of supply-and-demand dynamics.
Chart 11: Three-month Canadian-dollar cross-currency basis swap
Additionally, market participants may also trade the CDOR basis. A CDOR/CDOR basis swap is another type of floating-for-floating transaction, but the floating legs each reference a different CDOR term. Unlike the Canadian cross-currency basis swaps, no notional principal is exchanged.
-60
-50
-40
-30
-20
-10
0
10
20
Basis points
Last observation: April 2018Source: Bloomberg

35
The most commonly traded basis is the 1-month/3-month CDOR basis (1s3s basis), where the two parties exchange floating payments based on the 1-month and 3-month CDOR. The trade can be done for a specific point in time or for a specific term, with maturities typically quoted by dealers out to 30 years. The 1s3s basis is commonly used to hedge interest rate risk by transforming funding or investment exposures (e.g., funding may be achieved with 3-month CDOR, whereas assets may be tied to 1-month CDOR, creating an additional source of risk). The CDOR-OIS spread is also considered a basis by some participants (see pages 27-29).
Role of CDOR in valuing floating-rate notes Floating-rate notes (FRNs) are bonds that have a variable coupon based on a benchmark reference rate. In Canada, the 3-month CDOR rate is generally used as the reference rate to calculate the variable coupon. One-month and 6-month CDOR rates are also used, but are not as common.
The interest rate usually resets quarterly but is paid out semi-annually. As the coupon is floating, an FRN provides protection to the investor against a rise in interest rates. In Canada, FRNs are typically issued by financial institutions, corporations, and government and quasi-government agencies. As of December 2017, CDOR was used to determine interest payments on about Can$170 billion in floating-rate notes.
Conclusion Introduced to the Canadian marketplace in the early 1960s, BAs are playing an increasingly important role for Canadian corporations whose business underpins the real economy. Since the 1980s, growth of the BA market has continued to trend upward, with the size of the market increasing by nearly 70 per cent since the financial crisis. BAs also account for the largest share of money market instruments issued by non-government entities and are the second-largest money market instrument overall in Canada, averaging just over 25 per cent of the total domestic money market.
BAs are also intrinsically linked to CDOR, which is the rate at which banks are contractually willing to lend cash to corporate borrowers with existing BA facilities. A common misconception is that CDOR is directly comparable with LIBOR; however, this is not the case. CDOR represents a bank’s committed lending rate, whereas LIBOR represents the bank’s borrowing rate. CDOR is an integral part of the Canadian financial market landscape, with over-the-counter interest rate swaps, most floating-rate products and BAX futures using this rate for reset or as a reference rate. The Canadian BA market and CDOR are important parts of the monetary policy transfer mechanism for the real economy. As such, the Bank will continue to monitor and evaluate the market attributes of both.
36
Literature Cited Australian Financial Markets Association (AFMA). 2016. “A Guide to the Bank Bill Swap (BBSW) Benchmark Rate.” September.
Boge, M. and I. Wilson. 2011. “The Domestic Market for Short-term Debt Securities.” Reserve Bank of Australia Bulletin (September Quarter): 39–48.
Harvey, N. 1996. “The Market for Futures Contracts on Canadian Bankers’ Acceptances.” Bank of Canada Review (Autumn): 19–36.
International Organization of Securities Commissions (IOSCO). 2013. “Principles for Financial Benchmarks, Final Report.” July.
Investment Industry Regulatory Organization of Canada (IIROC). 2013. “IIROC Review of CDOR Supervisory Practices.” IIROC Notice. January 10.
———. 2014. “IIROC Publishes New Industry-Developed Code of Conduct for CDOR Submission.” IIROC News Release. June 2.
Investment Dealers Association of Canada (IDA). 1998. “IDA Report.” Summer. Available at http://www.iiroc.ca/Documents/1998/3DDD16CF-2633-4A4E-AA19-9309A0CB3467_en.pdf#search=CDOR.
Lane, T. 2014. “Financial Benchmarks: A Question of Trust” (speech to Osgoode Hall Law School and Schulich School of Business, Toronto, March 24).
Merrett, D. 1981. “The Evolution of Bankers Acceptances in Canada.” Bank of Canada Review (October).
Montréal Exchange. 2009.“BAX Three-Month Canadian Bankers’ Acceptance Futures,” BAX descriptive brochure. Available at https://www.m-x.ca/f_publications_en/bax_en.pdf.
———. “Options on Three-Month Canadian Bankers’ Acceptance Futures.” Available at https://www.m-x.ca/produits_taux_int_obx_en.php.
Office of the Superintendent of Financial Institutions (OSFI). 2014. “Oversight of CDOR Benchmark Setting Submissions.” January 13.
Thomson Reuters. 2018a. “Methodology: Canadian Dollar Offered Rate (CDOR).” January 8.
———. 2018b. “Canadian Dollar Offered Rate (CDOR) Administrator Code of Conduct.” and “Canadian Dollar Offered Rate (CDOR) Submitter Code of Conduct.” January.

37
Thorn, T. and H. Vikstedt. 2014. “Reforming Financial Benchmarks: An International Perspective.” Bank of Canada Financial System Review (June): 45–51.
Truno, M., A. Stolyarov, D. Auger and M. Assaf. 2017. “Wholesale Funding of the Big Six Canadian Banks.” Bank of Canada Review (Spring): 42–55.
Wheatley, M. 2012. “The Wheatley Review of LIBOR: Final Report.” September.
Zorn, L. and C. Wilkins. 2009. “Bank of Canada Liquidity Actions in Response to the Financial Market Turmoil.” Bank of Canada Review (Autumn): 3–22.