A Primer for State Policy MakersLawful permanent residents are granted admission for permanent...
32
| JUNE 2018 U.S. Immigration A Primer for State Policy Makers
Transcript of A Primer for State Policy MakersLawful permanent residents are granted admission for permanent...

| JUNE 2018
U.S. ImmigrationA Primer for State Policy Makers

v NATIONAL CONFERENCE OF STATE LEGISLATURES
BY ANN MORSE
U.S. ImmigrationA Primer for State Policy Makers
NATIONAL CONFERENCE OF STATE LEGISLATURES © 2018
The National Conference of State Legislatures is the bipartisan organization dedicated to serving the lawmakers and staffs of the nation’s 50 states, its commonwealths and territories.
NCSL provides research, technical assistance and opportunities for policymakers to exchange ideas on the most pressing state issues, and is an effective and respected advocate for the interests of the states in the American federal system. Its objectives are:
• Improve the quality and effectiveness of state legislatures
• Promote policy innovation and communication among state legislatures
• Ensure state legislatures a strong, cohesive voice in the federal system
The conference operates from offices in Denver, Colorado and Washington, D.C.
NATIONAL CONFERENCE OF STATE LEGISLATURES vi
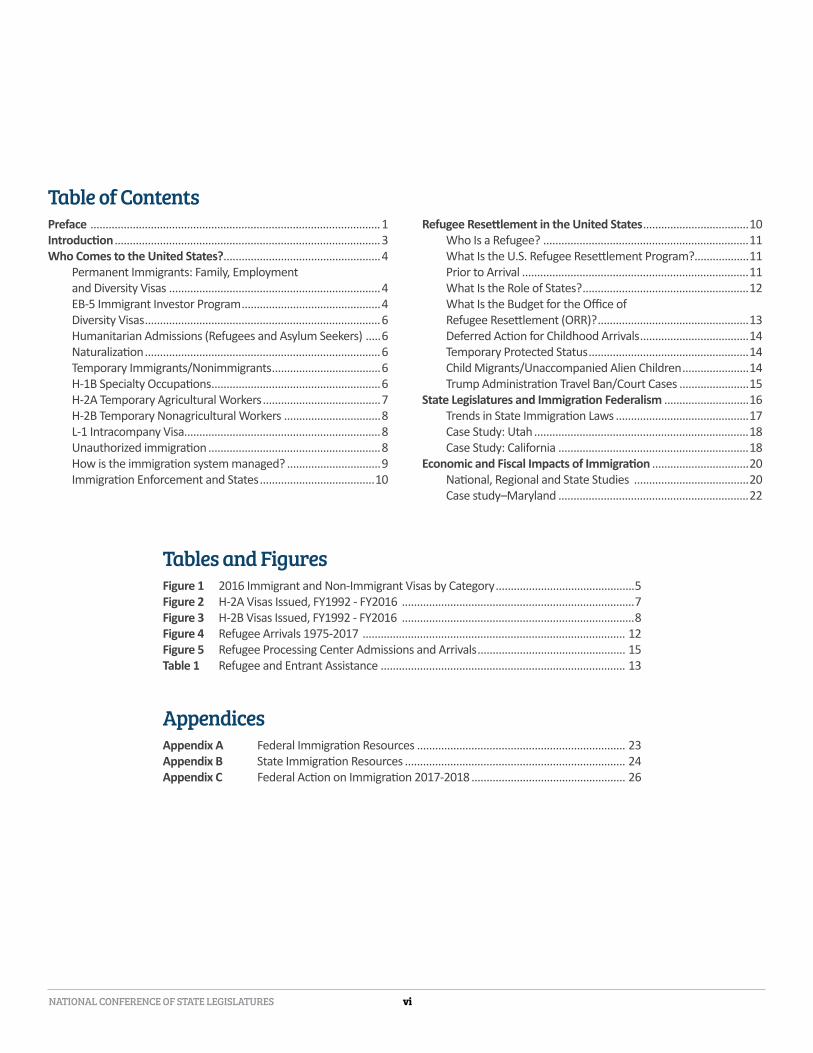
Table of ContentsPreface ................................................................................................1Introduction ........................................................................................3Who Comes to the United States? ....................................................4 Permanent Immigrants: Family, Employment and Diversity Visas ......................................................................4 EB-5 Immigrant Investor Program ..............................................4 Diversity Visas ..............................................................................6 Humanitarian Admissions (Refugees and Asylum Seekers) .....6 Naturalization ..............................................................................6 Temporary Immigrants/Nonimmigrants ....................................6 H-1B Specialty Occupations ........................................................6 H-2A Temporary Agricultural Workers .......................................7 H-2B Temporary Nonagricultural Workers ................................8 L-1 Intracompany Visa.................................................................8 Unauthorized immigration .........................................................8 How is the immigration system managed? ...............................9 Immigration Enforcement and States ......................................10
Refugee Resettlement in the United States ...................................10 Who Is a Refugee? ....................................................................11 What Is the U.S. Refugee Resettlement Program?..................11 Prior to Arrival ...........................................................................11 What Is the Role of States? .......................................................12 What Is the Budget for the Office of Refugee Resettlement (ORR)? ..................................................13 Deferred Action for Childhood Arrivals ....................................14 Temporary Protected Status .....................................................14 Child Migrants/Unaccompanied Alien Children ......................14 Trump Administration Travel Ban/Court Cases .......................15State Legislatures and Immigration Federalism ............................16 Trends in State Immigration Laws ............................................17 Case Study: Utah .......................................................................18 Case Study: California ...............................................................18Economic and Fiscal Impacts of Immigration ................................20 National, Regional and State Studies ......................................20 Case study–Maryland ...............................................................22
Tables and FiguresFigure 1 2016 Immigrant and Non-Immigrant Visas by Category ..............................................5Figure 2 H-2A Visas Issued, FY1992 - FY2016 .............................................................................7Figure 3 H-2B Visas Issued, FY1992 - FY2016 .............................................................................8Figure 4 Refugee Arrivals 1975-2017 ....................................................................................... 12Figure 5 Refugee Processing Center Admissions and Arrivals ................................................. 15Table 1 Refugee and Entrant Assistance ................................................................................. 13
AppendicesAppendix A Federal Immigration Resources ..................................................................... 23Appendix B State Immigration Resources ......................................................................... 24Appendix C Federal Action on Immigration 2017-2018 ................................................... 26
1 NATIONAL CONFERENCE OF STATE LEGISLATURES
Preface This primer for policymakers is intended to provide a clear and concise introduction to current immigra-tion and refugee policy, trends in state immigration legislation, and key studies that seek to assess fiscal and economic impacts of immigrants in the United States.
Immigration policy remains in flux. Since January 2017, the Trump administration has issued many execu-tive orders and policy changes related to immigrants, refugees and foreign visitors. Several of these chang-es are under review by the courts. In Congress, 771 immigration-related bills have been introduced.
On the horizon:• The Supreme Court of the United States is expected to rule by the
end of June on the administration’s third version of the travel ban to the U. S., and the Hawaii and Maryland appeals.
• The House is poised to vote on several immigration bills, including border enforcement, Deferred Action for Childhood Arrivals, and the attorney general’s recent announcement of a “zero tolerance” poli-cy of criminal illegal entry, leading to the separation of children from parents at the U.S.-Mexico border.
• The administration issued an executive order addressing family sep-aration, expected to draw legal challenges and require future legisla-tive action.
Whatever the results of the Supreme Court’s decision, congressional leg-islation, or administrative action, state policymakers continue to seek bipartisan, pragmatic solutions to immigration challenges, recognizing the contributions of immigrants and working together to ensure safe communities.
“States are coming up with innovative ways to address immigration is-sues—in education, health care, and economic development—that the federal government can learn from to improve our immigration system.” -Senator René García (R-Fla.), co-chair NCSL Task Force on Immigration and the States
“States see the role immigrants can play in their economies and are able to find common ground in devel-oping local solutions. Ultimately, federal action is needed, and inaction has costs.” -Senator Mo Denis (D-Nev.), co-chair NCSL Task Force on Immigration and the States
This publication was made possible by the generous support of the John D. and Catherine T. MacArthur Foundation.
For more information on immigration and refugee issues, visit www.ncsl.org/immig.
Whatever the results of the Supreme Court’s decision, congressional legislation, or administrative action, state policymakers continue to seek bipartisan, pragmatic solutions to immigration challenges, recognizing the contributions of immigrants and working together to ensure safe communities.


3 NATIONAL CONFERENCE OF STATE LEGISLATURES
IntroductionImmigration is a federal responsibility, set out in the U.S. Constitution under the power of Congress to “es-tablish a uniform rule of naturalization.” It is governed by the president, five executive agencies, and U.S. Supreme Court decisions. In brief, federal immigration law sets the parameters for who and how many foreign-born people can enter the U.S., and the conditions for their work and residence.
State and local governments develop policies that affect immigrants af-ter their arrival, working with federal partners in areas such as refugee resettlement and immigration enforcement, and assisting immigrants in becoming integrated into the nation’s social, political and economic life. State legislatures consider more than 1,200 bills each year related to im-migrants, and on average enact 200 laws relating to budgets, education, employment, driver’s licenses, health and human services, human traf-ficking, and law enforcement.
As federal policymakers debate reform of the U.S. immigration system, common ground and practical lessons can be found at the state level. States have made decisions about eligibility for benefits such as in-state tuition and driver’s licenses, entered into partnerships on criminal immi-gration enforcement and employment verification with the Department of Homeland Security (DHS), and created streamlined paths for profes-sional licenses for immigrant professionals in demand.
This issue brief provides a concise introduction to the U.S. immigration system of permanent, temporary and humanitarian arrivals, as well as unauthorized immigration. Sec-tions cover legal immigration, refugee resettlement, economic and fiscal impacts, and state level demo-graphics and legislation.
Immigration is a growing, global phenomenon, with an estimated 258 million migrants worldwide (3.4 percent of the global population). In the U.S., 42 million of the nation’s 322 million are foreign-born, about one in eight people.
NATIONAL CONFERENCE OF STATE LEGISLATURES 4
Who Comes to the United States?In FY 2016, almost 1.2 million foreign nationals were admitted to the U.S. as lawful permanent residents. The visa allocation was approximately 68 percent for family visas, 12 percent for employment visas, 10 percent for humanitarian reasons (refugees), 4 percent for diversity visas and 6 percent other.
Immigrants comprise about 13 percent of the U.S. population, or 42 million people out of the total U.S. population of 322 million. Almost one-half are naturalized citizens, 30 percent are lawful permanent resi-dents, and 20 percent are unauthorized immigrants.
In 2016, nearly half of immigrants reported their race as white (46 percent), one fourth as Asian (27 per-cent), black (9 percent), other (15 percent) and two or more races (2 percent).
Permanent Immigrants: Family, Employment and Diversity VisasLawful permanent residents are granted admission for permanent residence to the U.S. on the basis of family relation or job skill. A worldwide limit of 675,000 visas is allowed annually for family (480,000), em-ployment (140,000) and diversity visas (55,000). All applicants must meet U.S. admission requirements. Applicants for permanent immigration are limited by country ceilings. A maximum of 7 percent of the to-tal visas can be issued to a single country each year.
U.S. citizens or lawful permanent residents can sponsor family members to join them in the U.S. The ceil-ing for family admissions is 480,000, though an unlimited number of visas are available for immediate family (spouses, parents and minor children.) Since it is possible for immediate family members to use all the available visas, 226,000 visas are reserved for other family members, such as adult children, mean-ing the 480,000 is a “pierceable” cap. Sponsors must submit a legally enforceable affidavit demonstrating they can support their family and the sponsored relative at 125 percent of the federal poverty level.
Employers may petition to bring individuals with special skills into the U.S., at a yearly limit of 140,000. There are five preferences for permanent employment visas: • First: 40,000 visas for priority workers with “extraordinary” or “outstanding” ability in certain fields
(arts, science, education, business or athletics). • Second: 40,000 visas for persons with advanced degrees or “exceptional” abilities in sciences, art or
business. • Third: 40,000 visas for skilled shortage workers.• Fourth: 10,000 visas for “special” immigrants, including religious workers. • Fifth: 10,000 investor visas (known as EB-5).
EB-5 Immigrant Investor ProgramThe Immigrant Investor program was created under the Immigration Act of 1990 to help attract foreign investment and support job creation in rural or high unemployment areas. Foreign investors can earn per-manent residence after two years if they invest a minimum of $1 million, or $500,000 in a targeted em-ployment area (TEA), and create or preserve at least 10 jobs for U.S. workers.
A new investment option was created in 1993—the EB-5 Regional Center. Rather than creating a new business or taking over a troubled business, visa applicants can invest in a pre-approved third party-man-aged investment vehicle. The regional center can pool EB-5 foreign investment with other foreign and do-mestic investments. The foreign investor pays fees to the Regional Center for travel, legal fees and com-missions. The majority of EB-5 investments are now made in TEAs through Regional Centers. Job creation was redefined to include indirect jobs in addition to direct jobs.
EB-5 visas are capped at 10,000 per year. About 80 percent of investors come from four countries: China, South Korea, Taiwan and the United Kingdom. Others have come from Canada, India, Mexico, Iran, and Japan. Investors may bring their spouses and children under 21 to live, work and study in the U.S. Family members count against the cap.
5 NATIONAL CONFERENCE OF STATE LEGISLATURES
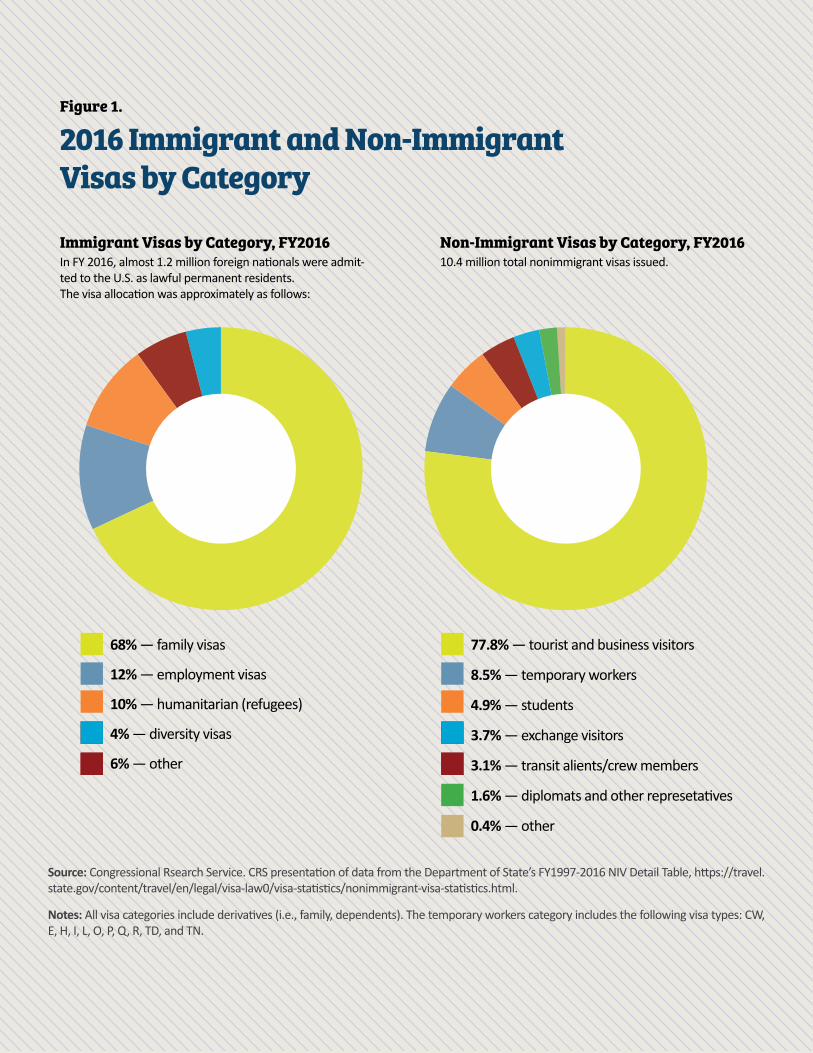
Immigrant Visas by Category, FY2016In FY 2016, almost 1.2 million foreign nationals were admit-ted to the U.S. as lawful permanent residents. The visa allocation was approximately as follows:
Non-Immigrant Visas by Category, FY201610.4 million total nonimmigrant visas issued.
Source: Congressional Rsearch Service. CRS presentation of data from the Department of State’s FY1997-2016 NIV Detail Table, https://travel.state.gov/content/travel/en/legal/visa-law0/visa-statistics/nonimmigrant-visa-statistics.html.
Notes: All visa categories include derivatives (i.e., family, dependents). The temporary workers category includes the following visa types: CW, E, H, I, L, O, P, Q, R, TD, and TN.
68% — family visas
12% — employment visas
10% — humanitarian (refugees)
4% — diversity visas
6% — other
77.8% — tourist and business visitors
8.5% — temporary workers
4.9% — students
3.7% — exchange visitors
3.1% — transit alients/crew members
1.6% — diplomats and other represetatives
0.4% — other
Figure 1.
2016 Immigrant and Non-Immigrant Visas by Category
NATIONAL CONFERENCE OF STATE LEGISLATURES 6
Diversity VisasThe U.S. also offers 55,000 “diversity” visas each year for individuals in countries that send few immi-grants. Applicants must have a high school education or two years of work experience in the last five years. In 2017, 19 million applications were received, double that of a decade ago, according to the Pew Research Center. Visas are granted by a lottery system, with about 20,000 visas granted to residents of Eu-rope and about 20,000 to residents of Africa. Applicants must meet U.S. admission requirements.
Humanitarian Admissions (Refugees and Asylum Seekers) Refugees seek admission to the United States to flee persecution, and apply outside of the U.S. For exam-ple, applicants for asylum apply at the port of entry or after they’ve entered the U.S.
The president, in consultation with Congress, sets the ceiling for refugee visas each year. The FY 2017 ceil-ing is 45,000, down from 110,000 in 2016. The number of refugees admitted in FY 2015 was 69,933. In 2015, individuals granted asylum totaled 26,124.
Refugees must apply for legal permanent residency after one year’s residence. Those granted asylum may apply for legal permanent residency after one year’s residence.
NaturalizationLegal permanent residents may become naturalized citizens after five years of residence. They must demonstrate good moral character and knowledge of English and U.S. history and civics. Each year, the U.S. naturalizes about 700,000-750,000 immigrants.
Temporary Immigrants/NonimmigrantsTemporary immigrants, known as “nonimmigrants” in U.S. law, are those allowed to enter the United States for a specific purpose, and for a temporary or limited time, and unless specifically authorized, are not permitted to work in the U.S. Nonimmigrant visas are issued for 87 subcategories within 24 major cat-egories, including short-term visitors (tourists), students, business visitors, diplomats, and temporary agri-cultural and nonagricultural workers.
In 2016, the U.S. Department of State issued 10.4 million nonimmigrant visas. The largest groups included 8 million tourism and business visas, 883,000 temporary workers, 513,000 students, and 380,000 cultural exchange visitors. Descriptions of some of the major temporary worker visas are below.
H-1B Specialty OccupationsU.S. employers can hire highly educated foreign professionals in specialty occupations, often math, engi-neering or technology, by applying for H-1B visas. The foreign worker must possess at least a bachelor’s degree or its equivalent and state licensure, if required to practice in that field. H-1B work-authorization is limited to employment by the sponsoring employer. These visas are capped at 85,000 visas per year. Con-gress created an exemption for those with a U.S. master’s degree or higher of an additional 20,000 visas. In 2017, the U.S. Citizen and Immigration Services (USCIS) received 199,000 applications in the first five days of the filing period. Visas are granted by a computer-generated random selection process, or “lot-tery” system.
7 NATIONAL CONFERENCE OF STATE LEGISLATURES
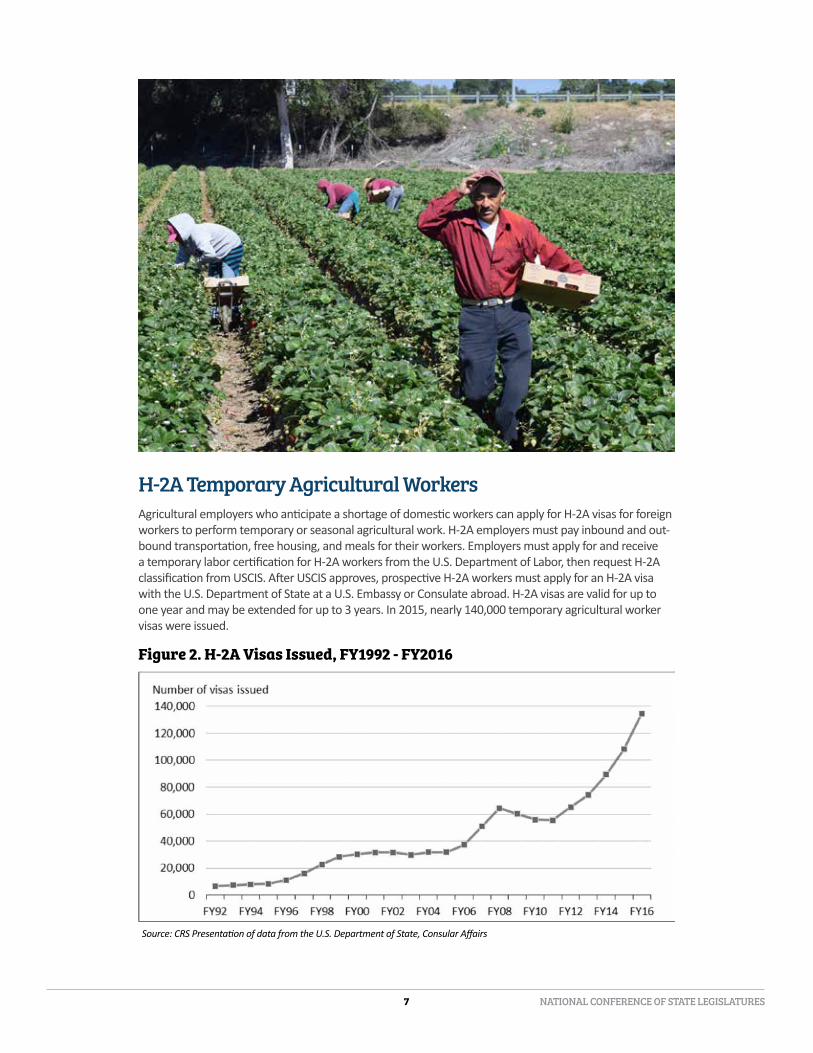
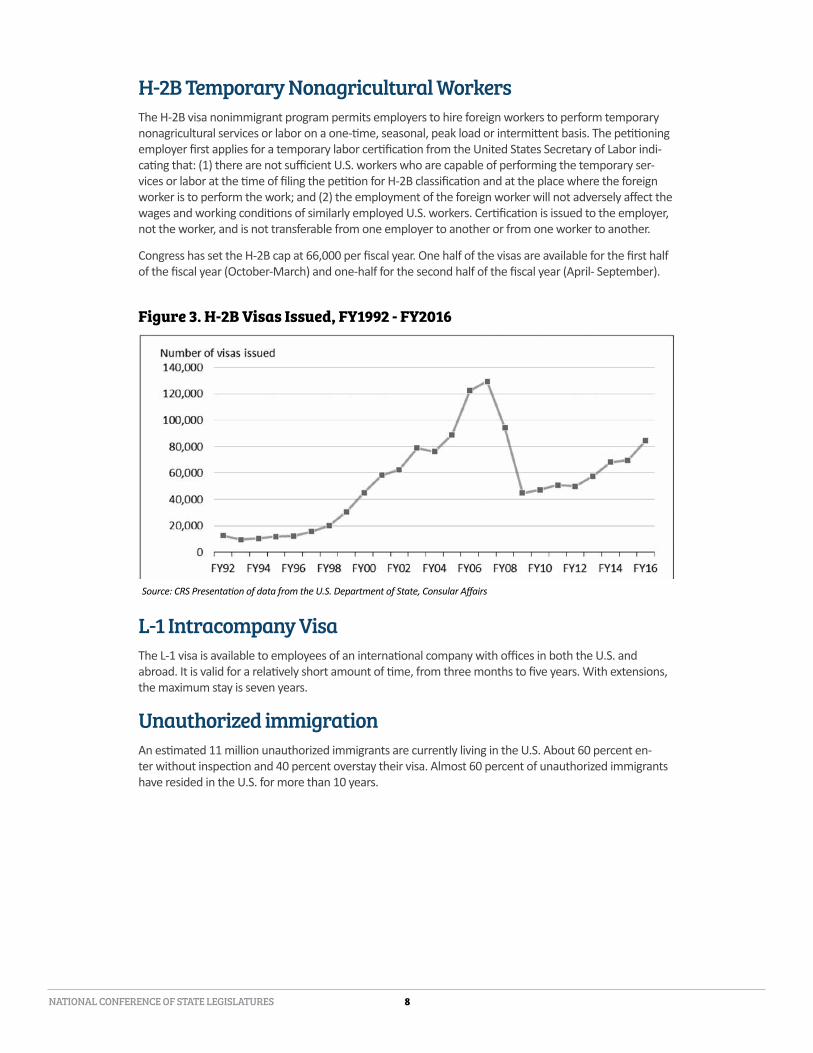
H-2A Temporary Agricultural WorkersAgricultural employers who anticipate a shortage of domestic workers can apply for H-2A visas for foreign workers to perform temporary or seasonal agricultural work. H-2A employers must pay inbound and out-bound transportation, free housing, and meals for their workers. Employers must apply for and receive a temporary labor certification for H-2A workers from the U.S. Department of Labor, then request H-2A classification from USCIS. After USCIS approves, prospective H-2A workers must apply for an H-2A visa with the U.S. Department of State at a U.S. Embassy or Consulate abroad. H-2A visas are valid for up to one year and may be extended for up to 3 years. In 2015, nearly 140,000 temporary agricultural worker visas were issued.
Figure 2. H-2A Visas Issued, FY1992 - FY2016
Source: CRS Presentation of data from the U.S. Department of State, Consular Affairs
NATIONAL CONFERENCE OF STATE LEGISLATURES 8
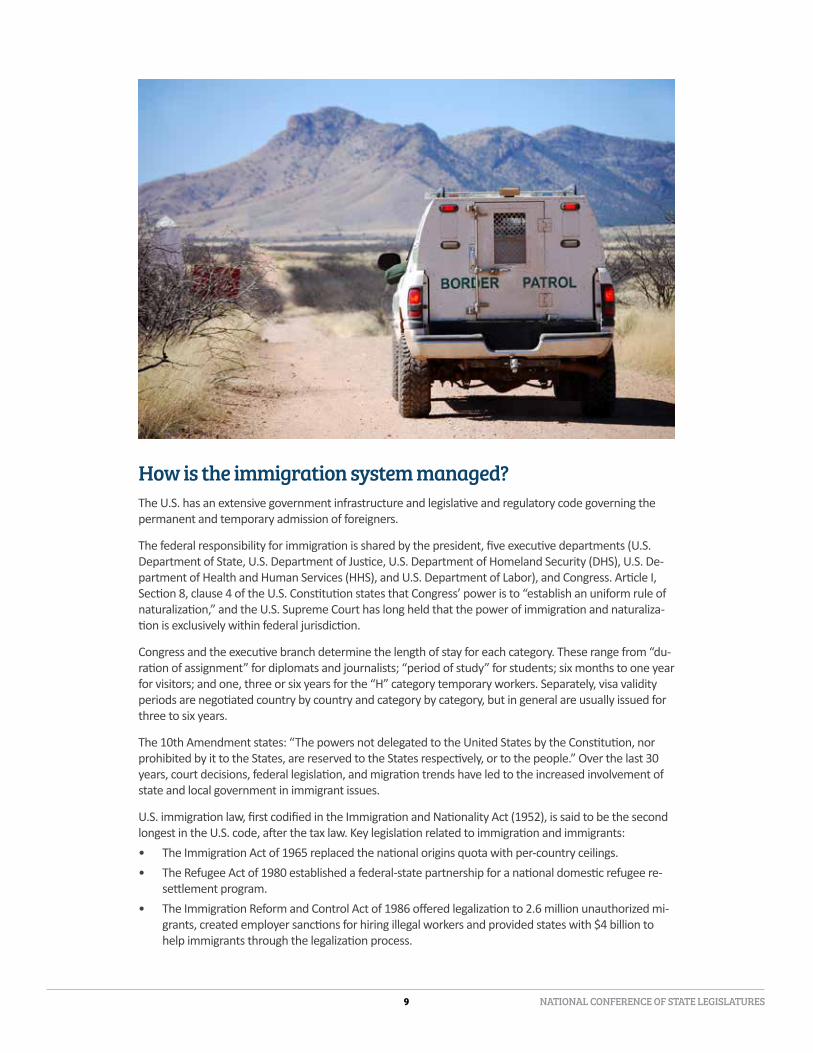
H-2B Temporary Nonagricultural WorkersThe H-2B visa nonimmigrant program permits employers to hire foreign workers to perform temporary nonagricultural services or labor on a one-time, seasonal, peak load or intermittent basis. The petitioning employer first applies for a temporary labor certification from the United States Secretary of Labor indi-cating that: (1) there are not sufficient U.S. workers who are capable of performing the temporary ser-vices or labor at the time of filing the petition for H-2B classification and at the place where the foreign worker is to perform the work; and (2) the employment of the foreign worker will not adversely affect the wages and working conditions of similarly employed U.S. workers. Certification is issued to the employer, not the worker, and is not transferable from one employer to another or from one worker to another.
Congress has set the H-2B cap at 66,000 per fiscal year. One half of the visas are available for the first half of the fiscal year (October-March) and one-half for the second half of the fiscal year (April- September).
Figure 3. H-2B Visas Issued, FY1992 - FY2016
Source: CRS Presentation of data from the U.S. Department of State, Consular Affairs
L-1 Intracompany VisaThe L-1 visa is available to employees of an international company with offices in both the U.S. and abroad. It is valid for a relatively short amount of time, from three months to five years. With extensions, the maximum stay is seven years.
Unauthorized immigrationAn estimated 11 million unauthorized immigrants are currently living in the U.S. About 60 percent en-ter without inspection and 40 percent overstay their visa. Almost 60 percent of unauthorized immigrants have resided in the U.S. for more than 10 years.
9 NATIONAL CONFERENCE OF STATE LEGISLATURES
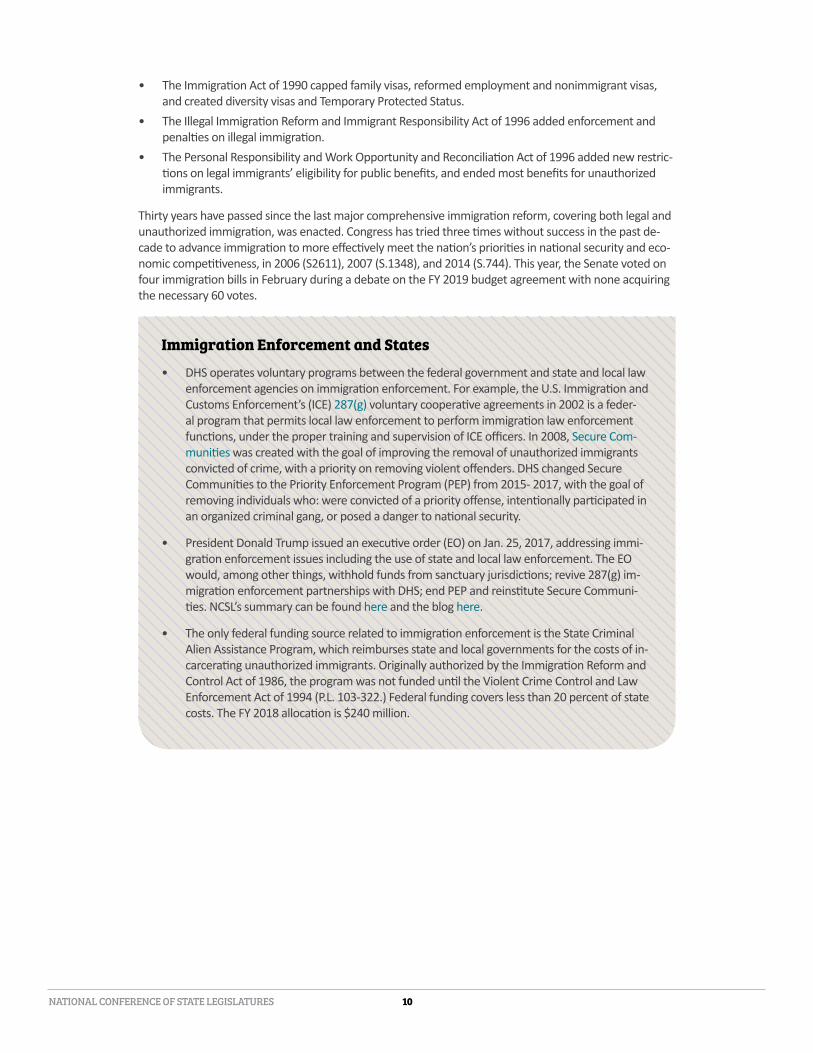
How is the immigration system managed?The U.S. has an extensive government infrastructure and legislative and regulatory code governing the permanent and temporary admission of foreigners.
The federal responsibility for immigration is shared by the president, five executive departments (U.S. Department of State, U.S. Department of Justice, U.S. Department of Homeland Security (DHS), U.S. De-partment of Health and Human Services (HHS), and U.S. Department of Labor), and Congress. Article I, Section 8, clause 4 of the U.S. Constitution states that Congress’ power is to “establish an uniform rule of naturalization,” and the U.S. Supreme Court has long held that the power of immigration and naturaliza-tion is exclusively within federal jurisdiction.
Congress and the executive branch determine the length of stay for each category. These range from “du-ration of assignment” for diplomats and journalists; “period of study” for students; six months to one year for visitors; and one, three or six years for the “H” category temporary workers. Separately, visa validity periods are negotiated country by country and category by category, but in general are usually issued for three to six years.
The 10th Amendment states: “The powers not delegated to the United States by the Constitution, nor prohibited by it to the States, are reserved to the States respectively, or to the people.” Over the last 30 years, court decisions, federal legislation, and migration trends have led to the increased involvement of state and local government in immigrant issues.
U.S. immigration law, first codified in the Immigration and Nationality Act (1952), is said to be the second longest in the U.S. code, after the tax law. Key legislation related to immigration and immigrants: • The Immigration Act of 1965 replaced the national origins quota with per-country ceilings. • The Refugee Act of 1980 established a federal-state partnership for a national domestic refugee re-
settlement program. • The Immigration Reform and Control Act of 1986 offered legalization to 2.6 million unauthorized mi-
grants, created employer sanctions for hiring illegal workers and provided states with $4 billion to help immigrants through the legalization process.
NATIONAL CONFERENCE OF STATE LEGISLATURES 10
• The Immigration Act of 1990 capped family visas, reformed employment and nonimmigrant visas, and created diversity visas and Temporary Protected Status.
• The Illegal Immigration Reform and Immigrant Responsibility Act of 1996 added enforcement and penalties on illegal immigration.
• The Personal Responsibility and Work Opportunity and Reconciliation Act of 1996 added new restric-tions on legal immigrants’ eligibility for public benefits, and ended most benefits for unauthorized immigrants.
Thirty years have passed since the last major comprehensive immigration reform, covering both legal and unauthorized immigration, was enacted. Congress has tried three times without success in the past de-cade to advance immigration to more effectively meet the nation’s priorities in national security and eco-nomic competitiveness, in 2006 (S2611), 2007 (S.1348), and 2014 (S.744). This year, the Senate voted on four immigration bills in February during a debate on the FY 2019 budget agreement with none acquiring the necessary 60 votes.
Immigration Enforcement and States
• DHS operates voluntary programs between the federal government and state and local law enforcement agencies on immigration enforcement. For example, the U.S. Immigration and Customs Enforcement’s (ICE) 287(g) voluntary cooperative agreements in 2002 is a feder-al program that permits local law enforcement to perform immigration law enforcement functions, under the proper training and supervision of ICE officers. In 2008, Secure Com-munities was created with the goal of improving the removal of unauthorized immigrants convicted of crime, with a priority on removing violent offenders. DHS changed Secure Communities to the Priority Enforcement Program (PEP) from 2015- 2017, with the goal of removing individuals who: were convicted of a priority offense, intentionally participated in an organized criminal gang, or posed a danger to national security.
• President Donald Trump issued an executive order (EO) on Jan. 25, 2017, addressing immi-gration enforcement issues including the use of state and local law enforcement. The EO would, among other things, withhold funds from sanctuary jurisdictions; revive 287(g) im-migration enforcement partnerships with DHS; end PEP and reinstitute Secure Communi-ties. NCSL’s summary can be found here and the blog here.
• The only federal funding source related to immigration enforcement is the State Criminal Alien Assistance Program, which reimburses state and local governments for the costs of in-carcerating unauthorized immigrants. Originally authorized by the Immigration Reform and Control Act of 1986, the program was not funded until the Violent Crime Control and Law Enforcement Act of 1994 (P.L. 103-322.) Federal funding covers less than 20 percent of state costs. The FY 2018 allocation is $240 million.
11 NATIONAL CONFERENCE OF STATE LEGISLATURES
Refugee Resettlement in the United StatesWho Is a Refugee?A refugee is defined by the Immigration and Nationality Act as any person outside his or her country who has a “well-founded fear of persecution on account of race, religion, nationality, membership in a particu-lar social group, or political opinion.”
What Is the U.S. Refugee Resettlement Program?Congress established the U.S. refugee resettlement program through the Refugee Act of 1980, primari-ly to provide refuge to those fleeing communism in Russia and Southeast Asia, later expanding to other regions. The program was created as a partnership with state government and nonprofit resettlement agencies to provide cash, medical and social services until refugees became self-sufficient in their new communities.
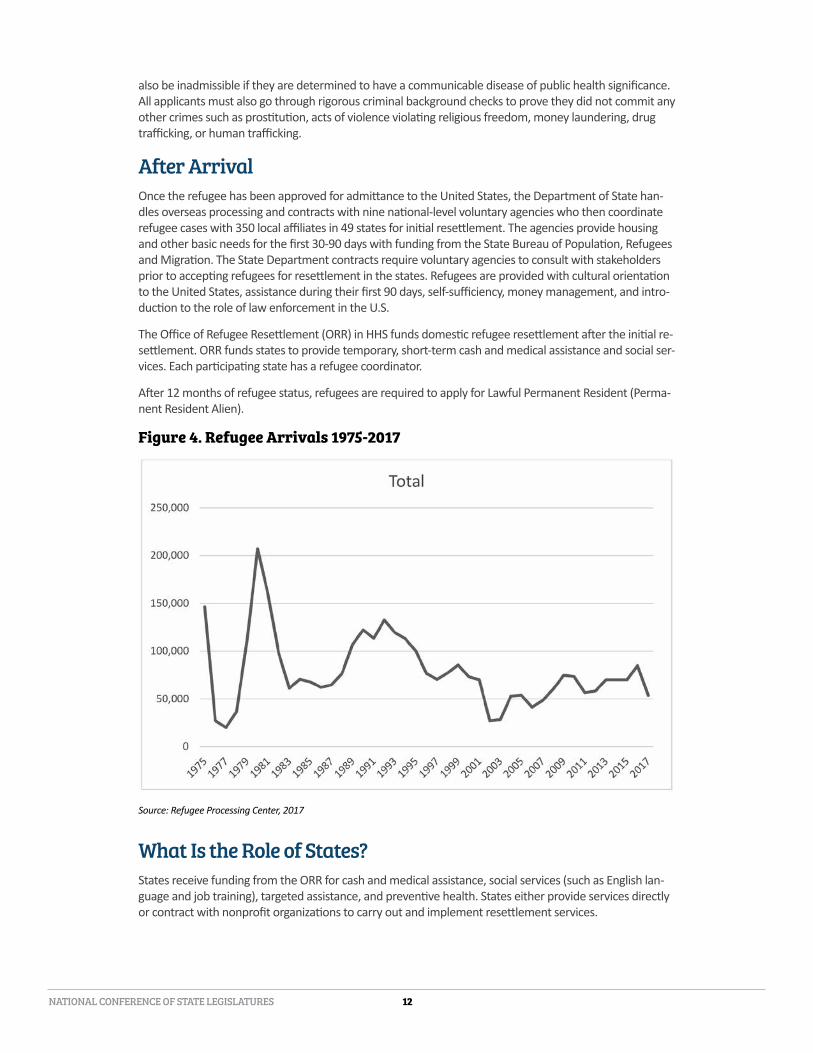
The president sets an annual refugee ceiling in consultation with Congress. The admissions ceiling for the past decade has ranged from 70,000-80,000. Since the U.S. began accepting refugees in 1975, through 2017, the last full fiscal year, the average number of refugees admitted was 78,865.
The Trump administration set the refugee admission limit for FY 2018 to just 45,000, a decrease of 40,000 from FY 2016 and 5,000 from FY 2017. Refugee admissions have declined dramatically under the Trump administration, falling from 39,098 admitted as of March 2017 to just 10,550 admitted as of March 2018.
Forty-nine states participate in the refugee resettlement program to assist those fleeing persecution to become self-sufficient and integrated into their adopted communities.
Prior to ArrivalMore than 60 million people are displaced from their homes because of war or persecution. The resettle-ment program is available to less than 1 percent of refugees per year. The U.S. is the leading resettlement country in the world, with 29 other countries participating.
The United Nations High Commissioner for Refugees (UNHCR) reviews applications from around the world, registers individuals as refugees and selects for resettlement the most vulnerable refugees who will be unable to return home, such as women head of households, and victims of violence and torture.
Of refugees accepted by the U.S., 75 percent are referred by UNHCR and another 25 percent are direct petition, such as Iraqis who served with the U.S. military.
Once they are referred by UNHCR, DHS must conduct criminal and medical background checks, all while the refugee is still overseas or out of the country. This process is overseen by USCIS. The screening is con-ducted by the National Counterterrorism Center and the Federal Bureau of Investigation and takes an av-erage of 18 months to complete. Refugees are subjected to the highest level of security check of any trav-eler to the U.S.
State Department contractors conduct direct interviews with the refugee family to determine: 1) is this family principle applicant eligible under U.S. law based on one of five protected grounds: race, religion, nationality, membership in a particular social group, or political opinion; and 2) is this person admissible under U.S. law.
Refugees can be barred from entering the U.S. on medical grounds, criminal background, national security reasons, or potential to become a public charge (Section 212 of the Immigration and Nationality Act). Ref-ugees are inadmissible if they have contributed money, intelligence, or any other support to any terrorist organization or they themselves have been members of a terrorist organization. Refugee applicants can
NATIONAL CONFERENCE OF STATE LEGISLATURES 12
also be inadmissible if they are determined to have a communicable disease of public health significance. All applicants must also go through rigorous criminal background checks to prove they did not commit any other crimes such as prostitution, acts of violence violating religious freedom, money laundering, drug trafficking, or human trafficking.
After ArrivalOnce the refugee has been approved for admittance to the United States, the Department of State han-dles overseas processing and contracts with nine national-level voluntary agencies who then coordinate refugee cases with 350 local affiliates in 49 states for initial resettlement. The agencies provide housing and other basic needs for the first 30-90 days with funding from the State Bureau of Population, Refugees and Migration. The State Department contracts require voluntary agencies to consult with stakeholders prior to accepting refugees for resettlement in the states. Refugees are provided with cultural orientation to the United States, assistance during their first 90 days, self-sufficiency, money management, and intro-duction to the role of law enforcement in the U.S.
The Office of Refugee Resettlement (ORR) in HHS funds domestic refugee resettlement after the initial re-settlement. ORR funds states to provide temporary, short-term cash and medical assistance and social ser-vices. Each participating state has a refugee coordinator.
After 12 months of refugee status, refugees are required to apply for Lawful Permanent Resident (Perma-nent Resident Alien).
Figure 4. Refugee Arrivals 1975-2017
Source: Refugee Processing Center, 2017
What Is the Role of States?States receive funding from the ORR for cash and medical assistance, social services (such as English lan-guage and job training), targeted assistance, and preventive health. States either provide services directly or contract with nonprofit organizations to carry out and implement resettlement services.
13 NATIONAL CONFERENCE OF STATE LEGISLATURES
Thirty-two states administer the funds through state-run offices. Twelve states—Arkansas, Nevada, Ida-ho, Colorado, South Dakota, North Dakota, Kentucky, Alabama, Tennessee, Louisiana, Massachusetts and Vermont—participate in the alternative Wilson-Fish program, which contracts to nonprofit organizations. Five states—Minnesota, Oregon, Oklahoma, Texas and Maryland—use public-private partnerships to ad-minister the funds. Wyoming does not participate.
Refugees are also eligible for other federally funded benefit programs, if they meet all other require-ments, including Supplemental Security Income, Temporary Assistance for Needy Families, and Supple-mental Nutrition Assistance Program.
What Is the Budget for the Office of Refugee Resettlement (ORR)?ORR funds a variety of temporary assistance programs for refugees. The two major areas of support for refugees are Refugee Cash Assistance and Refugee Medical Assistance. ORR also provide funding for em-ployment assistance and citizenship services. Social services include interpretation and translation, citi-zenship and naturalization classes and support, and various employment and job training services.
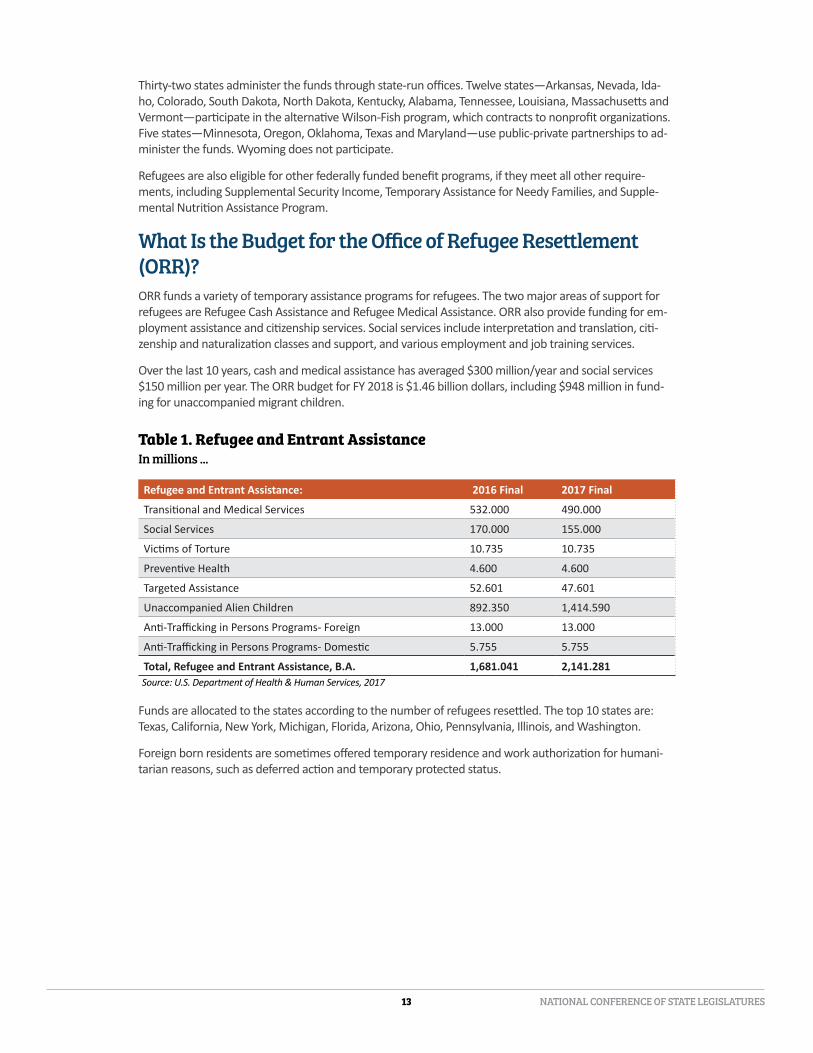
Over the last 10 years, cash and medical assistance has averaged $300 million/year and social services $150 million per year. The ORR budget for FY 2018 is $1.46 billion dollars, including $948 million in fund-ing for unaccompanied migrant children.
Table 1. Refugee and Entrant AssistanceIn millions ...
Refugee and Entrant Assistance: 2016 Final 2017 Final
Transitional and Medical Services 532.000 490.000
Social Services 170.000 155.000
Victims of Torture 10.735 10.735
Preventive Health 4.600 4.600
Targeted Assistance 52.601 47.601
Unaccompanied Alien Children 892.350 1,414.590
Anti-Trafficking in Persons Programs- Foreign 13.000 13.000
Anti-Trafficking in Persons Programs- Domestic 5.755 5.755
Total, Refugee and Entrant Assistance, B.A. 1,681.041 2,141.281Source: U.S. Department of Health & Human Services, 2017
Funds are allocated to the states according to the number of refugees resettled. The top 10 states are: Texas, California, New York, Michigan, Florida, Arizona, Ohio, Pennsylvania, Illinois, and Washington.
Foreign born residents are sometimes offered temporary residence and work authorization for humani-tarian reasons, such as deferred action and temporary protected status.
NATIONAL CONFERENCE OF STATE LEGISLATURES 14
Deferred Action for Childhood ArrivalsIn 2012, DHS issued the Deferred Action for Childhood Arrivals (DACA) policy to allow young unauthorized immigrants who are low enforcement priorities to remain in the country with temporary lawful status. A person who receives deferred action is considered to be lawfully present and may apply for work authori-zation. Deferred action is permitted for a renewable period of two years but it does not grant legal immi-gration status nor a pathway to citizenship. Deferred action under DACA may be terminated if the recipi-ent engages in criminal activity, leaves the country without advanced parole, or if the program is repealed.
The U.S. Citizenship and Immigration Services (USCIS) has granted DACA to individuals residing in all 50 states, the District of Columbia, and U.S. territories including Puerto Rico, Guam and the Virgin Islands. The top 10 states of residence are California, Texas, New York, Illinois, Florida, Arizona, North Carolina, New Jersey, Georgia and Washington. There are more than 25 different countries of origin, with the top 10 countries of origin being Mexico, El Salvador, Guatemala, Honduras, Peru, South Korea, Brazil, Ecuador, Colombia and the Philippines.
An estimated 690,000 immigrant youth have DACA status in 2017. State by state estimates by the Migra-tion Policy Institute can be found here.
Sept. 5, 2017, DHS issued a memorandum rescinding the DACA program. The program was phased out over six months, ending March 5, 2018. Bipartisan legislation (S.1615 and H.R.3440), entitled the Dream Act of 2017, is pending in Congress. On Jan. 9, 2018, a U.S. district judge ordered that DACA recipients be allowed to continue submitting renewal applications pending final decision on the litigation. On April 24, 2018, a federal judge ruled that the government must resume accepting new applications. The judge stayed his decision for 90 days to give DHS the opportunity to better explain its reasoning for canceling the program, and if it fails to do so, it must accept and process all new and renewal DACA applications.
Temporary Protected StatusEstablished by Congress in 1990, temporary protected status (TPS) is granted to nationals from designated countries affected by armed conflict or natural disaster who are already in the United States. TPS allows persons to live and work in the U.S., though they are not eligible for public benefits or permanent resi-dence status.
Ten countries—El Salvador, Haiti, Honduras, Nepal, Nicaragua, Somalia, South Sudan, Sudan, Syria, and Ye-men—are designated for TPS. About 320,000 people have TPS as of 2017, the majority from El Salvador (195,000), Honduras (57,000), and Haiti (46,000). DHS can extend TPS for 6 to 18 months, though some countries have received multiple 18-month extensions.
The protection of 2,500 immigrants from Nicaragua under temporary protected status will terminate on Jan. 5, 2019. TPS for the largest group, 263,280 Salvadorans will terminate on Sept. 9, 2019, and the sec-ond-largest group, 45,000 Haitians, will terminate on July 22, 2019. An extension to July 5, 2018 was granted to 86,000 Hondurans.
Child Migrants/Unaccompanied Alien ChildrenFederal responsibility for unaccompanied children is divided between the DHS and the HHS. Children in DHS custody who are under age 18 without a parent or guardian must be screened to determine if they are victims of trafficking or persecution. Children from Mexico and Canada can either choose to leave vol-untarily or be sent home within 48 hours under repatriation agreements. Children from all other coun-tries must be transferred to HHS within 72 hours for court review of their immigration claims. The Office of Refugee Resettlement in HHS reunites the child with family or a friend, or in approximately 10 percent of the cases, places them in foster care. After being placed, every child is put into deportation proceed-ings. The children may then be granted permission to stay (for example, through family visas, special im-migrant juvenile visas or asylum) or be removed from the United States. Court review is required, under a 2008 trafficking law, for children from countries other than Mexico and Canada.

15 NATIONAL CONFERENCE OF STATE LEGISLATURES
Trump Administration Travel Ban/Court CasesPresident Donald J. Trump attempted on three separate occasions in 2017 to bar the entry of foreign visitors from certain countries that had sponsored acts of international terrorism. Hawaii and Mary-land moved to block the order. On Dec. 4, the U.S. Supreme Court announced a temporary stay of the in-junctions in the Fourth and Ninth Circuit (Hawaii and Maryland) court cases, allowing the third executive order to go into effect. The U.S. Supreme Court announced on Jan. 19 that it would review the third ver-sion of the travel ban and issue a ruling this June.
On Jan. 29, 2018, the Trump administration announced the implementation of new screening procedures for refugees of certain “high-risk” countries following a 90-day review period during which refugee admis-sions from these countries were halted. The countries reportedly affected by the new screening proce-dures include: Egypt, Iran, Iraq, Libya, Mali, North Korea, Somalia, South Sudan, Sudan, Syria, and Yemen. The enhanced security measures include more in-depth interviews with refugee applicants, as well as an expanded exploration of refugee backgrounds and claim verification.
Figure 5. Refugee Processing Center Admissions and Arrivals
Source: GAO; National Atlas (globe).
OverseasprocessingThe Department of Homeland Security (DHS) approves refugees for admission to the United States. The Department of State (State) processes refugees overseas.
Voluntary agency assignmentRefugees are assigned to one of nine national-level voluntary agencies, which have multiple local affiliates.
Initial receptionand placementRepresentatives from voluntary agencies greet refugees upon arrival. Voluntary agencies provide housing and other basic needsfor 30-90 days with funding from State.
ProgramplacementVoluntary agencieshelp refugees apply for the assistance they are likely eligible to receive.
Refugee overseas Refugee in United States
Nine voluntary agencies
Other public assistanceType and duration
of assistance variesAdministered by various
government agenciesIncludes Supplemental
Security Income and Temporary Assistancefor Needy Families
AB
C
D
HI
E
F
G
State
DHS
Department of Healthand Human Services
Temporary assistance from ORR*
Eight months of cash assistance (4 to 6 months for Matching Grant)
Medical assistanceSocial services, such as
employment assistance and citizenship services, for up to 5 years
Administered by local voluntary agencies or by a government agency
*Fully or partially funded and administered by Department of Health and Human Services’ Office of Refugee Resettlement (ORR)
Source: GAO; National Atlas (globe)

NATIONAL CONFERENCE OF STATE LEGISLATURES 16
State Legislatures and Immigration FederalismState governments have been partners in federal immigration policy since the 1980 Refugee Act created a national program and established federal funding to state and nonprofit providers of services such as En-glish and job training to support refugees’ path to self-sufficiency.
The 1986 Immigration Reform and Control Act (IRCA) legalized 2.6 million unauthorized immigrants but barred them from federally-funded benefits for five years. When the bill included no funding to states to cover anticipated health, education and social services expenditures, states successfully proposed an amendment for $4 billion in transitional aid (1988-1994) to help this group of immigrants navigate the lengthy legalization process, learn English and civics, and receive health screening.
Plyler vs Doe
The courts also played a role in increasing state responsibilities, notably the 1982 U.S. Supreme Court case Plyler vs Doe, which considered whether undocumented children were eligible to re-ceive public elementary education. The court feared that denying these children an education might create a permanent underclass of illegal immigrants who probably would remain in the U.S. the rest of their lives, and that discrimination against the children would punish them for the acts of their parents, since the children had no choice in entering the U.S.
State legislation has moved beyond benefits such as social service and nutrition to a wide range of poli-cy arenas–education, employment, driver’s licenses, and enforcement among them. These efforts came about in part because of new federal mandates included in two 1996 laws. The 1996 welfare law created

17 NATIONAL CONFERENCE OF STATE LEGISLATURES
new eligibility standards for legal immigrants’ access to federal benefit programs such as health, public as-sistance and disability benefits. The 1996 illegal immigration law, while adding penalties on unauthorized immigrants, also included provisions seeking restrictions on state authority to extend state-funded bene-fits to unauthorized residents, such as in-state tuition rates.
States have significant financial and administrative responsibilities for public services. They fund 91 per-cent of elementary and secondary education and share financing with the federal government for public health and welfare services for low-income populations. States also fund law enforcement personnel, re-sponsible for public safety for all residents and for cooperation with federal authorities on criminal immi-gration violations. States have launched integration policies, such as support for English language classes, civic engagement activities, and naturalization programs.
Trends in State Immigration LawsStates have been testing the parameters of their authority and responsibility as Congress continues to be deadlocked on immigration reform. Legislation has ranged across a continuum of immigrant enforcement to immigrant integration measures.
In the 1980s and 1990s, state legislation was focused primarily on benefit eligibility for social services, health and nutrition assistance, in response to the federal immigration and welfare reform laws.
In the 2000s, states began restoring in-state tuition benefits for unauthorized immigrant students, while also adding restrictions on driver’s licenses as a result of the federal REAL ID law. • Sixteen legislatures—California, Colorado, Connecticut, Florida, Illinois, Kansas, Maryland, Minnesota,
Nebraska, New Jersey, New Mexico, New York, Oregon, Texas, Utah, Virginia, and Washington—and the District of Columbia allow unauthorized immigrant students to receive the in-state tuition rate. These laws typically require attendance and graduation at state high schools, acceptance at a state college or university, and promising to apply for legal status as soon as eligible. An additional five uni-versity systems in Hawaii, Maine, Michigan, Oklahoma, and Rhode Island established policies to allow in-state tuition for unauthorized immigrant students.
• Twelve states and the District of Columbia enacted laws to allow unauthorized immigrants to obtain a driver’s licenses. These states—California, Colorado, Connecticut, Delaware, Hawaii, Illinois, Mary-land, Nevada, New Mexico, Utah, Vermont and Washington—issue a license if an applicant provides certain documentation, such as a foreign birth certificate, a foreign passport, or a consular card and evidence of current residency in the state.
Arizona tested states’ authority in immigration federalism in two U.S. Supreme Court cases: E-Verify in 2007, largely upheld, and immigration law enforcement, largely struck down.
Arizona enacted a law in 2007 that mandated use of E-Verify, with severe penalties including suspension or revocation of the employer’s business license. In Chamber of Commerce v. Whiting, the Supreme Court upheld Arizona’s law, finding that it was a licensing law permissible under IRCA. • Currently, 22 states—Alabama, Arizona, Colorado, Florida, Georgia, Idaho, Indiana, Louisiana, Michi-
gan, Minnesota, Mississippi, Missouri, Nebraska, North Carolina, Oklahoma, Pennsylvania, South Car-olina, Tennessee, Texas, Utah, Virginia and West Virginia—require the use of E-Verify for at least some public and/or private employers.
Immigration enforcement was the main trend in 2010-2011. Arizona passed SB1070, adding state pen-alties relating to immigration law enforcement including trespassing, harboring and transporting illegal immigrants, alien registration documents, employer sanctions, and human smuggling. Five states—Ala-bama, Georgia, Indiana, South Carolina and Utah—enacted similar legislation in 2011. Courts either par-tially or wholly enjoined these statutes, and Arizona’s was heard by the U.S. Supreme Court in 2012. The court struck down three of four contested provisions in Arizona v. United States and upheld a provision al-lowing law enforcement to ask immigration status during a lawful stop.
NATIONAL CONFERENCE OF STATE LEGISLATURES 18
Case Study: Utah
The Utah Compact was developed in 2010 with state and local officials, the Salt Lake Chamber, the Sutherland Institute, law enforcement, advocacy and religious organizations to guide Utah’s immigration discussions. Its five principles are:• Federal Solutions: Immigration is a federal policy issue between the U.S. government and
other countries—not Utah and other countries. We urge Utah’s congressional delegation, and others, to lead efforts to strengthen federal laws and protect our national borders. We urge state leaders to adopt reasonable policies addressing immigrants in Utah.
• Law Enforcement: We respect the rule of law and support law enforcement’s professional judgment and discretion. Local law enforcement resources should focus on criminal activi-ties, not civil violations of federal code.
• Families: Strong families are the foundation of successful communities. We oppose policies that unnecessarily separate families. We champion policies that support families and im-prove the health, education and well-being of all Utah children.
• Economy: Utah is best served by a free-market philosophy that maximizes individual free-dom and opportunity. We acknowledge the economic role immigrants play as workers and taxpayers. Utah’s immigration policies must reaffirm our global reputation as a welcoming and business-friendly state.
• A Free Society: Immigrants are integrated into communities across Utah. We must adopt a humane approach to this reality, reflecting our unique culture, history and spirit of inclu-sion. The way we treat immigrants will say more about the U.S. as a free society and less about our immigrant neighbors. Utah should always be a place that welcomes people of goodwill.
In 2011, the legislature enacted a package of laws to support immigration enforcement and a legal immigrant workforce (H.116, H.466, H.469 and H.497). Key provisions included: a federal waiver to obtain foreign workers; a multi-agency strike force to combat crimes associated with illegal immigration and human trafficking and other enforcement measures; an advisory Com-mission on Immigration and Migration; studies on economic, legal, cultural and educational im-pact of immigration, and a state plan on immigration and integration.
Case Study: California
In California, where one in four residents is foreign-born, state legislators have enacted an array of laws extending benefits for immigrants. These include in-state tuition, state financial aid for education, and driver’s licenses for unauthorized immigrants. The legislature extended health care to unauthorized immigrant children. The state added prohibitions on the unauthorized practice of law for immigration services and barred local law enforcement from detaining peo-ple for federal deportation if arrested for minor crimes. Bipartisan legislation in 2014 permits the issuing of professional licenses to those who meet the requirements regardless of immigra-tion status. SB1159 allow all applicants for a professional license in California to provide either a Social Security Number (SSN) or an individual taxpayer identification number (ITIN). The Califor-nia legislature passed a law creating the position of Statewide Director of Immigrant Integration in the Governor’s Office to coordinate immigrant services and monitor the implementation of immigration assistance programs. The legislature blocked the expansion of immigrant detention in local jails and most privately operated detention centers and provided funding for the Depart-ment of Justice to review the conditions of confinement for immigrants in the state, the first of its kind in the nation.
19 NATIONAL CONFERENCE OF STATE LEGISLATURES
In 2017-2018, the most recent trends in states have focused on “sanctuary” policies, refugee resettle-ment, DACA arrivals and professional licenses.
Sanctuary policies. While there is no legal definition for sanctuary policies, the term is applied to jurisdictions that limit cooperation with federal immigration authorities. States and localities often coop-erate with federal law enforcement, particularly in criminal investigations, for example under voluntary agreements such as the 287(g) program. Some state and local governments have policies that limit coop-eration in civil investigations to support public safety and community policing goals, such as encouraging witnesses and victims of crime to come forward.
In 2017, at least 37 states and the District of Columbia considered more than 120 bills regarding sanctuary jurisdictions or compliance with immigration detainers. Of these, four states––Georgia, Indiana, Missis-sippi and Texas––enacted legislation requiring cooperation with federal immigration agencies/opposing sanctuary policies, while California, Illinois, Vermont and Washington, D.C. passed measures limiting state enforcement of federal civil immigration laws.
In 2018, about 50 bills were introduced in 15 states. So far in 2018, California has prohibited contracting state facilities to house federal detainees for civil immigration custody (A110), while Iowa requires compli-ance of law enforcement agencies with federal detainers (S481).
Texas enacted S4 in 2017, which prohibits localities, institutions of higher education, police departments, sheriffs, municipal or county attorneys from adopting policies that prohibit enforcement of state and fed-eral immigration laws. Violations can re-sult in civil penalties. The law does not apply to hospitals, public health depart-ments, or school districts. Law enforce-ment must comply with federal detainer requests. In March 2018, a federal appeals court allowed the law to be implement-ed, overturning a lower court’s injunction. The Court of Appeals struck down a pro-hibition on officials from “endorsing” a policy that limits enforcement of immigra-tion laws, ruling it a violation of the First Amendment.
Refugees. In 2017, more than half the states considered legislation related to refugee resettlement, seeking additional state control over refugee resettlement, opposing federal executive orders or supporting refugee populations. Few bills were enacted. South Dakota repealed the authority for its department of social ser-vices to enter agreements related to the Refugee Act of 1980 and North Dakota al-lowed for a study of refugees. California, Illinois, Nebraska, New Jersey and Utah adopted resolutions supporting refugees.
DACA. About two dozen states have bills related to protections for DACA as Congress, the administration and courts sort out whether the DACA program continues administratively, is terminated, or will be codi-fied. In 2018, three states—Connecticut, New Jersey, and Oregon—have extended in-state tuition status to those who had DACA status (CT S4, NJ S699, and OR S1563). States that have barred unauthorized im-migrant students from in-state tuition benefits include Alabama (HB56, 2011), Arizona (Proposition 300, 2006), Colorado (HB 1023, 2006), Georgia (SB 492, 2008), South Carolina (HB4400, 2008), and Indiana (H 1402, 2011).
NATIONAL CONFERENCE OF STATE LEGISLATURES 20
Professional Licenses. State legislators point to their states’ changing demographics and labor shortages as factors in considering ways to reduce barriers to professional licenses for certain populations, such as DACA recipients, legal immigrants and/or unauthorized immigrants. A state’s high median age, the retire-ment of baby boomers, and shortages in key industries such as construction, health and hospitality are causing states to respond with task forces (Maryland, Minnesota), immigrant offices (Illinois, Michigan), regional coalitions (Midwest), and new education and training.
Medical Labor Shortages• The Health Resources and Services Administration (HRSA) projects, absent aggressive inter-
vention, project that the supply of nurses in American will fall 36 percent (more than 1 mil-lion nurses) below requirements by the year 2020.
• According to the Association of American Medical Colleges, the nation will face a shortage of 150,000 doctors by 2025.
California in 2014 allowed the licensing board to accept an individual tax identification number in addi-tion to a social security number on an application for a professional license. Florida allowed admission to the state bar if the person arrived in the U.S. as a minor and has employment authorization. The Massa-chusetts Global Entrepreneur in Residence was created to help foreign students graduating from Massa-chusetts universities to transition to H-1B visas while launching their own businesses in the state (H4377, 2014). The Minnesota legislature created a Foreign-Trained Physician Task Force in 2014 to assist immi-grant international medical graduates to integrate into the Minnesota health care delivery system, in re-sponse to physician shortages, an aging and diverse population, persistent health disparities, and rising health care costs. Nebraska allows DACA recipients to receive professional licenses (L947, 2016). Nevada allows school districts to grant teachers’ licenses to immigrants (A27, 2015).
For more information on state laws related to immigration, see NCSL’s searchable database: http://www.ncsl.org/research/immigration/immigration-laws-database.aspx
Economic and Fiscal Impacts of ImmigrationA constant in the debate about immigration to the United States is whether immigrants have a positive or negative impact on national and state budgets and economies. Many studies attempt to assess the fiscal and/or the economic impact of immigrant populations.
The fiscal impact is the difference between the cost of public benefits such as public education, health care, and welfare programs compared to tax revenues from income, sales and property tax. Economic im-pact is assessed by wages, gross domestic product, employment and investment.
National, Regional and State Studies The National Academies of Sciences, Engineering and Medicine in 2016 commissioned a panel of experts to review the economic and demographic trends of U.S. immigration, its impact on the labor market and wages of native-born workers, and its fiscal impact at the national, state, and local levels. The panel syn-thesized hundreds of studies and found immigration to have an overall positive impact on long-run eco-nomic growth in the U.S. In the long term, there is little negative impact on wages or employment, but some impact on recent immigrants and those without a high school degree. The Urban Institute’s Kim Rueben, a participant in the study writes that immigrants arrive in their prime working years and help fill the jobs that Americans leave as they age out of the work force. Skilled foreign-born workers boost inno-
21 NATIONAL CONFERENCE OF STATE LEGISLATURES
vation and productivity, hold more patents, and are more likely to start new businesses than native-born Americans. Government spending and revenues related to immigrants are roughly the same as for the na-tive-born over their lifetime. Children cost more for education, workers pay more in taxes, and older peo-ple receive retirement benefits.
Other findings from the NAS study include: • First-generation immigrants cost more than native-born residents, mainly at the state and local levels,
in part due to the costs of educating their children. When these second-generation children grow up, however, they are among the strongest economic and fiscal contributors in the U.S. population, con-tributing more in taxes than their parents or the native population.
• Immigrants have higher representation in certain occupations re-quiring high levels of education (science, technology, engineering and health).
• The children of immigrants working in low-status jobs find substan-tially better paying jobs than their parents had.
Looking specifically at the refugee population, a June 2017 report from the National Bureau of Economic Research found that the longer refu-gees live in this country, the better their economic situation becomes. Refugees who arrived as adults (18 to 45 years old) contributed, on aver-age, $21,000 more in taxes than they received in benefits after 20 years in the U.S.
Another study looked at the DACA program, which provides temporary residency and work status to unauthorized immigrant youth. While Con-gress, the administration and the courts are reviewing the DACA pro-gram, some raise concerns that these students cost more in benefits, e.g., public education, than they contribute in taxes. The American Ac-tion Forum ran the numbers. Their study compares the costs of 690,000 DACA recipients with the tax revenues generated by their economic ac-tivity. Their estimate is that DACA recipients cost approximately $7.4 bil-lion and generate an additional $10.8 billion in additional taxes, for a net benefit of $3.4 billion each year. The estimated cost of removing DACA recipients from the U.S. is between $7 and $21 billion.
State lawmakers have questioned how to understand the varying results of fiscal and economic impact studies. The Urban Institute reviewed six studies on the impacts of immi-gration in 2013 after the Senate passed S.744. The review found:• Studies address different policies and use a variety of methodologies and assumptions. • Differences in time horizon can drive differences in findings. Over time, immigrants become eligible
for different government benefits, the children of immigrants become adults, new immigrants enter the country, and older immigrants retire from the labor force.
• Studies agree that legalization and increased legal immigration would expand the economy and boost tax revenues. GDP gains range from 0.3 percent to 0.8 percent per year ($83 to $150 billion), depending on the labor force growth stimulated by immigration reform and the increase in earnings of the undocumented immigrants who would be legalized.
• Economic impact studies tend to show positive effects. Fiscal impact studies considering both reve-nues and outlays show varied results.
• Further analysis of the net fiscal impacts of legalization at the federal, state, and local levels is needed.
Looking specifically at the refugee population, a June 2017 report from the National Bureau of Economic Research found that the longer refugees live in this country, the better their economic situation becomes. Refugees who arrived as adults (18 to 45 years old) contributed, on average, $21,000 more in taxes than they received in benefits after 20 years in the U.S.
NATIONAL CONFERENCE OF STATE LEGISLATURES 2222 NATIONAL CONFERENCE OF STATE LEGISLATURES
The Chicago Council on Global Affairs brought together a bipartisan group of political and civic leaders in The Midwest Immigration Task Force, including former mayors and governors, current and former CEOs, heads of universities, and religious, labor, and civil-society leaders from 12 states in the Midwest. Their consensus report, U.S. Economic Competitiveness at Risk: A Midwest Call to Action on Immigration Re-form, affirmed that “immigrants are hugely important to the economic vitality of Midwestern towns and cities, and to the key sectors that drive the region’s economic growth particularly as the region faces an aging and shrinking native-born workforce.” In a recent blog, MacArthur Foundation senior fellow John Slocum summarized the report’s recommendations:• Provide more visas for high-skilled and lower-skilled immigrants to meet workforce demand. • Create new visas for temporary workers to fill hospitality, agriculture, and healthcare jobs not being
addressed by seasonal-employment visas. • Devise better tools for employers once new legal pathways for hiring are in place. • Encourage STEM students from U.S. universities to stay and work in the region. • Monitor visa overstays and improve coordination among law enforcement agencies. • Provide a permanent answer for children brought to the United States illegally.
Case study–Maryland
Commission to Study the Impact of Immigrants in Maryland, The Impact of Immigrants in Mary-land, Final Report, Feb. 8, 2012. The Maryland legislature authorized a commission to gain a broader understanding of the eco-nomic and fiscal issues surrounding immigration and to provide recommendations to the legis-lature (HB1602, June 2008). The commission ended with these conclusions and recommendations:• A systematic and bipartisan approach to federal immigration reform is essential for a
healthy nation, and for Maryland.• A healthy and growing economy needs immigrants of all types. • There are many non-economic benefits from immigration.• The state and local fiscal cost of unauthorized immigrants is due to their low-income, and
most of these costs cannot be avoided.• Programs that enroll local law agencies in enforcing immigration law can work against the
interests of Maryland’s communities. Local jurisdictions should engage with these pro-grams only under certain conditions.
• While the E-Verify program has some promise in restricting unauthorized immigration, its ultimate effectiveness will be largely influenced by the design of the overall immigration policy regime.
• To insure Maryland’s continued global economic and technical leadership, the state must redouble its efforts to provide superior education at every level to all young residents, in-cluding the foreign-born, regardless of immigration status.
23 NATIONAL CONFERENCE OF STATE LEGISLATURES
Appendix A – Federal Immigration Resourcesn U.S. Department of Homeland Security (DHS)DHS’s missions include preventing terrorism and enhancing security, managing our borders, administering immigration laws, securing cyberspace and ensuring disaster resilience.
U.S. Citizenship and Immigration Services (USCIS) USCIS is the government agency that oversees lawful immigration to the United States. USCIS se-cures America’s promise as a nation of immigrants by providing accurate and useful information to their customers, granting immigration and citizenship benefits, promoting an awareness and un-derstanding of citizenship, and ensuring the integrity of our immigration system.
U.S. Customs and Border Protection (CBP) The responsibilities of CBP are border management and control, including customs, immigration, border security, and agricultural protection. The priority of the Border Patrol is preventing terror-ists and weapons from entering the United States. The Border Patrol helps maintain borders that work—facilitating the flow of legal immigration and goods while preventing the illegal trafficking of people and contraband.
U.S. Immigration and Customs Enforcement (ICE)ICE enforces federal laws governing border control, customs, trade and immigration to promote homeland security and public safety.
The Blue Campaign is the unified voice for DHS efforts to combat human trafficking. DHS is respon-sible for investigating human trafficking, arresting traffickers, and protecting victims. DHS also pro-vides immigration relief to non-U.S. citizen victims of human trafficking.
n U.S. Department of JusticeThe primary mission of the Executive Office for Immigration Review is to adjudicate immigration cases by fairly, expeditiously, and uniformly interpreting and administering the Nation’s immigration laws.
n U.S. Department of StateThe Bureau of Population, Refugees, and Migration provides aid and sustainable solutions for refugees, victims of conflict and stateless people around the world, through repatriation, local integration, and re-settlement in the United States.
The Department of State administers immigrant and non-immigrant visas to enter, travel or stay in the country.
n U.S. Department of Health and Human ServicesThe Office of Refugee Resettlement provides new populations with the opportunity to achieve their full potential in the United States and assists them in becoming integrated members of American society.
n U.S. Department of LaborThe Department of Labor is responsible for coordinating international migration with domestic workforce needs and oversees work authorization for non-U.S. citizens.
NATIONAL CONFERENCE OF STATE LEGISLATURES 24
Appendix B – State Immigration Resourcesn Migration Policy Institute
State Immigration Data Profiles
These profiles review U.S. census data on immigrants by state and nationally including demographics, lan-guage and education, workforce, and income.
n The National Academies of Sciences, Engineering and Medicine
The Economic and Fiscal Impact of Immigration
The leading demographic, economic and fiscal experts in the United States worked together to create a report on the economic and fiscal impact of immigrations. The report lays the bases for a more informed and fact-based discussion on the issues surrounding current immigration in the U.S. by summarizing ex-isting knowledge about the economic and fiscal impacts of immigration, by discussing implications of the panel’s findings for economic and fiscal policy, by projecting immigration and related economic and fiscal trends to the year 2050 and by identifying the gaps present in their existing knowledge and data infrastructure.
n National Academies of Sciences, Engineering, and Medicine
The Integration of Immigrants into American Society
A study from the National Academies of Sciences Engineering and Medicine in 2015 found that the level of education, occupation, English ability and income all improved as immigrants and their descendants in-tegrated into American life. Immigrants appear to be learning English at the same rate or faster than earli-er immigrants.
n Bipartisan Policy Center Report
Culprit or Scapegoat? Immigration’s Effect on Employment and Wages
By Kenneth Megan and Theresa Cardinal Brown
The Center’s research suggests that declining native-born labor force participation is due to the ability these individuals have to pursue non-labor force activities (retirement, disability, and school), rather than direct competition from immigrants. Native- and foreign-born individuals tend to work in different indus-tries. Most predominantly foreign-born industries are composed of lesser-skill, lower-wage occupations, some of which have seen strong employment growth in recent years and labor shortages.
n The Brookings Institution
The Geography of Foreign Students in U.S. Higher Education: Origins and Destinations
This report uses a database on foreign student visa approvals from 2001 to 2012 to analyze their distribu-tion in the United States. These findings suggest that foreign students can provide important economic benefits to their U.S. metropolitan destinations—serving as bridges back to their growing home cities and offering valuable skills to local employers
25 NATIONAL CONFERENCE OF STATE LEGISLATURES
n Immigration Data Matters, provides 220 data sources offering, for example, the number of immigrants by state, social and economic characteristics, and immigrants in the labor force. Migration Policy Institute, March 2018.
n Immigration and American Jobs. American Enterprise Institute for Public Policy Research and the Part-nership for a New American Economy, December 2011.
n The Fiscal Implications of the DACA Program. American Action Forum, Jan. 18, 2018.
n Understanding the Fiscal and Economic Impact of Immigration Reform: A Guide to Current Studies and Possible Expansions. The Urban Institute, November 2013.
n H2A and H2B Temporary Worker Visas: Policy and Related Issues. Congressional Research Service, May 10, 2017.
n A Primer on U.S. Immigration Policy. Congressional Research Service, Nov. 14, 2017.
n Nonimmigrant (Temporary) Admissions to the United States: Policy and Trends. Congressional Re-search Service, Dec. 8, 2017.
n State and Local Fiscal Effects of Immigration. The Urban Institute, June 2017.
n NCSL Chart of eligibility for benefits: legal immigrants.
n NCSL Chart of eligibility for benefits: unauthorized immigrants.
n New American Economy statewide data for every state about immigrants; for every federal district; and top 100 metro areas.
n Statestats: Refugee Resettlement by the Numbers, State Legislatures magazine, February 2016
n Congressional Research Service - Refugee Admissions and Resettlement Policy
n Find Refugee Resources and Contacts in Your State
NATIONAL CONFERENCE OF STATE LEGISLATURES 26
Jan. 25, 2017—Executive orders on sanctuary cities and border wall.
Jan. 27, 2017—Executive order on refugee admis-sion and immigration bans.
February 20, 2017—Department of Homeland Se-curity implementation memos on “Implementing the President’s Border Security and Immigration Enforcement Improvement Policies” and “Enforce-ment of the Immigration Laws to Serve the Nation-al Interest.”
March 6, 2017—Executive order temporarily sus-pending immigration from six countries.
March 20, 2017—Department of Homeland Secu-rity releases “Declined Detainer Outcome Report” highlighting jurisdictions that have declined to hon-or immigration and customs enforcement detain-ers for potentially removable individuals who have been arrested or held in police custody.
April 18, 2017—Presidential Executive Order on Buy American, Hire American prioritizing federal use of American goods and services and directing changes in the process for issuing H-1B visas.
June 15, 2017—John Kelly rescinds Deferred Ac-tion for Parents of Americans (DAPA) policy.
July 11, 2017—DHS delays implementation of In-ternational Entrepreneur Rule that would have allowed, under certain conditions, entrepreneurs from foreign countries to enter the United States for 30 months to establish a startup business.
July 27, 2017—The House passes a $788 billion spending bill, which includes $1.6 billion for border wall funding.
Sept. 5, 2017—Trump administration ends DACA.
Sept. 4, 2017—Trump administration releases up-dated travel restrictions.
Sept. 20, 2017—California files a lawsuit against the administration to stop the border wall plan. The suit contends the plan doesn’t comply with the federal government’s own environmental legisla-tion and infringes on states’ rights, among other claims.
Sept. 27, 2017—Trump administration limits number of refugees to be admitted to the U.S. to 45,000.
Oct. 24, 2017—Restrictions on refugee admissions expire; new guidelines in place related to officer training, fraud detection, and sharing information between federal agencies.
Nov. 20, 2017—DHS announces end date for pro-gram allowing Haitians to live and work in U.S. Hai-tians living in the U.S. will have until July 22, 2019, to return to Haiti or apply for lawful immigration status in the U.S., if eligible.
Dec. 4, 2017—The Supreme Court announces a temporary stay on Fourth and Ninth Circuit injunc-tions on the Sept. 24 travel restrictions, allowing them to go into effect.
Jan. 9, 2018—California judge orders the adminis-tration to resume DACA renewals.
Jan. 19, 2018—The U.S. Supreme Court announced that it will hear challenges to the latest version of the travel ban.
Feb. 13, 2018—A federal judge in Brooklyn issued an injunction to block the Trump administration’s termination of DACA. Feb. 26, 2018—The Supreme Court ruled that it will not hear the Trump administration’s request to review DACA, keeping the program alive and allow-ing DACA recipients to renew their status after the Mar. 5 deadline.
April 6, 2018—The attorney general announces a “zero-tolerance” policy for criminal illegal entry.
April 24, 2018—A District of Columbia judged ruled that DACA protections must stay in place and that the government must resume accepting new applications.
April 25, 2018—The Supreme Court heard oral ar-guments on the challenge to the travel ban.
June 20, 2018—Executive order on affording con-gress an opportunity to address family separation.
Appendix C – Federal Action on Immigration 2017-2018

William T. Pound, Executive Director
7700 East First Place, Denver, Colorado 80230, 303-364-7700 | 444 North Capitol Street, N.W., Suite 515, Washington, D.C. 20001, 202-624-5400
www.ncsl.org
© 2018 by the National Conference of State Legislatures. All rights reserved. ISBN 978-1-58024-955-3
NCSL Contact:
Ann Morse Program Director, Immigration Policy Project