Drug Resistant Tuberculosis. A Survival Guide For Clinicians. Ntc.08
Upload
hoangkhuongCategory
view
217download
2
Radiographic Manifestationsof Tuberculosis
A Primer for Clinicians
F R A N C I S J . C U R R Y N A T I O N A L T U B E R C U L O S I S C E N T E R
Charles L. Daley, MDMichael B. Gotway, MDRobert M. Jasmer, MD

This project was funded through the Department of Public Health, City and County of San Francisco, with funds awarded under Cooperative Agreement U52/CCU900454,
Centers for Disease Control and Prevention.
Funds were also provided through the National Heart, Lung and Blood Institute,
Tuberculosis Academic Award Program, KO7-HL03057at the University of California, San Francisco.
Permission is granted for nonprofit educationaluses and library duplication and distribution.
Suggested citation:
Daley CL, Gotway MB, Jasmer RM. Radiographic Manifestations of Tuberculosis: A Primer for Clinicians
San Francisco: Francis J. Curry National Tuberculosis Center; August 2003: [inclusive page numbers]. Termination date: August 2006
The faculty for this publication, Drs. Charles L. Daley, Michael B. Gotway, and Robert M. Jasmer,
have indicated that they have not had any financial arrangements or affiliations with commercial
sponsors that have direct interest in the subject matter.
The Francis J. Curry National Tuberculosis Center is accredited by the Accreditation Council for Continuing Medical Education to provide Continuing Medical Education (CME) for physicians.
The Francis J. Curry National Tuberculosis Center takes responsibilityfor the content, quality, and scientific integrity of this CME activity.
This course is approved for5 hours of CME hours for physicians and
7 hours of CE hours for nurses.
Estimated instruction time to complete this activity is five hours.If you are interested in receiving CME/CE credit, please completethe enclosed application form. All answers must be completed to receive credit. Please submit the evaluation form no later than
30 days after finishing the course.
F R A N C I S J . C U R R Y N A T I O N A L T U B E R C U L O S I S C E N T E R
i i

F R A N C I S J . C U R R Y N A T I O N A L T U B E R C U L O S I S C E N T E R
About the Authors
Charles L. Daley, MD, is an Associate Professor of Medicine at the University of California, San Francisco. He is a member of the Division of Pulmonary and Critical Care Medicine at San Francisco General Hospital, where he is Chief of the Chest Clinic. Dr. Daley serves as Medical Director for the Training Center at the Francis J. Curry National Tuberculosis Center in San Francisco.
Michael B. Gotway, MD, is an Assistant Professor of Radiology and Medicine at the University of California, San Francisco. He is Director of Thoracic Imaging at San Francisco General Hospital; Director of the Radiology Residency Training Program at the University of California, San Francisco; and Director of the Body Imaging Practicum Fellowship Program at San Francisco General Hospital.
Robert M. Jasmer, MD, is an Assistant Professor of Medicine at the University of California, San Francisco. He is Associate Director of the Pulmonary and CriticalCare Medicine Fellowship program at the University of California, San Franciscoand is an Attending Physician at the San Francisco Tuberculosis Clinic.
i i i
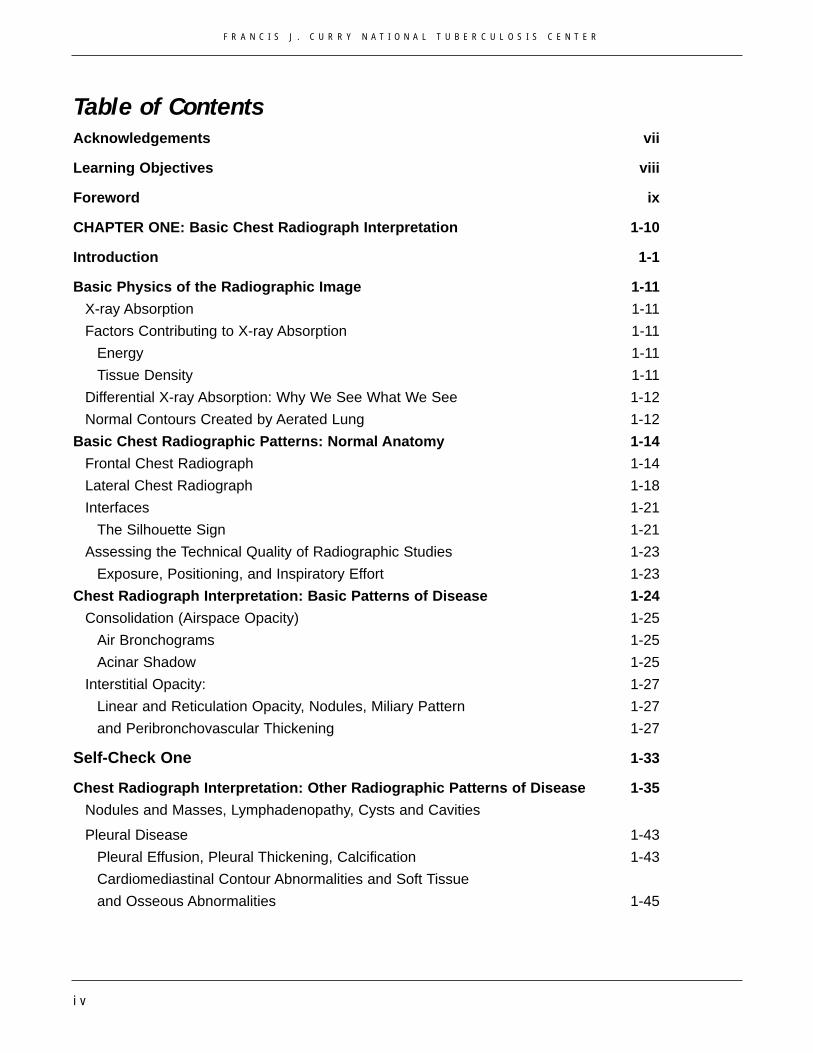
Table of ContentsAcknowledgements vii
Learning Objectives viii
Foreword ix
CHAPTER ONE: Basic Chest Radiograph Interpretation 1-10
Introduction 1-1
Basic Physics of the Radiographic Image 1-11
X-ray Absorption 1-11
Factors Contributing to X-ray Absorption 1-11
Energy 1-11
Tissue Density 1-11
Differential X-ray Absorption: Why We See What We See 1-12
Normal Contours Created by Aerated Lung 1-12
Basic Chest Radiographic Patterns: Normal Anatomy 1-14
Frontal Chest Radiograph 1-14
Lateral Chest Radiograph 1-18
Interfaces 1-21
The Silhouette Sign 1-21
Assessing the Technical Quality of Radiographic Studies 1-23
Exposure, Positioning, and Inspiratory Effort 1-23
Chest Radiograph Interpretation: Basic Patterns of Disease 1-24
Consolidation (Airspace Opacity) 1-25
Air Bronchograms 1-25
Acinar Shadow 1-25
Interstitial Opacity: 1-27
Linear and Reticulation Opacity, Nodules, Miliary Pattern 1-27
and Peribronchovascular Thickening 1-27
Self-Check One 1-33
Chest Radiograph Interpretation: Other Radiographic Patterns of Disease 1-35
Nodules and Masses, Lymphadenopathy, Cysts and Cavities
Pleural Disease 1-43
Pleural Effusion, Pleural Thickening, Calcification 1-43
Cardiomediastinal Contour Abnormalities and Soft Tissue
and Osseous Abnormalities 1-45
F R A N C I S J . C U R R Y N A T I O N A L T U B E R C U L O S I S C E N T E R
i v

F R A N C I S J . C U R R Y N A T I O N A L T U B E R C U L O S I S C E N T E R
Self-Check Two 1-46
A Final Word about Evaluating the Entire Radiograph 1-49
Distribution of Disease 1-50
Conclusion 1-51
Self-Check Answers 1-52
References 1-52
CHAPTER TWO: Radiographic Manifestations of Tuberculosis 2-1
Introduction 2-1
Overview of the Pathogenesis of Tuberculosis 2-2
Primary Tuberculosis 2-3
Distribution of Parenchymal Disease 2-3
Primary Tuberculosis in a Child 2-4
Primary Tuberculosis in an Adult 2-6
Patterns of Disease 2-7
Airspace Consolidation 2-7
Airspace Consolidation with Cavitation 2-9
Interstitial Pattern (Miliary) 2-10
Tracheobronchial Disease 2-11
Hilar and Mediastinal Lymphadenopathy 2-12
Pleural Disease 2-15
Post-primary (Reactivation) Tuberculosis 2-17
Distribution of Parenchymal Disease 2-18
Patterns of Disease 2-20
Airspace Consolidation 2-20
Airspace Consolidation with Cavitation 2-21
Airspace Consolidation with Bronchogenic Spread 2-22
Airspace Consolidation with Volume Loss 2-23
Interstitial Opacities (Miliary) 2-25
Tuberculoma 2-26
Pleural Disease 2-27
Tuberculosis and HIV Infection 2-28
Resolution of Radiographic Abnormalities and Healed Tuberculosis 2-31
Primary Tuberculosis 2-31
Post-primary Tuberculosis 2-31
v
F R A N C I S J . C U R R Y N A T I O N A L T U B E R C U L O S I S C E N T E R
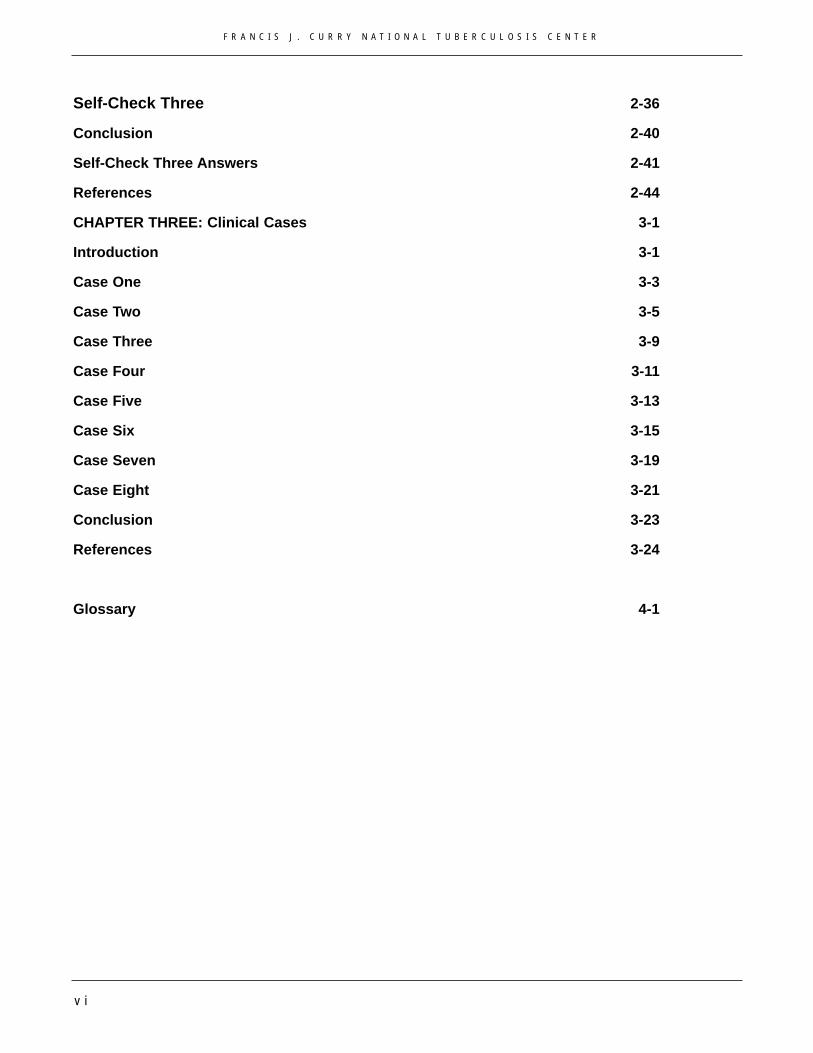
Self-Check Three 2-36
Conclusion 2-40
Self-Check Three Answers 2-41
References 2-44
CHAPTER THREE: Clinical Cases 3-1
Introduction 3-1
Case One 3-3
Case Two 3-5
Case Three 3-9
Case Four 3-11
Case Five 3-13
Case Six 3-15
Case Seven 3-19
Case Eight 3-21
Conclusion 3-23
References 3-24
Glossary 4-1
v i
F R A N C I S J . C U R R Y N A T I O N A L T U B E R C U L O S I S C E N T E R
AcknowledgementsConstructive reviews were kindly provided by:
Wafaa El-Sadr, MD, MPHPhilip Hopewell, MD
Michael Iademarco, MD, MPHL. Masae Kawamura, MD
Venkatarama Koppaka, MD, PhD Ann M. Loeffler, MD
Reynard McDonald, MDKathleen Moser, MD, MPH
Horacio Ramírez Oropeza, MDRandall Reves, MD
Gisela Schecter, MD
This text was greatly helped by the technical assistance of David Berger, Catherine Minh Cao, and Jerry Libatique
of the Francis J. Curry National Tuberculosis Center in San Francisco; and Stella Park and Paula Doubleday.
Finally, we would like to dedicate this book to our greatest inspiration, our patients
at the San Francisco Tuberculosis Clinic and San Francisco General Hospital.
They are the source of all of the radiographicimages shown and continue to enrich us in
our practice of medicine.
v i i

F R A N C I S J . C U R R Y N A T I O N A L T U B E R C U L O S I S C E N T E R
Learning Objectives
Upon completion of this course, participants will be able to:
A. identify a tuberculosis suspect on the basis of a chest radiograph
B. describe appropriate management options based on the appearance of a chest radiograph
CHAPTER 1 – BASIC CHEST RADIOGRAPH INTERPRETATION
Objective 1: Learners will be able to describe why normal anatomy and pathology may or may not be visualized using radiographs.
Objective 2: Learners will be able to gather information from the radiograph instead of using pattern recognition.
CHAPTER 2 – RADIOGRAPHIC MANIFESTATIONS OF TUBERCULOSIS
Objective 1: Learners will be able to describe the radiographic manifestation ofpulmonary tuberculosis and use standard terminology to describe theradiographic findings.
Objective 2: Learners will be able to recognize various radiographic manifestations of tuberculosis.
CHAPTER 3 – CLINICAL CASES
Objective 1: Learners will apply knowledge to interpret clinical cases.
Objective 2: Learners will use case studies to describe the radiographic abnormali-ties and will answer questions relevant to the evaluation and treatment of the case.
v i i i

F R A N C I S J . C U R R Y N A T I O N A L T U B E R C U L O S I S C E N T E R
Foreword
uberculosis conjures up many different images for both clinicians andlaypersons, from the White Plague of centuries past to the sanitaria of the 19thcentury to impoverished people spreading resistant bacteria in urban areas in the20th and 21st centuries. Despite many advances in both diagnosis and treatment,tuberculosis remains one of the most common causes of death from any infectiousagent in the world. Currently, there are approximately 8 million cases of tuberculo-sis every year in the world, and it is hyperendemic in many countries of Africa,Southeast Asia, Latin America, and Eastern Europe. Roughly one-third of theworld’s population (2 billion people) is infected with Mycobacterium tuberculosis.
One of the most important and fascinating aspects of tuberculosis is the multiple forms it can take in radiographs of the chest. These differing radiographicappearances are often misunderstood and can easily be confused with other disease processes. In this text, we have set out to catalog the multiple chest radiographic manifestations of tuberculosis. Our intention is to make this as interactive an experience as possible, and we have included cases requiring readers’ input as well as an entire chapter dedicated to case presentations withmultiple choice questions.
Readers will note that, in several instances, portions of radiographs havebeen cropped to varying degrees. Of course, it is of paramount importance to ade-quately evaluate the quality of a radiograph prior to interpretation, and one step inthis process is making certain that a portion of the radiograph has not been exclud-ed from view. For the purposes of this text, cropping of the radiographs has beendone to enhance the visualization of anatomy or pathology by increasing the reso-lution of the area of interest on the radiograph, and is a necessary step in provid-ing high-quality radiographic reproductions.
The text has been divided into three chapters. The first consists of a basicdiscussion of what x-rays are, how images are created, and the skills necessary toread and interpret chest radiographs for the presence of disease. In the secondchapter we provide examples of tuberculosis in all its multiple appearances.Finally, in the third chapter we present a series of cases to illustrate how the radi-ographic findings influence the evaluation and management of patients at risk fortuberculosis.
i x
T

F R A N C I S J . C U R R Y N A T I O N A L T U B E R C U L O S I S C E N T E R
CHAPTER ONE
IntroductionIn Chapter One, we discuss the physical principles of plain chest radiography.By the end of this chapter, you should have a basic understanding of howchest radiographs are created and why normal anatomy and pathology may or may not be visualized using radiographs.
Armed with this knowledge, you will be able to gather information from the radiograph instead of simply offering a diagnosis because a particular radi-ograph superficially resembles a pattern you have seen before.
You will acquire skills to consistently and accurately read and interpret chest radiographs for the presence of disease using standard terminology. The proper use of standard terminology ensures that other clinicians are able tocomprehend your interpretation and corroborate your diagnosis.
Once a framework of the principles of radiographic imaging is established, we discuss common chest radiographic patterns and differential diagnoses.
Basic Chest RadiographInterpretation
1 - 1 0 / B A S I C C H E S T R A D I O G R A P H I N T E R P R E T A T I O N

F R A N C I S J . C U R R Y N A T I O N A L T U B E R C U L O S I S C E N T E R
Basic Physics of the Radiographic ImageA discussion of x-ray photon interactions with matter is far beyond the scope of this chapter. However, we will explain general concepts underlying the creation of radiographic images. These include x-rayabsorption, tissue density, and differential x-ray absorption.
X-ray Absorption
When x-rays are produced and directed toward the patient, they may act in three basic ways.
They may be… Which means…
unabsorbed they pass through the patient unchanged and strike the x-ray film.
completely absorbed the energy of the x-ray is totally deposited within the patient.
scattered they are deflected within the patient but may still strike the x-ray film.
Factors Contributing to X-ray Absorption
It is important to understand what factors contribute to x-ray absorption because the final image depends on the relative number of x-rays that are unabsorbed, absorbed, or scattered. In general, the twomost important factors that determine how x-rays are absorbed are:
� the energy of the x-ray beam and� the density of the tissue the beam strikes.
Energy
Because the energy of the beam is usually fairly constant in posteroanterior and lateral radiography, it is not an issue that needs further discussion.
Tissue Density
Of greater interest is the significant effect of tissue density on x-ray beam absorption. In general, you will see seven different densities on plain radiographs. The denser the tissue is, the whiter it appearson a radiograph. The less dense the tissue is, the blacker it appears. In order, from the densest(whitest) to least dense (blackest), the seven densities visible with chest radiography are:
All normal anatomic structures as well as the diverse range of cardiopulmonary abnormalities are visualized by the interplay among these seven densities. We explain how this is accomplished in thefollowing section.
B A S I C C H E S T R A D I O G R A P H I N T E R P R E T A T I O N / 1 - 1 1
Whitest/Most Dense
Blackest/Least Dense
MetalContrast material (i.e., x-ray dye)
BoneCalcium
Soft tissueFat
Air or gas

F R A N C I S J . C U R R Y N A T I O N A L T U B E R C U L O S I S C E N T E R
1 - 1 2 / B A S I C C H E S T R A D I O G R A P H I N T E R P R E T A T I O N
Differential X-ray Absorption: Why We See What We See
Depending on the tissue density, differing quantities of x-rays will be absorbed when the x-ray beam strikes the patient. This concept, called differential x-ray absorption, is the fundamental principleunderlying plain radiographic image production and interpretation. In most cases, the higher the density, the greater the absorption of the x-ray photons.
X-ray Photon Absorption Substance Radiographic Appearance
Highest Whitest/Most Dense• Metal• Contrast material
(i.e., x-ray dye)
• Bone
• Calcium
• Soft tissue
• Fat
• Air or gas
For example, heart tissue is denser than lung tissue. Therefore, more photons are absorbed when anx-ray beam strikes a patient’s heart compared with when an x-ray beam strikes the lung next to theheart. This differential absorption makes the heart appear “whiter” on the x-ray film than the lung andallows you to see the interface between these two structures, as shown in Figure 1.1a.
Lowest Blackest/Least Dense
Normal Contours Created by Aerated Lung
The presence of aerated lung contacting the diaphragm and cardiomediastinal structures creates several interfaces that we normally expect to see and that should be routinely sought on every radiograph. These expected interfaces include:
1. The aerated lower lobes are in contact with the diaphragm, allowing visualization of the diaphragm.
2. The medial segment of the right middle lobe contacts and allows visualization of the lateral wall of the right atrium.
3. The aerated lingula contacts and allows visualization of the left cardiac contour.
4. The right upper lobe contacts and allows visualization of the superior vena cava.
5. The left upper lobe contacts and allows visualization of the aortic arch.
When you are familiar with these normal contours, you can correctly recognize the anatomic locationof lung parenchymal abnormalities.

F R A N C I S J . C U R R Y N A T I O N A L T U B E R C U L O S I S C E N T E R
Figure 1.1a: Normal Frontal Chest Radiograph
Use the unmarked image in Figure 1.1a for comparison with Figure 1.1b on page 1-15.
B A S I C C H E S T R A D I O G R A P H I N T E R P R E T A T I O N / 1 - 1 3

Basic Chest Radiographic Patterns: Normal Anatomy Before exploring plain radiographic patterns of disease and their differential diagnoses, it is importantto be familiar with normal plain radiographic anatomy in both the frontal and lateral projections. A basicunderstanding of radiographic anatomy is required for accurate image interpretation.
Frontal Chest Radiograph On the frontal chest radiograph, several mediastinal structures are usually clearly visible and shouldbe recognized on every examination.
The arrows on Figures 1.1b and 1.1d correspond to the numbered descriptions below.
1. Superiorly, the left cardiomediastinal contour is dominated by the presence of the aortic arch (AA). The ascending aorta may form a border along the right cardiomediastinal contour, particularly in older patients.
2. Because it contacts the lung as it courses inferiorly through the thorax, the left lateral wall of the descending aorta (DA) is usually visible.
3. Just inferior to the aortic arch, the proximal left pulmonary artery (PLPA) is visible in the left hilar region. In most patients, the left hilum is slightly more cranially positioned than the right. More inferiorly and laterally, the left interlobar pulmonary artery (LIPA) dominates the left hilum.
4. The concavity created by the overlap of the aortic arch and the left pulmonary arterial shadows is called the aortopulmonary window ( ).
5. On the frontal radiograph, you can often see the left main bronchus (LB) just below the main pulmonary artery segment and the left pulmonary artery.
6. The region of the left atrial appendage (LAA) projects slightly inferior to the left main bronchus along the left cardiomediastinal contour. The left ventricle (LV) completes the rest of the left car-diomediastinal contour.
7. You can see the superior vena cava (SVC) in the most superior portion of the right cardiomedi-astinal contour. The soft tissue stripe created by the interface of the right lateral wall of the trachea and the adjacent right upper lobe is known as the right paratracheal stripe (RPS).
8. Near the inferior portion of the right paratracheal stripe, nestled in the right tracheobronchial angle, you often see the azygous vein (AV).
9. Just below the azygous vein is the right hilum; the right interlobar pulmonary artery (RIPA) may be seen exiting this region, coursing laterally and inferiorly.
10. The right atrium (RA) forms the right cardiac border. You may occasionally see a small shadow coursing obliquely within the right cardiophrenic angle; this shadow represents the inferior vena cava.
11. The trachea (T) is usually easily seen on frontal radiographs.
12. The right diaphragm (RD) and left diaphragm (LD) contours are clearly visible.
13. The lateral costophrenic angle (CPA) is visible in the lower left portion of the thorax in this example.
14. Occasionally, the anterior junction line (AJL) may be seen forming an obliquely oriented line overlying the mediastinum. The anterior junction line represents the point of contact between the two lungs anteriorly.
F R A N C I S J . C U R R Y N A T I O N A L T U B E R C U L O S I S C E N T E R
1 - 1 4 / B A S I C C H E S T R A D I O G R A P H I N T E R P R E T A T I O N
*

AA
F R A N C I S J . C U R R Y N A T I O N A L T U B E R C U L O S I S C E N T E R
B A S I C C H E S T R A D I O G R A P H I N T E R P R E T A T I O N / 1 - 1 5
RPS
LB
T
PLPA
LIPA
AJL
LAA
DA
LV
RA
RD
LD
SVC
RIPA
AV
CPA
*
Figure 1.1b: Normal Frontal Chest Radiograph

F R A N C I S J . C U R R Y N A T I O N A L T U B E R C U L O S I S C E N T E R
(This page intentionally left blank)
1 - 1 6 / B A S I C C H E S T R A D I O G R A P H I N T E R P R E T A T I O N

F R A N C I S J . C U R R Y N A T I O N A L T U B E R C U L O S I S C E N T E R
Figure 1.1c: Normal Lateral Chest Radiograph
Use the unmarked image in Figure 1.1c for comparison with Figure 1.1d on page 1-19.
B A S I C C H E S T R A D I O G R A P H I N T E R P R E T A T I O N / 1 - 1 7

F R A N C I S J . C U R R Y N A T I O N A L T U B E R C U L O S I S C E N T E R
Lateral Chest Radiograph
1. On the lateral view, the vertebral bodies (V) and intervertebral disc spaces ( )are visible posteriorly.
2. Anteriorly, you will see the sternum, and the portion of lung just beneath the sternum, called the retrosternal clear space (RSCS).
3. The trachea (T) is easily visualized on the lateral radiograph.
4. The orifice of the right upper lobe bronchus (RUL) appears as a circular lucency projecting over the continuation of the tracheal air column.
5. Just below the orifice of the right upper lobe bronchus, a soft tissue stripe is often visible. This stripe represents the posterior wall of the bronchus intermedius (arrowheads).
6. Just beneath the right upper lobe bronchus orifice, you may see a second circular lucency. This is the origin of the left upper lobe bronchus.
7. The left pulmonary artery (LPA) appears as a soft tissue density structure coursing over the left upper lobe bronchus.
8. The right pulmonary artery (RPA) is visible as a rounded soft tissue density. It is anterior and slightly inferior to the orifice of the right upper lobe bronchus.
9. An area known as the infrahilar window ( ) may be seen just beneath the right pulmonary artery. Normally, this area is relatively clear; it should contain only vessels and bronchi. Unexpected contours in this region raise suspicion for adenopathy (see Figure 1.11b on page 1-39).
10. Just below the right pulmonary artery, the left atrium (LA) is visible along the posterosuperior portion of the cardiac contour. Pulmonary veins (PV) may be seen as tubular or nodular soft tissue densities projecting over this region.
11. More inferiorly, you see the left ventricle (LV), which forms the posteroinferior cardiac contour.
12. The right ventricle (RV) comprises the anterior and superior portion of the cardiac contour on lateral radiographs. Right ventricular contours are rarely visible on frontal radiographs.
13. The aorta may variably be seen extending superiorly from the heart as the ascending aorta, then coursing posteriorly as the aortic arch (AA), and finally coursing inferiorly as the descending thoracic aorta.
14. The posterior costophrenic angles (PCPA) are visible inferiorly.
15. The right diaphragm (RD) and left diaphragm contours are visible inferiorly.
16. The inferior vena cava (IVC) may occasionally be seen as a curvilinear shadow with a concave posterior border along the inferior aspect of the heart intersecting the right diaphragm.
1 - 1 8 / B A S I C C H E S T R A D I O G R A P H I N T E R P R E T A T I O N
*
^

F R A N C I S J . C U R R Y N A T I O N A L T U B E R C U L O S I S C E N T E R
B A S I C C H E S T R A D I O G R A P H I N T E R P R E T A T I O N / 1 - 1 9
T
AA
LA
V
LV
RV
RPA
*
RUL LPARSCS
PCPA
PV
RD
IVC
Figure 1.1d: Normal Lateral Chest Radiograph
^

Now that you are familiar with the physical principles underlying the plain radiographic image, as wellas basic roentgen anatomy, we will look at the proper terms used to characterize and localize abnor-malities found on the chest radiograph. Each pattern of disease we discuss includes a specific radi-ographic example and its proper interpretation.
Using proper terms is essential for accurate characterization of chest abnormalities and to clearlycommunicate your findings to other physicians and medical staff. Accurately and precisely characteriz-ing an abnormality on a radiograph is the basis for generating differential diagnoses.
At the most basic level, when an area of increased density (“whiter”) is apparent on a radiograph, theterm “opacity” is used. Identifying an opacity does not necessarily localize the process within the lung;for example, an opacity may be parenchymal, pleural, extrapleural, or even outside the patient. Afteryou observe an abnormal opacity, you should attempt to localize it.
In other words, you should pinpoint the location of the abnormality by localizing the opacity as:
� Parenchymal (within the lung)
� Extraparenchymal (either within the pleural space or the chest wall)
� Mediastinal
� Outside the patient
With the notable exception of artifacts on the film, any opacity seen on a chest radiograph will belocated in one (or more) of the above potential locations. Accurately localizing the abnormality is fundamental to developing a reasonable differential diagnosis.
F R A N C I S J . C U R R Y N A T I O N A L T U B E R C U L O S I S C E N T E R
1 - 2 0 / B A S I C C H E S T R A D I O G R A P H I N T E R P R E T A T I O N

Interfaces
If two structures of the same density are next to each another, they will not be seen as separate structures. This is because there is no density difference to create an interface. The heart is a goodexample. Although the heart is made up of very different tissues (blood, muscle, pericardium, etc.),all of the heart’s tissues are of similar density. The heart appears as one discrete structure on plainradiographs because the x-ray beam “sees” only one density and thus one structure, as demonstrat-ed in Figure 1.2a.
As you can see, the limited density range that can be discriminated by the x-ray beam is a limitationof plain radiography. However, an understanding of the concept of differential x-ray absorption allowsyou to accurately localize and characterize pathology on chest radiographs. How this is accom-plished is illustrated by a basic plain radiographic finding known as the silhouette sign.
The Silhouette Sign
Figure 1.2a: Silhouette Sign
F R A N C I S J . C U R R Y N A T I O N A L T U B E R C U L O S I S C E N T E R
When an aerated lung contacts a structure of different density (such as the heart, mediastinum, ordiaphragm), and interface is created and, under normal conditions, you would see a boundary. InFigure 1.2a above, the arrowheads point to the normal right heart border. This interface is createdbecause the normally aerated lung (in this case the right middle lobe) contacts the right atrium.
B A S I C C H E S T R A D I O G R A P H I N T E R P R E T A T I O N / 1 - 2 1

F R A N C I S J . C U R R Y N A T I O N A L T U B E R C U L O S I S C E N T E R
When the air within the lung is replaced by another substance, such as when fluid fills the airspace(consolidated lung), the interface created by the aerated lung is lost, indicating an abnormal condition.
Consolidated lung parenchyma, whether it is due to pus, blood, tumor cells, or edema fluid, has adensity similar to water, just like the soft tissue of the heart, mediastinum, and diaphragm. When theconsolidated lung is adjacent to soft tissues (which have similar water density), such as the heart ormediastinum, the normal interface created by aerated lung is lost. The loss of the normal air-waterdensity interface (when the lung becomes consolidated) has been termed the silhouette sign. Theblack arrows in Figure 1.2a indicates the loss of the left diaphragmatic contour due to the presence ofthe adjacent consolidated lung.
Figure 1.2b: Silhouette Sign—Consolidation
In the lateral view in Figure 1.2b, note that the left diaphragm contour is obscured. The loss ofthe normally visualized diaphragm contour is the result of consolidation within the left lower lobecaused by bronchopneumonia, indicated by the arrows.
Familiarity with the concept of differential x-ray absorption not only helps you understand thenormal radiographic image but also helps you recognize pathologic alterations.
1 - 2 2 / B A S I C C H E S T R A D I O G R A P H I N T E R P R E T A T I O N

F R A N C I S J . C U R R Y N A T I O N A L T U B E R C U L O S I S C E N T E R
B A S I C C H E S T R A D I O G R A P H I N T E R P R E T A T I O N / 1 - 2 3
Assessing the Technical Quality of Radiographic Studies
Before a radiograph is interpreted, the reader should always assess the quality of the study. These technical parameters should be assessed:
� Exposure
� Proper Positioning
� Inspiratory effort
Exposure
A properly exposed radiograph allows faint visualization of the thoracic spine and intervertebral disc spaces as well as clear visualization of branching vessels through the heart. If the radiograph isunderexposed, it becomes difficult to “see through” the mediastinal contours and heart, and thus thelung parenchyma in these areas cannot be adequately visualized. On the other hand, if the radiographis overexposed, the film will appear “too black.” This situation may render small lung nodules or otherfaint pulmonary parenchymal opacities very difficult to see. This situation may be somewhat compen-sated for by the use of bright illumination (a bright or “hot” light).
Proper Positioning
A properly positioned radiograph shows the medial ends of the clavicles equidistantly positioned from the spinous processes of the vertebral bodies; essentially no patient rotation is present in this situation. Patient rotation does not necessarily render a radiograph uninterpretable, but it can create a confusing appearance.
The medial ends of the clavicles will usually overlie the junction of the medial ends of the first anteriorribs with the manubrium. When the clavicles are projected cranial to the first ribs, the projection is saidto be lordotic. Lordotic projections can be useful for visualizing the pulmonary apices, but such projec-tions are not desirable for routine frontal radiographs.
Inspiratory Effort
Full inspiration in normal patients usually results in the diaphragm projecting over the level of the tenth posterior ribs. When the diaphragm is projected below the eleventh posterior ribs, the lung volumesare usually considered abnormally large. This situation may reflect air trapping or obstructive pul-monary disease. When the diaphragm projects near or above the eighth posterior ribs, the lung vol-umes are abnormally low. This situation may reflect poor inspiratory effort or restrictive lung disease.
Low lung volumes often result in basilar vascular crowding and atelectasis and may create theappearance of interstitial lung disease or pneumonia in the lung bases. Additionally, low lung volumesoften create the appearance of cardiac enlargement. Caution must be exercised when interpretingradiographs with low lung volumes because significant disease can easily be overlooked, or the radi-ograph may be overinterpreted in this setting.

F R A N C I S J . C U R R Y N A T I O N A L T U B E R C U L O S I S C E N T E R
1 - 2 4 / B A S I C C H E S T R A D I O G R A P H I N T E R P R E T A T I O N
Chest Radiograph Interpretation: Basic Patterns of Disease
In the following section, we will discuss the appearance of basic patterns of disease on the chest radiograph. We will discuss how to use proper terminology to describe radiographic abnormalities andhow proper terminology allows you to correctly localize abnormal processes and generate accuratedifferential diagnoses. The basic patterns of disease visible on plain radiography and the acceptableterms to describe these disease patterns are as follows:
� Consolidation (or airspace filling)
� Interstitial (including linear and reticular opacities, small well-defined nodules, miliary patterns, and peribronchovascular thickening)
� Solitary nodule
� Mass
� Lymphadenopathy
� Cyst/cavity
� Pleural abnormalities
The remainder of this chapter will review these patterns in detail. Although you will occasionallyencounter cardiomediastinal contour abnormalities and abnormalities of the osseous and soft tissuestructures, they are beyond the scope of this work. The interested reader is referred to several excel-lent books and publications concerning chest radiograph interpretation listed at the end of this chapter.
When interpreting radiographs, it is important to understand that more than one of the above patternsmay be present simultaneously. Such radiographs can be quite challenging to interpret. You shouldattempt to synthesize multiple patterns into a single diagnosis when possible.
For example, the combination of a pulmonary nodule, an ipsilateral pleural effusion, and adenopathy is suggestive of bronchogenic carcinoma with nodal (and perhaps pleural) metastases. Occasionally it is simply not possible to combine several disease patterns into a single, unifying diagnosis.
Under such circumstances, it is often best to generate a differential diagnosis based on the dominantdisease pattern present.

Consolidation (Airspace Opacity)
Consolidation appears as a confluent, ill-defined opacity, effacing the normal shadows created by pulmonary blood vessels, and often displaying a tendency to extend to pleural surfaces (Figure 1.3,indicated by the obscured right diaphragm). Consolidation occurs when air within the pulmonaryparenchyma is replaced by another substance, such as blood, pus, water (i.e., edema), or tumor cells.
Air Bronchograms
An air bronchogram may be seen when consolidation is present. An air bronchogram is a manifesta-tion of the basic principle of differential x-ray absorption. Normally, air within bronchi is not visiblebecause normal bronchi are surrounded by aerated lung. When the alveoli are rendered airless, orconsolidated, bronchi become visible because the air within them is now contrasted with surroundingfluid density within the lung parenchyma. The air bronchogram is a fundamental sign of consolidation,or airspace filling, and confidently localizes an opacity on the chest radiograph as within the lungparenchyma.
Acinar Shadow
Another indication of airspace filling or consolidation, acinar shadows appear as ill-defined 4 to 8 mm opacities, presumed to represent opacification of the individual pulmonary acini. Multiple acinar shad-ows create the confluent, ill-defined opacity characteristic of consolidation described above.
Key Points
� Consolidation represents an airless lung; it occurs when air in the lung parenchyma is replaced by some other substance such as pus, blood, edema, or tumor cells.
� The air bronchogram is created when the consolidated lung surrounds air-filled bronchi, causing these bronchi to be visible.
F R A N C I S J . C U R R Y N A T I O N A L T U B E R C U L O S I S C E N T E R
B A S I C C H E S T R A D I O G R A P H I N T E R P R E T A T I O N / 1 - 2 5

Figure 1.3: Basic Features of Consolidation, or Airspace Opacity (also see Figure 1.2a and 1.2b)
Diagnosis
Right upper lobe pneumonia. Air bronchograms (arrows) are visible.
F R A N C I S J . C U R R Y N A T I O N A L T U B E R C U L O S I S C E N T E R
1 - 2 6 / B A S I C C H E S T R A D I O G R A P H I N T E R P R E T A T I O N
Consolidation (Airspace Opacity)

F R A N C I S J . C U R R Y N A T I O N A L T U B E R C U L O S I S C E N T E R
B A S I C C H E S T R A D I O G R A P H I N T E R P R E T A T I O N / 1 - 2 7
Interstitial Opacity: Linear and Reticular Opacity, Nodules, Miliary Pattern, and Peribronchovascular Thickening
Linear opacities, septal lines, reticular opacities, peribronchovascular thickening, nodules, and the miliary pattern are radiographic manifestations of interstitial lung disease. These patterns suggest adisease process localized to the pulmonary interstitium, as opposed to the airspace, and lead to specific differential diagnoses.
Linear Opacity: Septal Lines
� Occasionally, thin, 1–3 mm thick, straight lines, 1.5–2 cm in length, and perpendicular to the pleural surface, may be visible on radiographs. These opacities are called septal lines, or Kerley’s B lines, and they represent thickening of the interlobular septae.
� When these lines are 1–2 mm thick, 2–6 cm in length and extend from the hilum toward the periphery, they may be called Kerley’s A lines. These structures also represent thickened interlobular septae.
Reticulation
Reticulation refers to the multiple tiny lines that intersect each other at several angles, creating a netlike pattern on the chest radiograph.
Nodules
This term may be applied to opacities that are roughly circular, 2–30 mm in diameter, usually with fairly discrete borders. Nodules may be a manifestation of interstitial lung diseases, although they are not exclusively seen with diseases affecting the pulmonary interstitium. The term “mass” may beused when the nodule exceeds 30 mm in size.
Miliary Pattern
This term refers to numerous small nodules, approximately 2–3 mm in diameter, that are well-definedand diffuse in distribution.
Peribronchovascular Thickening
This is a qualitative term that refers to an increase in thickness of the bronchovascular bundles as they course peripherally from the hila. Any process that affects the following structures and theconnective tissue surrounding these structures may result in peribronchovascular thickening:
� Bronchial walls
� Bronchial mucosa
� Pulmonary arteries and veins
� Lymphatics
The term “peribronchovascular thickening” is a subjective descriptor that requires a fair amount of experience to apply accurately.

F R A N C I S J . C U R R Y N A T I O N A L T U B E R C U L O S I S C E N T E R
1 - 2 8 / B A S I C C H E S T R A D I O G R A P H I N T E R P R E T A T I O N
Figure 1.4 demonstrates numerous abnormalities but one feature in particular is characteristic of interstitial opacity: septal lines or Kerley’s B lines (arrows).
Key Points
� Kerley’s B lines are thin, linear opacities perpendicular to the pleural surface. In this radiograph, they are best visualized in the lateral portion of the thorax.
� Kerley’s B lines represent thickening of the interlobular septae.
Diagnosis
Congestive heart failure
Linear Opacities
Figure 1.4: Linear Opacity

F R A N C I S J . C U R R Y N A T I O N A L T U B E R C U L O S I S C E N T E R
B A S I C C H E S T R A D I O G R A P H I N T E R P R E T A T I O N / 1 - 2 9
Reticulation
Figure 1.5: Reticulation
Figure 1.5 demonstrates features consistent with an interstitial lung process. Note the basal andperipheral distribution and low lung volumes. Specific features visible are:
� Linear opacity (small double arrows)
� Reticular opacity (single arrows)
� Diminished lung volumes
� Basal and peripheral distribution
Key Point
� The reticular opacity is the result of many intersecting lines (or linear opacities), creating a netlike pattern. In Figure 1.5, this pattern is most readily appreciated peripherally, in the regions outlined by arrows.
Diagnosis
Idiopathic pulmonary fibrosis

F R A N C I S J . C U R R Y N A T I O N A L T U B E R C U L O S I S C E N T E R
1 - 3 0 / B A S I C C H E S T R A D I O G R A P H I N T E R P R E T A T I O N
Nodules
Figure 1.6: Nodules
Figure1.6 demonstrates features characteristic of interstitial opacity:
� Nodules—small, discrete, with an upper lung predominance (arrows)
� Linear opacity (arrowheads)
Key Point
� The mid- and upper-lung predominance of small nodules, in combination with linear abnormalities, is highly suggestive of sarcoidosis, a common interstitial process.
Diagnosis
Sarcoidosis

F R A N C I S J . C U R R Y N A T I O N A L T U B E R C U L O S I S C E N T E R
B A S I C C H E S T R A D I O G R A P H I N T E R P R E T A T I O N / 1 - 3 1
Figure 1.7 demonstrates characteristics suggestive of an interstitial process:
� Small, well-defined nodules (arrows) scattered diffusely throughout the lung parenchyma, representing a miliary pattern
Key Points
� The presence of small, well-defined nodules, approximately 2–3 mm in diameter and scattered diffusely throughout the lung parenchyma, is characteristic of a miliary pattern.
� While tuberculosis is a common cause of miliary nodules, other etiologies such as fungal disease, metastatic disease, pneumoconiosis, and sarcoidosis, may result in this pattern.
Diagnosis
Miliary tuberculosis
Miliary Pattern
Figure 1.7: Miliary Pattern

F R A N C I S J . C U R R Y N A T I O N A L T U B E R C U L O S I S C E N T E R
1 - 3 2 / B A S I C C H E S T R A D I O G R A P H I N T E R P R E T A T I O N
Figure 1.8 demonstrates features of interstitial opacity:
� Thickening of the bronchovascular bundles as they course inferiorly from the hila (arrows)
Key Point
� Peribronchovascular thickening is another type of interstitial opacity that occurs when the bronchovascular structures emanating from the hila appear thickened. This may be due to disease infiltration along bronchial walls, inflammatory processes involving the mucosa of the bronchi, thickening of the connective tissue framework of the lung (the pulmonary interstitium), or pathologic alterations of pulmonary vessels themselves.
Diagnosis
Pulmonary Kaposi’s sarcoma
Peribronchovascular Thickening
Figure 1.8: Peribronchovascular Thickening

F R A N C I S J . C U R R Y N A T I O N A L T U B E R C U L O S I S C E N T E R
B A S I C C H E S T R A D I O G R A P H I N T E R P R E T A T I O N / 1 - 3 3
Self-Check OneThe following self-check will help you assess your understanding of the previous material.
After completing the self-check, look at the answers on page 1-52. Review the subjects in the previous pages to clarify any answers you have missed.
1. The radiograph in Figure 1.9 displays which of the following abnormalities?
Figure 1.9
A. Peribronchovascular thickening
B. Small nodules
C. Reticulation

F R A N C I S J . C U R R Y N A T I O N A L T U B E R C U L O S I S C E N T E R
1 - 3 4 / B A S I C C H E S T R A D I O G R A P H I N T E R P R E T A T I O N
Self-Check One (continued)
Match the terms with the definitions. Write the letter of the term next to its correct definition. One of the items is not defined.
2. A particular type of nodule, approximately 2 mm in diameter with well-defined borders, diffusely distributed throughout the lungs.
3. Multiple tiny lines that intersect each other at several angles, creating a netlike pattern on the chest radiograph.
4. Commonly seen in the subpleural regions of the inferior and lateral lung, thin lines perpendicular to the pleural surface representing thickened interlobular septae.
5. Opacity that occurs outside the airspace but within the connective tissue framework of the lung.
6. The loss of the normal air-water density interface that occurs when the lung becomes consolidated.
A. Interstitial opacity
B. Reticulation
C. Septal lines
D. Silhouette sign
E. Miliary pattern
F. Mass

F R A N C I S J . C U R R Y N A T I O N A L T U B E R C U L O S I S C E N T E R
B A S I C C H E S T R A D I O G R A P H I N T E R P R E T A T I O N / 1 - 3 5
Chest Radiograph Interpretation: Other Radiographic Patterns of Disease
Use of the proper terminology not only accurately characterizes lesions but also necessarily evokesdifferential diagnostic possibilities. In addition to the patterns of consolidation (airspace filling) andinterstitial opacities described above, there are many other radiographic patterns of disease. You needto be familiar with these other patterns for proper disease characterization. These additional patternswill be discussed in the broad categories below:
� Nodules and masses
� Adenopathy
� Cysts and cavities
� Pleural disease
� Cardiomediastinal contour abnormalities
� Soft tissue and osseous abnormalities
Nodules and Masses
Nodules A nodule is a discrete opacity on a chest radiograph measuring 2–30 mm in diameter. The descriptionof a nodule should be qualified with respect these factors:
� Number
� Size
� Border characteristics
� Location
� Presence or absence of calcification
You have learned about nodules as manifestations of interstitial opacities. However, there is often significant overlap between the radiographic appearances of interstitial and airspace opacities.Nodules often represent a primary airspace disease process, particularly when the nodules areinflammatory in etiology. Also keep in mind that both airspace disease and interstitial abnormalitiesmay coexist.
Correct characterization often depends on integration of the patient’s clinical history as well as on theoverall pattern on the chest radiograph. For example, if linear opacities accompany a nodule, then aninterstitial process may be most likely; when nodules are seen in conjunction with consolidation, anairspace etiology may be more likely.
Masses
Masses are similar to nodules in many respects. The term “mass” is used when the discrete opacity on the radiograph is greater than 30 mm in diameter. Masses may occur with airspace disease, inter-stitial disease, or both. As with nodules, masses should be characterized with regard to number, size, border characteristics, location, and presence or absence of calcification.

F R A N C I S J . C U R R Y N A T I O N A L T U B E R C U L O S I S C E N T E R
1 - 3 6 / B A S I C C H E S T R A D I O G R A P H I N T E R P R E T A T I O N
Figure 1.10 demonstrates a right upper lobe pulmonary mass—a solitary circumscribed area ofincreased density measuring greater than 30 mm in diameter (arrows).
Key Points
� Nodules and masses are discrete areas of increased lung opacity whose borders do not conform to anatomic divisions (such as a fissure).
� Masses are similar to nodules except that they are larger, measuring greater than 30 mm in diameter.
� Nodules and masses should be described by noting their size, the sharpness of their borders, their number, their location, and the presence or absence of calcification.
Diagnosis
Bronchogenic carcinoma
Mass
Figure 1.10: Mass

F R A N C I S J . C U R R Y N A T I O N A L T U B E R C U L O S I S C E N T E R
B A S I C C H E S T R A D I O G R A P H I N T E R P R E T A T I O N / 1 - 3 7
Lymphadenopathy
Enlarged lymph nodes appear on the chest radiograph as soft tissue densities in characteristic locations. These locations include:
� Right paratracheal area
� Hila
� Aorticopulmonary window
� Subcarinal region
� Superior mediastinum
� Supraclavicular area
� Paraspinous region
� Retrosternal area on the lateral radiograph (internal mammary lymphadenopathy)
One or more regions may be involved, and, in certain conditions, nodes may calcify. Differential diagnosis depends on the presence of other features on the radiograph and the clinical context.

F R A N C I S J . C U R R Y N A T I O N A L T U B E R C U L O S I S C E N T E R
1 - 3 8 / B A S I C C H E S T R A D I O G R A P H I N T E R P R E T A T I O N
Figure 1.11a demonstrates the following:
� Right paratracheal stripe thickening (straight arrows)� Bilateral lobular hilar enlargement (curved arrows)
Key Points
� An abnormal opacity in the right paratracheal region can be seen with intrathoracic goiter, tortuous vasculature, and adenopathy, among other less common causes.
� Hilar enlargement may be due to adenopathy, although vascular enlargement with pulmonary arterial hypertension may result in a similar appearance.
� Hilar enlargement due to pulmonary arterial hypertension is often smooth. � Hilar enlargement due to adenopathy is frequently lobular.
Diagnosis
Sarcoidosis
Lymphadenopathy
Figure 1.11a: Lymphadenopathy on Frontal Chest Radiograph

F R A N C I S J . C U R R Y N A T I O N A L T U B E R C U L O S I S C E N T E R
B A S I C C H E S T R A D I O G R A P H I N T E R P R E T A T I O N / 1 - 3 9
Figure 1.11b demonstrates the following:
� Abnormal soft tissue opacity inferior to the right pulmonary artery, filling the normally clear area known as the infrahilar window (curved arrow)
� Increased thickness of the posterior wall of the bronchus intermedius and lower lobe bronchi (small arrows); compare with the normal lateral chest radiograph in Figure 1.1d, page 1-19
Key Points
� Lymphadenopathy is often best visualized on the lateral radiograph, when it fills the normally clear infrahilar window with an unexpected contour. This fact underscores the need for a thorough understanding of basic anatomy on this view.
� Thickening of the posterior wall of the bronchus intermedius may be due to lymphadenopathy, tumor, or edema.
Diagnosis
Sarcoidosis
Lymphadenopathy
Figure 1.11b: Lymphadenopathy on Lateral Chest Radiograph

F R A N C I S J . C U R R Y N A T I O N A L T U B E R C U L O S I S C E N T E R
1 - 4 0 / B A S I C C H E S T R A D I O G R A P H I N T E R P R E T A T I O N
Mediastinal Lymphadenopathy
Figure 1.12: Mediastinal Lymphadenopathy
Figure 1.12 demonstrates an unexpected contour medial to the right interlobar pulmonary artery (straightarrows). The right paratracheal stripe is widened (short thick arrow), and an abnormal contour is seenalong the left aspect of the mediastinum in the region of the aortic arch (curved arrow). In this radiographyou can see:
� Abnormal right and left cardiomediastinal contours� A right upper lobe nodule (circle)
Key Points
� The appearance of the abnormal contour along the right aspect of the mediastinum (straight arrows) is characteristic of lesions in the subcarinal region; such lesions include lymphadenopathy and bronchogenic cysts.
� The abnormal left mediastinal contour is created because abnormal soft tissue opacity within the mediastinum is forming a border with the adjacent lung, creating a new, unexpected contour (curved arrow). This is how mediastinal lymphadenopathy becomes visible on the chest radiograph.
Diagnosis
Mediastinal adenopathy and lung nodule from small cell lung carcinoma

F R A N C I S J . C U R R Y N A T I O N A L T U B E R C U L O S I S C E N T E R
B A S I C C H E S T R A D I O G R A P H I N T E R P R E T A T I O N / 1 - 4 1
Cysts and Cavities
Pulmonary cysts and cavities manifest as focal lucent areas on chest radiographs and may besimplistically thought of as “holes in the lung.”
Pulmonary Cysts
Pulmonary cysts are focal pulmonary parenchymal spaces that do not contain lung but that are filled with either air or fluid or both. They may be congenital or acquired. Usually they have thin walls, which may be composed of cellular elements.
Pulmonary Cavities
Pulmonary cavities are areas of pulmonary parenchymal space that do not contain lung but that are filled with either air or fluid or both. Cavities are created by tissue necrosis within a nodule or mass, and they become air-filled when the necrotic elements are expelled into the tracheobronchial tree.
Pulmonary cysts and cavities are characterized by noting:
� their distribution
� their number
� the character of the inner lining
� the thickness of the wall (at the thickest portion, not including air-fluid levels) and
� the nature of the contents of the lesion.
Other causes of focal lucent areas on the chest radiograph include bronchiectasis and emphysema.

F R A N C I S J . C U R R Y N A T I O N A L T U B E R C U L O S I S C E N T E R
1 - 4 2 / B A S I C C H E S T R A D I O G R A P H I N T E R P R E T A T I O N
Pulmonary Cysts and Cavities
Figure 1.13: Cavity Due to Squamous Cell Carcinoma
Figure 1.13 demonstrates localized lucent area in the left lung apex (arrows). A pulmonary cavity is acircumscribed lucent area within the lung containing air and/or fluid, surrounded by a wall of variablethickness resulting from necrosis of pulmonary parenchyma.
Key Points
� Focal lucent areas within the lung may result from cavities, cysts, emphysema, and bronchiectasis. � Pulmonary cysts differ from cavities in that cavities are created by necrosis of lung parenchyma,
whereas true cysts are formed by other means. � Pulmonary cavities may result from infection, neoplasm, and infarction. � Pulmonary cysts commonly result from infections, trauma, or toxic ingestion, as well as other
rare etiologies.
Diagnosis
Squamous cell lung carcinoma

Pleural Disease
Pleural disease has many manifestations. Probably the most common and familiar form is pleural effusion.
Pleural Effusion
Effusions may be first detected on lateral radiographs as blunting of the posterior costophrenic angles. Effusions have many appearances on chest radiographs, ranging from such blunting of thecostophrenic angle to complete opacification of an entire hemithorax, with mass effect on the cardiomediastinal silhouette.
Pleural Thickening
Occasionally pleural diseases may manifest nonspecifically as thickening. Thickening is revealed by the nondependent (nonlayering) nature of the opacity on decubitus radiographs. Nodular pleural thickening may suggest malignancy. The risk of malignancy is incrementally increased by thepresence of any of the following patterns:
� is nodular
� is greater than 1 cm
� involves the entire circumference of the hemithorax
� involves mediastinal and/or fissural pleural surfaces or
� is accompanied by volume loss.
Calcification
Pleural processes may calcify, particularly in prior tuberculous empyemas, prior hemothoraces, and asbestos-related pleural disease.
Pleural AbnormalitiesThe radiograph in Figure 1.14 demonstrates extensive opacity in the lateral aspect of the right hemithorax, creating a very smooth, discrete interface with adjacent lung (arrows). This radi-ograph demonstrates:
� Large left pleural effusion
� Left lung consolidation
F R A N C I S J . C U R R Y N A T I O N A L T U B E R C U L O S I S C E N T E R
B A S I C C H E S T R A D I O G R A P H I N T E R P R E T A T I O N / 1 - 4 3

F R A N C I S J . C U R R Y N A T I O N A L T U B E R C U L O S I S C E N T E R
1 - 4 4 / B A S I C C H E S T R A D I O G R A P H I N T E R P R E T A T I O N
Pleural Abnormalities
Figure 1.14: Pleural Effusion
Key Points
� Because pleural abnormalities are, by definition, outside the lung parenchyma (extraparenchymal), an air bronchogram cannot be seen.
� Pleural abnormalities are usually homogeneous opacities.
� In the upright patient a pleural effusion will form a curvilinear interface with aerated lung that resembles a meniscus. This occurs because the pleural fluid settles dependently within the pleural space.
� In the supine patient, a pleural effusion may layer posteriorly in a dependent fashion, creating a hazy opacity over the entire involved hemithorax.
� When pleural effusions are loculated, they may appear nondependent. Focal pleural thickening or neoplasms involving the pleura may occasionally have a similar appearance.
Diagnosis
Large left pleural effusion (arrows delineate meniscus) secondary to congestive heart failure

F R A N C I S J . C U R R Y N A T I O N A L T U B E R C U L O S I S C E N T E R
B A S I C C H E S T R A D I O G R A P H I N T E R P R E T A T I O N / 1 - 4 5
Cardiomediastinal Contour Abnormalities and Soft Tissue and Osseous Abnormalities
Cardiomediastinal contour abnormalities are apparent on plain radiography because they causeunexpected interfaces with an adjacent lung. However, a discussion of cardiomediastinal abnormali-ties and soft tissue and bone abnormalities on chest radiography is beyond the scope of this primer.The interested reader is directed to several excellent references regarding chest radiograph interpre-tation listed at the end of this chapter.
F R A N C I S J . C U R R Y N A T I O N A L T U B E R C U L O S I S C E N T E R
1 - 4 6 / B A S I C C H E S T R A D I O G R A P H I N T E R P R E T A T I O N
Self-Check Two
The following self-check will help you assess your understanding of the previous material. Circle the best answer for each of the following statements.
After completing the self-check, look at the answers on page 1-52. Review the subjects in the previ-ous pages to clarify any answers you have missed.
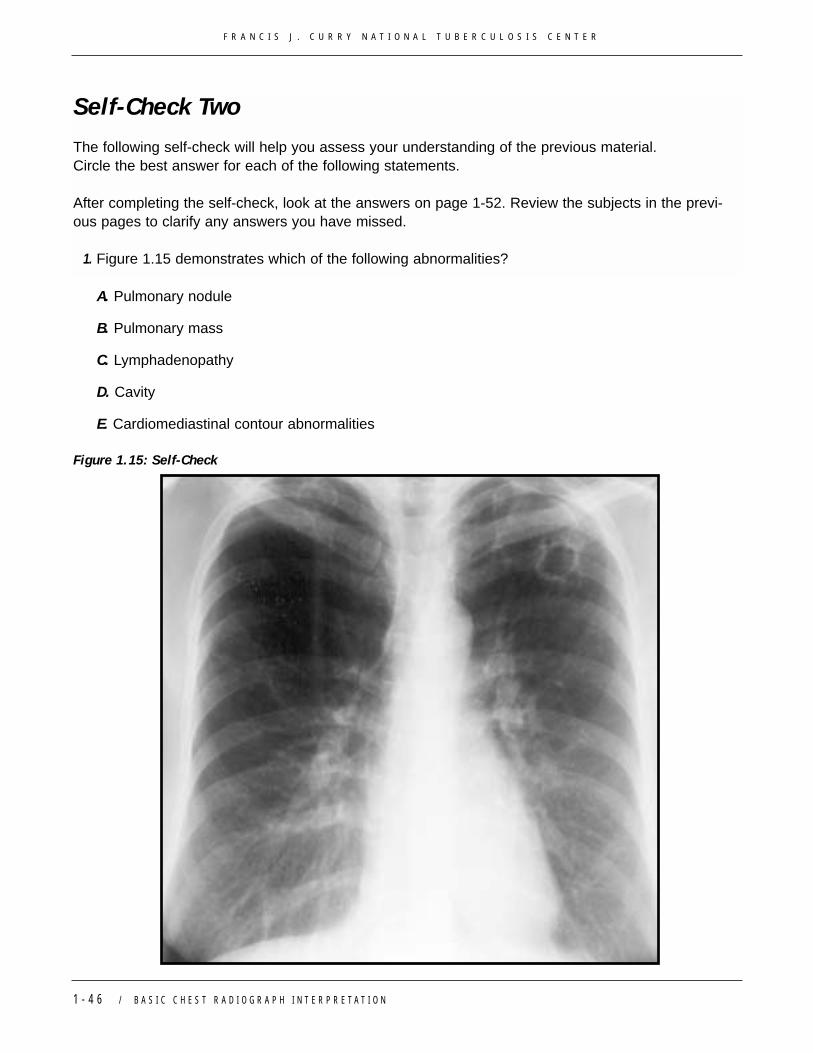
1. Figure 1.15 demonstrates which of the following abnormalities?
A. Pulmonary nodule
B. Pulmonary mass
C. Lymphadenopathy
D. Cavity
E. Cardiomediastinal contour abnormalities
Figure 1.15: Self-Check

F R A N C I S J . C U R R Y N A T I O N A L T U B E R C U L O S I S C E N T E R
B A S I C C H E S T R A D I O G R A P H I N T E R P R E T A T I O N / 1 - 4 7
Circle the best answer for each of the following statements.
2. Lymphadenopathy appears on the chest radiograph as soft tissue densities in characteristic locations such as:
A. Right paratracheal area
B. Aorticopulmonary window
C. Paraspinous region
D. Subcarinal region
E. All of the above
3. Pulmonary nodules may be single or multiple and can manifest on the radiograph as:
A. Airspace opacities
B. Interstitial opacities
C. Focal lucent areas
D. A and B
E. B and C
4. Pulmonary cavities are created by necrosis of lung parenchyma resulting from:
A. Infection
B. Neoplasm
C. Infarction
D. All of the above
E. None of the above
F R A N C I S J . C U R R Y N A T I O N A L T U B E R C U L O S I S C E N T E R
1 - 4 8 / B A S I C C H E S T R A D I O G R A P H I N T E R P R E T A T I O N
5. These become apparent on plain radiography because the abnormality causes an unexpected interface with an adjacent lung.
6. Focal pulmonary parenchymal spaces that do not contain lung but are filled with either air or fluid or both.
7. A fluid collection that creates a curvilinear interface with aerated lung that resembles a meniscus.
8. Discrete opacity on a radiograph that is greater than 30 mm in diameter.
Self-Check Two (continued)
Match the definitions with the terms in the right column. Write the letter of the term next to itscorrect definition. One of the terms is not defined.
A. Pulmonary cysts
B. Reticulation
C. Pleural effusion
D. Cardiomediastinal contour abnormalities
E. Mass

F R A N C I S J . C U R R Y N A T I O N A L T U B E R C U L O S I S C E N T E R
B A S I C C H E S T R A D I O G R A P H I N T E R P R E T A T I O N / 1 - 4 9
A Final Word About Evaluating the Entire Radiograph
Although it seems obvious to state that one must evaluate the entire radiograph, this point cannotbe overemphasized. In particular, certain areas of the radiograph that are either difficult to examineor are often overlooked include:
� the left and right retrocardiac areas (behind the heart)� the apices� the hilar regions� and below the diaphragm.
Figure 1.16: Right Lower Lobe Lung Carcinoma
Figure 1.16 demonstrates an unusual contour seen “through” the medial aspect of the right upperabdomen, just below the base of the right heart (arrows).

F R A N C I S J . C U R R Y N A T I O N A L T U B E R C U L O S I S C E N T E R
1 - 5 0 / B A S I C C H E S T R A D I O G R A P H I N T E R P R E T A T I O N
Figure 1.17: CT Scan: Right Lower Lobe Lung Carcinoma
CT scan of the chest (Figure 1.17 ) of the patient in Figure 1.16 reveals an irregular mass in themedial aspect of the right lower lobe (arrows). This lesion was proven to represent carcinoma atbiopsy. Note how the lesion lies posterior to the right heart; this position makes it somewhat diffi-cult to detect with chest radiography.
You must use your knowledge of normal roentgen anatomy to actively “look through” the heart anddiaphragm to evaluate the underlying pulmonary parenchyma. In the apices and hilar regions, youmust mentally subtract the overlying bones and vascular structures to “see through” them to evalu-ate the underlying pulmonary parenchyma.
When required, apical lordotic views may provide better visualization of the lung apices. Frontal shallow oblique radiographs with 5–10o obliquity are occasionally useful to distinguish superim-posed shadows that may create the appearance of a pulmonary nodule from a true pulmonarynodule.
Distribution of Disease
After an abnormality is identified, the distribution of the finding should be noted. Diseases affectingthe pulmonary parenchyma are broadly characterized as having an upper, middle, or lower lung distribution. For example, upper lobe, predominantly small nodules and linear opacities, particular-ly with bilateral hilar lymphadenopathy, suggest the diagnosis of sarcoidosis. Characterization of aprocess as either central or peripheral may also evoke a specific differential diagnosis. Patchymigratory and peripheral consolidations, for example, are common manifestations of either eosin-ophilic pneumonia or organizing pneumonia. Finally, a disease process may be characterized asfocal, multifocal, or diffuse. Proper characterization of disease distribution often allows the genera-tion of a limited differential diagnosis.

F R A N C I S J . C U R R Y N A T I O N A L T U B E R C U L O S I S C E N T E R
B A S I C C H E S T R A D I O G R A P H I N T E R P R E T A T I O N / 1 - 5 1
Conclusion
A basic understanding of the physics underlying chest radiography is required to understand thepower and limitations of plain radiography as well as to properly characterize pathology.Furthermore, a working understanding of normal roentgen anatomy is necessary to distinguish normal tissue from abnormal tissue and to accurately localize disease processes.
To construct an ordered differential diagnosis, you must
� understand and use the proper terminology to characterize abnormalities identified on the chest radiograph
� and clearly note the distribution of the findings.
Carefully scrutinize the entire radiograph, paying special attention to particular areas of the radiograph that are often overlooked, to ensure that you do not miss significant abnormalities.

F R A N C I S J . C U R R Y N A T I O N A L T U B E R C U L O S I S C E N T E R
1 - 5 2 / B A S I C C H E S T R A D I O G R A P H I N T E R P R E T A T I O N
ReferencesAustin JH, Muller NL, Friedman PJ, et al. Glossary of terms for CT of the lungs: recommendations ofthe Nomenclature Committee of the Fleischner Society. Radiology. 1996;200:327-331.
Fraser RA, Muller NL, Colman N, Pare PD. Diagnosis of DIseases of the Chest. In: Fraser RA, MullerNL, Colman N, Pare PD, eds. Diagnosis of Diseases of the Chest. Philadelphia, PA: WB Saunders;1999:33-50, 77-104.
Tuddenham WJ, and the Nomenclature Committee of the Fleischner Society. Glossary of terms forthoracic radiology: recommendations of the Nomenclature Committee of the Fleischner Society. Am J Roentgenol. 1984;143:509-517.
Self-Check Answers
Self-Check One
1. B2. E3. B4. C5. A6. D
Self-Check Two
1. D2. E3. D4. D5. D6. A7. C8. E