Study on Heat and Mass Transfer During Urea Prilling Process

1
Gaseous Emissions in the Fertilizer Industry and
Their Impact on Specific Energy Consumption Per Tonne Of Product
A Presentation On
ByDr. S. Chandra
Department of Fertilizers Ministry of Chemicals & Fertilizers
A-Wing, Shastri BhawanNew Delhi - 110 001
INDIA
Objectives of the StudyObjectives of the StudyTo analyze the trends of To analyze the trends of gaseous pollutantgaseous pollutant’’s s emissions in :emissions in :-- Fertilizer Plants based Fertilizer Plants based on the Latest Process on the Latest Process Technologies andTechnologies and
-- The Old Generation The Old Generation Fertilizer Plants Fertilizer Plants
visvis--àà--vis vis its relation with specific its relation with specific energy consumption per energy consumption per TonneTonne of of Product Product andand
Impact on human beings, Impact on human beings, animals, plants and animals, plants and environment etc.environment etc.
Current Study is confined to Urea and its intermediate product Ammonia only.
2
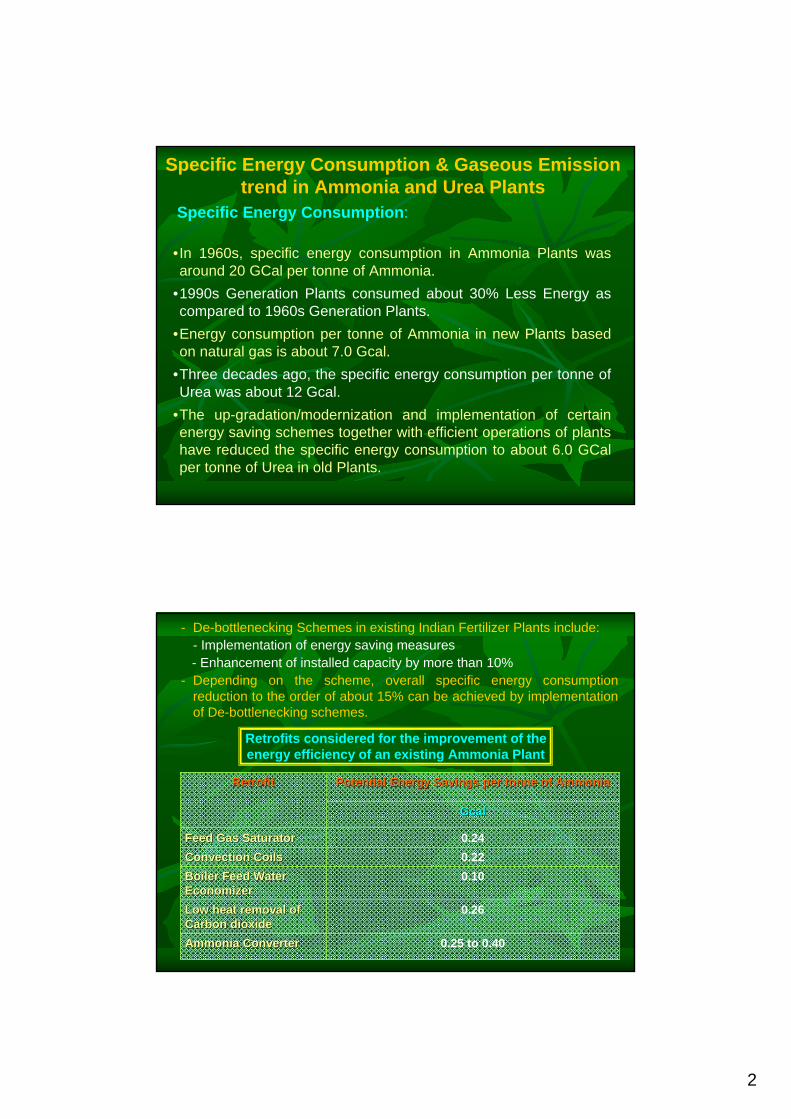
Specific Energy Consumption & Gaseous Emission trend in Ammonia and Urea Plants
Specific Energy Consumption:
•In 1960s, specific energy consumption in Ammonia Plants was around 20 GCal per tonne of Ammonia.
•1990s Generation Plants consumed about 30% Less Energy as compared to 1960s Generation Plants.
•Energy consumption per tonne of Ammonia in new Plants based on natural gas is about 7.0 Gcal.
•Three decades ago, the specific energy consumption per tonne of Urea was about 12 Gcal.
•The up-gradation/modernization and implementation of certain energy saving schemes together with efficient operations of plants have reduced the specific energy consumption to about 6.0 GCal per tonne of Urea in old Plants.
- De-bottlenecking Schemes in existing Indian Fertilizer Plants include:- Implementation of energy saving measures - Enhancement of installed capacity by more than 10%
- Depending on the scheme, overall specific energy consumption reduction to the order of about 15% can be achieved by implementation of De-bottlenecking schemes.
Retrofits considered for the improvement of theenergy efficiency of an existing Ammonia Plant
0.25 to 0.40Ammonia ConverterAmmonia Converter
0.26Low heat removal of Low heat removal of Carbon dioxideCarbon dioxide
0.10Boiler Feed Water Boiler Feed Water EconomizerEconomizer
0.22Convection CoilsConvection Coils0.24Feed Gas Saturator Feed Gas Saturator
GcalGcal
Potential Energy Savings per tonne of Ammonia Potential Energy Savings per tonne of Ammonia RetrofitRetrofit
3
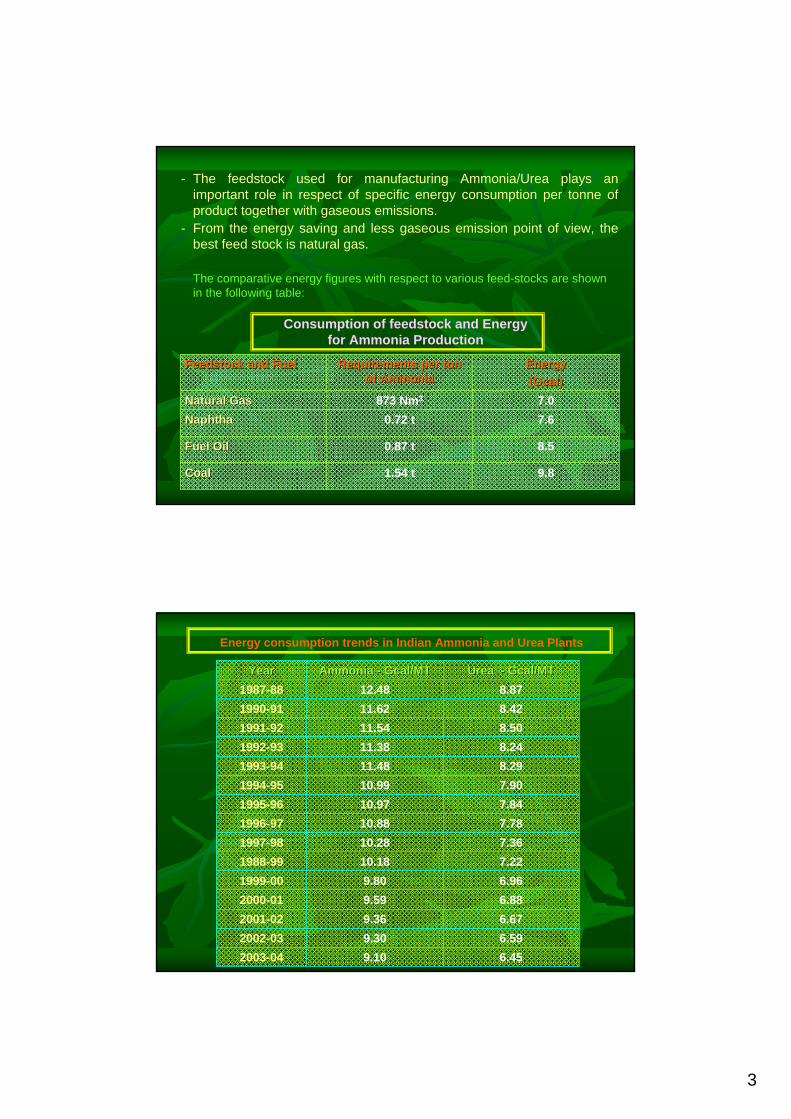
- The feedstock used for manufacturing Ammonia/Urea plays an important role in respect of specific energy consumption per tonne of product together with gaseous emissions.
- From the energy saving and less gaseous emission point of view, the best feed stock is natural gas.
9.81.54 tCoalCoal
8.50.87 tFuel OilFuel Oil
7.60.72 tNaphthaNaphtha7.0873 Nm3Natural GasNatural Gas
EnergyEnergy(Gcal)(Gcal)
Requirements per ton Requirements per ton of Ammoniaof Ammonia
Feedstock and Fuel Feedstock and Fuel
Consumption of feedstock and Energy for Ammonia Production
The comparative energy figures with respect to various feed-stocks are shown in the following table:
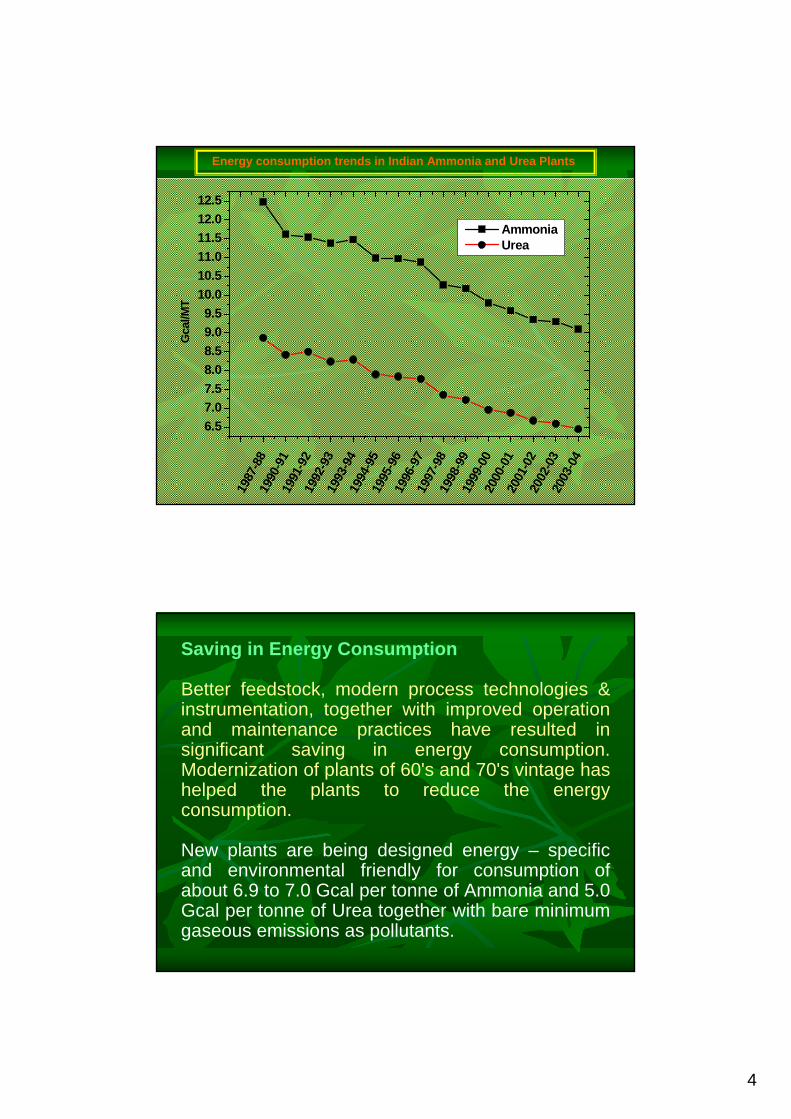
Energy consumption trends in Indian Ammonia and Urea Plants
6.459.102003-046.599.302002-036.679.362001-026.889.592000-016.969.801999-007.2210.181988-997.3610.281997-987.7810.881996-977.8410.971995-967.9010.991994-958.2911.481993-948.2411.381992-938.5011.541991-928.4211.621990-918.8712.481987-88
Urea Urea -- Gcal/MTGcal/MTAmmonia Ammonia -- Gcal/MTGcal/MTYearYear
4
1987
-88
1990
-91
1991
-92
1992
-93
1993
-94
1994
-95
1995
-96
1996
-97
1997
-98
1998
-99
1999
-00
2000
-01
2001
-02
2002
-03
2003
-04
6.57.07.58.08.59.09.5
10.010.511.011.512.012.5
G
cal/M
T
Ammonia Urea
Energy consumption trends in Indian Ammonia and Urea Plants
Saving in Energy Consumption
Better feedstock, modern process technologies & instrumentation, together with improved operation and maintenance practices have resulted in significant saving in energy consumption. Modernization of plants of 60's and 70's vintage has helped the plants to reduce the energy consumption.
New plants are being designed energy – specific and environmental friendly for consumption of about 6.9 to 7.0 Gcal per tonne of Ammonia and 5.0 Gcal per tonne of Urea together with bare minimum gaseous emissions as pollutants.
5
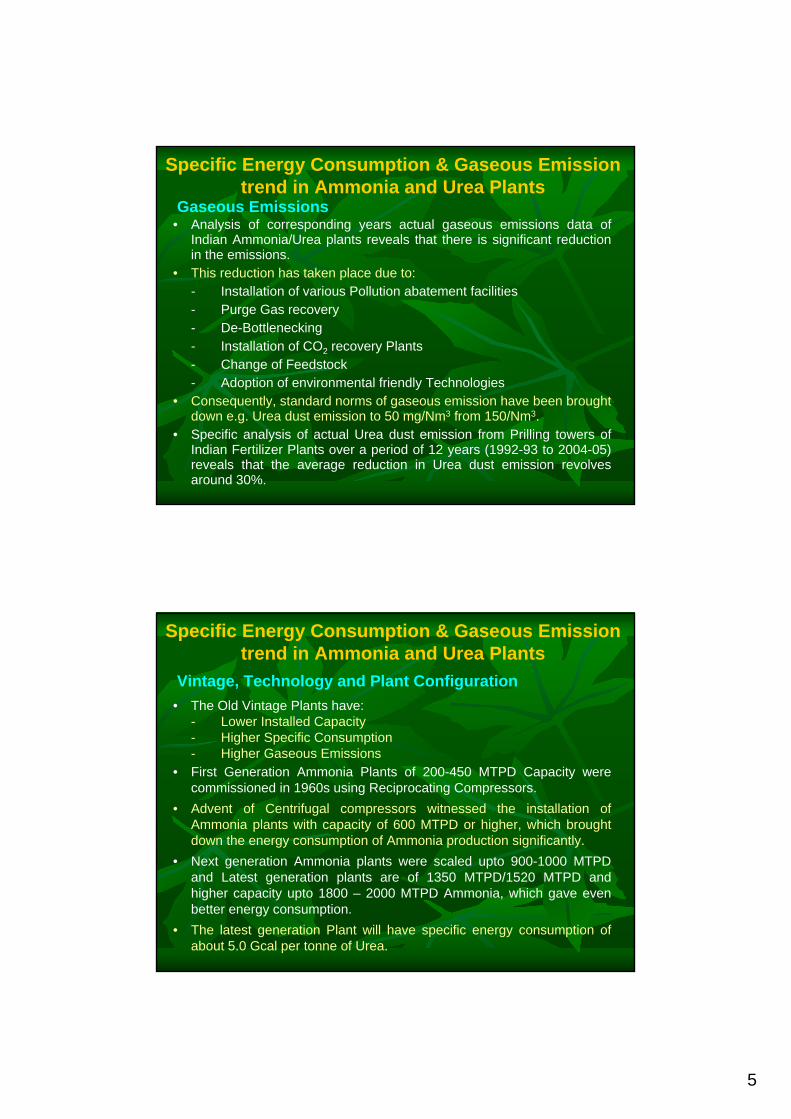
Specific Energy Consumption & Gaseous Emission trend in Ammonia and Urea Plants
Gaseous Emissions• Analysis of corresponding years actual gaseous emissions data of
Indian Ammonia/Urea plants reveals that there is significant reduction in the emissions.
• This reduction has taken place due to:- Installation of various Pollution abatement facilities- Purge Gas recovery- De-Bottlenecking- Installation of CO2 recovery Plants- Change of Feedstock- Adoption of environmental friendly Technologies
• Consequently, standard norms of gaseous emission have been brought down e.g. Urea dust emission to 50 mg/Nm3 from 150/Nm3.
• Specific analysis of actual Urea dust emission from Prilling towers of Indian Fertilizer Plants over a period of 12 years (1992-93 to 2004-05) reveals that the average reduction in Urea dust emission revolves around 30%.
Specific Energy Consumption & Gaseous Emission trend in Ammonia and Urea Plants
Vintage, Technology and Plant Configuration• The Old Vintage Plants have:
- Lower Installed Capacity- Higher Specific Consumption- Higher Gaseous Emissions
• First Generation Ammonia Plants of 200-450 MTPD Capacity were commissioned in 1960s using Reciprocating Compressors.
• Advent of Centrifugal compressors witnessed the installation of Ammonia plants with capacity of 600 MTPD or higher, which brought down the energy consumption of Ammonia production significantly.
• Next generation Ammonia plants were scaled upto 900-1000 MTPD and Latest generation plants are of 1350 MTPD/1520 MTPD and higher capacity upto 1800 – 2000 MTPD Ammonia, which gave even better energy consumption.
• The latest generation Plant will have specific energy consumption of about 5.0 Gcal per tonne of Urea.
6
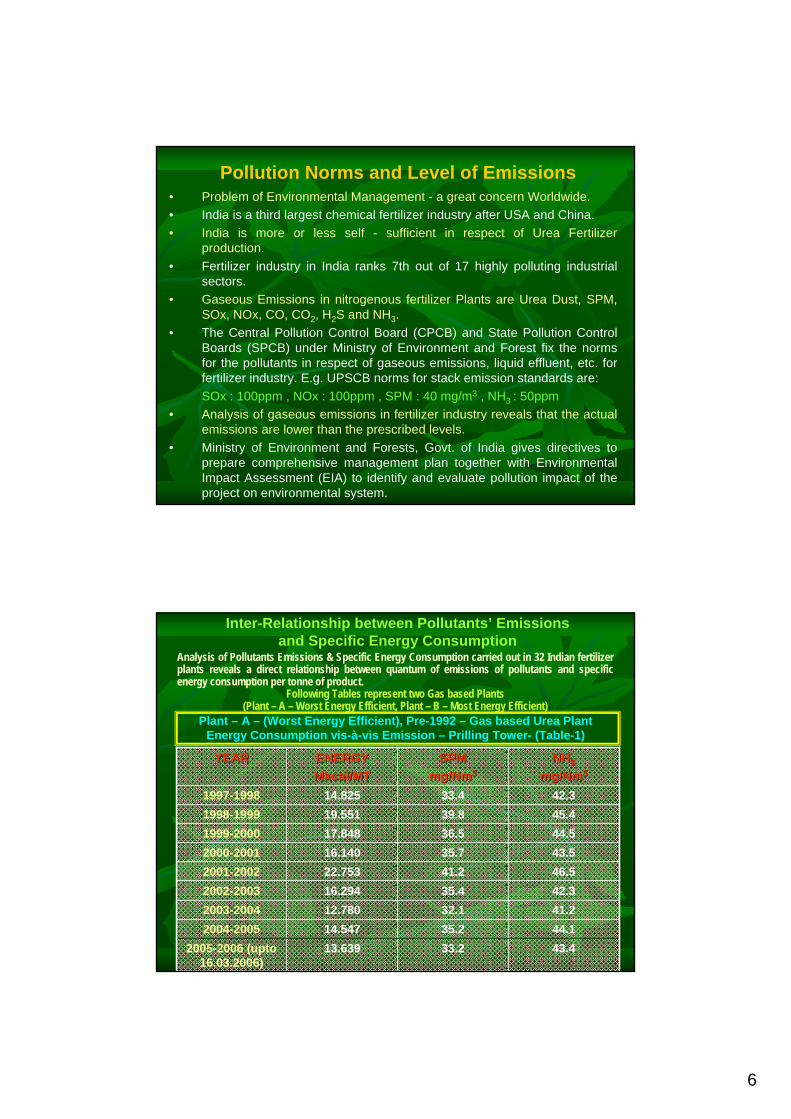
Pollution Norms and Level of Emissions• Problem of Environmental Management - a great concern Worldwide. • India is a third largest chemical fertilizer industry after USA and China.• India is more or less self - sufficient in respect of Urea Fertilizer
production.• Fertilizer industry in India ranks 7th out of 17 highly polluting industrial
sectors. • Gaseous Emissions in nitrogenous fertilizer Plants are Urea Dust, SPM,
SOx, NOx, CO, CO2, H2S and NH3. • The Central Pollution Control Board (CPCB) and State Pollution Control
Boards (SPCB) under Ministry of Environment and Forest fix the norms for the pollutants in respect of gaseous emissions, liquid effluent, etc. for fertilizer industry. E.g. UPSCB norms for stack emission standards are:SOx : 100ppm , NOx : 100ppm , SPM : 40 mg/m3 , NH3 : 50ppm
• Analysis of gaseous emissions in fertilizer industry reveals that the actual emissions are lower than the prescribed levels.
• Ministry of Environment and Forests, Govt. of India gives directives to prepare comprehensive management plan together with Environmental Impact Assessment (EIA) to identify and evaluate pollution impact of the project on environmental system.
Inter-Relationship between Pollutants’ Emissions and Specific Energy Consumption
Analysis of Pollutants Emissions & Specific Energy Consumption carried out in 32 Indian fertilizer plants reveals a direct relationship between quantum of emissions of pollutants and specific energy consumption per tonne of product.
Following Tables represent two Gas based Plants (Plant – A – Worst Energy Efficient, Plant – B – Most Energy Efficient)
Plant – A – (Worst Energy Efficient), Pre-1992 – Gas based Urea PlantEnergy Consumption vis-à-vis Emission – Prilling Tower- (Table-1)
46.5 41.2 22.753 2001-200242.335.416.2942002-200341.232.112.7802003-200444.135.214.5472004-200543.433.213.6392005-2006 (upto
16.03.2006)
43.5 35.7 16.140 2000-200144.5 36.5 17.848 1999-200045.4 39.8 19.551 1998-199942.3 33.4 14.825 1997-1998
NHNH33
mg/Nmmg/Nm33SPM SPM
mg/Nmmg/Nm33ENERGYENERGYMkcal/MT Mkcal/MT
YEAR YEAR
7
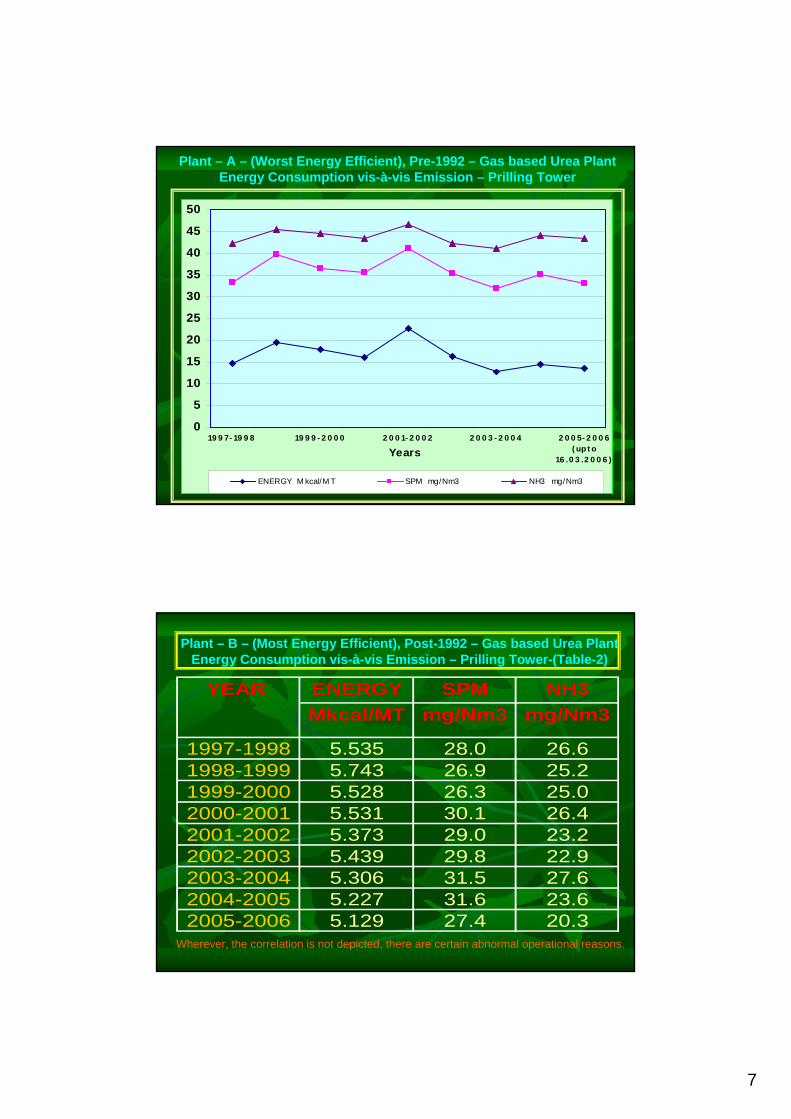
Plant – A – (Worst Energy Efficient), Pre-1992 – Gas based Urea PlantEnergy Consumption vis-à-vis Emission – Prilling Tower
0
5
10
15
20
25
30
35
40
45
50
19 9 7- 19 9 8 19 9 9 - 2 0 0 0 2 0 0 1- 2 0 0 2 2 0 0 3 - 2 0 0 4 2 0 0 5- 2 0 0 6( up t o
16 .0 3 .2 0 0 6 )Years
ENERGY M kcal/M T SPM mg/Nm3 NH3 mg/Nm3
Plant – B – (Most Energy Efficient), Post-1992 – Gas based Urea PlantEnergy Consumption vis-à-vis Emission – Prilling Tower-(Table-2)
ENERGY SPM NH3 Mkcal/MT mg/Nm3 mg/Nm3
1997-1998 5.535 28.0 26.61998-1999 5.743 26.9 25.21999-2000 5.528 26.3 25.02000-2001 5.531 30.1 26.42001-2002 5.373 29.0 23.22002-2003 5.439 29.8 22.92003-2004 5.306 31.5 27.62004-2005 5.227 31.6 23.62005-2006 5.129 27.4 20.3
YEAR
Wherever, the correlation is not depicted, there are certain abnormal operational reasons.
8
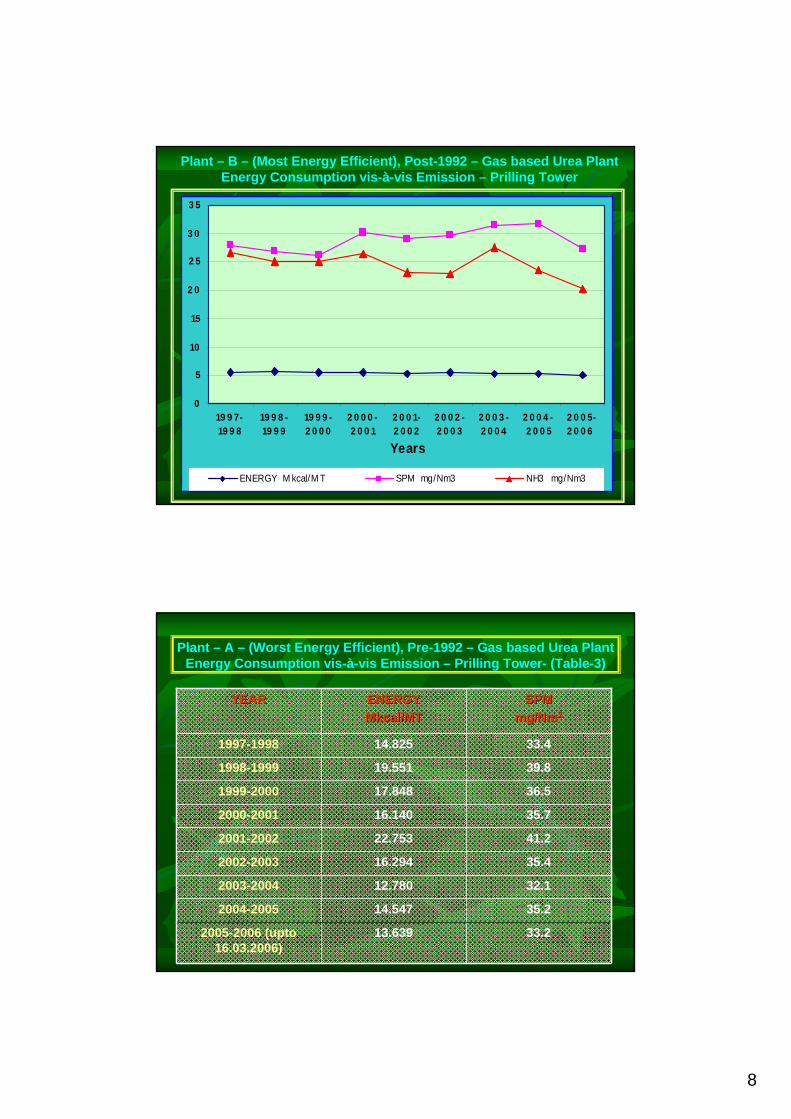
Plant – B – (Most Energy Efficient), Post-1992 – Gas based Urea PlantEnergy Consumption vis-à-vis Emission – Prilling Tower
0
5
10
15
2 0
2 5
3 0
3 5
19 9 7-19 9 8
19 9 8 -19 9 9
19 9 9 -2 0 0 0
2 0 0 0 -2 0 0 1
2 0 0 1-2 0 0 2
2 0 0 2 -2 0 0 3
2 0 0 3 -2 0 0 4
2 0 0 4 -2 0 0 5
2 0 0 5-2 0 0 6
Years
ENERGY M kcal/M T SPM mg/Nm3 NH3 mg/Nm3
Plant – A – (Worst Energy Efficient), Pre-1992 – Gas based Urea PlantEnergy Consumption vis-à-vis Emission – Prilling Tower- (Table-3)
41.2 22.753 2001-2002
35.416.2942002-2003
32.112.7802003-2004
35.214.5472004-2005
33.213.6392005-2006 (upto 16.03.2006)
35.7 16.140 2000-2001
36.5 17.848 1999-2000
39.8 19.551 1998-1999
33.4 14.825 1997-1998
SPM SPM mg/Nmmg/Nm33
ENERGYENERGYMkcal/MT Mkcal/MT
YEAR YEAR

9
Plant – A – (Worst Energy Efficient), Pre-1992 – Gas based Urea PlantEnergy Consumption vis-à-vis Emission – Prilling Tower
0
5
10
15
20
25
30
35
40
45
1997-1998 1999-2000 2001-2002 2003-2004 2005-2006(upto
16.03.2006)
YearsENERGY Mkcal/MT SPM mg/Nm3
Plant – B – (Most Energy Efficient), Post-1992 – Gas based Urea PlantEnergy Consumption vis-à-vis Emission – Prilling Tower-(Table-4)
ENERGY SPM Mkcal/MT mg/Nm3
1997-1998 5.535 28.01998-1999 5.743 26.91999-2000 5.528 26.32000-2001 5.531 30.12001-2002 5.373 29.02002-2003 5.439 29.82003-2004 5.306 31.52004-2005 5.227 31.62005-2006 5.129 27.4
YEAR
10
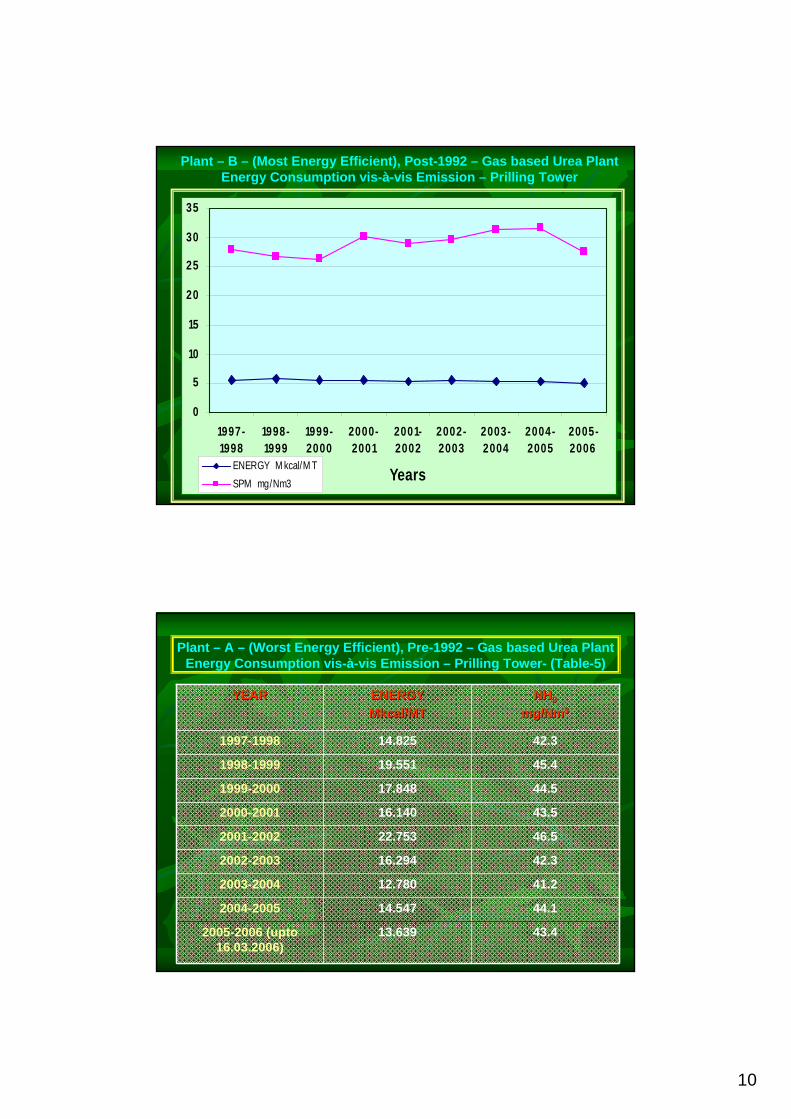
Plant – B – (Most Energy Efficient), Post-1992 – Gas based Urea PlantEnergy Consumption vis-à-vis Emission – Prilling Tower
0
5
10
15
20
25
30
35
1997-1998
1998-1999
1999-2000
2000-2001
2001-2002
2002-2003
2003-2004
2004-2005
2005-2006
YearsENERGY M kcal/M T SPM mg/Nm3
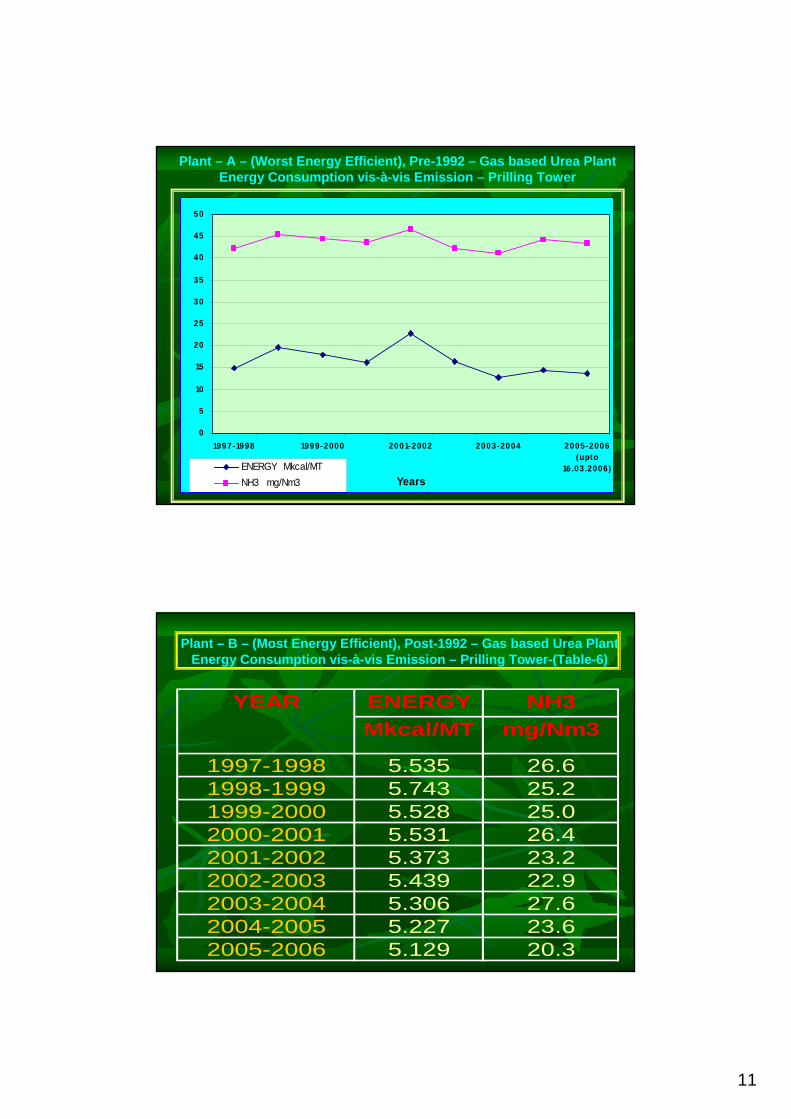
Plant – A – (Worst Energy Efficient), Pre-1992 – Gas based Urea PlantEnergy Consumption vis-à-vis Emission – Prilling Tower- (Table-5)
46.5 22.753 2001-2002
42.316.2942002-2003
41.212.7802003-2004
44.114.5472004-2005
43.413.6392005-2006 (upto 16.03.2006)
43.5 16.140 2000-2001
44.5 17.848 1999-2000
45.4 19.551 1998-1999
42.3 14.825 1997-1998
NHNH33
mg/Nmmg/Nm33ENERGYENERGYMkcal/MT Mkcal/MT
YEAR YEAR
11
Plant – A – (Worst Energy Efficient), Pre-1992 – Gas based Urea PlantEnergy Consumption vis-à-vis Emission – Prilling Tower
0
5
10
15
20
25
30
35
40
45
50
1997-1998 1999-2000 2001-2002 2003-2004 2005-2006(upto
16.03.2006)Years
ENERGY Mkcal/MT NH3 mg/Nm3
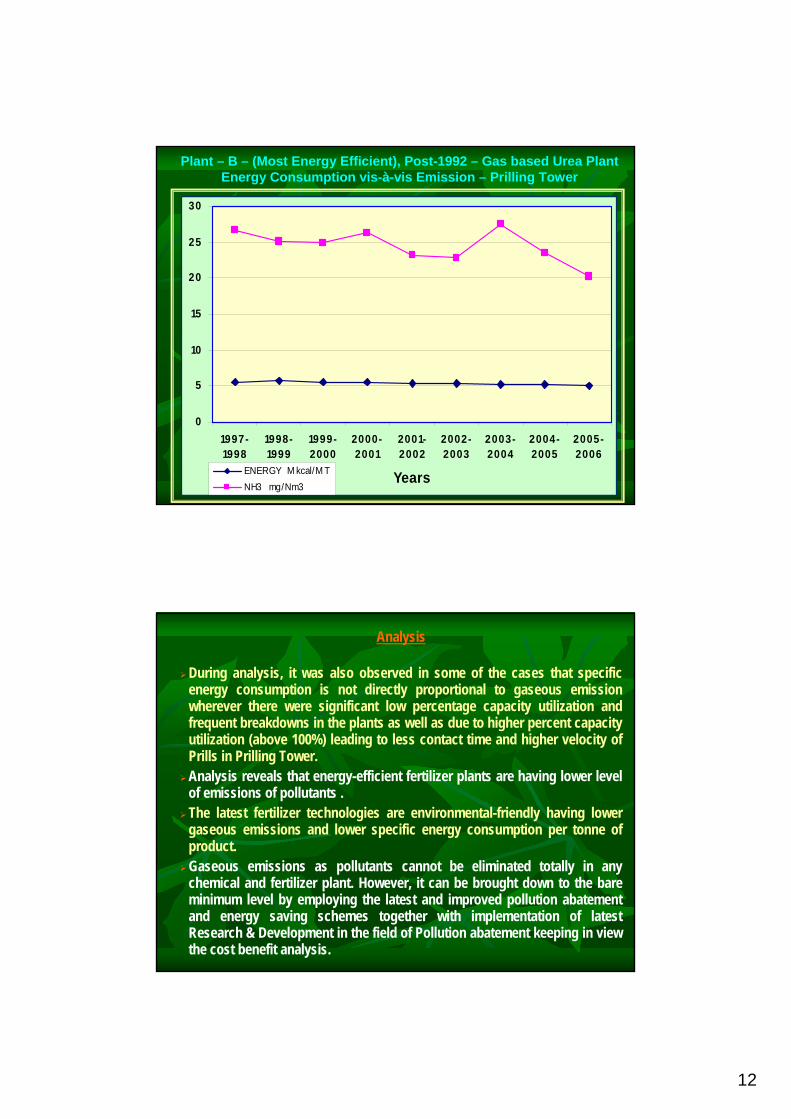
Plant – B – (Most Energy Efficient), Post-1992 – Gas based Urea PlantEnergy Consumption vis-à-vis Emission – Prilling Tower-(Table-6)
ENERGY NH3 Mkcal/MT mg/Nm3
1997-1998 5.535 26.61998-1999 5.743 25.21999-2000 5.528 25.02000-2001 5.531 26.42001-2002 5.373 23.22002-2003 5.439 22.92003-2004 5.306 27.62004-2005 5.227 23.62005-2006 5.129 20.3
YEAR
12
Plant – B – (Most Energy Efficient), Post-1992 – Gas based Urea PlantEnergy Consumption vis-à-vis Emission – Prilling Tower
0
5
10
15
20
25
30
1997-1998
1998-1999
1999-2000
2000-2001
2001-2002
2002-2003
2003-2004
2004-2005
2005-2006
YearsENERGY M kcal/M T NH3 mg/Nm3
Analysis
During analysis, it was also observed in some of the cases that specific energy consumption is not directly proportional to gaseous emission wherever there were significant low percentage capacity utilization and frequent breakdowns in the plants as well as due to higher percent capacity utilization (above 100%) leading to less contact time and higher velocity of Prills in Prilling Tower. Analysis reveals that energy-efficient fertilizer plants are having lower level of emissions of pollutants .The latest fertilizer technologies are environmental-friendly having lower gaseous emissions and lower specific energy consumption per tonne of product. Gaseous emissions as pollutants cannot be eliminated totally in any chemical and fertilizer plant. However, it can be brought down to the bare minimum level by employing the latest and improved pollution abatement and energy saving schemes together with implementation of latestResearch & Development in the field of Pollution abatement keeping in view the cost benefit analysis.

13
Effect on HealthEffect on HealthPollutantsPollutants
Adverse effect on human being, adverse effect on Adverse effect on human being, adverse effect on flowers of plants.flowers of plants.
Urea Dust, SPMUrea Dust, SPM
Damages the plants, adverse effect on aquatic Damages the plants, adverse effect on aquatic animals..animals..
Acid mistAcid mist
Causes mottled teeth and bone damage at higher Causes mottled teeth and bone damage at higher dose, Damages the plants.dose, Damages the plants.
Fluorine/ FluorideFluorine/ FluorideIrritation in eye and throat.Irritation in eye and throat.AmmoniaAmmonia
Headache, dizziness, nausea, reduces oxygen Headache, dizziness, nausea, reduces oxygen carrying capacity of blood and forms carboxy carrying capacity of blood and forms carboxy haemoglobin, respiratory failure and death.haemoglobin, respiratory failure and death.
COCO
Eye and nasal irritation, cellular effects, changes in Eye and nasal irritation, cellular effects, changes in lung morphology, causes damages to the plants, lung morphology, causes damages to the plants, decreases photosynthesis. Adverse effect on human decreases photosynthesis. Adverse effect on human being, particularly children and their mental being, particularly children and their mental retardation.retardation.
NOx NOx
Increases human mucus flow, throat and eye irritation, Increases human mucus flow, throat and eye irritation, causes bleaching of leaves and necrosis in leaves.causes bleaching of leaves and necrosis in leaves.
SOx SOx
Impact on Health of Human beings, Animals and PlantsImpact on Health of Human beings, Animals and Plants
ConclusionConclusion
There is a direct relationship between emission of There is a direct relationship between emission of pollutants and specific energy consumption per pollutants and specific energy consumption per tonne of product. tonne of product.
The specific energy consumption in the new The specific energy consumption in the new generation plants based on modern process generation plants based on modern process technology is lower than the old generation plants.technology is lower than the old generation plants.
The level of gaseous emissions in the new The level of gaseous emissions in the new generation plants based on modern process generation plants based on modern process technology is lower than the old generation plants.technology is lower than the old generation plants.
The old plants which have been The old plants which have been modernized/renovated or demodernized/renovated or de--bottlenecking carried bottlenecking carried out, have significantly brought down the gaseous out, have significantly brought down the gaseous emissions and specific energy consumption.emissions and specific energy consumption.
14
ConclusionConclusionPlants having effective/efficient environmental and Plants having effective/efficient environmental and energy management system, achieve significantly energy management system, achieve significantly lower level of gaseous emissions and specific lower level of gaseous emissions and specific energy consumption. energy consumption. Emissions of pollutants in fertilizer plants should be Emissions of pollutants in fertilizer plants should be aimed to be controlled at source by implementing aimed to be controlled at source by implementing various pollution abatement schemes.various pollution abatement schemes.
Energy can be saved in any fertilizer plant by Energy can be saved in any fertilizer plant by minimizing the gaseous emission levels by taking minimizing the gaseous emission levels by taking appropriate costappropriate cost--effective measures.effective measures.
Apart from the Energy loss due to higher level of Apart from the Energy loss due to higher level of gaseous emissions, there is an adverse impact on gaseous emissions, there is an adverse impact on the health of human beings, animals and plants etc. the health of human beings, animals and plants etc. in and surrounding the fertilizer plants.in and surrounding the fertilizer plants.