A Presentation for IPTA: Chemical Tanker Market · PDF fileA Presentation for IPTA: Chemical...
30
A Presentation By A Presentation for IPTA: Chemical Tanker Market Analysis London, 12-13 March, 2013
Transcript of A Presentation for IPTA: Chemical Tanker Market · PDF fileA Presentation for IPTA: Chemical...
A Presentation
By
A Presentation for IPTA:
Chemical Tanker Market Analysis
London, 12-13 March, 2013
2
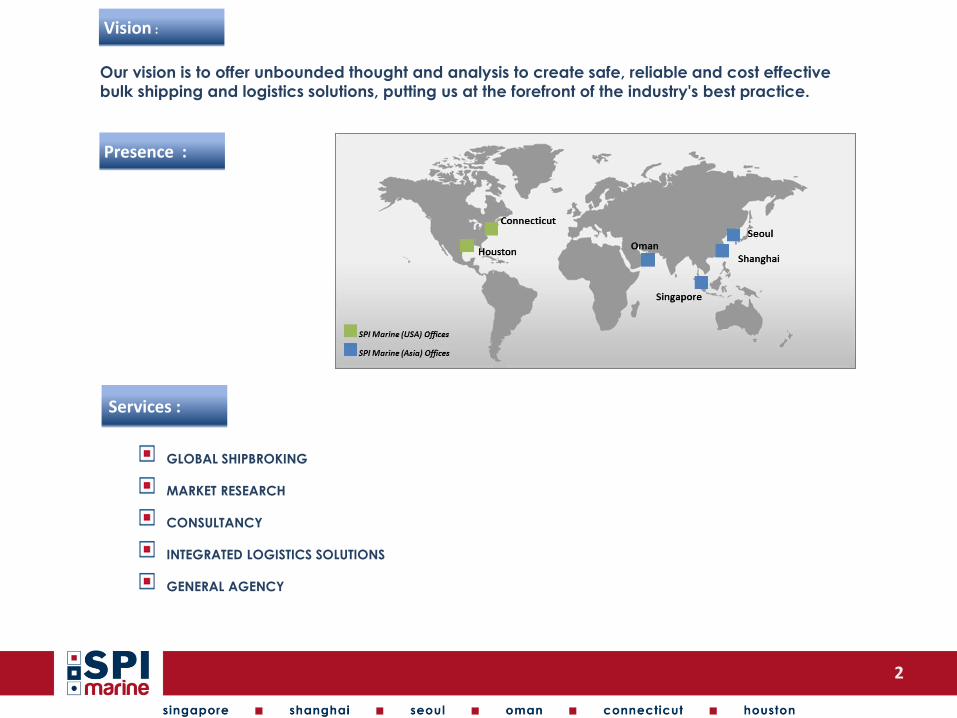
GLOBAL SHIPBROKING
MARKET RESEARCH
CONSULTANCY
INTEGRATED LOGISTICS SOLUTIONS
GENERAL AGENCY
Services :
Vision :
s & peri
Our vision is to offer unbounded thought and analysis to create safe, reliable and cost effective
bulk shipping and logistics solutions, putting us at the forefront of the industry's best practice.
Presence :
3
Contents
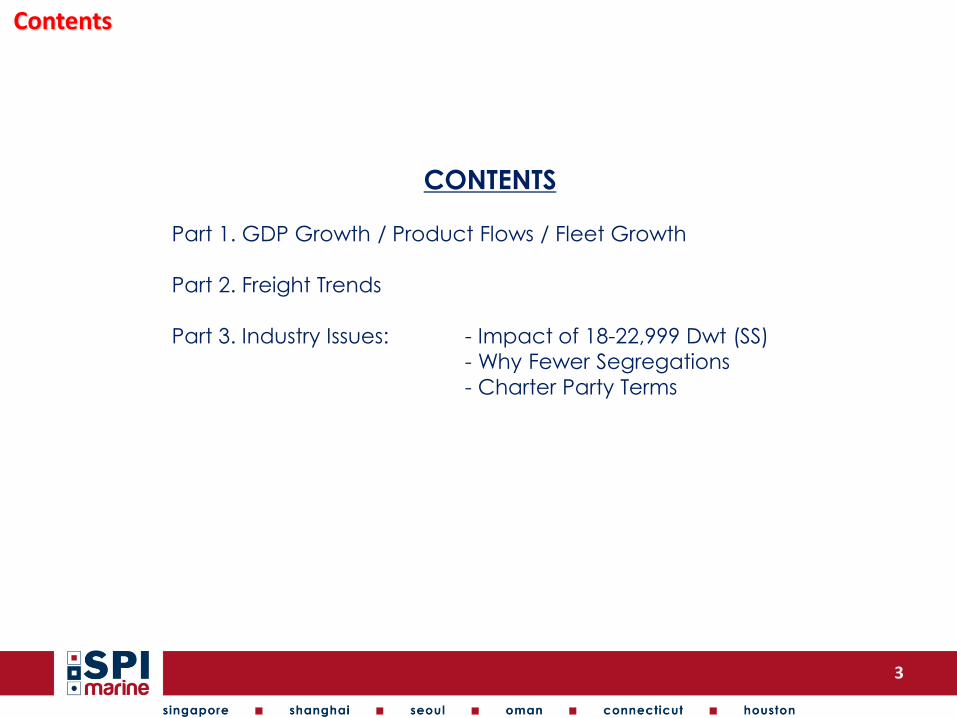
CONTENTS
Part 1. GDP Growth / Product Flows / Fleet Growth
Part 2. Freight Trends
Part 3. Industry Issues: - Impact of 18-22,999 Dwt (SS)
- Why Fewer Segregations
- Charter Party Terms
4
Market Outlook: Global Economic Outlook
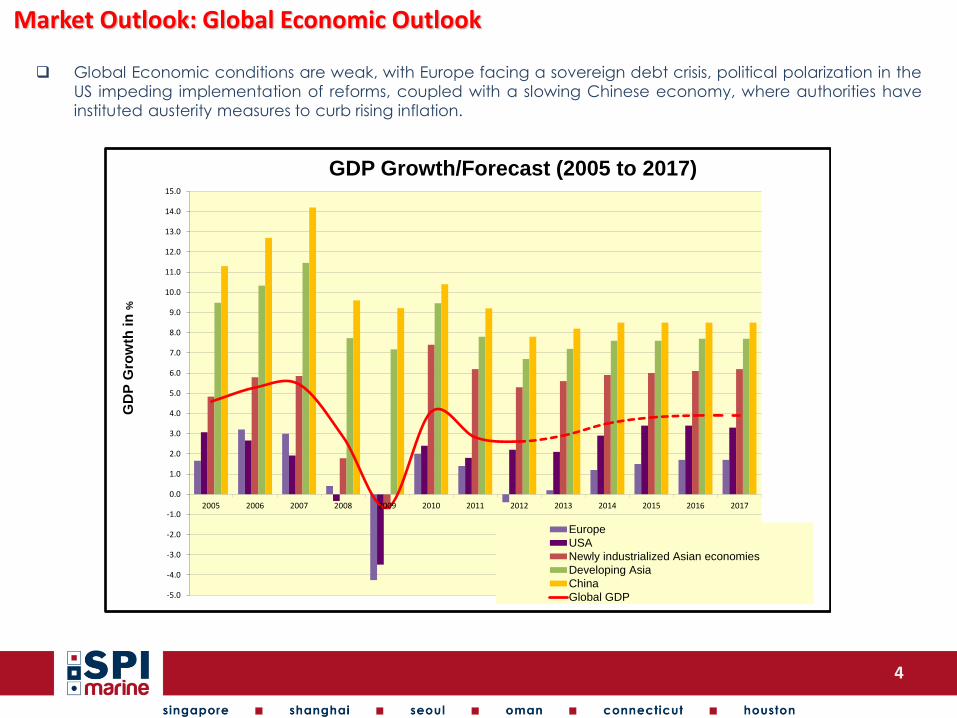
Global Economic conditions are weak, with Europe facing a sovereign debt crisis, political polarization in the
US impeding implementation of reforms, coupled with a slowing Chinese economy, where authorities have
instituted austerity measures to curb rising inflation.
-5.0
-4.0
-3.0
-2.0
-1.0
0.0
1.0
2.0
3.0
4.0
5.0
6.0
7.0
8.0
9.0
10.0
11.0
12.0
13.0
14.0
15.0
2005 2006 2007 2008 2009 2010 2011 2012 2013 2014 2015 2016 2017
GDP Growth/Forecast (2005 to 2017)
Europe
USA
Newly industrialized Asian economies
Developing Asia
China
Global GDP
GD
P G
row
th in
%
Market Demand: Asia & ME Chemical & Base Oil Flows
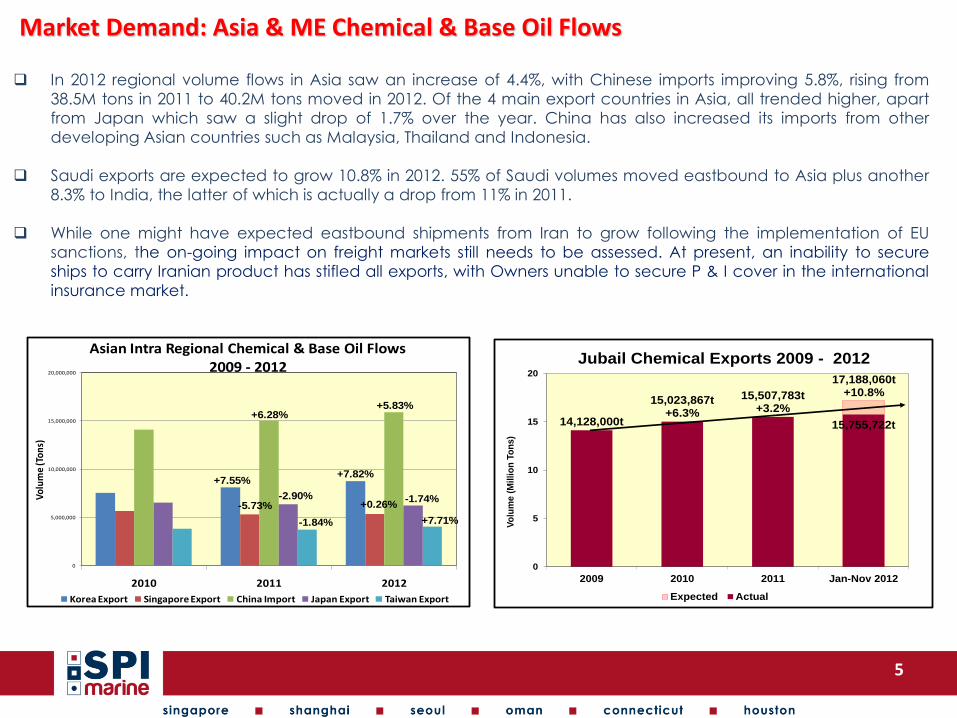
In 2012 regional volume flows in Asia saw an increase of 4.4%, with Chinese imports improving 5.8%, rising from
38.5M tons in 2011 to 40.2M tons moved in 2012. Of the 4 main export countries in Asia, all trended higher, apart
from Japan which saw a slight drop of 1.7% over the year. China has also increased its imports from other
developing Asian countries such as Malaysia, Thailand and Indonesia.
Saudi exports are expected to grow 10.8% in 2012. 55% of Saudi volumes moved eastbound to Asia plus another
8.3% to India, the latter of which is actually a drop from 11% in 2011.
While one might have expected eastbound shipments from Iran to grow following the implementation of EU
sanctions, the on-going impact on freight markets still needs to be assessed. At present, an inability to secure
ships to carry Iranian product has stifled all exports, with Owners unable to secure P & I cover in the international
insurance market.
0
5,000,000
10,000,000
15,000,000
20,000,000
2010 2011 2012
Vo
lum
e (T
on
s)
Asian Intra Regional Chemical & Base Oil Flows 2009 - 2012
Korea Export Singapore Export China Import Japan Export Taiwan Export
+7.55%
-5.73%
+6.28%
-2.90%
-1.84%
+7.82%
+0.26%
+5.83%
-1.74%
+7.71%
14,128,000t
15,023,867t+6.3%
15,507,783t+3.2%
15,755,722t
0
5
10
15
20
2009 2010 2011 Jan-Nov 2012
Vo
lum
e (
Mil
lio
n T
on
s)
Jubail Chemical Exports 2009 - 2012
Expected Actual
17,188,060t+10.8%
5
6
Market Demand: US Chemical Flows
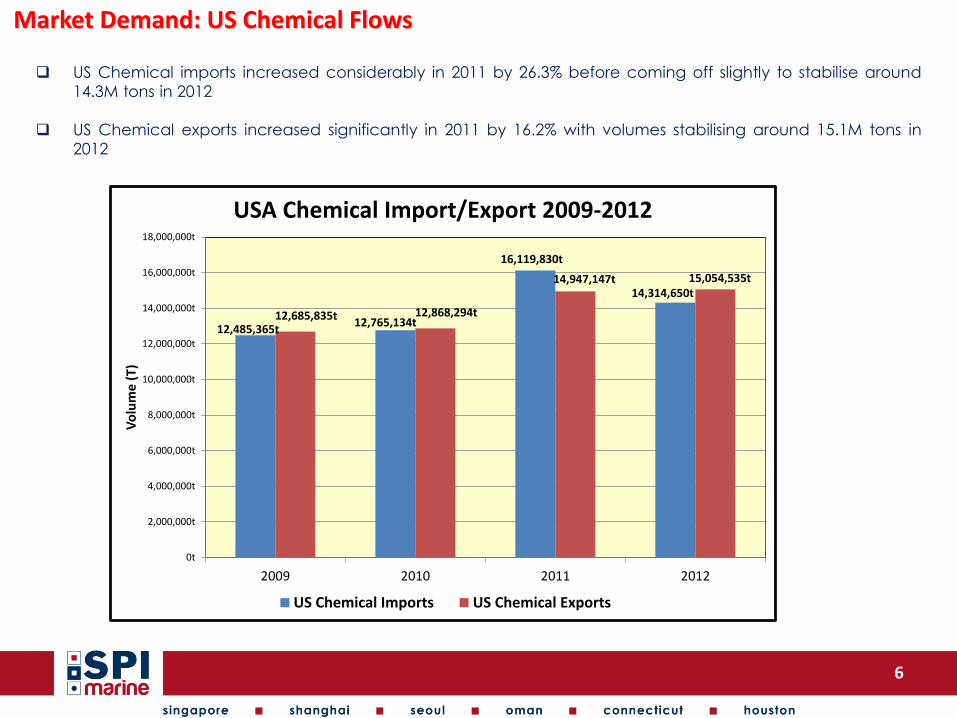
US Chemical imports increased considerably in 2011 by 26.3% before coming off slightly to stabilise around
14.3M tons in 2012
US Chemical exports increased significantly in 2011 by 16.2% with volumes stabilising around 15.1M tons in
2012
12,485,365t12,765,134t
16,119,830t
14,314,650t
12,685,835t 12,868,294t
14,947,147t 15,054,535t
0t
2,000,000t
4,000,000t
6,000,000t
8,000,000t
10,000,000t
12,000,000t
14,000,000t
16,000,000t
18,000,000t
2009 2010 2011 2012
Vo
lum
e (
T)
USA Chemical Import/Export 2009-2012
US Chemical Imports US Chemical Exports
7
Fleet: Chemical Fleet Growth
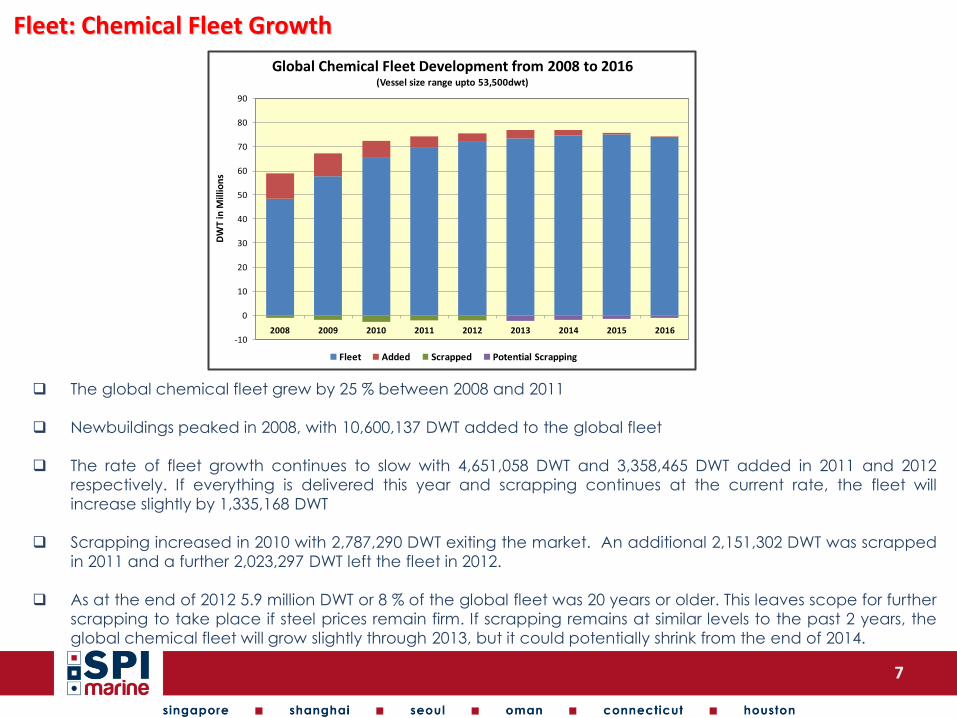
The global chemical fleet grew by 25 % between 2008 and 2011
Newbuildings peaked in 2008, with 10,600,137 DWT added to the global fleet
The rate of fleet growth continues to slow with 4,651,058 DWT and 3,358,465 DWT added in 2011 and 2012
respectively. If everything is delivered this year and scrapping continues at the current rate, the fleet will
increase slightly by 1,335,168 DWT
Scrapping increased in 2010 with 2,787,290 DWT exiting the market. An additional 2,151,302 DWT was scrapped
in 2011 and a further 2,023,297 DWT left the fleet in 2012.
As at the end of 2012 5.9 million DWT or 8 % of the global fleet was 20 years or older. This leaves scope for further
scrapping to take place if steel prices remain firm. If scrapping remains at similar levels to the past 2 years, the
global chemical fleet will grow slightly through 2013, but it could potentially shrink from the end of 2014.
-10
0
10
20
30
40
50
60
70
80
90
2008 2009 2010 2011 2012 2013 2014 2015 2016
DW
T in
Mill
ion
s
Global Chemical Fleet Development from 2008 to 2016(Vessel size range upto 53,500dwt)
Fleet Added Scrapped Potential Scrapping
8
Fleet: Size Distribution
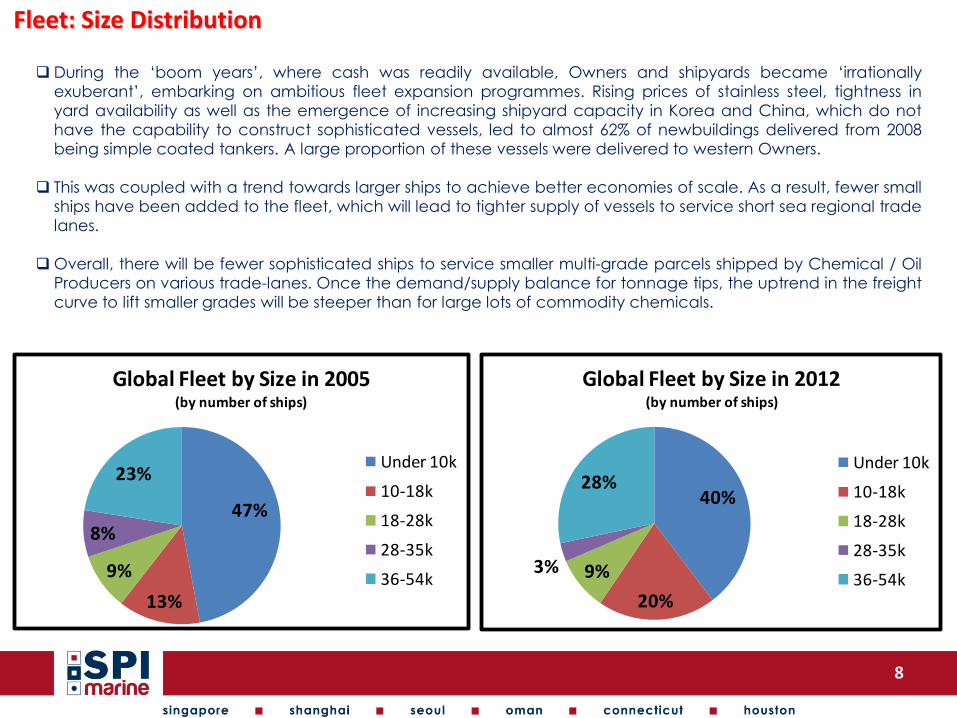
During the ‘boom years’, where cash was readily available, Owners and shipyards became ‘irrationally
exuberant’, embarking on ambitious fleet expansion programmes. Rising prices of stainless steel, tightness in
yard availability as well as the emergence of increasing shipyard capacity in Korea and China, which do not
have the capability to construct sophisticated vessels, led to almost 62% of newbuildings delivered from 2008
being simple coated tankers. A large proportion of these vessels were delivered to western Owners.
This was coupled with a trend towards larger ships to achieve better economies of scale. As a result, fewer small
ships have been added to the fleet, which will lead to tighter supply of vessels to service short sea regional trade
lanes.
Overall, there will be fewer sophisticated ships to service smaller multi-grade parcels shipped by Chemical / Oil
Producers on various trade-lanes. Once the demand/supply balance for tonnage tips, the uptrend in the freight
curve to lift smaller grades will be steeper than for large lots of commodity chemicals.
47%
13%
9%
8%
23%
Global Fleet by Size in 2005(by number of ships)
Under 10k
10-18k
18-28k
28-35k
36-54k
40%
20%
9%3%
28%
Global Fleet by Size in 2012 (by number of ships)
Under 10k
10-18k
18-28k
28-35k
36-54k
9
Intercontinental Fleet
0
2
4
6
8
10
12
14
16
18
20
0
50
100
150
200
250
300
350
400
450
15-17,999 18-22,999 23-29,999 30-34,999 35-39,999 40-44,999 45-49,999 50-53,500
Ton
s ('
00
)
No
. of S
hip
s
Vessel Size
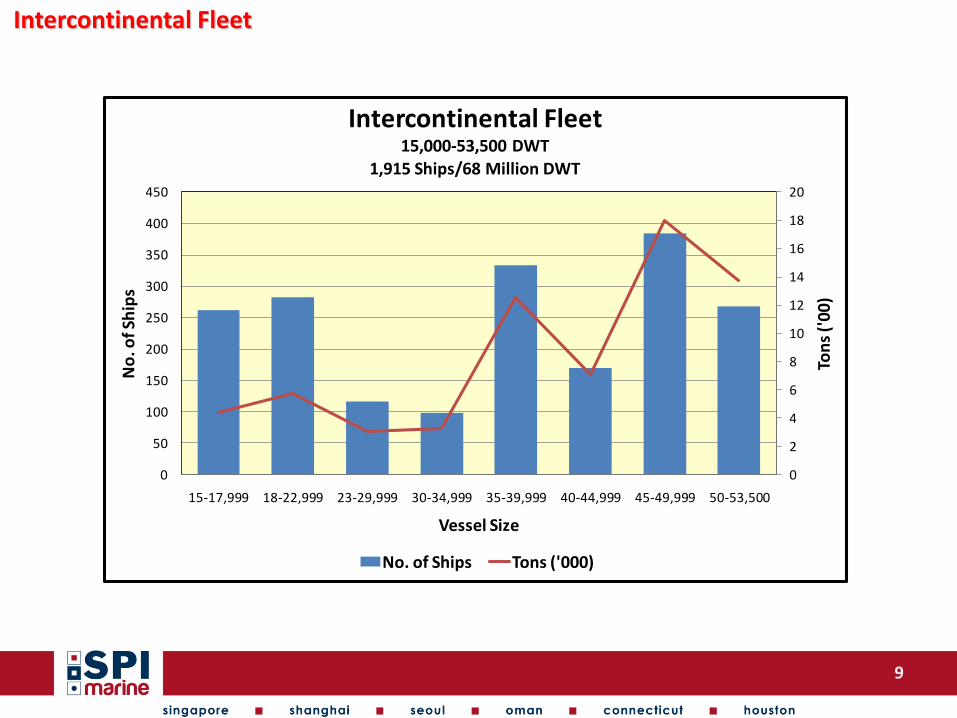
Intercontinental Fleet 15,000-53,500 DWT
1,915 Ships/68 Million DWT
No. of Ships Tons ('000)
10
Freight Trends: Asian Trade Routes
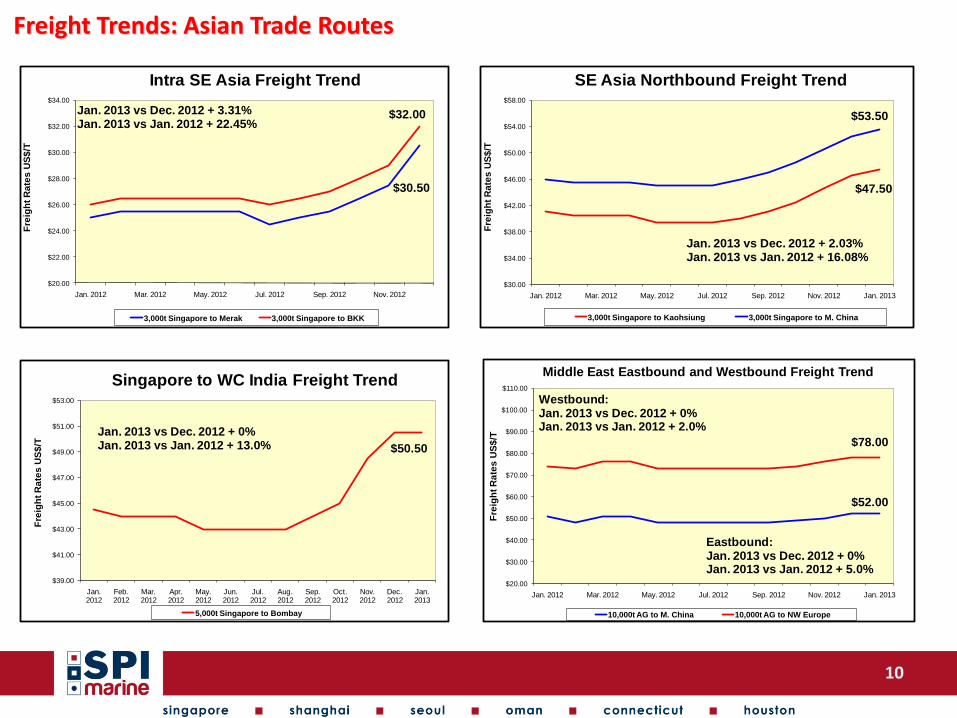
$30.50
$32.00
$20.00
$22.00
$24.00
$26.00
$28.00
$30.00
$32.00
$34.00
Jan. 2012 Mar. 2012 May. 2012 Jul. 2012 Sep. 2012 Nov. 2012
Fre
igh
t R
ate
s U
S$
/T
Intra SE Asia Freight Trend
3,000t Singapore to Merak 3,000t Singapore to BKK
Jan. 2013 vs Dec. 2012 + 3.31%Jan. 2013 vs Jan. 2012 + 22.45%
$47.50
$53.50
$30.00
$34.00
$38.00
$42.00
$46.00
$50.00
$54.00
$58.00
Jan. 2012 Mar. 2012 May. 2012 Jul. 2012 Sep. 2012 Nov. 2012 Jan. 2013
Fre
igh
t R
ate
s U
S$
/T
SE Asia Northbound Freight Trend
3,000t Singapore to Kaohsiung 3,000t Singapore to M. China
Jan. 2013 vs Dec. 2012 + 2.03%Jan. 2013 vs Jan. 2012 + 16.08%
$50.50
$39.00
$41.00
$43.00
$45.00
$47.00
$49.00
$51.00
$53.00
Jan. 2012
Feb. 2012
Mar. 2012
Apr. 2012
May. 2012
Jun. 2012
Jul. 2012
Aug. 2012
Sep. 2012
Oct. 2012
Nov. 2012
Dec. 2012
Jan. 2013
Fre
igh
t R
ate
s U
S$
/T
Singapore to WC India Freight Trend
5,000t Singapore to Bombay
Jan. 2013 vs Dec. 2012 + 0%Jan. 2013 vs Jan. 2012 + 13.0%
$52.00
$78.00
$20.00
$30.00
$40.00
$50.00
$60.00
$70.00
$80.00
$90.00
$100.00
$110.00
Jan. 2012 Mar. 2012 May. 2012 Jul. 2012 Sep. 2012 Nov. 2012 Jan. 2013
Fre
igh
t R
ate
s U
S$
/T
Middle East Eastbound and Westbound Freight Trend
10,000t AG to M. China 10,000t AG to NW Europe
Westbound:Jan. 2013 vs Dec. 2012 + 0%Jan. 2013 vs Jan. 2012 + 2.0%
Eastbound:Jan. 2013 vs Dec. 2012 + 0%Jan. 2013 vs Jan. 2012 + 5.0%
11
Freight Trends: US Trade Routes
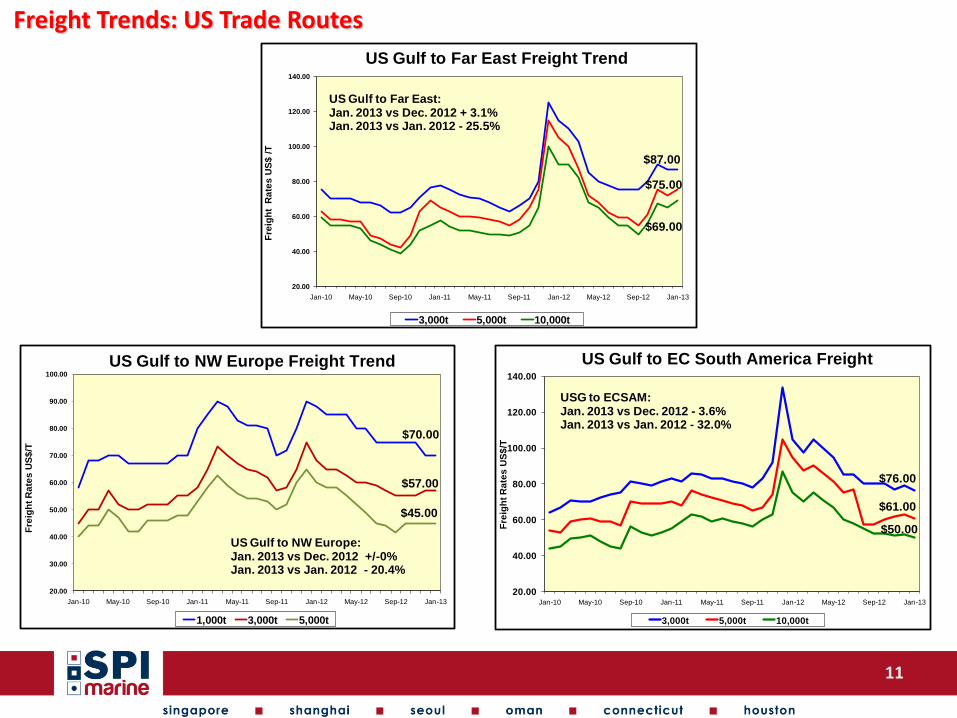
$87.00
$75.00
$69.00
20.00
40.00
60.00
80.00
100.00
120.00
140.00
Jan-10 May-10 Sep-10 Jan-11 May-11 Sep-11 Jan-12 May-12 Sep-12 Jan-13
Fre
igh
t R
ate
s U
S$
/T
3,000t 5,000t 10,000t
US Gulf to Far East Freight Trend
US Gulf to Far East:Jan. 2013 vs Dec. 2012 + 3.1%Jan. 2013 vs Jan. 2012 - 25.5%
$76.00
$61.00
$50.00
20.00
40.00
60.00
80.00
100.00
120.00
140.00
Jan-10 May-10 Sep-10 Jan-11 May-11 Sep-11 Jan-12 May-12 Sep-12 Jan-13
Fre
igh
t R
ate
s U
S$
/T
3,000t 5,000t 10,000t
US Gulf to EC South America Freight
USG to ECSAM:Jan. 2013 vs Dec. 2012 - 3.6%Jan. 2013 vs Jan. 2012 - 32.0%
$70.00
$57.00
$45.00
20.00
30.00
40.00
50.00
60.00
70.00
80.00
90.00
100.00
Jan-10 May-10 Sep-10 Jan-11 May-11 Sep-11 Jan-12 May-12 Sep-12 Jan-13
Fre
igh
t R
ate
s U
S$
/T
1,000t 3,000t 5,000t
US Gulf to NW Europe Freight Trend
US Gulf to NW Europe:Jan. 2013 vs Dec. 2012 +/-0%Jan. 2013 vs Jan. 2012 - 20.4%
12
Freight Market Outlook: Demand versus Supply Downward Market Pressure:
The global economy remains weak and analysts project the world is unlikely to return to the rate of economic
activity seen before the financial crisis until 2014 or possibly later.
China has overtaken Japan as the second largest economy in the world. However, China put in place
measures to avoid overheating at the beginning of the year (although we do expect to see stimulus to the
Chinese economy in 2013). According to the International Monetary Fund, Developing Asia is forecast to
grow by 6.7% in 2012, down from 8.2% last year, not least because of falling demand from key export markets,
such as the US and Europe.
Upward Market Pressure:
Global demand for petrochemicals continues to grow, especially in emerging markets, which are advancing
at a faster pace than other regions. Globally, demand for chemical shipping is expected to increase by 5% in
2012 and 5.7% in 2013, compared to a fleet growth of 2.3% and 2% in these two years.
China’s chemical demand is expected to increase annually by 1.5 times China’s GDP growth. Based on
current GDP expectations, demand is likely to increase by around 12% in 2013, drawing ships from the Intra SE
Asia trade.
During the last peak cycle, cheap debt and plentiful bank liquidity led to an order-book for chemical tankers
stretching into 2012. However, almost no newbuilding activity has taken place in the past 3 years. As Owners
and ship finance players contend with over-priced assets ordered during the last peak cycle, we are unlikely
to see a pick-up in newbuilding activity in the near term, despite significantly reduced values.
As a result, the Asian Fleet Growth could shrink from 2012, while global fleet growth will likely shrink only from
2013.
Operating costs remain at historically high levels, leading to a strong inducement for Owners to aggressively
seek freight improvements.
13
Freight Market Outlook: Demand versus Supply
Conclusion:
While rates are likely to remain subdued during the 1H of 2013, despite an uncertain demand outlook, we
expect freight rates will continue to recover into 2013, as the number of newbuilding deliveries dwindle, while
scrapping picks up.
Despite slowing GDP growth in Asia overall, we have continued to see volumes growing year-on-year, which
has allowed the market to absorb the glut of newbuildings that entered the market over the past 3 years,
with little negative impact on freight rates.
While freight rates have remained subdued over the seasonally slower summer months of 2012, despite an
uncertain demand outlook, we expect Asian freight rates to continue to show a steady recovery from the
end of 2012 and into 2013.
As the number of newbuilding deliveries dwindle, while scrapping picks up, the freight market is expected to
emerge from the down-cycle that started in 2008.
Once the demand/supply balance for chemical tankers tips and the global economy recovers, we are likely
to see freight rates increase strongly as current time-charter equivalent returns remain well below levels
needed for investments made during the peak years to become profitable. Due to relatively fewer
smaller/sophisticated ships, the trend is likely to be steeper for short sea shipments and for shipments of smaller
grades or products with special handling requirements.
The coming 12 months will remain very challenging for Owners, who will have to rely on the support of banks
to survive and, given recent examples (Dorval, BLTC and EOS), it is reasonable to assume that some may not.
14
Freight Market Outlook: Swing Factors
Potential Swing factors, could pull the market in different directions:
Demand
Threat of a double dip or further economic decline in Europe and the US due to high debt, unemployment and reduced consumption in the developed world.
High oil and commodity prices could harm a sustainable economic recovery
War/unrest in the Middle East ‘Arab Spring’ or Natural disasters like Japan’s Earthquake
Slowing growth and weakness in the Chinese banking system, as propagated by the ‘Chinese Bears’
Supply
Rebalancing of tonnage: If freight demand in Asia picks up, while markets in other regions remain dull, tonnage may be drawn to the region.
15
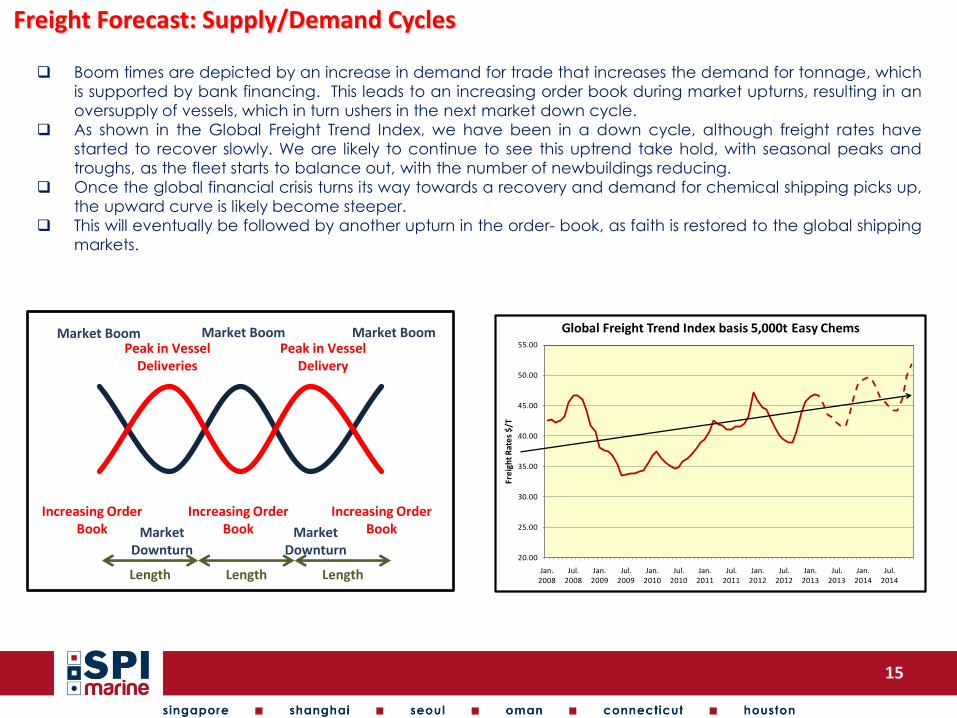
Freight Forecast: Supply/Demand Cycles
Boom times are depicted by an increase in demand for trade that increases the demand for tonnage, which
is supported by bank financing. This leads to an increasing order book during market upturns, resulting in an
oversupply of vessels, which in turn ushers in the next market down cycle.
As shown in the Global Freight Trend Index, we have been in a down cycle, although freight rates have
started to recover slowly. We are likely to continue to see this uptrend take hold, with seasonal peaks and
troughs, as the fleet starts to balance out, with the number of newbuildings reducing.
Once the global financial crisis turns its way towards a recovery and demand for chemical shipping picks up,
the upward curve is likely become steeper.
This will eventually be followed by another upturn in the order- book, as faith is restored to the global shipping
markets.
Increasing Order Book Market
Downturn
Increasing Order Book
Increasing Order Book Market
Downturn
Peak in Vessel Deliveries
Peak in Vessel Delivery
Market Boom Market Boom Market Boom
Length Length Length
20.00
25.00
30.00
35.00
40.00
45.00
50.00
55.00
Jan. 2008
Jul. 2008
Jan. 2009
Jul. 2009
Jan. 2010
Jul. 2010
Jan. 2011
Jul. 2011
Jan. 2012
Jul. 2012
Jan. 2013
Jul. 2013
Jan. 2014
Jul. 2014
Fre
igh
t R
ate
s $
/T
Global Freight Trend Index basis 5,000t Easy Chems
16
Freight Market Outlook: Time Charter Rates
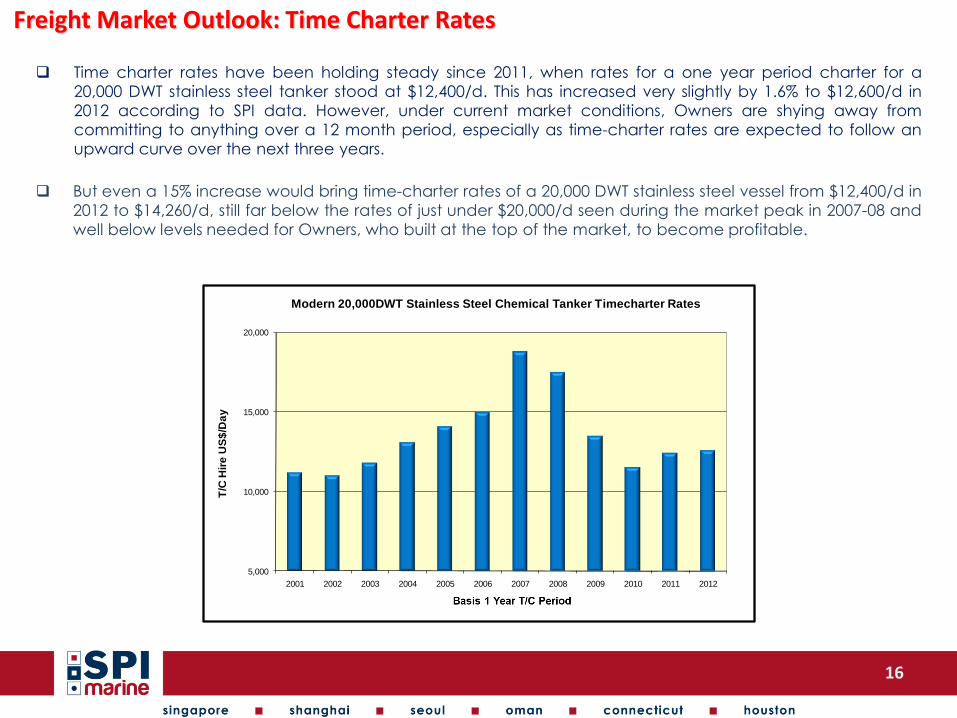
Time charter rates have been holding steady since 2011, when rates for a one year period charter for a
20,000 DWT stainless steel tanker stood at $12,400/d. This has increased very slightly by 1.6% to $12,600/d in
2012 according to SPI data. However, under current market conditions, Owners are shying away from
committing to anything over a 12 month period, especially as time-charter rates are expected to follow an
upward curve over the next three years.
But even a 15% increase would bring time-charter rates of a 20,000 DWT stainless steel vessel from $12,400/d in
2012 to $14,260/d, still far below the rates of just under $20,000/d seen during the market peak in 2007-08 and
well below levels needed for Owners, who built at the top of the market, to become profitable.
5,000
10,000
15,000
20,000
2001 2002 2003 2004 2005 2006 2007 2008 2009 2010 2011 2012
T/C
Hir
e U
S$
/Da
y
Modern 20,000DWT Stainless Steel Chemical Tanker Timecharter Rates
17
Freight Market Outlook: Chemical Tanker Operating Costs
While the supply of tankers has outstripped demand for freight in recent years, high bunker prices have helped
to keep freight rates propped up.
Bunkers, which trend crude prices, remain at historical highs however from last summer bunkers came off quite
dramatically allowing Owners room for negotiation, but they have since picked up, although they have not
returned to the highs seen at the beginning of last year.
With freight earned in US Dollars, weakness of the US Dollar versus other currencies has further squeezed ship
owner margins.
OPEX costs for chemical tankers rose by over 21.8% from 2008 to 2012 and remain high.
Continued high fuel costs – 2013 average costs expected to be higher than 2012
Dry dock costs up 61.2%
Crewing up 20.5%
P and I premiums up 15%
Increases in port costs and canal dues
When the supply/demand balance shifts in favour of Owner/Operator we will likely see an aggressive surge to
move freight rates up.

18
Intercontinental Fleet
0
2
4
6
8
10
12
14
16
18
20
0
50
100
150
200
250
300
350
400
450
15-17,999 18-22,999 23-29,999 30-34,999 35-39,999 40-44,999 45-49,999 50-53,500
Ton
s ('
00
)
No
. of S
hip
s
Vessel Size
Intercontinental Fleet 15,000-53,500 DWT
1,915 Ships/68 Million DWT
No. of Ships Tons ('000)
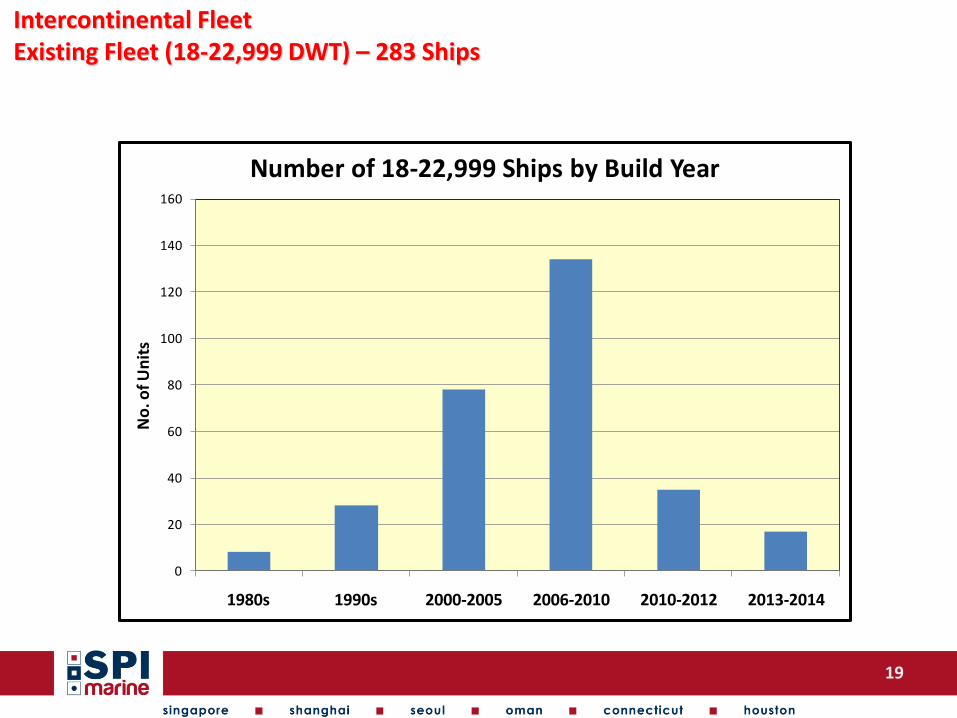
Intercontinental Fleet Existing Fleet (18-22,999 DWT) – 283 Ships
0
20
40
60
80
100
120
140
160
1980s 1990s 2000-2005 2006-2010 2010-2012 2013-2014
No
. of U
nit
s
Number of 18-22,999 Ships by Build Year
19
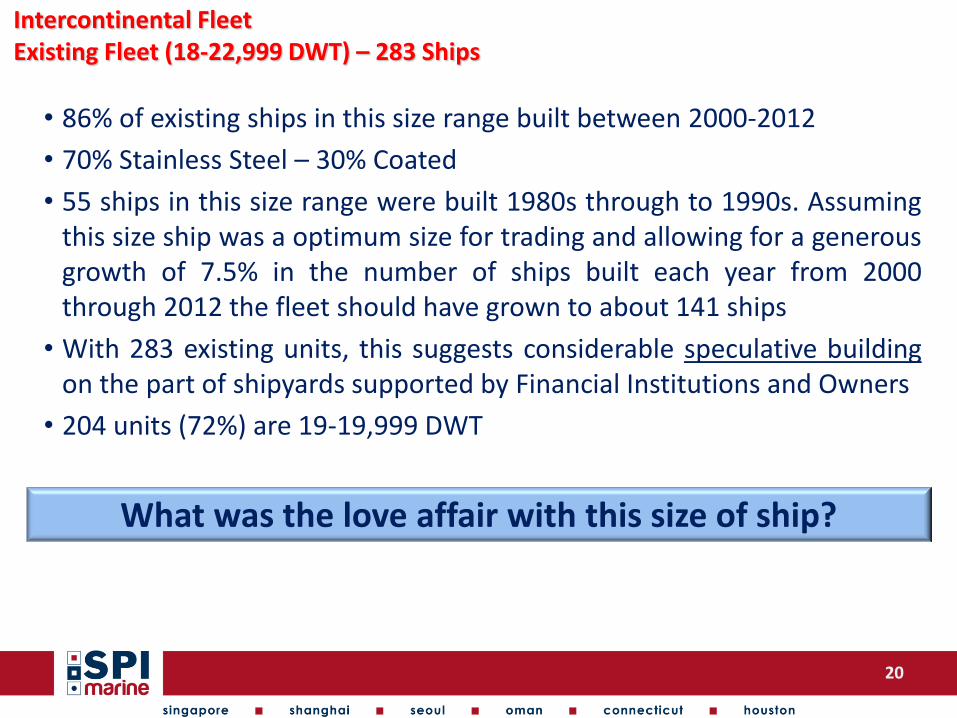
Intercontinental Fleet Existing Fleet (18-22,999 DWT) – 283 Ships
• 86% of existing ships in this size range built between 2000-2012
• 70% Stainless Steel – 30% Coated
• 55 ships in this size range were built 1980s through to 1990s. Assuming this size ship was a optimum size for trading and allowing for a generous growth of 7.5% in the number of ships built each year from 2000 through 2012 the fleet should have grown to about 141 ships
• With 283 existing units, this suggests considerable speculative building on the part of shipyards supported by Financial Institutions and Owners
• 204 units (72%) are 19-19,999 DWT
What was the love affair with this size of ship?
20
Intercontinental Fleet Existing Fleet (18-22,999 DWT) – 283 Ships
• Asian yards (particularly Japanese) accounted for approx. 76% of all ships built in this size range. Many of the Japanese yards were stretched to their limits with this size.
• Inert gas requirements by Solas/IMO (1986) could be avoided if ship was less than 20,000 DWT. However the cost savings in construction and operational costs alone could not have driven demand for this size.
• A number of respectable Owner / Operators have found trades where this size ship with stainless steel cargo tanks fit well. However, the ship is considered by many to be too large for many regional trades and too small for most intercontinental trades.
• Too many Owner/Operators are trading spot/prompt and given the flexibility of these ships have moved in and out of both regional and intercontinental trades seeking employment. The over capacity of these types of ships have contributed towards softening of spot freight rates which are highly influential on contract renewals.
21
Intercontinental Fleet Existing Fleet (18-22,999 DWT) – 283 Ships
0
10
20
30
40
50
60
70
80
90
Nordic/ Siva/
Womar
Allied/ Fairfield Chemical
Odfjell MTMM Tokyo Marine
Hansa BLT Chembulk
MISC NAVIG8 Stolt Zodiac
No
. of
Ship
s
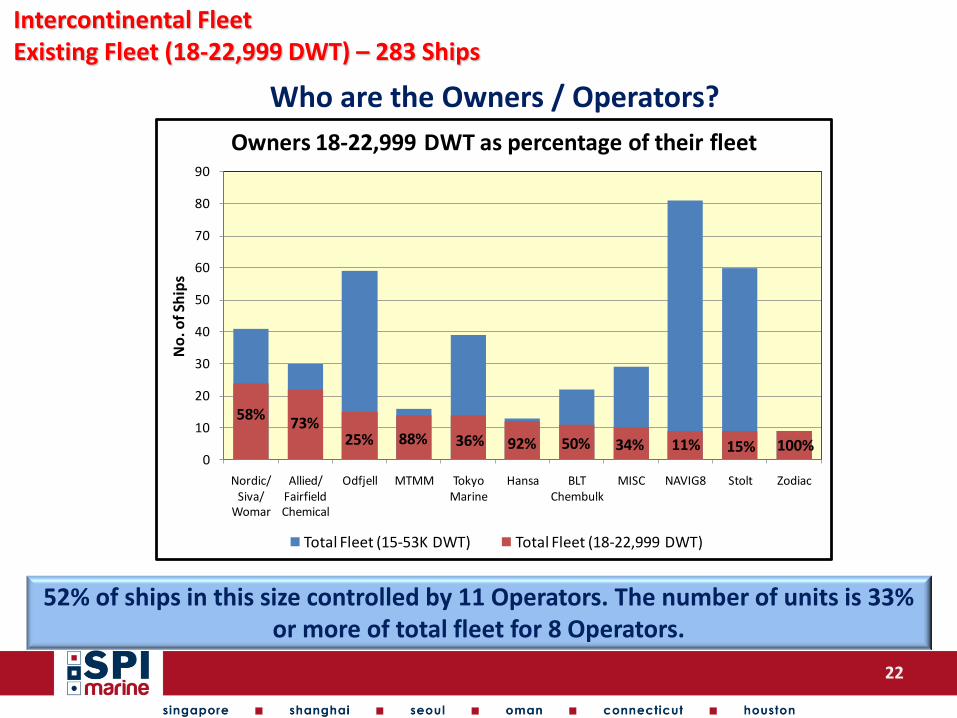
Owners 18-22,999 DWT as percentage of their fleet
Total Fleet (15-53K DWT) Total Fleet (18-22,999 DWT)
58%73%
25% 88% 36% 92% 50% 34% 11% 15% 100%
Who are the Owners / Operators?
52% of ships in this size controlled by 11 Operators. The number of units is 33% or more of total fleet for 8 Operators.
22
23
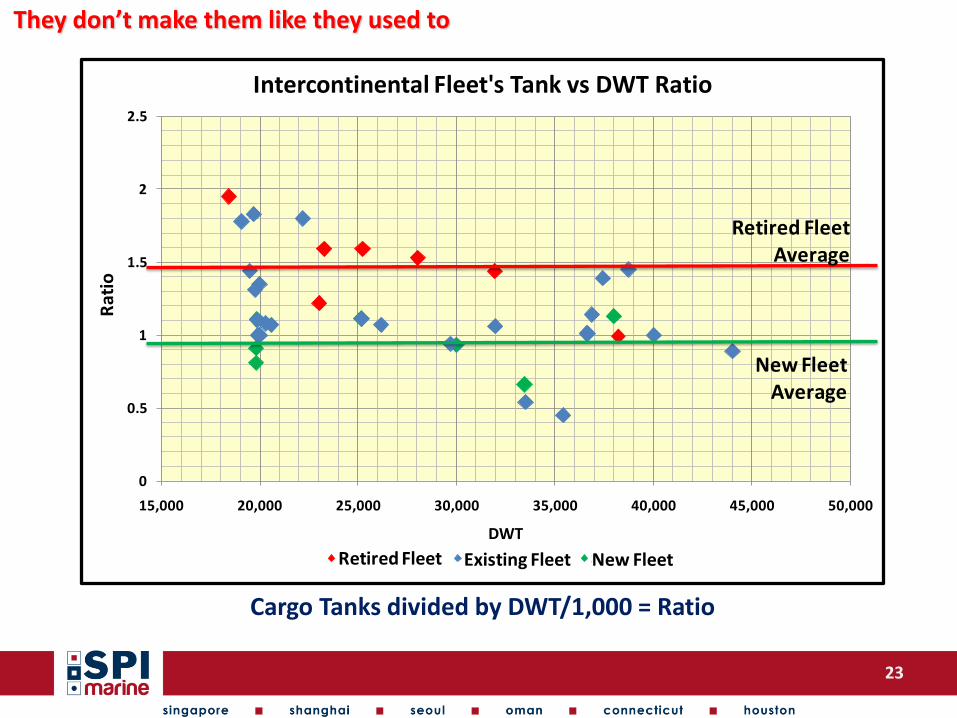
They don’t make them like they used to
Cargo Tanks divided by DWT/1,000 = Ratio
0
0.5
1
1.5
2
2.5
15,000 20,000 25,000 30,000 35,000 40,000 45,000 50,000
Rat
io
DWT
Intercontinental Fleet's Tank vs DWT Ratio
18,421 19,087 25,147Retired Fleet Existing Fleet New Fleet
New Fleet Average
Retired Fleet Average
24
Risk - Reward
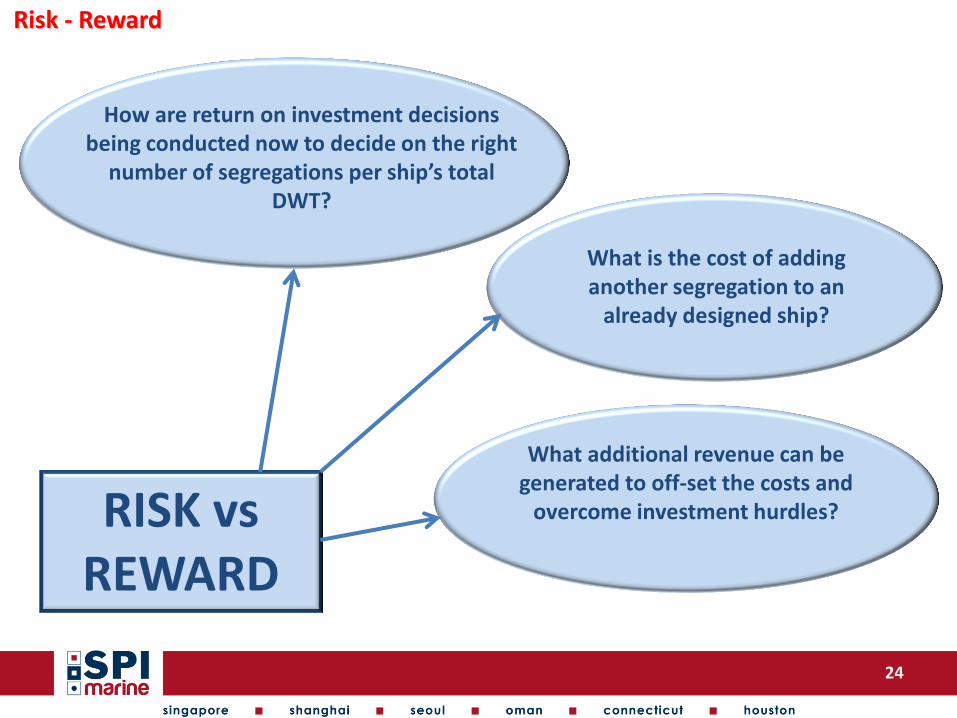
RISK vs REWARD
How are return on investment decisions being conducted now to decide on the right
number of segregations per ship’s total DWT?
What is the cost of adding another segregation to an
already designed ship?
What additional revenue can be generated to off-set the costs and
overcome investment hurdles?
25
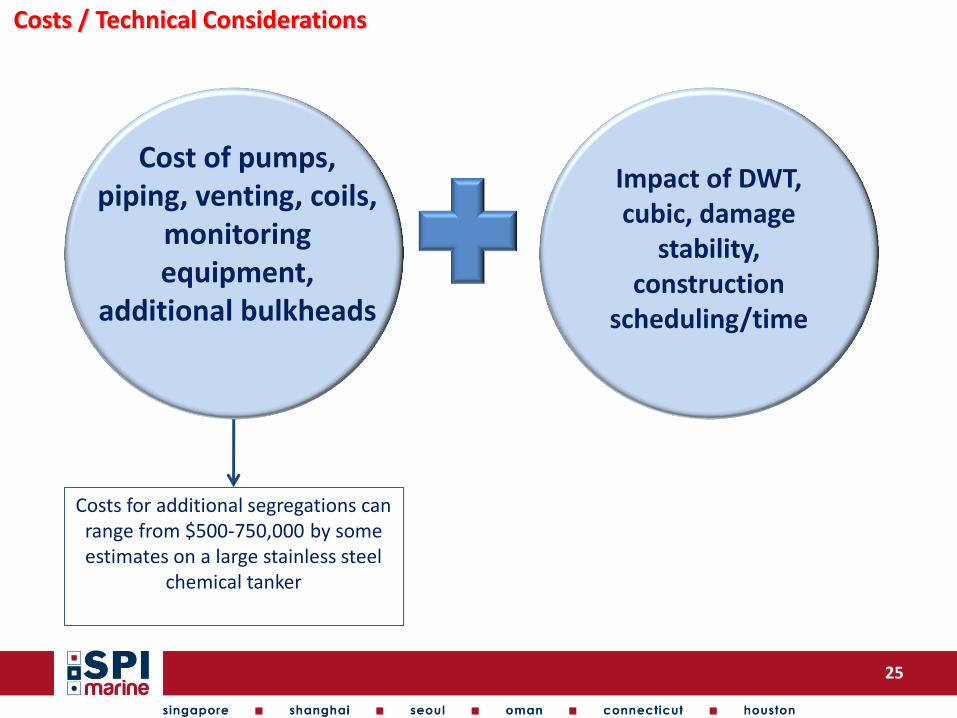
Costs / Technical Considerations
Costs for additional segregations can range from $500-750,000 by some estimates on a large stainless steel
chemical tanker
Cost of pumps, piping, venting, coils,
monitoring equipment,
additional bulkheads
Impact of DWT, cubic, damage
stability, construction
scheduling/time
26
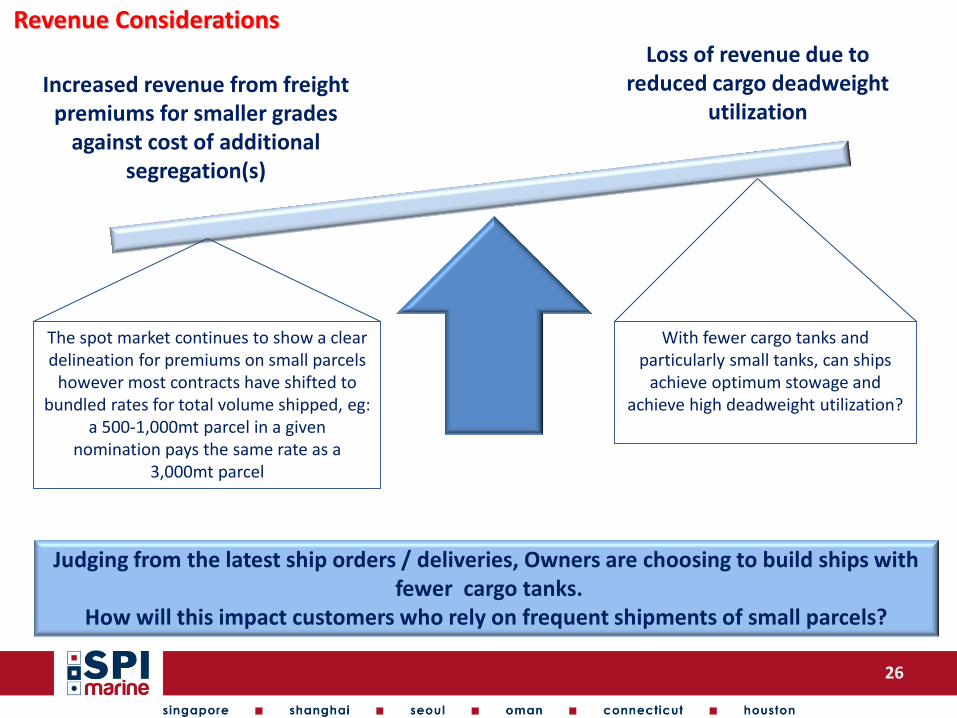
Revenue Considerations
Increased revenue from freight premiums for smaller grades
against cost of additional segregation(s)
The spot market continues to show a clear delineation for premiums on small parcels
however most contracts have shifted to bundled rates for total volume shipped, eg:
a 500-1,000mt parcel in a given nomination pays the same rate as a
3,000mt parcel
Loss of revenue due to reduced cargo deadweight
utilization
With fewer cargo tanks and particularly small tanks, can ships
achieve optimum stowage and achieve high deadweight utilization?
Judging from the latest ship orders / deliveries, Owners are choosing to build ships with fewer cargo tanks.
How will this impact customers who rely on frequent shipments of small parcels?
27
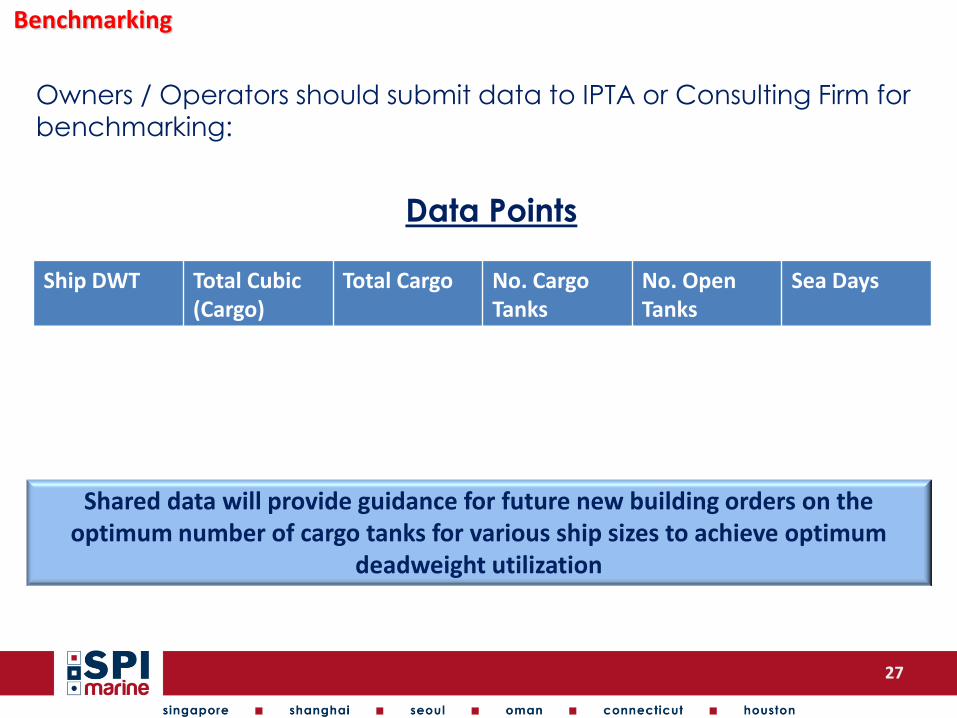
Benchmarking
Owners / Operators should submit data to IPTA or Consulting Firm for
benchmarking:
Data Points
Ship DWT Total Cubic (Cargo)
Total Cargo No. Cargo Tanks
No. Open Tanks
Sea Days
Shared data will provide guidance for future new building orders on the optimum number of cargo tanks for various ship sizes to achieve optimum
deadweight utilization
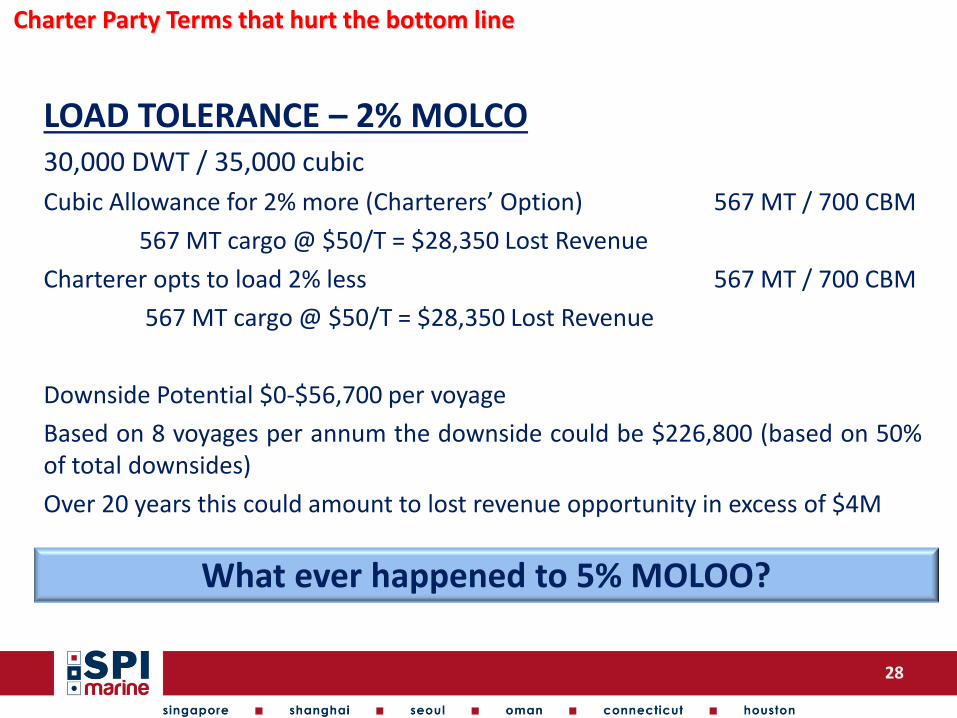
Charter Party Terms that hurt the bottom line
LOAD TOLERANCE – 2% MOLCO 30,000 DWT / 35,000 cubic
Cubic Allowance for 2% more (Charterers’ Option) 567 MT / 700 CBM
567 MT cargo @ $50/T = $28,350 Lost Revenue
Charterer opts to load 2% less 567 MT / 700 CBM
567 MT cargo @ $50/T = $28,350 Lost Revenue
Downside Potential $0-$56,700 per voyage
Based on 8 voyages per annum the downside could be $226,800 (based on 50% of total downsides)
Over 20 years this could amount to lost revenue opportunity in excess of $4M
What ever happened to 5% MOLOO?
28
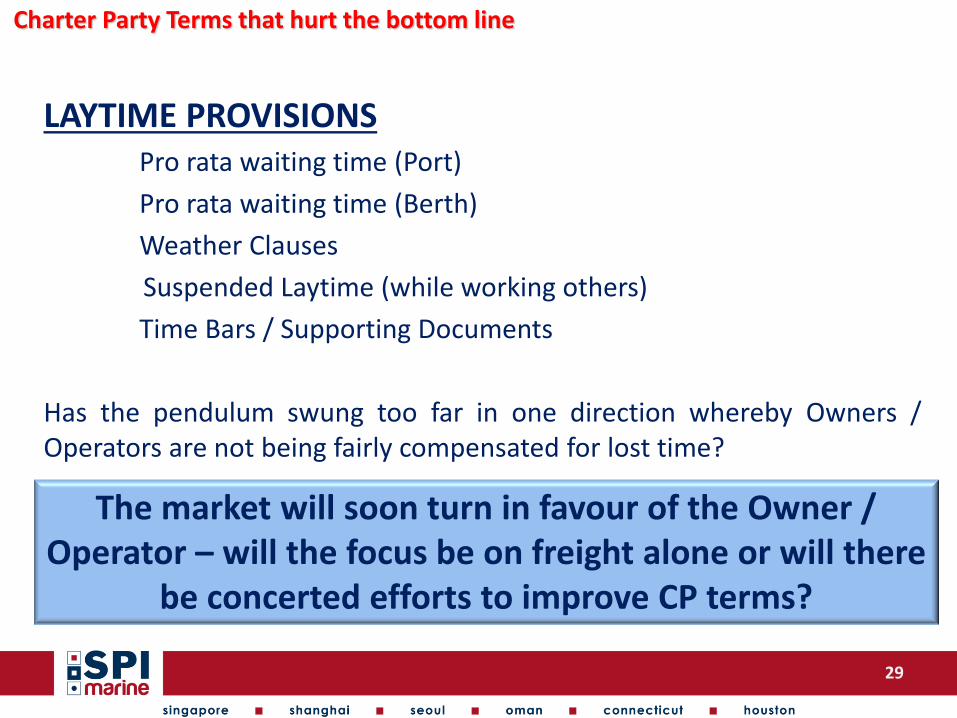
Charter Party Terms that hurt the bottom line
LAYTIME PROVISIONS Pro rata waiting time (Port)
Pro rata waiting time (Berth)
Weather Clauses
Suspended Laytime (while working others)
Time Bars / Supporting Documents
Has the pendulum swung too far in one direction whereby Owners / Operators are not being fairly compensated for lost time?
The market will soon turn in favour of the Owner / Operator – will the focus be on freight alone or will there
be concerted efforts to improve CP terms?
29
30
Contact Details
www.spimarineasia.com www.spimarineusa.com
SPI Marine (Asia) Pte. Ltd.
72-a Peck Seah St
Singapore 079329
Tel: +65 6226 6612
Email: [email protected]
SPI Marine Consulting (Shanghai) Co.Ltd.
Room 1302, Sino Life Tower,
707 Zhangyang Road,
Shanghai 200120
Tel: +86 21 5130 7380
Fax: +86 21 5130 7390
Email: [email protected]
SPI Marine (Korea) Ltd
Korea Office, 604-2 Daewoo Building
167 Naesu-Dong, Jongno-Gu
Seoul, Korea (110-719)
Tel: +82 2 723 6612
Fax: +82 2 723 6663
Email: [email protected]
SPI Marine (Oman) Ptv.
Oman Representative Office
P O Box 474, Falaj al Qabail
PC 322, Sohar, Sultanate of Oman
Tel: +968 9237 8900
Email: [email protected]
SPI Marine (USA), Inc.
Norwalk Cove Marina
50A Calf Pasture Beach Road
Norwalk, CT 06855
Tel: +1 203 642 0100
Email: [email protected]
SPI Marine (Houston), Inc.
1900 West Loop South
Houston, TX 77027
Tel: +1 713 843 7760
E-mail: [email protected]
Contact :