A premier industrial technology company focused on ...
40
Nordson Corporation August 21, 2017 | Fiscal 2017 3Q Results & 4Q Outlook : NDSN A premier industrial technology company focused on precision dispensing, fluid control and related processes Investor Presentation Nordson Corporation
Transcript of A premier industrial technology company focused on ...

Nordson Corporation
August 21, 2017 | Fiscal 2017 3Q Results & 4Q Outlook
: NDSN
A premier industrial technology company
focused on precision dispensing, fluid
control and related processes
Investor Presentation
Nordson Corporation
2
Safe Harbor Statement Under the Private Securities
Litigation Reform Act of 1995
Information in this presentation may contain “forward-looking statements” within the meaning of the U.S. Private Securities Litigation Reform Act of 1995. Forward-looking statements can be identified by words such as “may,” “will,” “should,” “expects,” “intends,” “plans,” “anticipates,” “believes,” “estimates,” “predicts,” “projects,” or “potential” or the negative of these words and phrases or similar words or phrases which are predictions of or indicate future events or trends and which do not relate solely to historical matters.
All statements regarding our future performance, earnings projections, events or developments are forward-looking statements. These forward-looking statements are made based on known events and circumstances at the time of release, and as such, are subject in the future to unforeseen uncertainties and risks that could cause actual results to differ materially from those contained in any forward-looking statement. Such risks and uncertainties are described under “Risk Factors” in Item 1A of our annual report on Form 10-K and any updates to those factors set forth in our subsequent quarterly reports on Form 10-Q or current reports on Form 8-K. We make these statements as of the date of this disclosure, and undertake no obligation to update them unless otherwise required by law.

Nordson at a GlanceA premier industrial technology company focused on precision dispensing,
fluid control and related processes
3
Founded in 1954
FY16 sales = $1.8 billion
7,200 employees
Direct presence in 35+ countries
Best-in-class technology
Diversified, growing end markets
Market leading positions
Sustained financial performance
Outstanding long-term returns
Parts & Consumables
40%
Standard Product
39%
Engineered Systems
21%
4
USA29%
Americas7%
Europe28%
Japan7%
Asia Pacific29%
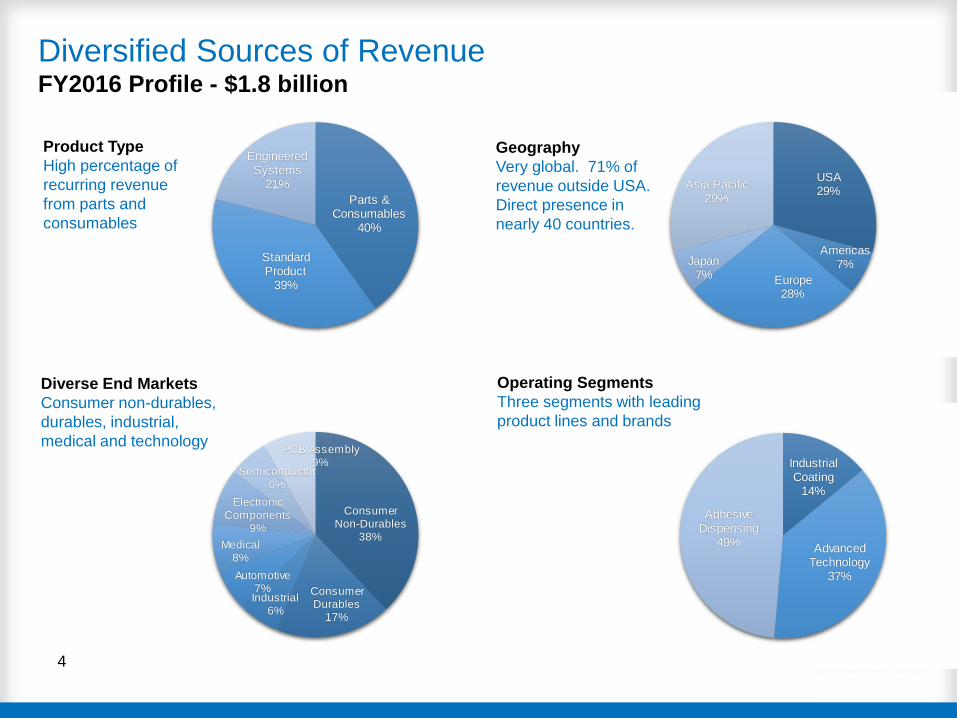
Product Type
High percentage of
recurring revenue
from parts and
consumables
Diversified Sources of RevenueFY2016 Profile - $1.8 billion
Industrial Coating
14%
Advanced Technology
37%
Adhesive Dispensing
49%
Consumer Non-Durables
38%
Consumer Durables
17%
Industrial6%
Automotive7%
Medical8%
Electronic Components
9%
Semiconductor6%
PCB Assembly9%
Geography
Very global. 71% of
revenue outside USA.
Direct presence in
nearly 40 countries.
Diverse End Markets
Consumer non-durables,
durables, industrial,
medical and technology
Operating Segments
Three segments with leading
product lines and brands

Investment Highlights
5
8%
CAGR
2011-2016
Strong
growth:
organic and
acquisitive
Excellent
operating
margins
Strong cash
returns to
shareholders
Reliable and
consistent
dividend
Outstanding
long term
Total
Shareholder
Returns
22%
Operating
Margin
Average
2011-2016
$1.1 billion
Share
repurchases &
dividends
2011-2016
53 Yearsof annual
increases
(21% payout
ratio in 2016)
$1.4 billion
101% of
net income
2011-2016
High level of
free cash
flow before
dividends
124%
TSR*
2011-2016
Outstanding
gross
margins
57%
Gross
Margin
Average
2011-2016
*((Share Price at 10/31/2016 – Share Price at 10/31/2011 + dividends) / Share Price at 10/31/2011 ) = (($100.13 - $46.37 + $3.81) / $46.37 ) = 1.24 = 124%
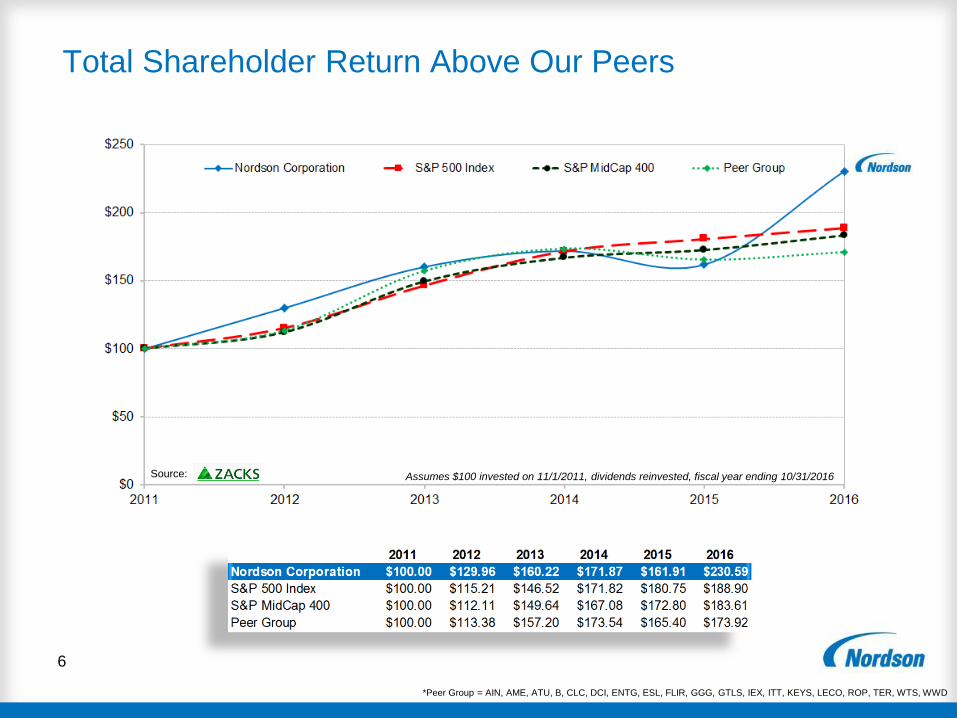
Total Shareholder Return Above Our Peers
6
*Peer Group = AIN, AME, ATU, B, CLC, DCI, ENTG, ESL, FLIR, GGG, GTLS, IEX, ITT, KEYS, LECO, ROP, TER, WTS, WWD
Assumes $100 invested on 11/1/2011, dividends reinvested, fiscal year ending 10/31/2016Source:

Why invest in Nordson?
7
Outstanding Culture and Values
Leading Global Businesses
Clear Strategy and Goals
Strong Execution and Performance
Numerous Growth Opportunities
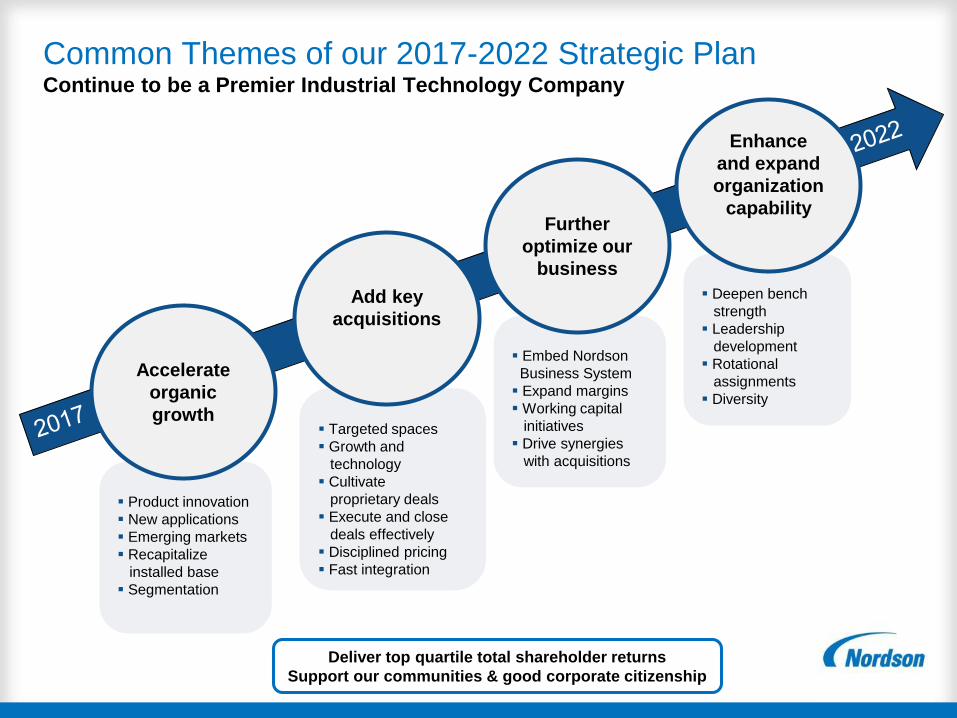
Common Themes of our 2017-2022 Strategic Plan Continue to be a Premier Industrial Technology Company
Product innovation
New applications
Emerging markets
Recapitalize
installed base
Segmentation
Accelerate
organic
growth
Embed Nordson
Business System
Expand margins
Working capital
initiatives
Drive synergies
with acquisitions
Further
optimize our
business
Targeted spaces
Growth and
technology
Cultivate
proprietary deals
Execute and close
deals effectively
Disciplined pricing
Fast integration
Add key
acquisitions
Deepen bench
strength
Leadership
development
Rotational
assignments
Diversity
Enhance
and expand
organization
capability
Deliver top quartile total shareholder returns
Support our communities & good corporate citizenship

Revenue Operating Profit
2017-22 Strategic Plan TargetsFocused initiatives drive premium sales growth and expand profitability
~2x global GDP%
Outpace Revenue
Growth %
Underlying
Markets
Growth
Initiatives
Continuous
Improvement
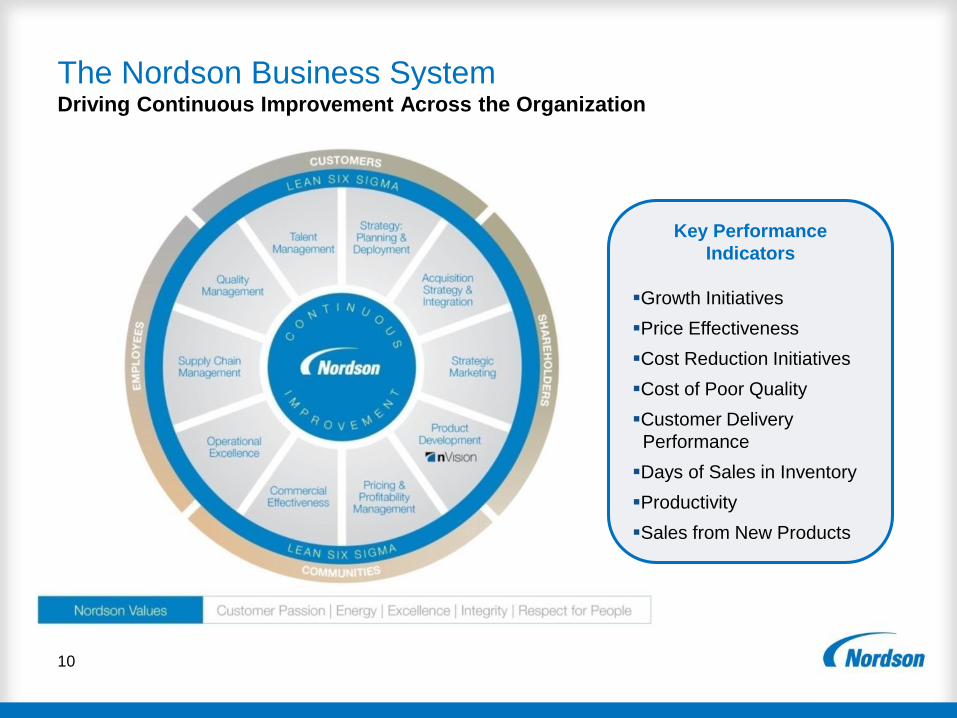
The Nordson Business System Driving Continuous Improvement Across the Organization
10
Key Performance
Indicators
Growth Initiatives
Price Effectiveness
Cost Reduction Initiatives
Cost of Poor Quality
Customer Delivery
Performance
Days of Sales in Inventory
Productivity
Sales from New Products
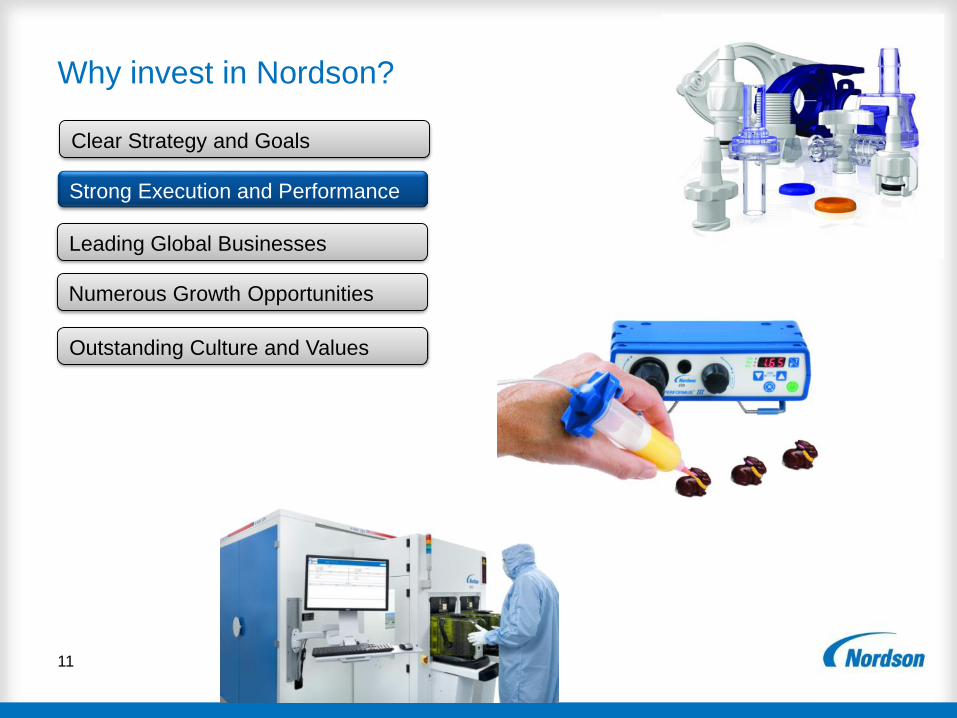
Why invest in Nordson?
11
Outstanding Culture and Values
Leading Global Businesses
Clear Strategy and Goals
Strong Execution and Performance
Numerous Growth Opportunities
0
300
600
900
1,200
1,500
1,800
2,100
'06 '07 '08 '09 '10 '11 '12 '13 '14 '15 '16
0%
5%
10%
15%
20%
25%
30%
06 07 08 09* 10 11 12 13 14 15 16
12
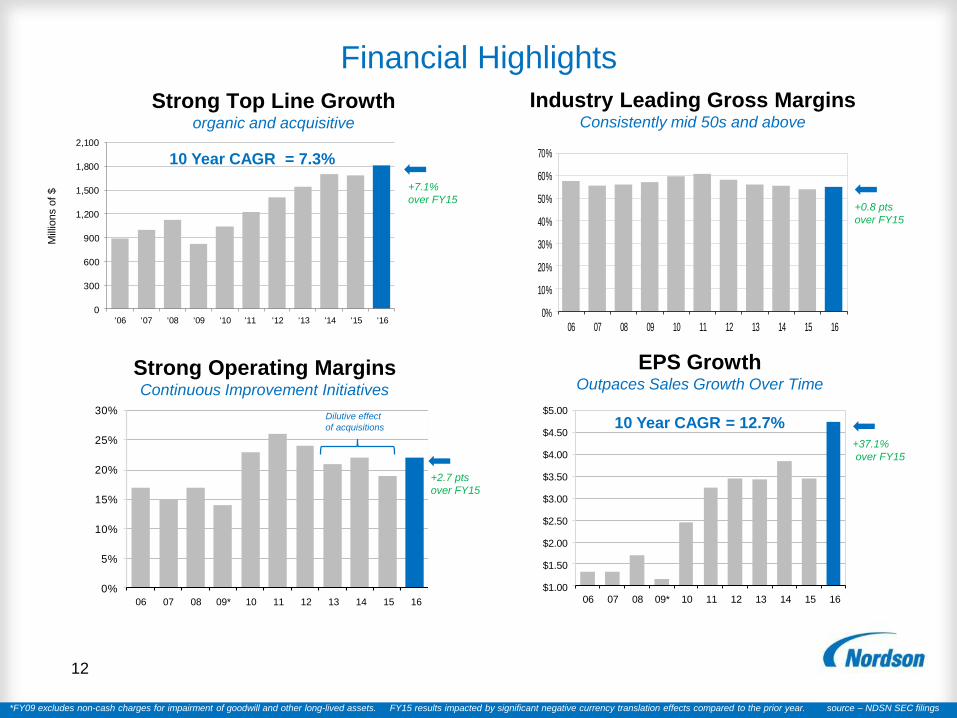
Strong Top Line Growthorganic and acquisitive
0%
10%
20%
30%
40%
50%
60%
70%
06 07 08 09 10 11 12 13 14 15 16
Industry Leading Gross MarginsConsistently mid 50s and above
Mill
ions o
f $
Financial Highlights
*FY09 excludes non-cash charges for impairment of goodwill and other long-lived assets. FY15 results impacted by significant negative currency translation effects compared to the prior year. source – NDSN SEC filings
Strong Operating MarginsContinuous Improvement Initiatives
$1.00
$1.50
$2.00
$2.50
$3.00
$3.50
$4.00
$4.50
$5.00
06 07 08 09* 10 11 12 13 14 15 16
EPS Growth Outpaces Sales Growth Over Time
Dilutive effect
of acquisitions
10 Year CAGR = 7.3%
10 Year CAGR = 12.7%
+7.1%
over FY15+0.8 pts
over FY15
+2.7 pts
over FY15
+37.1%
over FY15

Strong Cash Generation Funds Growth and Returns to Shareholders
13
Strong Cash Conversion: 2006-16Free cash flow before dividends = 103% of net income
Cash from Operations: 2006-16> 10% as a % of sales every year
$000
$000
$0
$50,000
$100,000
$150,000
$200,000
$250,000
$300,000
$350,000
Net cash provided by operating activities
$-
$50,000
$100,000
$150,000
$200,000
$250,000
$300,000
Free cash flow before dividends Net income
*FY09 excludes non-cash charges for impairment of goodwill and other long-lived assets. FY15 results impacted by significant negative currency translation effects compared to the prior year. source – NDSN SEC filings

$24.8 $30.0
$49.2 $49.1 $66.7
$64.6
$284.4
$293.0
$441.7 $176.3
$186.4
$75.6
$42.7
$1,215.7
$29.8
$33.8
$40.5
$48.4
$54.8
$56.4
$263.7
$138.0
$88.5 $33.4
$166.4
$383.9
$33.4 $843.6
$28.5 $20.2 $25.8 $40.6 $37.7
$21.3 $174.1
0%
10%
20%
30%
40%
50%
60%
70%
80%
90%
100%
2011 2012 2013 2014 2015 2016 TOTAL
Disciplined Capital Deployment
14
PP&E/Leases
10%
Acquisitions
44%
Dividends
10%
Share Repur.
30%
Working Cap.
6%
40% or $1.1 billion
to shareholders via share repurchases
and dividends
Self funding business model generates excess cash
Low Working Capital Requirements
Low Capital Expenditures (approx. 3% of sales)
Strong free cash
54 consecutive years of dividend increases - 14th among publicly traded companies
$ millions
0.0
0.5
1.0
1.5
2.0
2.5
3.0
3.5
4.0
20
01
20
02
20
03
20
04
20
05
20
06
20
07
20
08
20
09
20
10
20
11
20
12
20
13
20
14
20
15
20
16
15
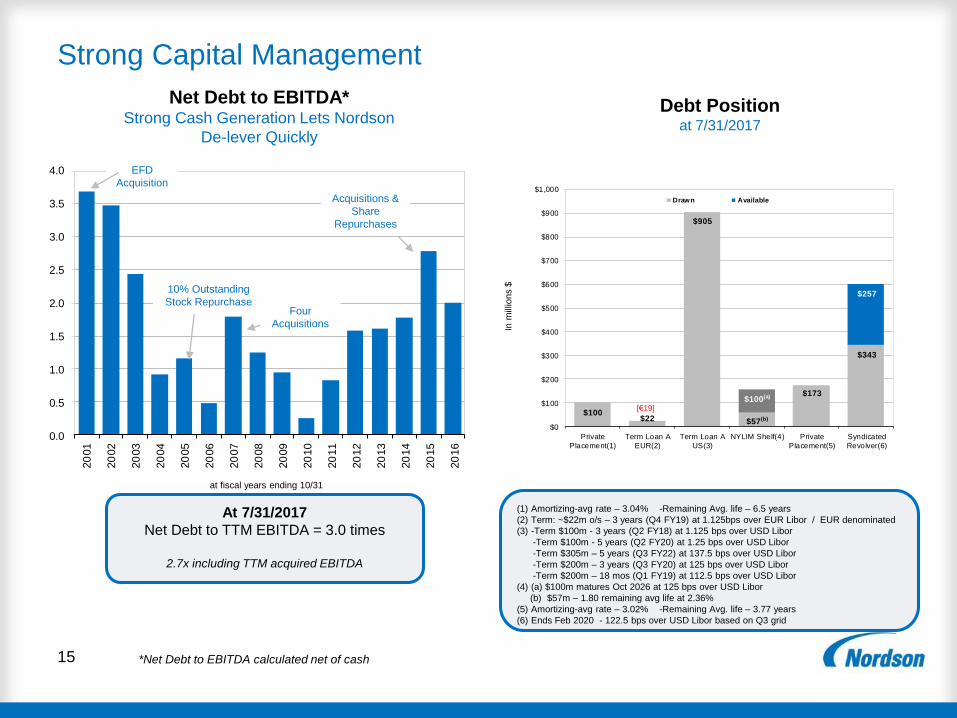
Strong Capital Management
Four
Acquisitions
10% Outstanding
Stock Repurchase
$100$22
$905
$57(b)
$173
$343
$100(a)
$257
$0
$100
$200
$300
$400
$500
$600
$700
$800
$900
$1,000
Private
Placement(1)
Term Loan A
EUR(2)
Term Loan A
US(3)
NYLIM Shelf(4) Private
Placement(5)
Syndicated
Revolver(6)
Drawn Available
Net Debt to EBITDA*Strong Cash Generation Lets Nordson
De-lever Quickly
EFD
Acquisition
*Net Debt to EBITDA calculated net of cash
In m
illio
ns $
Acquisitions &
Share
Repurchases
at fiscal years ending 10/31
Debt Positionat 7/31/2017
[€19]
At 7/31/2017
Net Debt to TTM EBITDA = 3.0 times
2.7x including TTM acquired EBITDA
(1) Amortizing-avg rate – 3.04% -Remaining Avg. life – 6.5 years
(2) Term: ~$22m o/s – 3 years (Q4 FY19) at 1.125bps over EUR Libor / EUR denominated
(3) -Term $100m - 3 years (Q2 FY18) at 1.125 bps over USD Libor
-Term $100m - 5 years (Q2 FY20) at 1.25 bps over USD Libor
-Term $305m – 5 years (Q3 FY22) at 137.5 bps over USD Libor
-Term $200m – 3 years (Q3 FY20) at 125 bps over USD Libor
-Term $200m – 18 mos (Q1 FY19) at 112.5 bps over USD Libor
(4) (a) $100m matures Oct 2026 at 125 bps over USD Libor
(b) $57m – 1.80 remaining avg life at 2.36%
(5) Amortizing-avg rate – 3.02% -Remaining Avg. life – 3.77 years
(6) Ends Feb 2020 - 122.5 bps over USD Libor based on Q3 grid

Fiscal Year 2017 3Q Results and 4Q Guidanceas reported in August 21-22, 2017 press release and webcast
16
Nordson Corporation Reports Record Quarterly Revenue, Operating Profit, Diluted EPS
and EBITDA in Third Quarter of Fiscal Year 2017
Sales increase 20 percent from prior year’s third quarter to $589 million, with all three segments contributing to
11 percent organic growth
Operating profit increases 24 percent to $153 million and operating margin improves by 1 percentage point to
26 percent, both compared to the prior year’s third quarter and both inclusive of $6 million of intangible asset
amortization expense for fiscal 2017 acquisitions
GAAP diluted EPS increases 19 percent to $1.74 and adjusted diluted EPS increases 21 percent to $1.78,
both compared to the prior year’s third quarter
EBITDA increases 29 percent to $179 million, EBITDA margin improves 2 percentage points to 30 percent,
and EBITDA per diluted share increases 27 percent to $3.08, all compared to the prior year’s third quarter
Free cash flow before dividends increases 14 percent compared to the prior year’s third quarter to $55 million
Order Rates and Guidance
Pro-forma 12 week order rates decrease 2 percent over same period a year ago
Fourth quarter 2017 guidance: sales expected to increase 4 to 8 percent over prior year; GAAP diluted EPS in the
range of $1.18 to $1.32; EBITDA in the range of $133 to $144 million, or $2.27 to $2.46 per diluted share
See Nordson press release, conference call transcript, presentation Appendix, and SEC filings reconciling adjusted amounts to reported amounts

Why invest in Nordson?
17
Outstanding Culture and Values
Leading Global Businesses
Clear Strategy and Goals
Strong Execution and Performance
Numerous Growth Opportunities

We Win with Unique Competitive AdvantagesCommon across our businesses
Strategic Assets
Customer relationships with leaders
Product breadth
Technology position
Premier brand reputation
Large installed product base
Global footprint (distribution, support)
Balance sheet / ability to scale production
Core Competencies
Application development
Precision manufacturing
Engineering strength
Technical expertise
Direct global sales and service
Customer “touch” / solutions provider
18
Customer Value Proposition
Product reliability = more uptime
Speed = greater productivity and yield
Efficiency = lower material usage
Leading product features = ease of operation
Unmatched global support
Lower Cost of
Ownership
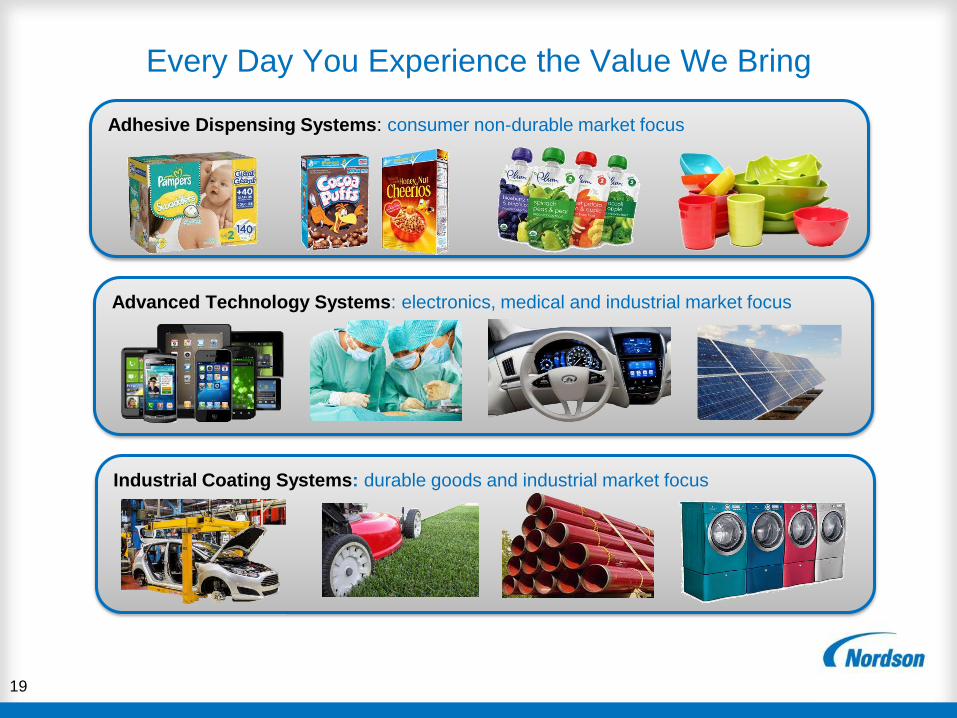
Industrial Coating Systems: durable goods and industrial market focus
Advanced Technology Systems: electronics, medical and industrial market focus
Adhesive Dispensing Systems: consumer non-durable market focus
Every Day You Experience the Value We Bring
19
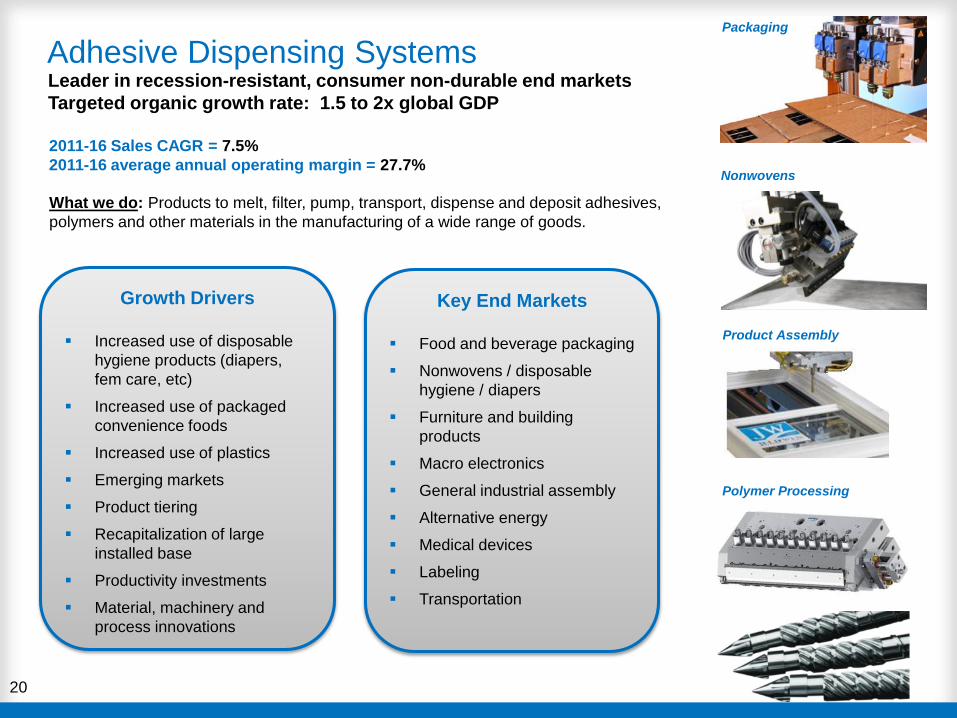
Nonwovens
20
Adhesive Dispensing Systems
What we do: Products to melt, filter, pump, transport, dispense and deposit adhesives,
polymers and other materials in the manufacturing of a wide range of goods.
Leader in recession-resistant, consumer non-durable end markets
Targeted organic growth rate: 1.5 to 2x global GDP
Growth Drivers
Increased use of disposable
hygiene products (diapers,
fem care, etc)
Increased use of packaged
convenience foods
Increased use of plastics
Emerging markets
Product tiering
Recapitalization of large
installed base
Productivity investments
Material, machinery and
process innovations
Key End Markets
Food and beverage packaging
Nonwovens / disposable
hygiene / diapers
Furniture and building
products
Macro electronics
General industrial assembly
Alternative energy
Medical devices
Labeling
Transportation
2011-16 Sales CAGR = 7.5%
2011-16 average annual operating margin = 27.7%
Polymer Processing
Packaging
Product Assembly
21
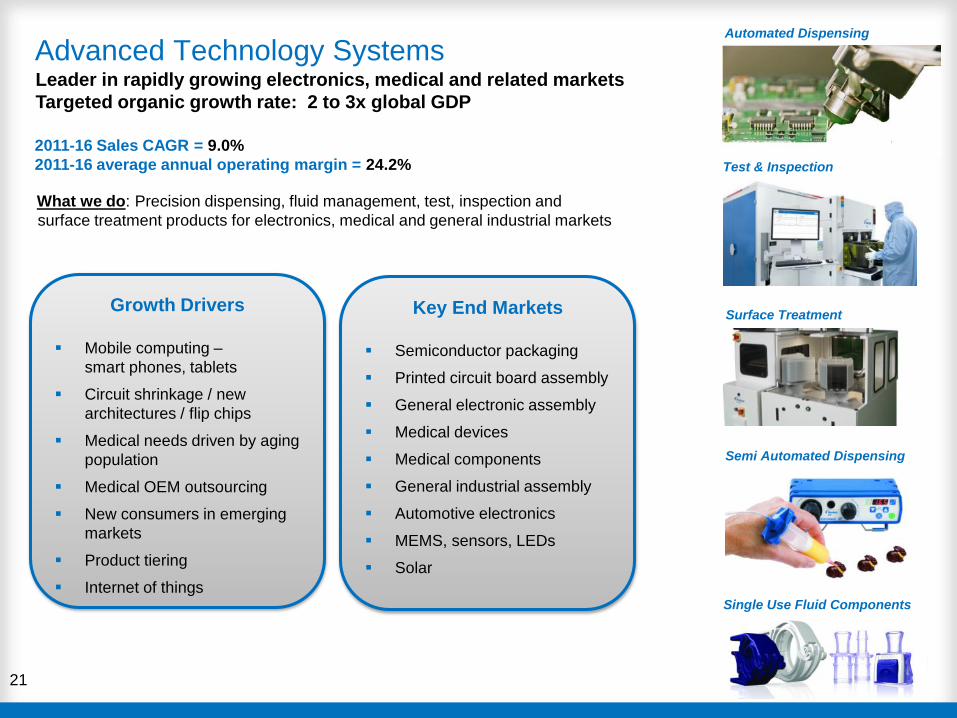
Advanced Technology Systems
What we do: Precision dispensing, fluid management, test, inspection and
surface treatment products for electronics, medical and general industrial markets
Automated Dispensing
Semi Automated Dispensing
Leader in rapidly growing electronics, medical and related markets
Targeted organic growth rate: 2 to 3x global GDP
Growth Drivers
Mobile computing –
smart phones, tablets
Circuit shrinkage / new
architectures / flip chips
Medical needs driven by aging
population
Medical OEM outsourcing
New consumers in emerging
markets
Product tiering
Internet of things
Key End Markets
Semiconductor packaging
Printed circuit board assembly
General electronic assembly
Medical devices
Medical components
General industrial assembly
Automotive electronics
MEMS, sensors, LEDs
Solar
2011-16 Sales CAGR = 9.0%
2011-16 average annual operating margin = 24.2% Test & Inspection
Single Use Fluid Components
Surface Treatment

Industrial Coating Systems
22
What we do: Precision equipment and systems to apply and cure paints, sealants,
coatings, cold materials and other materials to a wide range of products
Leader in consumer durable goods and industrial end markets
Targeted organic growth rate: global GDP+
Growth Drivers
Growth in emerging markets
Environmental advantages of
powder coatings
Glues replacing mechanical
fasteners
Light-weighting of vehicles
Productivity investments
Lean manufacturing
Quick color change
Product tiering
Key End Markets
Appliances
Lawn and garden
Food and beverage
Automotive assembly
Cold material dispensing
Pipe coating and construction
Woodworking
General industrial
Electronics / UV curing
2011-16 Sales CAGR = 6.7%
2011-16 average annual operating margin = 15.1%Container Coating
Powder Coating
Liquid Painting
Cold Material Dispensing
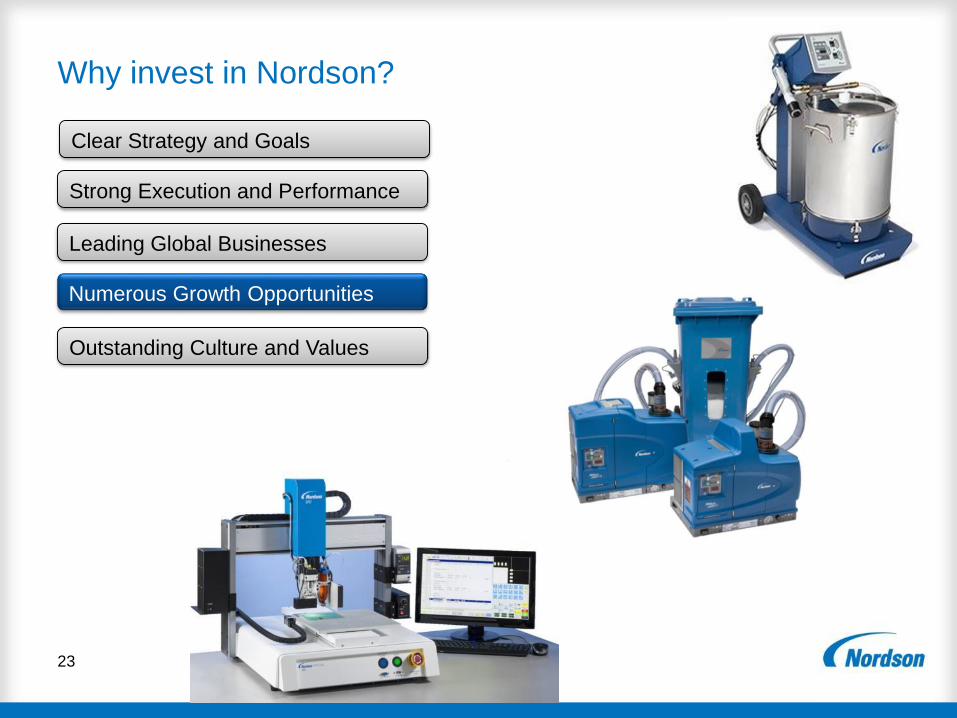
Why invest in Nordson?
23
Outstanding Culture and Values
Leading Global Businesses
Clear Strategy and Goals
Strong Execution and Performance
Numerous Growth Opportunities

0
5
10
15
20
Global GDP NDSN Annual Organic Growth Rate Target
24
Multiple Paths to Organic GrowthAnnual Target is ~2x global GDP
New Products
Recapitalize Installed Base
Emerging Markets
New Applications
Customer Product Changes
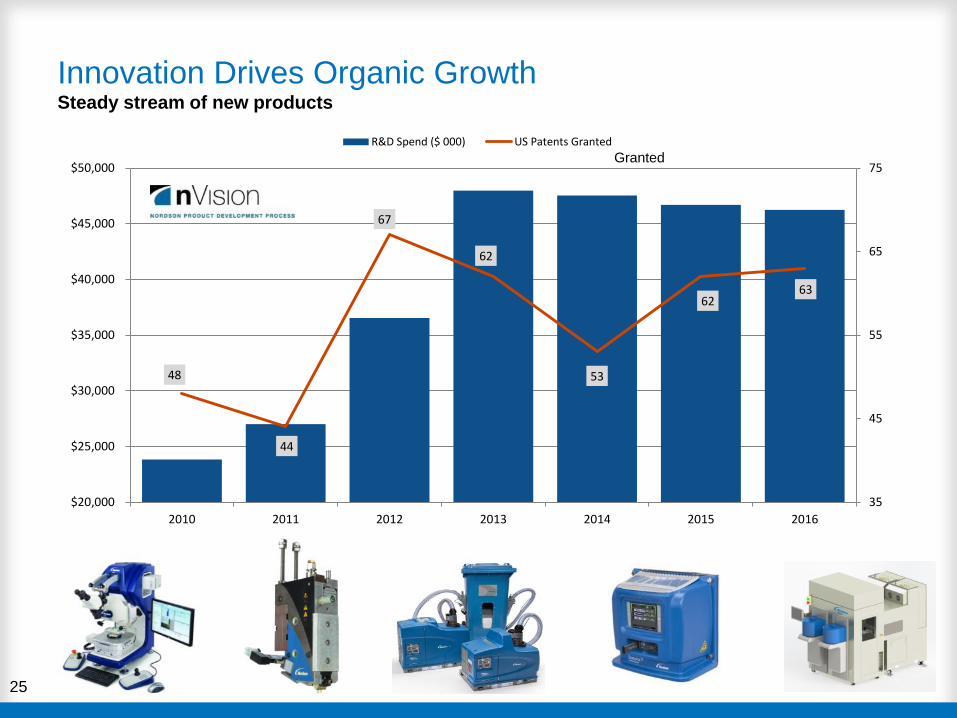
48
44
67
62
53
6263
35
45
55
65
75
$20,000
$25,000
$30,000
$35,000
$40,000
$45,000
$50,000
2010 2011 2012 2013 2014 2015 2016
R&D Spend ($ 000) US Patents Granted
Innovation Drives Organic GrowthSteady stream of new products
25
Granted
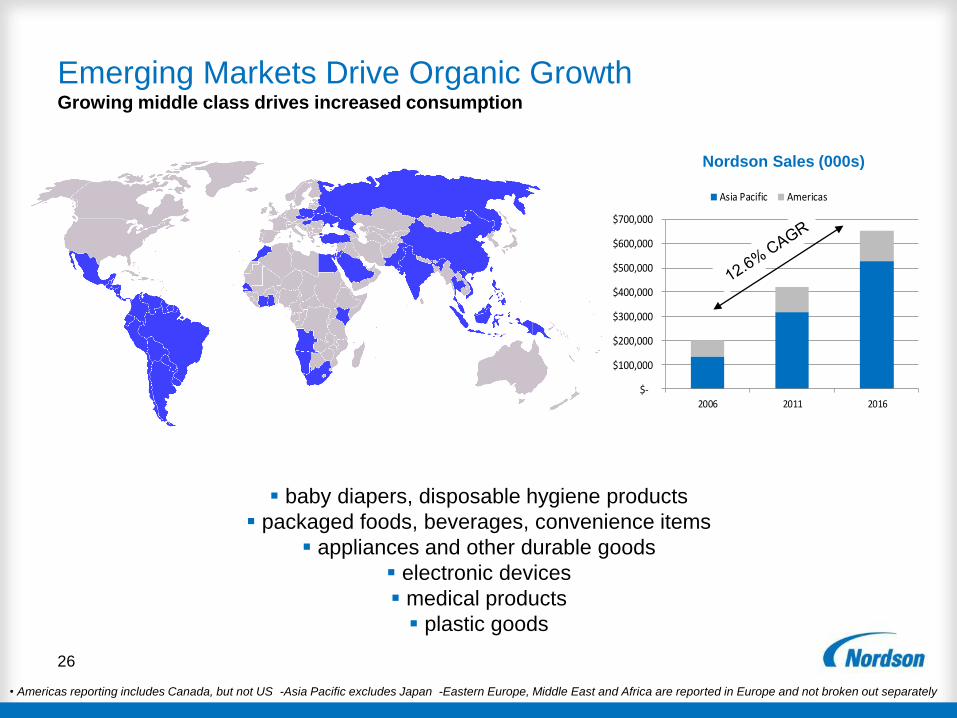
Emerging Markets Drive Organic GrowthGrowing middle class drives increased consumption
26
baby diapers, disposable hygiene products
packaged foods, beverages, convenience items
appliances and other durable goods
electronic devices
medical products
plastic goods
$-
$100,000
$200,000
$300,000
$400,000
$500,000
$600,000
$700,000
2006 2011 2016
Asia Pacific Americas
Nordson Sales (000s)
• Americas reporting includes Canada, but not US -Asia Pacific excludes Japan -Eastern Europe, Middle East and Africa are reported in Europe and not broken out separately

Biopharmaceuticals
Orthobiologics
Minimally invasive catheters
Bottle labeling
Pipe coating
Flexible packaging
New Applications Drive Organic GrowthLeveraging our expertise – numerous emerging opportunities over last five years
Sensor assembly
LED assembly
MEMS assembly
Wafer level inspection
Wearable electronics
Micro-materials testing
Aerospace assembly
27

Recapitalization Drives Organic GrowthLarge installed base of Nordson products worldwide provides
regular replacement and upgrade opportunities
28
Packaging lines
Nonwovens lines
Powder coating lines
Extrusion & injection molding lines
Electronics assembly lines

-25.0%
-15.0%
-5.0%
5.0%
15.0%
25.0%
35.0%
200
6
200
7
200
8
200
9
201
0
201
1
201
2
201
3
201
4
201
5
201
6
Organic Volume Acquisitions
Acquisitions Drive GrowthHigh quality properties supplement organic growth
29
Current Focus and Recent Transactions
Polymer
Processing
Fluid Mgmt.
(medical)
Test &
InspectionCold Material
Dispense
Core Dispense
Portfolio
Key Criteria
Strategic fit
Strong performers
Growth rate at/above Nordson
High % recurring revenue
Reasonable multiples
Revenue and cost synergies
2006-16: 3.7% average annual growth from acquisitions
pause
during
recession
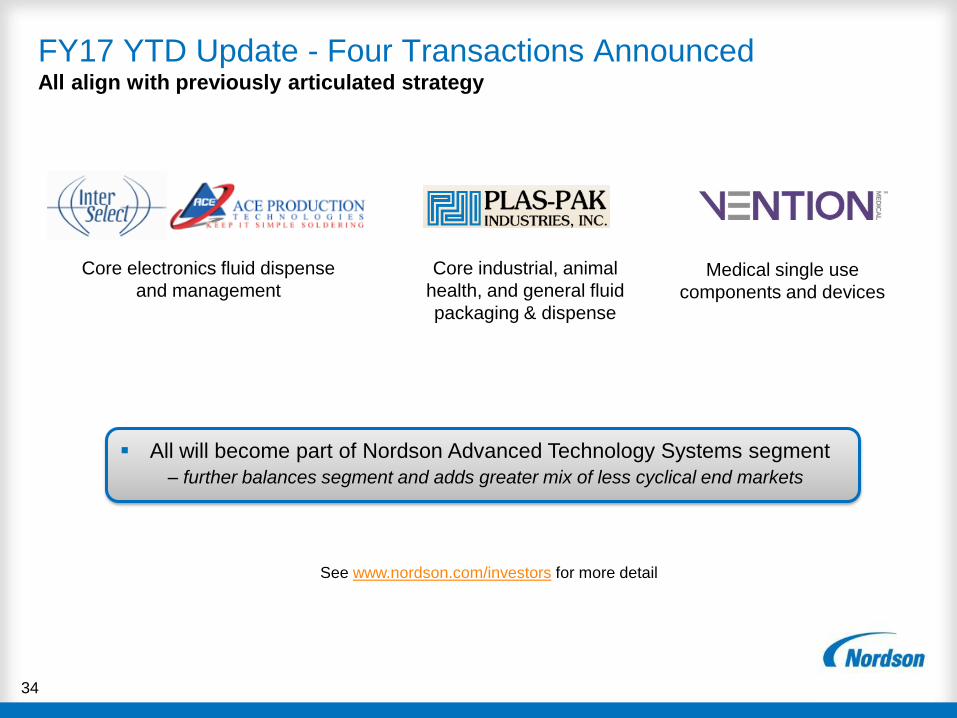
FY17 YTD Update - Four Transactions AnnouncedAll align with previously articulated strategy
All will become part of Nordson Advanced Technology Systems segment
– further balances segment and adds greater mix of less cyclical end markets
Core electronics fluid dispense
and management
Core industrial, animal
health, and general fluid
packaging & dispense
Medical single use
components and devices
See www.nordson.com/investors for more detail
34
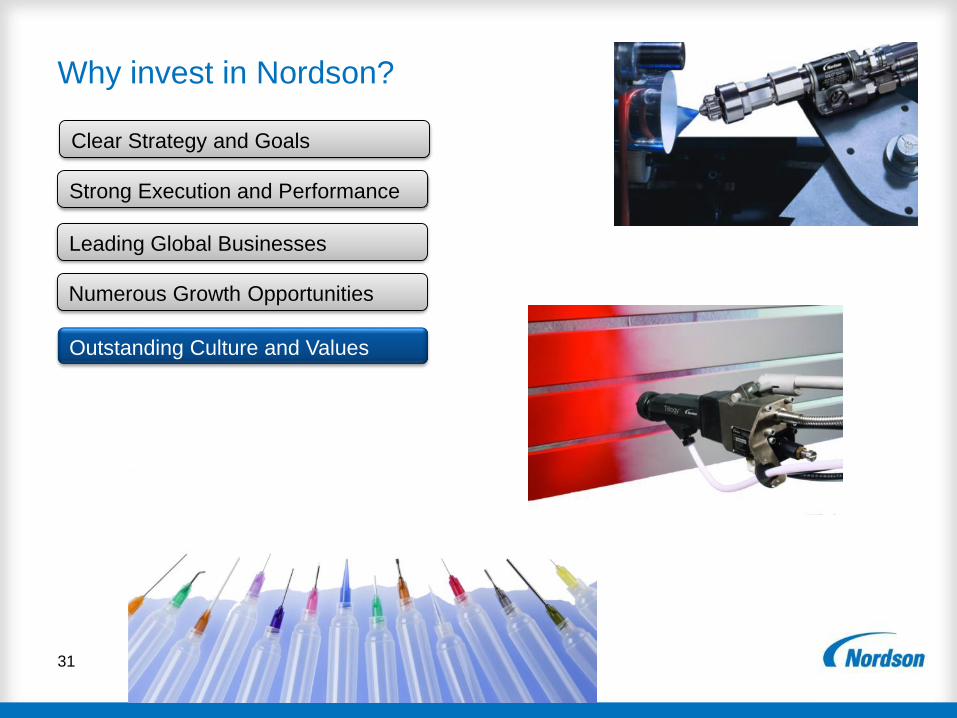
Why invest in Nordson?
31
Outstanding Culture and Values
Leading Global Businesses
Clear Strategy and Goals
Strong Execution and Performance
Numerous Growth Opportunities
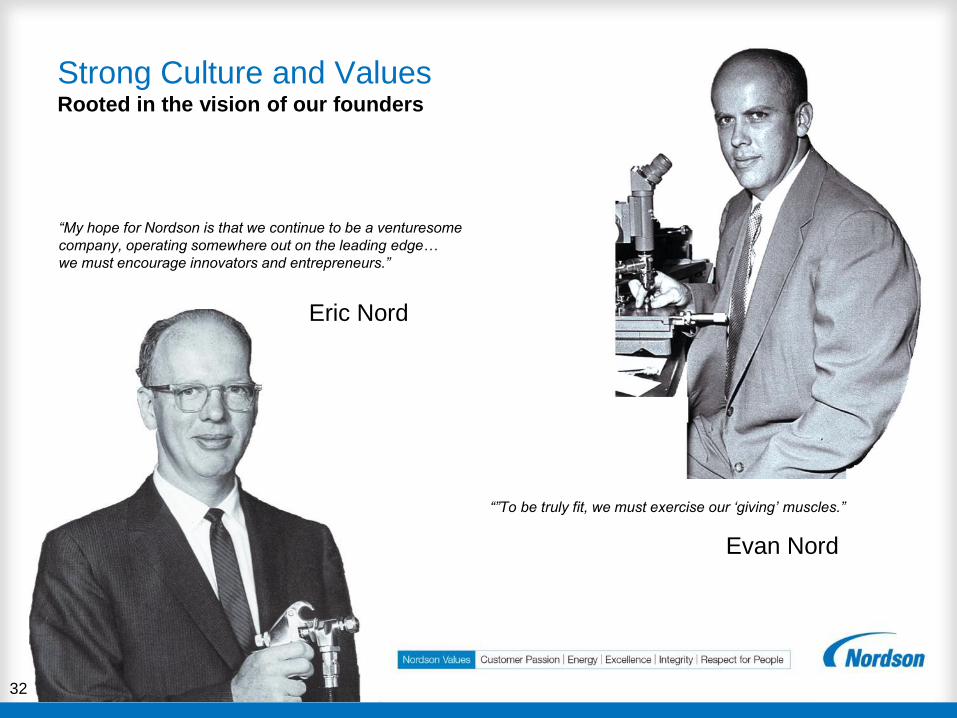
Strong Culture and ValuesRooted in the vision of our founders
32
Evan Nord
Eric Nord
“My hope for Nordson is that we continue to be a venturesome
company, operating somewhere out on the leading edge…
we must encourage innovators and entrepreneurs.”
“”To be truly fit, we must exercise our ‘giving’ muscles.”
33
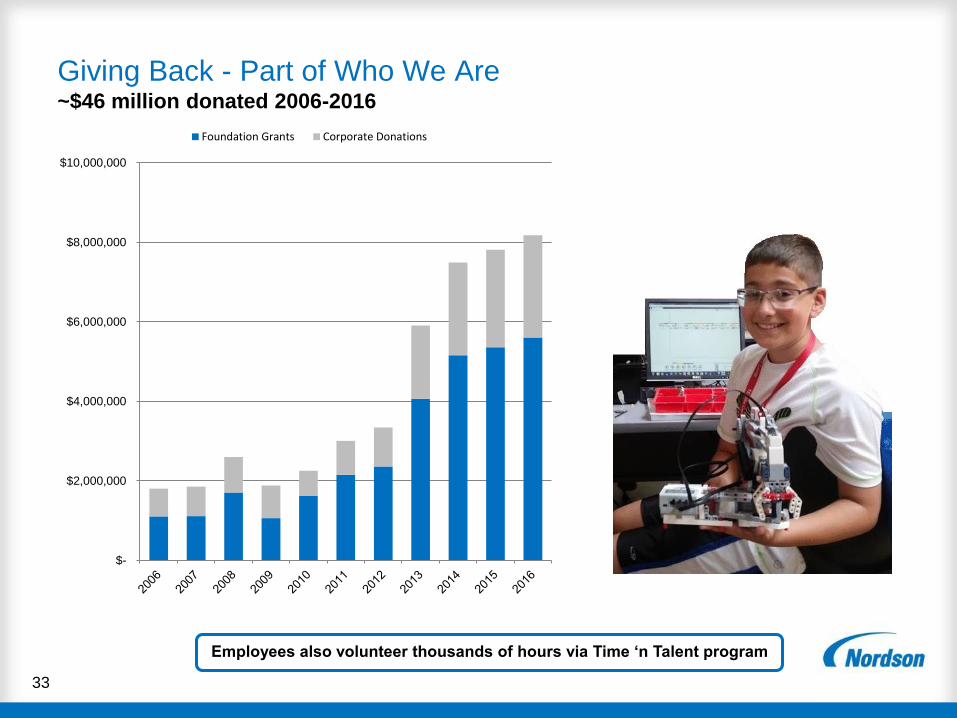
Giving Back - Part of Who We Are~$46 million donated 2006-2016
Employees also volunteer thousands of hours via Time ‘n Talent program
$-
$2,000,000
$4,000,000
$6,000,000
$8,000,000
$10,000,000
Foundation Grants Corporate Donations
34
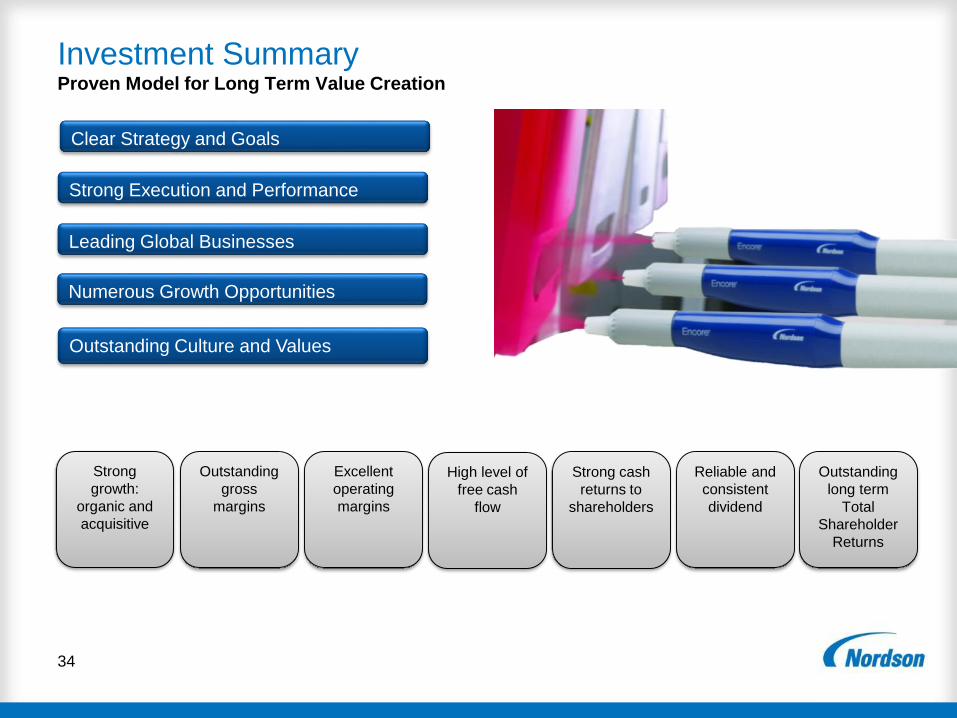
Investment SummaryProven Model for Long Term Value Creation
Outstanding Culture and Values
Leading Global Businesses
Clear Strategy and Goals
Strong Execution and Performance
Numerous Growth Opportunities
Strong
growth:
organic and
acquisitive
Excellent
operating
margins
Strong cash
returns to
shareholders
Reliable and
consistent
dividend
Outstanding
long term
Total
Shareholder
Returns
High level of
free cash
flow
Outstanding
gross
margins

Financial Appendix
36
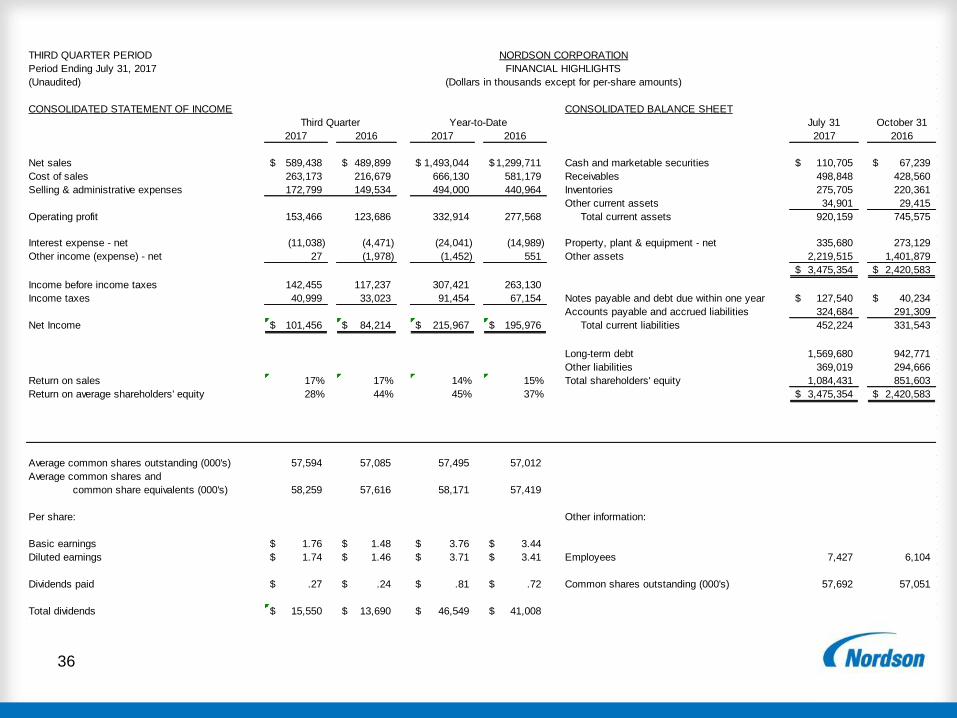
THIRD QUARTER PERIOD NORDSON CORPORATION
Period Ending July 31, 2017 FINANCIAL HIGHLIGHTS
(Unaudited) (Dollars in thousands except for per-share amounts)
CONSOLIDATED STATEMENT OF INCOME CONSOLIDATED BALANCE SHEET
Third Quarter Year-to-Date July 31 October 31
2017 2016 2017 2016 2017 2016
Net sales 589,438$ 489,899$ 1,493,044$ 1,299,711$ Cash and marketable securities 110,705$ 67,239$
Cost of sales 263,173 216,679 666,130 581,179 Receivables 498,848 428,560
Selling & administrative expenses 172,799 149,534 494,000 440,964 Inventories 275,705 220,361
Other current assets 34,901 29,415
Operating profit 153,466 123,686 332,914 277,568 Total current assets 920,159 745,575
Interest expense - net (11,038) (4,471) (24,041) (14,989) Property, plant & equipment - net 335,680 273,129
Other income (expense) - net 27 (1,978) (1,452) 551 Other assets 2,219,515 1,401,879
3,475,354$ 2,420,583$
Income before income taxes 142,455 117,237 307,421 263,130
Income taxes 40,999 33,023 91,454 67,154 Notes payable and debt due within one year 127,540$ 40,234$
Accounts payable and accrued liabilities 324,684 291,309
Net Income 101,456$ 84,214$ 215,967$ 195,976$ Total current liabilities 452,224 331,543
Long-term debt 1,569,680 942,771
Other liabilities 369,019 294,666
Return on sales 17% 17% 14% 15% Total shareholders' equity 1,084,431 851,603
Return on average shareholders' equity 28% 44% 45% 37% 3,475,354$ 2,420,583$
Average common shares outstanding (000's) 57,594 57,085 57,495 57,012
Average common shares and
common share equivalents (000's) 58,259 57,616 58,171 57,419
Per share: Other information:
Basic earnings 1.76$ 1.48$ 3.76$ 3.44$
Diluted earnings 1.74$ 1.46$ 3.71$ 3.41$ Employees 7,427 6,104
Dividends paid .27$ .24$ .81$ .72$ Common shares outstanding (000's) 57,692 57,051
Total dividends 15,550$ 13,690$ 46,549$ 41,008$

37
THIRD QUARTER PERIOD NORDSON CORPORATION
Period Ending July 31, 2017 FINANCIAL HIGHLIGHTS
(Unaudited) (Dollars in thousands)
Third Quarter % Growth over 2016 Year-to-Date % Growth over 2016
SALES BY BUSINESS SEGMENT 2017 2016 Volume Currency Total 2017 2016 Volume Currency Total
Adhesive dispensing systems 233,367$ 220,800$ 6.0% -0.3% 5.7% 668,146$ 645,269$ 4.5% -1.0% 3.5%
Advanced technology systems 290,406 205,372 41.8% -0.4% 41.4% 645,907 481,787 35.1% -1.0% 34.1%
Industrial coating systems 65,665 63,727 3.4% -0.4% 3.0% 178,991 172,655 4.9% -1.2% 3.7%
Total sales by business segment 589,438$ 489,899$ 20.7% -0.4% 20.3% 1,493,044$ 1,299,711$ 16.0% -1.1% 14.9%
OPERATING PROFIT BY BUSINESS SEGMENT 2017 2016 2017 2016
Adhesive dispensing systems 66,451$ 60,423$ 185,226$ 173,760$
Advanced technology systems 87,385 63,115 168,054 109,819
Industrial coating systems 13,192 10,612 30,529 25,082
Corporate (13,562) (10,464) (50,895) (31,093)
Total operating profit by business segment 153,466$ 123,686$ 332,914$ 277,568$
Third Quarter % Growth over 2016 Year-to-Date % Growth over 2016
SALES BY GEOGRAPHIC REGION 2017 2016 Volume Currency Total 2017 2016 Volume Currency Total
United States 182,953$ 135,067$ 35.5% - 35.5% 464,569$ 383,720$ 21.1% - 21.1%
Americas 41,604 30,534 35.6% 0.7% 36.3% 107,971 90,823 19.7% -0.8% 18.9%
Europe 133,846 128,583 4.0% 0.1% 4.1% 381,473 374,234 4.2% -2.3% 1.9%
Japan 41,472 34,709 25.4% -5.9% 19.5% 96,504 83,578 16.1% -0.6% 15.5%
Asia Pacific 189,563 161,006 17.9% -0.2% 17.7% 442,527 367,356 21.6% -1.1% 20.5%
Total Sales by Geographic Region 589,438$ 489,899$ 20.7% -0.4% 20.3% 1,493,044$ 1,299,711$ 16.0% -1.1% 14.9%
Year-to-Date
FREE CASH FLOW BEFORE DIVIDENDS 2017 2016 2017 2016
Net income 101,456$ 84,214$ 215,967$ 195,976$
Depreciation and amortization 25,954 17,662 65,366 52,824
Other non-cash charges (8,592) 4,455 3,041 13,213
Changes in operating assets and liabilities (41,991) (38,485) (68,183) (67,279)
Net cash provided by operating activities 76,827 67,846 216,191 194,734
Additions to property, plant and equipment (22,295) (19,931) (49,324) (45,452)
Proceeds from the sale of property, plant and equipment 308 173 3,906 1,044
Free cash flow before dividends 54,840$ 48,088$ 170,773$ 150,326$
Adjustments:
Acquisition costs and adjustments, net of tax (1) 1,597 - 12,564 1,325
Free cash flow before dividends, adjusted 56,437$ 48,088$ 183,337$ 151,651$
(1) Represents one-time costs, net of tax, associated with our 2017 and 2016 acquisitions, including the step up in the value of acquired inventory and acquisition
transaction costs that are required to be expensed as incurred.
Third Quarter Year-to-Date
Third Quarter

38 |
THIRD QUARTER PERIOD NORDSON CORPORATION
Period Ending July 31, 2017 RECONCILIATION OF NON-GAAP FINANCIAL MEASURES
(Unaudited) (Dollars in thousands except for per-share amounts)
EBITDA and EBITDA per diluted share Third Quarter Year-to-Date
2017 2016 2017 2016
Net income 101,456$ 84,214$ 215,967$ 195,976$
Adjustments:
Depreciation and amortization expense 25,954 17,662 65,366 52,824
Interest expense, net 11,038 4,471 24,041 14,989
Income taxes 40,999 33,023 91,454 67,154
EBITDA 179,447$ 139,370$ 396,828$ 330,943$
Adjustments:
Acquisition costs and adjustments (1)
2,252 - 17,898 1,888
EBITDA As Adjusted 181,699$ 139,370$ 414,726$ 332,831$
EBITDA per diluted share 3.08$ 2.42$ 6.82$ 5.76$
EBITDA As Adjusted per diluted share 3.12$ 2.42$ 7.13$ 5.80$
(1) Represents one-time costs associated with our 2017 and 2016 acquisitions, including the step up in the value of acquired inventory and
acquisition transaction costs that are required to be expensed as incurred.
EBITDA and EBITDA per diluted share are non-GAAP financial measures used by management to evaluate the Company's ongoing
operations. EBITDA is defined as earnings before interest, taxes, depreciation and amortization and EBITDA As Adjusted is defined as
EBITDA plus certain acquisition costs and adjustments. EBITDA per diluted share is defined as EBITDA divided by the Company's diluted
weighted average shares outstanding. EBITDA As Adjusted per diluted share is defined as EBITDA As Adjusted divided by the Company's
diluted weighted average shares outstanding.
Third Quarter Year-to-Date
2017 2016 2017 2016
Diluted EPS as reported (U.S. GAAP) 1.74$ 1.46$ 3.71$ 3.41$
Short-term inventory purchase accounting adjustments 0.02 - 0.05 0.02
Acquisition costs 0.01 - 0.17 -
Severance and restructuring 0.01 0.02 0.02 0.05
Litigation settlement - - - (0.01)
Discrete tax items - (0.03) 0.04 (0.19)
Other pre-tax items related to discrete tax benefits - 0.02 - (0.01)
Diluted EPS as adjusted (Non-GAAP) 1.78$ 1.47$ 3.99$ 3.27$
Adjusted Diluted EPS is not a measurement of financial performance under GAAP, and should not be considered as an alternative
to EPS determined in accordance with GAAP. Management believes that EPS as adjusted to exclude the items in the
table above assist in understanding the results of Nordson Corporation. Our calculations of this non-GAAP financial
measure may not be comparable to the calculations of similarly titled measures reported by other companies.

39
NORDSON CORPORATION
ORDER RATES FOR 12-WEEK PERIOD ENDING AUGUST 13, 2017
CHANGE FROM PRIOR YEAR
BUSINESS SEGMENT % CHANGE GEOGRAPHY % CHANGE
Adhesive dispensing systems -1% United States -6%
Advanced technology systems -3% Americas 5%
Industrial coating systems -4% Europe 12%
Japan -20%
Total -2% Asia Pacific -6%
Total -2%
Notes:
1. Numbers in this table are unaudited and exclude the effects of currency movements.
2. Pro-forma changes in order rates were calculated as though our 2017 and 2016 acquisitions
were owned in both years.

40
-30%
-20%
-10%
0%
10%
20%
30%
$ .11 (.10) .18 .29 (.23) .15 .16 (.11) (.09) (.06) (.54) (.19)
Appendix: Currency Impact Annual Sales Growth and EPS
Volume Growth
Currency Effect
EPS Currency Effect
’05 ’06 ’07 ’08 ’09 ’10 ’11 ’12 ’13 ’14 ’15 ‘16
Numbers as reported and do not factor in stock splits
1% impact on revenue due to FX equals approximately 2.5% impact on EPS