A Preliminary Assessment of the Economic Benefits … · A Preliminary Assessment of the Economic...
47
0 Defenders of Wildlife June 25, 2007 Defenders of Wildlife Peter T. Jenkins Internation al Law on Precautiona ry Approaches To National Defenders of Wildlife A Preliminary Assessment of the Economic Benefits of Land Conservation Areas in Florida Defenders of Wildlife Conservation Economics Working Paper Frank Casey, Kristen Bowden, Laurie Macdonald, and Timm Kroeger
Transcript of A Preliminary Assessment of the Economic Benefits … · A Preliminary Assessment of the Economic...

0
Defenders of Wildlife
June 25, 2007
Defenders of Wildlife
Peter T. Jenkins
International Law on
Precautionary
ApproachesTo National
Defenders of Wildlife
A Preliminary Assessment of the Economic Benefits
of Land Conservation Areas in Florida
Defenders of Wildlife Conservation Economics Working Paper
Frank Casey, Kristen Bowden, Laurie Macdonald, and Timm Kroeger

1
Cover photo credits clockwise from top: Florida Communities Trust, Hillsborough County Angie Smith James Valentine James Valentine George Wilson
2
Acknowledgments The authors would like to express their great appreciation to several individuals for their assistance in the preparation of this report. These individuals provided crucial guidance and data with respect to conservation area size and characteristics as well as the economic benefits generated by Florida’s conservation areas. Sue Mullins, Tricia Martin, and Molly Ingraham of The Nature Conservancy, John Oetting, Gary Knight, and Amy Knight of the Florida Natural Areas Inventory, Mark Glisson of the Florida Department of Environmental Protection, Dave Harding, Dave Aldin, Mike Allen, and Magda Soliman of the Florida Fish and Wildlife Conservation Commission, Penny Isom and Katie Lewis of the Florida Division of Forestry, Lewis Scruggs of the Florida Division of Recreation and Parks, and Bill Howell and Keith Singleton of the Florida Division of State Lands provided essential advice and data related to identifying state conservation areas, the ecosystems in those areas, and the economic benefits associated with conservation area use. Dr. Hilary Swain and Roberta Pickert of the Archbold Research Station provided input related to the ecosystem services generated by some of Florida’s conservation areas. The assistance of Tom Hoctor and Peggy Carr of the University of Florida was crucial to aligning the ecosystem types defined by Florida agencies to quantitative estimates of ecosystem service benefits. Finally, we would like to thank Dr. Alan Hodges of the University of Florida, Dave Harding of the Florida Fish and Wildlife Research Institute and Craig Diamond, Visiting Faculty at Florida State University, who served as reviewers of earlier drafts of this report and provided invaluable feedback. We would also like to thank the J. B. Family Foundation whose generous support helped make this report possible.
About Defenders of Wildlife Defenders of Wildlife is a leading conservation organization recognized as one of the nation’s most progressive advocates for wildlife and its habitat. Known for its effective leadership on endangered species issues, particularly wolves and other predators, Defenders is also a proponent of new approaches to wildlife conservation that protect species before they become endangered. Defenders is a 501(c)3 organization with more than one million members. Defenders of Wildlife’s Florida office is located at 233 Third Street North, Suite 201, St. Petersburg, Florida 33701 and can be reached by phone at (727) 823-3888. Visit our websites: www.Defenders.org www.KidsPlanet.org © 2008 Defenders of Wildlife 1130 17th Street NW Washington, DC 20036 (202) 682-9400 This report may be photocopied for non-commercial use.

3
Table of Contents Cover photo credits .............................................................................................................................1 Acknowledgments................................................................................................................................2 About Defenders of Wildlife..............................................................................................................2 Table of Contents ................................................................................................................................3 I. Introduction ......................................................................................................................................4 II. Conservation Area Description ....................................................................................................6 III. Framework and Preliminary Assessment of Economic Benefits Associated with Selected Florida State Conservation Areas ....................................................................................................10 IV. Summary, Policy Implications, and Recommendations ........................................................27 References ...........................................................................................................................................30 Appendix I ..........................................................................................................................................32 Appendix II.........................................................................................................................................38

4
I. Introduction The purpose of this paper is to provide a preliminary estimate of the economic benefits that are generated by those lands that have been acquired under the three Florida state conservation programs; Conservation and Recreations Lands (CARL), Preservation 2000 (P2000) and Florida Forever (FF). Between 1979 and 2006, the state of Florida acquired 3.8 million acres through these programs (Hodges 2006), making it the largest public land buying program in the United States. During the 1990-2000 decade, the state allocated $300 million annually to acquiring environmentally sensitive lands, wildlife habitat, water resource areas, recreation and cultural sites, landscape linkages, trails, city parks, state forests, beaches, and wildlife management areas. Since 1990, through the P2000 and FF programs, over 2 million acres of Florida’s natural landscape has been preserved through fee simple acquisition, easements and matching funds. Despite the extent of Florida’s land conservation programs, more needs to be done. A 1995 report (Defenders of Wildlife 1995) ranked Florida as the state at most risk of losing its remaining natural ecosystems. The state also ranks among those with the highest number of federally listed endangered and threatened species and imperiled native communities. This situation has not abated in recent years. Population growth and increases in land values are driving the rapid pace of development. The population growth rate in Florida has been among the highest in the nation netting nearly 1200 new residents per day and over 80 million visitors each year. At the same time, according to the Florida Department of Environmental Protection, the average price of land (adjusted for inflation) in Florida has increased five-fold from about $5,800 per acre in 1990 to over $29,000 per acre today. Recognizing the skyrocketing price of land, the competition with development interests for land, and the vanishing opportunity to purchase remaining tracks of large intact parcels and critical wildlife corridors, Defenders of Wildlife and the other members of the Florida Forever Coalition is proposing that the Florida Forever Program be extended and expanded to meet remaining state needs for land and water conservation. The Florida Forever Coalition proposes that a renewed Florida Forever, or successor program, spend up to $1 billion per year preserving environmentally sensitive land and wildlife habitat, buying parkland, and securing valuable water resources. Even with the wide popularity of land acquisition programs in Florida, many state legislators are questioning the need for investing even more resources in conservation. Providing elected officials, the general public, business, landowners, conservation organizations, and natural resource agencies with information regarding the public and private economic benefits of land conservation will assist the public policy making process regarding the level of future state acquisitions. Previous studies (Hodges and Kiker 2002; Baker and Macdonald 2004; Larkin et al. 2005; Kroeger 2005) have shown that the public and private economic benefits generated by land conservation activities can be substantial. In this paper, we report on the economic benefits associated with the direct use of protected lands such as recreation, tourism, and associated impacts on the general economy, along with some preliminary estimates of ecosystem service values. This report does not include estimates of “non-use” benefits such as existence value, stewardship value, or bequest value.

5
The next section of the report provides a brief description of the criteria used to select a sub-set of ten state conservation areas on which to base our estimate of economic benefits. We present a general overview of the geographic, physical size and ecological characteristics of those sample conservation areas. For each conservation area we provide data on the types and size of ecosystems that comprise each area. Section III is divided into two parts. The first presents a conceptual framework that economists use to distinguish between various types of economic values, the categories of benefits associated with these values, and the analytical means employed to develop quantifiable monetary estimates of these benefits. Part two presents quantitative estimates for some of the economic benefits that the sample conservation areas generate. These estimates are based on figures obtained or derived from recent economics studies. Section IV provides a summary, policy analysis, and recommendations with respect to future state efforts to acquire state conservation areas. On economic grounds, the case is made for continuing a public lands acquisition program in Florida. Further research and conservation area management recommendations are put forward.

6
II. Conservation Area Description This report presents economic benefits information related to both direct and indirect uses of Florida’s natural lands. Direct use values are associated with consumptive and non-consumptive recreation. Examples of consumptive uses include the extraction of wild foods and livestock production. Indirect use values refer to benefits generated by ecosystem service flows that humans need and enjoy. In order to estimate the value of ecosystem services, we chose a representative sample of ten conservation areas that have been protected by Florida’s various land protection programs (CARL, P2000, and FF) (Table 2.1). These ten areas were selected based on three primary factors: diversity in land cover; geographical distribution throughout the state; and the number and diversity of listed species of plants and animals, many of which are endemic to, i.e., found only in, Florida. To a lesser degree, we also took into account various land uses other than conservation. The ten conservation areas represent roughly 10% (about 379,000 acres) of the total acreage thus far protected in Florida. A detailed description of the location and the primary ecosystems and species that comprise each conservation area is provided in Appendix I. Figure 2.1 indicates the location of these conservation areas within the state. .
Table 2.1 Sample Conservation Areas
Conservation Area AcreageAucilla 42,581
Babcock-Webb 72,260 Big Bend 69,112
Caravelle Ranch 24,869 Fisheating Creek 18,272
Florida Keys 2,269 Guana River 9,815
Lake Wales Ridge 12,601 Topsail Hill 1,626
Pinhook Swamp 122,251Total Acreage 378,656
The sample ten conservation areas account for over 378,000 acres and range in size from about 1,630 acres at Topsail Hill to more than 122,000 acres in the Pinhook Swamp (Table 2.1). The areas extend from the Panhandle in Northwest Florida to the Florida Keys and account for 47 of the 81 ecosystem types identified by the Florida Natural Areas Inventory (FNAI). Combined, the selected conservation areas contain 123 plant and animal species that are protected at the state and/or federal level, and 4 of the 6 habitat types designated as high priority regarding conservation needs by Florida’s Wildlife Legacy Initiative.

7
Figure 2.1 Location of Sample Conservation Areas in Florida
Source: Florida Fish and Wildlife Conservation Commission, Florida Vegetation and Land Cover (2003), Boundary Information, FNAI (2007)

8
Table 2.2 lists the ecosystem types and acreages for each of the ten sample conservation areas. The ten conservation areas represent a wide array of ecosystem types, with no one ecosystem dominating in terms of acreage. The primary ecosystems protected include floodplain marsh, mangrove swamp, shrub swamp, pinelands, and oak hammock. Table 2.2 is on the following page.

Table 2.2 Ecosystem Types Represented by Selected Conservation Areas
Ecosystem Type/Conservation Areas
Aucilla Babcock-Webb
Big Bend Caravelle Ranch
Fisheating Creek
Florida Keys
Guana River
Lake Wales Ridge
Topsail Hill
Pinhook Swamp
Total % of Total
Basin Marsh/ Depression Marsh 26.4 0 0 145.7 111.5 0 1,536.30 0 0 0 1819.9 0.5%
Basin Swamp 721.9 0 0 2,660.50 0 0 297.1 0 69.74 0 3749.24 1.0% Baygall 1,812.90 0.00 0 585.1 0 0 0 0 0 0 2398 0.6%
Bay Swamp 0.00 0.00 0.00 0.00 0.00 0.00 0.00 0.00 0.00 14,142 14142 3.7% Beach Dune 0 0 0 0 0 0 0 0 249.21 520 769.21 0.1%
Blackwater Stream 0 0 0 66.8 322.9 0 0 0 0 0 389.7 0.0% Bottomland Forest 0 0 0 2432.1 0 0 0 0 0 0 2432.1 0.2%
Cattail Marsh 0 0 0 0 0 0 0 0 0 0 0 0.0% Coastal Dune Lake 0 0 0 0 0 0 0 0 181.92 0 181.92 0.0%
Cypress Swamp 0 1,146 622.01 0 0 0 0 659.03 0 772 3199.04 0.3% Developed 0 0 0 6.6 0 0 0 0 87.95 0 94.55 0.0%
Dome Swamp 1,038.70 0.00 0 231.5 0 0 38.2 0 14.22 0 1322.62 0.1% Dry Prairie 0 29,351 0 0 26.4 0 0 942.55 0 0 30319.95 2.7%
Estuarine Tidal Marsh/ Coastal Saltmarsh 0 0 17,900 0 0 249.4 2,157.00 0 0 0 20306.4 1.8%
Estuarine Uncon-solidated Subst 0 0 0 0 0 0 9.3 0 37.74 0 47.04 0.0% Exotics 0 0 0 0 49.8 2.3 0 0 0 0 52.1 0.0%
Floodplain Forest 0 0 0 0 1,020.90 0 0 0 0 34,985 36005.9 3.2% Floodplain Marsh 0 0 0 117.1 4,763.40 0 0 0 0 0 4880.5 0.4% Floodplain Swamp 597.8 0 0 4,326.10 6,277.00 0 0 0 0 0 11200.9 1.0%
Freshwater Marsh/Wet Prairie 0 13,547 345.56 0 395.6 0 0 504.04 113.68 9,382 24287.88 2.2% Grasslands and Agriculture 0 3,736 69.11 2,197.20 2,703.10 2.3 0 1,415.09 0 860 10982.8 1.0%
Hardwood Hammock 0 1,505 23,290.74 0 0.00 24.9 0 173.89 0 927 25921.53 2.3% Hardwood Swamp 0 0 6,150.96 0.00 0.00 0.00 0.00 241.93 0.00 8,462.00 14854.89 1.3% Hydric Hammock 19,157.90 0.00 0 0 0.00 0.00 0.00 0.00 0.00 0.00 19157.9 1.7% Mangrove Swamp 0 0 0 0 0.00 358.2 0 0.00 0.00 0.00 358.2 0.0%
Maritime/Tropical Hammock 0 0 0 0 1,629.90 741.3 911.3 0.00 20.07 0.00 3302.57 0.3% Mesic Flatwoods 51.5 0 0 3,282.50 215.2 0 1,348.10 0.00 141.77 0.00 5039.07 0.5% Mesic Hammock 69.5 0 0 0 0.00 0 0.00 0.00 0.00 0.00 69.5 0.0%
Open Water 0 2,258 2,418.92 920.4 0.00 269.8 1,603.70 42.84 0.00 703.00 8216.66 0.7% Pinelands 0 19,568 11,057.92 0.00 0.00 6.80 0.00 892.15 0.00 13,522.00 45046.87 4.1%
Pine Plantations 16,066.50 0 0.00 5,703.90 0.00 0.00 838.10 0.00 0.00 0.00 22608.5 2.0% Prairie Hammock 0 0 0 0 0.00 0 195.1 0 0.00 0.00 195.1 0.0%
Ruderal/Disturbed Land 104.8 1,706 3,179.15 588.90 89.10 612.1 13.2 1,985.92 0.00 8.00 8287.17 0.7% Sandhill 0 0 0.00 41.5 0.00 0 0 0 0.00 91.00 132.5 0.0% Scrub 0 0 0.00 0 0.00 0 0 3,571.12 298.88 0.00 3870 0.3%
Scrubby Flatwoods 2 0 0.00 792.9 58.4 0 867.2 0 64.74 0.00 1785.24 0.2% Seepage Slope 0 0 0.00 0 244.8 0 0 0.00 0.00 0.00 244.8 0.0%
Shrub and Brushland 0 2,412 4,077.60 0 0.00 2.3 0 2,109.44 0.00 12.00 8613.34 0.8% Shrub Swamp 0 0 0.00 0 0.00 0 0 1.26 0.00 37,680.00 37681.26 3.4%
Slough 0 0 0.00 0 29.80 0 0 0.00 0.00 0.00 29.8 0.0% Spring-run Stream 252.1 0 0.00 0 0.00 0 0 0.00 0.00 0.00 252.1 0.0%
Strand Swamp 113.9 0 0.00 0 0.00 0 0 0.00 0.00 0.00 113.9 0.0% Swale 0 0 0.00 0 0.00 0 0 0.00 0.00 0.00 0 0.0%
Upland Hardwood Forest 1,774.50 31.00 0.00 0.00 0.00 0.00 0.00 61.74 0.00 0.00 1867.24 0.2% Upland Mixed Forest 0 0 0.00 764.7 0.00 0 0 0.00 0.00 0.00 764.7 0.1%
Wet Flatwoods 790.4 0 0.00 0 32.8 0 0 0.00 346.4 185 1354.6 0.1% Xeric Hammock 0 0 0.00 5.1 301.5 0 0 0.00 0 0.00 306.6 0.0%
Total Acres 42,581 75,260 69,112 24,869 18,272.00 2,269 9,815 12,601 1,626 122,251 378656 100.0%
9
10
III. Framework and Preliminary Assessment of Economic Benefits Associated with Selected Florida State Conservation Areas
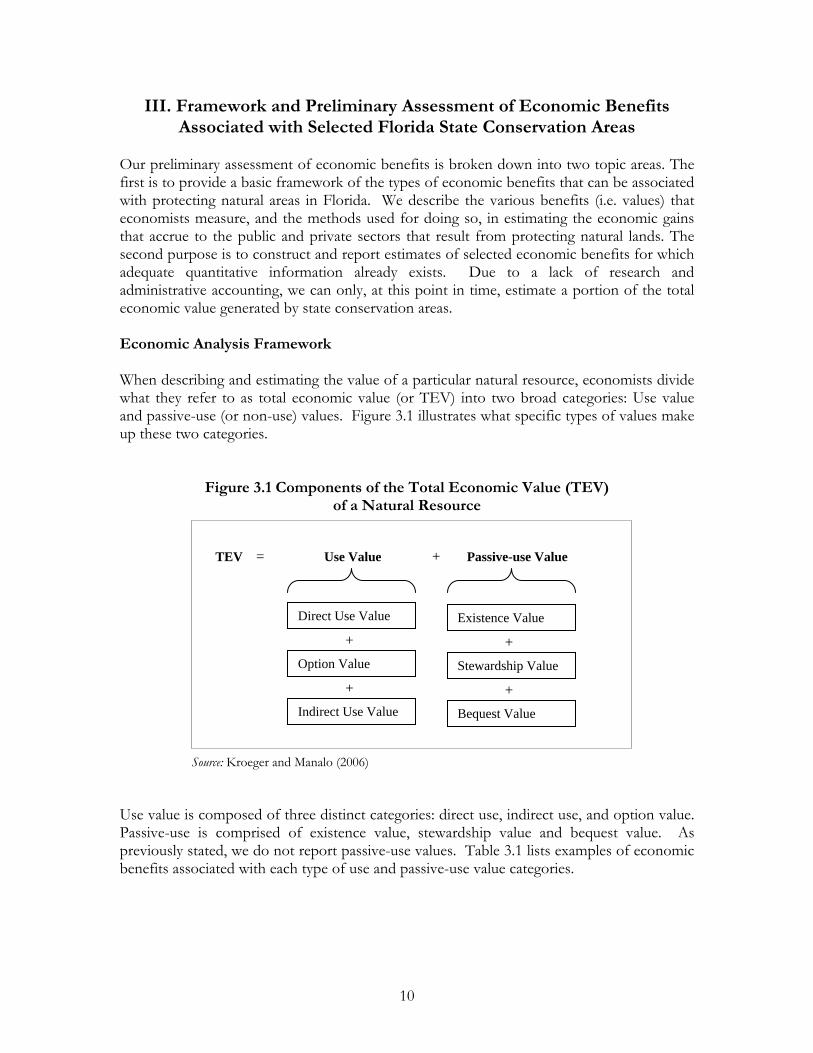
Our preliminary assessment of economic benefits is broken down into two topic areas. The first is to provide a basic framework of the types of economic benefits that can be associated with protecting natural areas in Florida. We describe the various benefits (i.e. values) that economists measure, and the methods used for doing so, in estimating the economic gains that accrue to the public and private sectors that result from protecting natural lands. The second purpose is to construct and report estimates of selected economic benefits for which adequate quantitative information already exists. Due to a lack of research and administrative accounting, we can only, at this point in time, estimate a portion of the total economic value generated by state conservation areas. Economic Analysis Framework When describing and estimating the value of a particular natural resource, economists divide what they refer to as total economic value (or TEV) into two broad categories: Use value and passive-use (or non-use) values. Figure 3.1 illustrates what specific types of values make up these two categories.
Figure 3.1 Components of the Total Economic Value (TEV)
of a Natural Resource
Source: Kroeger and Manalo (2006) Use value is composed of three distinct categories: direct use, indirect use, and option value. Passive-use is comprised of existence value, stewardship value and bequest value. As previously stated, we do not report passive-use values. Table 3.1 lists examples of economic benefits associated with each type of use and passive-use value categories.
TEV = Use Value + Passive-use Value
Direct Use Value
Option Value
Indirect Use Value
Existence Value
Stewardship Value
Bequest Value
+
+
+
+

11
Table 3.1 Categories of Values and Associated Benefits Provided by Ecosystems and Species
Value Category Benefit
Use values Direct use values 1 Non-consumptive recreation (e.g., wildlife/scenery
viewing) Consumptive recreation (e.g., hunting & fishing) Consumptive non-recreation uses: extraction of wild
foods (venison and birds, mushrooms, berries, etc.), fibers (timber, livestock grazing), water, minerals, or inputs for medical and medicinal uses for sustenance
and sale Livestock production Social, religious, and spiritual events Education & Research Nature-inspired art, crafts, and publications
(calendars, TV shows, etc.) Real estate value premium in undeveloped/low
density areas*
Indirect use values
(“ecosystem service” values)
Pollination services Hydrological services Erosion prevention
Carbon sequestration Biodiversity maintenance
Habitat provision, etc.
Multiplier Effects Applied to both Direct and Indirect Use Values
Option value Possibility to engage in direct use of the resource in the future
Passive use values
(Non-use values) 2
Existence value Appreciation of the scenic beauty of the Everglades, and of the natural systems it contains
Stewardship value Appreciation of the fact that this scenic beauty and the natural systems are actively managed and are...
Bequest value ...passed on to future generations Source: Kroeger and Manalo (2006). Notes: Not all species or ecosystems provide all of the benefits listed in the table. 1 Market and non-market values. 2 Primarily non-market values.
*The extent of the real estate value premium depends on what the area looks like and where exactly the properties are located. Studies have shown that even in rural areas, properties adjacent to protected open space have higher prices than properties that are not.

12
Benefits related to the direct use of a natural resource include recreation (consumptive and non-consumptive uses), extraction, compatible agricultural uses, real estate premiums associated with protected areas, and education and research. For consumptive and non-consumptive recreation-related uses we provide estimates of recreationists’ expenditures and “consumer surplus” Of the direct use values shown in Table 3.1 we provide benefit estimates for consumptive and non-consumptive recreation, and the economic multiplier effects associated with these activities. No information was available on the direct benefits related to education and research, consumptive non-recreation uses, livestock production, social events, arts and crafts, or for potential real estate premiums for lands situated near conservation areas.
Indirect use values are predominately associated with ecosystem services that provide environmental benefits to people. These services include pollination, water purification, carbon sequestration, biodiversity maintenance, and habitat provision, among others. Other studies have also identified ecosystem services including the production of agricultural food and fiber, forestry and fisheries production, air purification, mitigation of droughts and floods, soil regeneration, detoxification and decomposition of wastes, seed dispersal, cycling of nutrients, control of potential agricultural pests, protection of coastal shores from erosion by wave action, and partial stabilization of climate. Option value is the value associated with the potential future use of a resource.
Figure 3.2 illustrates the types of economic quantification tools used to estimate the various use and passive-use values outlined in Table 3.1.

13
Figure 3.2 Quantitative Techniques for Measuring Various Types of Economic Values
Total Economic Value =
Use value Individual Choice + Indirect use value + Option value Models (“Ecosystem service value”) Quantification approaches:
Travel Cost Method Production function approach Contingent Valuation Surrogate market valuation Damage costs avoided Conjoint Analysis Hedonic prices Preventive expenditures Individual Choice models Contingent Valuation Methods Surrogate market valuation
Contingent Valuation Methods [Replacement cost]
Non-use value
Existence value + Intrinsic value + Bequest/Stewardship value Quantification approaches: Contingent Valuation Methods Source: Barbier (2000) Estimated Economic Benefits Associated with Florida’s Conservation Areas This section provides estimates of the economic benefits associated with the direct and indirect uses of the selected sample conservation areas. As we previously mentioned, there are few data on the economic benefits for specific conservation areas. To complement our analysis, therefore, we present regional and/or state level benefits data that are indicative of the types of values that could be generated by the conservation areas used in this report. Direct Use-Values The economic benefits information we can report that pertains to direct use values includes consumptive and non-consumptive recreation (hunting, fishing, wildlife viewing), measured as trip and equipment expenditures of participants and the consumer surplus associated with these activities, tourism, and the economic multiplier effects associated with selected recreational uses. Some of these benefits are derived for specific conservation areas, while other data are only applicable at the state level.

14
Table 3.2 provides a general compilation of the types of recreational activities at each of the sample conservation areas as indicated by their initial management plans. However, current recreational uses maybe more extensive. For example, picnicking occurs at all areas as does birding. Most of the areas supply a combination of both consumptive (fishing and hunting) and non-consumptive (bird/wildlife viewing and photography; camping; hiking; canoeing) uses. The most frequent recreational activities across all conservation areas include bird watching; fishing, hunting and wildlife viewing/photography (Table 3.2). Babcock-Webb is the only conservation area for which we could obtain financial information related to direct recreational benefits, as measured by user expenditures for entrance fees. (Other conservation areas collect entrance fees, but no public records are compiled to estimate the total income from these fees). Entrance fees reported for Babcock-Webb for an 8 month period from June 2006 to February 2007 totaled $68,000 (or $8,500/month). On an annual basis, this amounts to about $109,000, which is reasonably consistent with increases shown over the past five years. For instance, from 2001 through 2005, entrance fee receipts at Babcock-Webb steadily increased from about $46,000 to $76,000, an average annual increase of about 25%. Over the 6 year period from 2001 to 2007, demand for visiting Babcock-Webb, as measured by entrance fee receipts, increased by about 136%. Table 3.2 is on the following page.

15
Table 3.2 Recreational Activities Offered in Sample Conservation Areas
Aucilla Babcock-Webb
Big Bend
Caravelle Ranch
Fisheating Creek
Florida Keys
Guana River
Lake Wales Ridge
Topsail Hill
Pinhook Swamp
Airboat use x Biking x x x x
Bird-watching x x x x x x x x x x Canoeing x x x x x x x Camping x x x x x x x
Cattle-grazing x Crabbing x Eco-tours x
Environ. Ed. x x x x Frogging x Fishing x x x x x x x x x x Hiking x x x x x x x
Horseback-riding x x x x
Hunting x x x x x x x x Interpretive
trails x x Motor-boating x x x x
Picnicking x x x x x
Scalloping x Wildlife
viewing/photo. x x x x x x x x x x
Source: Wildlife Management Plans for each area.

16
An economic study conducted in 2001-2002 by the Florida Fish and Wildlife Conservation Commission (Harding et al. 2003) estimated the economic benefits of recreational use for 17 Wildlife Management Areas (WMAs), which account for about one million acres of state lands. Five of the areas were primary research sites at which user interviews were conducted and first hand benefits information collected. This benefits information was then extended to 12 additional sites that were geographically similar and provided similar recreational activities. The 17 areas in the study include a sub-group of the conservation areas addressed in this report (Guana River, Babcock-Webb, Caravelle Ranch, and Aucilla). Harding et al. estimated direct recreational consumptive and non-consumptive expenditures, consumer surplus associated with recreational activity, and the economic impact of recreational expenditures on local and state economies1. The principal recreational activities in the 17 WMAs examined included hunting (36%), wildlife viewing (21%), fishing (19%), and a combination of other uses such as hiking, biking, and canoeing. For the five primary research sites, Harding et al. (2003) measured average direct expenditures per visitor for both consumptive and non-consumptive recreational uses. Direct expenditures for consumptive uses alone (mostly hunting and fishing) ranged between $130 and $245 per visit, while non-consumptive uses (wildlife viewing, canoeing, etc.) accounted for between $57 and $162 per visit. For all 17 sites, total direct expenditures were calculated to range between approximately $105 million and $338 million for 2001-2002. Consumer surplus was measured at the WMA level for the five primary sample sites in the Harding et al. survey, and applied to the other twelve management areas2. At the primary sample site level, consumer surplus for consumptive uses ranged from about $90 to $160 per trip, and for non-consumptive uses between $61 and $143 per trip. Summed over all visitors and applied to all 17 WMA’s, a lower bound for total consumer surplus was estimated to be over $85 million for 2001-2002. Harding et al. (2003) also additional impacts of visitation to the 17 sites on local and state economies as a result of consumer expenditures. The impacts on local economies include
1 The estimated benefits were derived from a field survey of approximately 1,500 visitors to five WMA’s, with the results extended to 12 other WMA’s of similar characteristics. Based on this sample, it was estimated that nearly all conservation area visitors (98.5%) are Florida residents. 2 The concept of “consumer surplus” is important to any complete estimate of the economic benefits associated with the use of a good, including those associated with the use of conservation areas. The notion of “consumer surplus” refers to the amount of satisfaction that a person experiences over and above any particular price that he or she paid for a particular good or service. For many goods and services, consumers pay a price less than their willingness to pay and retain a personal value above the actual price. The concept of consumer surplus applies to other non-market goods such as wild land, high quality habitat, recreational experiences, or scenic views, and can be monetized. To measure economic value as consisting solely of expenditures underestimates the true value of a good or resource, including Florida’s conservation areas.

17
those associated with increased retail activity of businesses supporting visitors (e.g., hotels, outdoor stores, gas stations) and the multiplier effects that include the generation of jobs, state sales taxes, and employee compensation that result from this increased business activity. As a lower bound measure for the 17 sites, Harding et al. estimated that the 17 conservation areas generated nearly $124 million in retail sales, almost 1200 jobs, about $7.4 million in state sales tax, and an additional $21.7 million in wages. For 2006, the US Fish and Wildlife Service (Department of Interior et al. 2007) estimated that total state trip-related and equipment expenditures in Florida for hunting, fishing, and wildlife watching-related activities amounted to nearly $8.1 billion. Not all of this, of course, can be attributed to the ten conservation areas covered in this report, but they no doubt contribute to it. Of the $8.1 billion, wildlife watching-related activities comprised about $3.1 billion expenditures and involved about 3.3 million persons (mostly state residents). Between the years 2001 and 2006, total wildlife-watching expenditures by Florida state-residents increased from about $1.6 billion to $3.2 billion, a 100% increase in 5 years (Department of Interior et al. 2007). Based on national and state level surveys and analysis of 2006 recreational activity (Department of Interior et. el 2006; Southwick Associates 2007a., 2007b.), Harding estimated the state-wide economic impacts from recreational activity for 20073. Table 3.3 provides state-wide benefit estimates derived from direct recreational expenditures on retail sales, state and local taxes, broader economic impacts, and jobs.
Table 3.3 Economics of Fish and Wildlife Recreation
Florida Fish and Wildlife Conservation Commission Estimates for 2007*
Category Retail Sales State and Local Taxes
Economic Impact
Jobs
Hunting $411,861,741 $44,615,542 $719,066,045 10,313 Freshwater
Fishing $1,415,175,234 $132,376,942 $2,423,337,458 23,480
Saltwater Fishing
$3,067,387,722 $318,522,000 $5,243,450,735 51,588
Wildlife Viewing $1,895,916,551 $210,357,192 $3,226,164,233 34,523 Total $6,790,341,248 $705,871,676 $11,612,018,471 119,904
*Source: (Harding, personal communication). The expenditure data for fishing, hunting, and wildlife viewing are derived from the U.S. Department of Interior (2006), and Southwick and Associates (2007a; 2007b; 2008). The baseline for the expenditure data and economic impact data are for 2006. Estimates for 2007 are adjusted to the Consumer Price Index (CPI) through December 2007 with the exception of jobs which reflect the 2006 baseline data. The total values for statewide retail sales, state and local taxes generated, economic impacts, and jobs supported in Table 3.3 are heavily influenced by the high levels associated with
3 Harding, David. Personal Communication. February, 2008.

18
saltwater fishing. Although the dollar values and jobs generated in this category are not directly attributable inland state conservation areas, it should be recognized that many state conservation areas that consist of marshes, estuaries, etc. adjacent to saltwater do partially account for these values, if only indirectly, as breeding, feeding and spawning grounds that benefit the saltwater fishery as a whole. The second highest category of value generated is for state-wide wildlife viewing. Again, although these total figures are not attributable to just our eleven state wildlife conservation areas, these areas no doubt contribute significant benefits. Of total statewide values shown in Table 3.3., wildlife viewing contributed about 28% ($1.9 billion) to total retail sales in 2007, 30% ($210.4 million) to state and local taxes, and nearly 28% ($3.2 billion) of the total economic impacts generated. In addition, statewide wildlife viewing accounted for about 34.5 thousand jobs in 2007, or nearly 28% of total recreational jobs generated. When saltwater fishing benefits are not accounted for, wildlife viewing represents the majority of benefits associated with retail sales, state and local taxes generated, and total economic impact. The data illustrated in Table 3.3 does have some minor limitations with respect to interpretation (Harding, D. Personal Communication). For example, the sample frame for the hunting category is limited to 57 observations statewide. Second, the number of individuals participating in a particular activity is based on formulas used to calculate the level of activity related to hunting, fishing, and wildlife viewing and reflect the baseline year of 2006. Thirdly, because consumer behavior is not static, it is not possible (without annual surveys) to predict the exact level of consumer expenditures for 2007 hunting, fishing and wildlife viewing activities. Therefore, we should assume that there is a measure of variability within the range of economic estimates provided in Table 3.3. The natural resource base of Florida attracts thousands of tourists every year. For the state as a whole, tourism is a $50 billion a year industry and accounts for nearly 20% of the state’s economy (Florida Department of Environmental Protection 2006), some of which is accounted for in the recreational benefits cited above. A large part of tourist activity is related to natural resource use, including those areas that have been protected under the CARL, P2000, and Florida Forever acquisition programs. According to Outlook for Florida Tourism 2004, a survey conducted by the University of Miami for Visit Florida, the state’s official tourism marketing corporation, 92 percent of Florida’s tourism industry leaders agree or strongly agree with the statement that “the conservation of Florida’s natural and historical assets is necessary for the long-term success of my business.” In 2004-2005, there were about 17.3 million visitors to Florida’s state parks who accounted for nearly $665 million in direct expenditures, generating almost $46 million in state sales tax (Florida Parks Services 2005). Indirect Use Benefits for Ecosystem Services Indirect use benefits include benefits derived from ecosystem services such as water filtration, erosion prevention, carbon sequestration, habitat provision, pollination, etc. (Table 3.1). In varying amounts, these services are also generated and provided by Florida’s protected conservation areas.

19
Hodges (2006) has observed that in Florida,
“Ecosystems differ widely in their services provided based on geography, climate, soils, and composition of the biological community. The state of Florida is particularly blessed with a diverse mix of highly productive terrestrial, freshwater, and marine ecosystems by virtue of its position as a long peninsula surrounded by warm ocean waters, with abundant rainfall that is fairly evenly distributed throughout the year. The moderate subtropical environment supports year-round growing conditions for plants, and allows many cold-sensitive species to thrive. Florida is recognized as one of North America’s leading reservoirs of biological diversity, with a total of 668 vertebrate animal groups, of which 115 are endemic to the state” (p. 1).
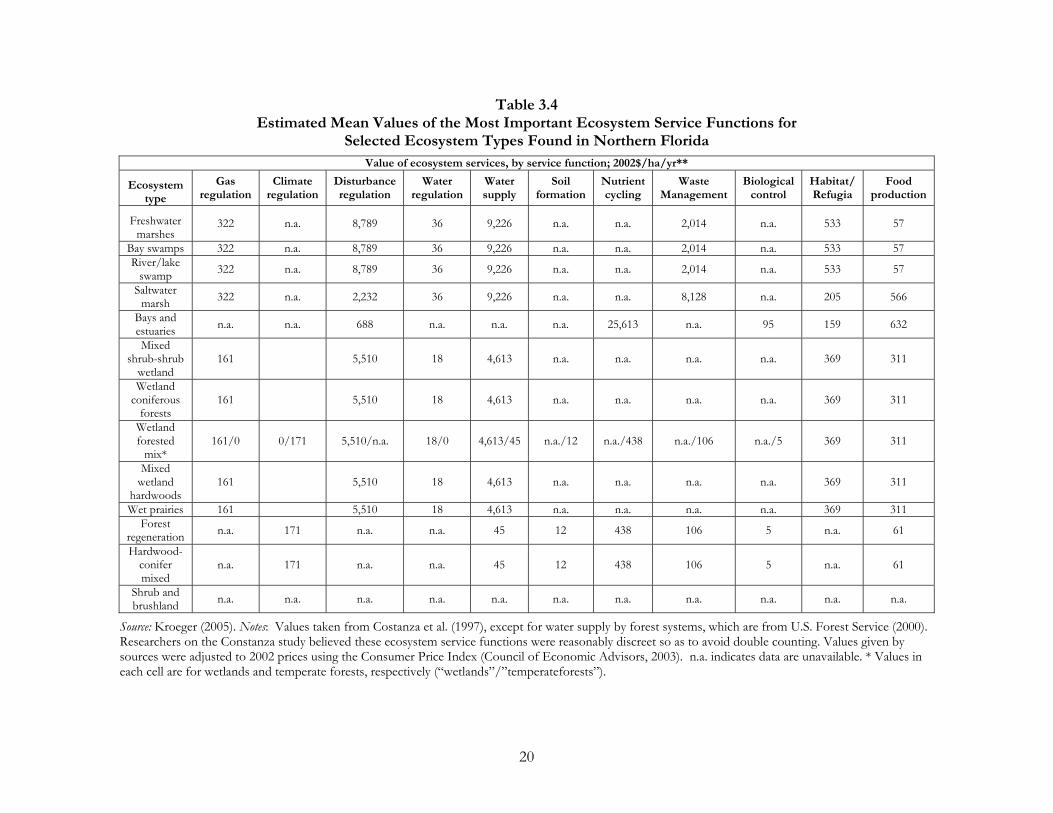
There have been previous, but limited, estimates of the economic value of various ecosystem services (both natural and engineered) produced on Florida landscapes. One study reported that the average annual willingness to pay for restoring the Florida Everglades ranged from $59 to $79 per household per year (Milon et al. 1999). Condon (2004) reported that residents of four Northeast Florida counties would be willing to pay, on average, $44 per household per year to acquire land that would protect water quality and quantity. Shrestha and Alavalapati (2004) reported a mean willingness to pay of $138 per household per year to make improvements in water quality, biodiversity, and carbon sequestration using silvo-pasture systems in the Lake Okeechobee watershed. Employing ecosystem service values estimated by Costanza et al. (1997), Kroeger (2005) estimated the value of various services by ecosystem type for four Northeast Florida counties as shown in Table 3.4. The ecosystem services included water, gas and climate regulation, water supply, erosion control, soil formation, nutrient cycling, waste treatment, pollination, biological control, wildlife habitat/refugia, food production, raw materials, genetic resources, recreation, and cultural services. Kroeger (2005) used these categories to calculate annual per hectare ecosystem service values. Those ecosystem services functions of highest value included water supply ($9,266/ha), disturbance regulation ($8,789/ha), waste management ($2,014/ha), and the supply of habitat/refugia ($533/ha) (Table 3.4). Table 3.4 is on the following page.
20
Table 3.4 Estimated Mean Values of the Most Important Ecosystem Service Functions for
Selected Ecosystem Types Found in Northern Florida
Value of ecosystem services, by service function; 2002$/ha/yr**
Ecosystem type
Gas regulation
Climate regulation
Disturbance regulation
Water regulation
Water supply
Soil formation
Nutrient cycling
Waste Management
Biological control
Habitat/ Refugia
Food production
Freshwater marshes
322 n.a. 8,789 36 9,226 n.a. n.a. 2,014 n.a. 533 57
Bay swamps 322 n.a. 8,789 36 9,226 n.a. n.a. 2,014 n.a. 533 57 River/lake
swamp 322 n.a. 8,789 36 9,226 n.a. n.a. 2,014 n.a. 533 57
Saltwater marsh 322 n.a. 2,232 36 9,226 n.a. n.a. 8,128 n.a. 205 566
Bays and estuaries n.a. n.a. 688 n.a. n.a. n.a. 25,613 n.a. 95 159 632
Mixed shrub-shrub
wetland 161 5,510 18 4,613 n.a. n.a. n.a. n.a. 369 311
Wetland coniferous
forests 161 5,510 18 4,613 n.a. n.a. n.a. n.a. 369 311
Wetland forested
mix* 161/0 0/171 5,510/n.a. 18/0 4,613/45 n.a./12 n.a./438 n.a./106 n.a./5 369 311
Mixed wetland
hardwoods 161 5,510 18 4,613 n.a. n.a. n.a. n.a. 369 311
Wet prairies 161 5,510 18 4,613 n.a. n.a. n.a. n.a. 369 311 Forest
regeneration n.a. 171 n.a. n.a. 45 12 438 106 5 n.a. 61
Hardwood-conifer mixed
n.a. 171 n.a. n.a. 45 12 438 106 5 n.a. 61
Shrub and brushland n.a. n.a. n.a. n.a. n.a. n.a. n.a. n.a. n.a. n.a. n.a.
Source: Kroeger (2005). Notes: Values taken from Costanza et al. (1997), except for water supply by forest systems, which are from U.S. Forest Service (2000). Researchers on the Constanza study believed these ecosystem service functions were reasonably discreet so as to avoid double counting. Values given by sources were adjusted to 2002 prices using the Consumer Price Index (Council of Economic Advisors, 2003). n.a. indicates data are unavailable. * Values in each cell are for wetlands and temperate forests, respectively (“wetlands”/”temperateforests”).

21
Table 3.5 Estimated Annual Value of Ecosystem Services
Provided by Major Ecosystem Categories in Four Northeast Florida Counties
Ecosystem Million
2002$/year
Marshes, swamps, lakes, rivers, streams, estuaries
$1,827
Wetlands 1,249 Forests 118
Total $3,194 Source: Kroeger (2005).
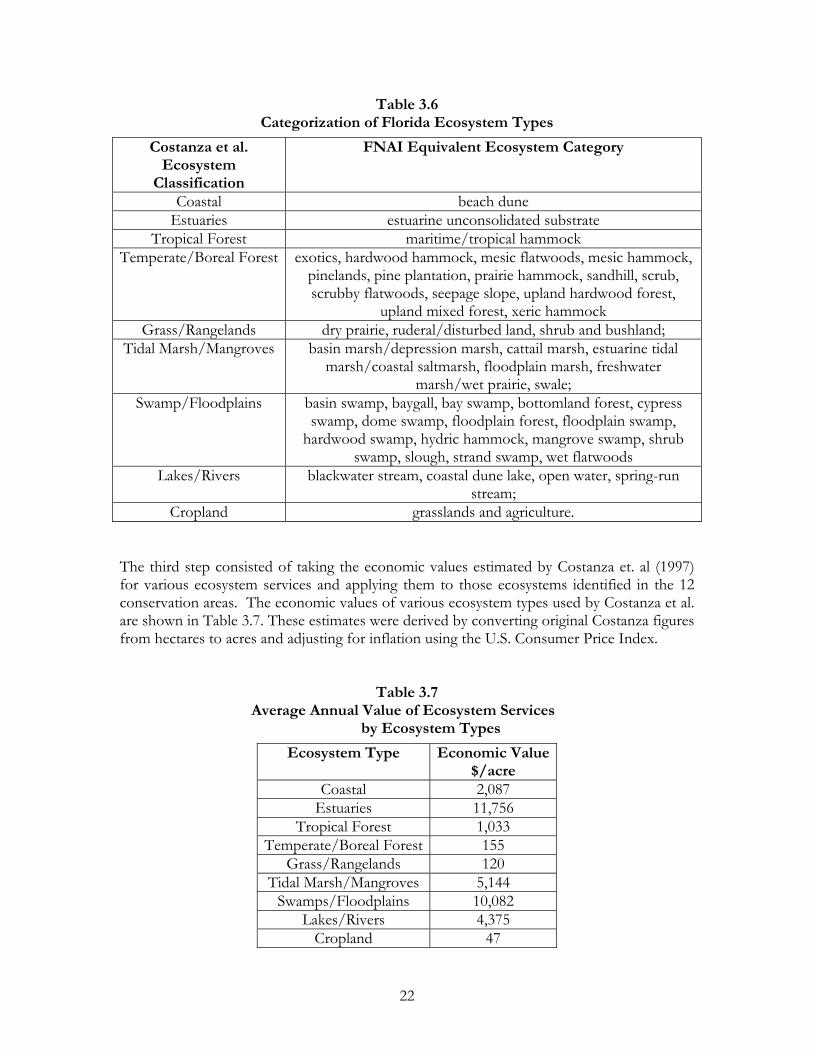
Two of the sample conservation areas covered in this report (Guana River and Caravelle Ranch) fall within the four-county area examined by Kroeger (2005). For all four counties, in 2002 dollars, aquatic habitats, wetlands, and forests combined, were estimated to generate about $3.2 billion per year in ecosystem service values (Table 3.5). In this paper, we estimate the value of ecosystem services generated by the ten conservation areas using a three-stage process. First, we identified the various ecosystem types and the corresponding acreages that are found in each conservation area (Table 2.2). Second, we aligned each of the ecosystem types identified in Table 2.2 with the classifications employed by Costanza et al. (1997). The authors identified nine non-urban ecosystem categories that comprised coastal, estuaries, tropical forest, temperate/boreal forests, grass/rangelands, tidal marsh/mangroves, swamp/floodplains, lakes/rivers, and cropland (grasslands and agricultural). Table 3.6 provides a cross reference of the Florida Natural Areas Inventory (FNAI 2006) ecosystem types from Table 2.2 to the Costanza et al. (1997) categorization4. In some instances, an ecosystem under the FNAI categorization could be mapped to two classifications in the Costanza et al. study. When this occurred, we mapped the FNAI ecosystem type to the Costanza et al. equivalent that was estimated to have a lower ecosystem service value. This was done in order to provide a conservative estimate of the economic benefits produced by a specific conservation area5. 4 The authors would like to thank Dr. Tom Hoctor and Dr. Peggy Carr of the University of Florida for their guidance in aligning the ecosystem types defined by FNAI (Table 2.2) with the Costanza et al. (1997) classifications. 5 There were two exceptions to this approach. First, open water could be classified as either lakes/rivers or open ocean. For the 11 sites we chose, open ocean was not applicable, so we used lakes/rivers. Beach dunes could be classified as either estuary or open ocean. Again, open ocean did not apply so we opted for the more general “coastal” figure, which includes subcategories of estuaries, sea grass, coral reefs, and shelf. This eliminated any possible over-inflation of numbers which may have occurred by applying the much larger estuary figure to beach dunes.
22
Table 3.6 Categorization of Florida Ecosystem Types
Costanza et al. Ecosystem
Classification
FNAI Equivalent Ecosystem Category
Coastal beach dune Estuaries estuarine unconsolidated substrate
Tropical Forest maritime/tropical hammock Temperate/Boreal Forest exotics, hardwood hammock, mesic flatwoods, mesic hammock,
pinelands, pine plantation, prairie hammock, sandhill, scrub, scrubby flatwoods, seepage slope, upland hardwood forest,
upland mixed forest, xeric hammock Grass/Rangelands dry prairie, ruderal/disturbed land, shrub and bushland;
Tidal Marsh/Mangroves basin marsh/depression marsh, cattail marsh, estuarine tidal marsh/coastal saltmarsh, floodplain marsh, freshwater
marsh/wet prairie, swale; Swamp/Floodplains basin swamp, baygall, bay swamp, bottomland forest, cypress
swamp, dome swamp, floodplain forest, floodplain swamp, hardwood swamp, hydric hammock, mangrove swamp, shrub
swamp, slough, strand swamp, wet flatwoods Lakes/Rivers blackwater stream, coastal dune lake, open water, spring-run
stream; Cropland grasslands and agriculture.
The third step consisted of taking the economic values estimated by Costanza et. al (1997) for various ecosystem services and applying them to those ecosystems identified in the 12 conservation areas. The economic values of various ecosystem types used by Costanza et al. are shown in Table 3.7. These estimates were derived by converting original Costanza figures from hectares to acres and adjusting for inflation using the U.S. Consumer Price Index.
Table 3.7 Average Annual Value of Ecosystem Services
by Ecosystem Types
Ecosystem Type Economic Value$/acre
Coastal 2,087 Estuaries 11,756
Tropical Forest 1,033 Temperate/Boreal Forest 155
Grass/Rangelands 120 Tidal Marsh/Mangroves 5,144
Swamps/Floodplains 10,082 Lakes/Rivers 4,375
Cropland 47

23
The highest valued ecosystems are estuaries ($11,756/acre) swamps and floodplains (about 10,000/acre). Tidal marshes/mangroves and lakes/rivers are the next highly valued ecosystems at about $5,000 and $4,400 per acre, respectively. Table 3.8 shows the per acre and total ecosystem values for the services provided by the ten conservation areas in our study. Caution should be taken to avoid equating the ecosystems economic value with its ecological value. For instance, sandhill and scrub (uplands) are ecologically essential in their own right and as components of the landscape. Also, exotics do provide some economic value although ultimately their dominance over native vegetation and the cost of removal are ecologically and economically expensive. Table 3.8 is on the following page.

24
Table 3.8 Estimated Annual Value Ecosystem Services (ES) for Eleven Florida Conservation Areas (2006$)
Total Acres
Value per Acre
Total ES Value
Total Acres
Value per Acre
Total ES Value
Basin Marsh/Depression
Marsh
1,819.90 $5,144 $ 9,361,399 Mangrove Swamp 358.20 $10,082 $3,611,267
Basin Swamp 3,749.24 $10,082 $ 37,798,732 Maritime/Tropical Hammock
3,302.57 $1,033 $3,411,911
Baygall 2,398.00 $10,082 $24,175,929 Mesic Flatwoods 5,039.07 $155 $782,168 Bay Swamp 14,142.00 $10,082 $142,575,475 Mesic Hammock 69.50 $155 $10,788 Beach Dune 769.21 $2,087 $1,605,037 Open Water 8,216 $4,375 $35,945,000
Blackwater Stream 389.70 $4,375 $1,705,108 Pinelands 45,046.87 $155 $6,992,203 Bottomland Forest 2,432.10 $10,082 $24,519,715 Pine plantations 22,608.50 $155 $3,509,304
Cattail Marsh 0 $5,144 0 Prairie Hammock 195.10 $155 $30,283 Coastal Dune Lake 181.92 $4,375 $795,980 Ruderal/Disturbed Land 8,287 $120 $994,440
Cypress Swamp 3,199.04 $10,082 $32,251,678 Sandhill 132.50 $155 $20,567 Dome Swamp 1,322.62 $10,082 $13,334,266 Scrub 3,870.00 $155 $600,692
Dry Prairie 30,319.95 $120 $3,626,152 Scrubby Flatwoods 1,785.24 $155 $277,106 Estuarine Tidal/Coastal
Saltmarsh 20,306.40 $5,144 $104,454,271 Seepage Slope 244.80 $155 $37,999
Estuarine Unconsolidated Subst
47.04 $11,756 $553,005 Shrub and Brushland 8,613.34 $120 $1,030,122
Exotics 52 $155 $8060 Shrub Swamp 37,681.26 $10,082 $379,891,355 Floodplain Forest 36,005.90 $10,082 $363,000,869 Slough 29.80 $10,082 $300,435 Floodplain Marsh 4,880.50 $5,144 $25,103,846 Spring-run Stream 252.10 $4,375 $1,103,048 Floodplain Swamp 11,200.90 $10,082 $112,924,171 Strand Swamp 113.90 $10,082 $1,148,307
Freshwater Marsh/Wet Prairie
24,287 $5,144 $124,932,328 Swale 0 $5,144 0
Grasslands and Agriculture
10,982.80 $47 $517,016 Upland Hardwood Forest
1,867.24 $155 $289,834
Hardwood Hammock 25,921.53 $155 $4,023,555 Upland Mixed Forest 764.70 $155 $118,697 Hardwood Swamp 14,854.89 $10,082 $149,762,621 Wet Flatwoods 1,354.60 $10,082 $13,656,678 Hydric Hammock 39,644.90 $10,082 $399,688,195 Xeric Hammock 306.60 $155 $47,590
Total 393,659 $5,052 $1,823,963,206

25
Kroeger (2005) points out that the per-acre values represent averages of the marginal values of ecosystem services in specific locales and points in time. The marginal value of an acre of a specific ecosystem changes with the existing quantity of acres of that ecosystem, among other things. The distinction between average and marginal values is of importance in assessing the economic benefits of land conservation vs. land conversion. For example, while the values (given in Table 3.9) are assumed to approximate the economic benefits generated by an acre of land in the present, that value is likely to increase with a continuing reduction in total acreage. Therefore, using average values of ecosystem services based on current conditions to assess the relative economic attractiveness of ecosystem conversion is misleading as a basis for decisions about future conversions. The total annual value of the ecosystem services generated by the ten conservation areas is estimated to be about $1.8 billion/year (Table 3.8). Ecosystem types of high value include hydric hammock ($400 million/year), shrub swamp ($380 millon/year, and floodplain forest ($363 million/year). By combining the per-acre ecosystem service values across identified ecosystem-types, we calculated the service values for each of the ten conservation areas (Table 3.9).
Table 3.9
Annual Estimated Annual Value of Ecosystem Services (ES) by Conservation Area
Conservation Area Total Acres ES Value/Acre/Year Total ES Value Aucilla WMA 42,581 $5,833 $ 248,354,767
Babcock-Webb 75,260 $1,310 $ 98,572,325 Big Bend 69,112 $2,589 $ 178,923,074
Caravelle Ranch 24,869 $4,451 $ 110,699,251 Fisheating Creek 18,272 $5,729 $ 104,689,114
Florida Keys 2,269 $3,049 $ 6,919,360 Guana River 9,815 $3,154 $ 30,951,899
Lake Wales Ridge 12,601 $1,053 $ 13,274,594 Topsail Hill 1,626 $4,170 $ 6,782,341
Pinhook Swamp 122,251 $8,383 $ 1,024,843,077 Across the 10 conservation areas, the annual average value in ecosystem service benefits is over $5,000 per acre. The Pinhook Swamp conservation area has the highest ecosystem service value of $8,400 per acre, with the Lake Wales Ridge conservation area having the lowest ecosystem service value at $1,053 per acre. Still, the Lake Wales Ridge conservation area as a whole generates an estimated $13 million in ecosystem services benefits per year. The total value of ecosystem services across the 10 protected conservation areas is estimated to be over $1.8 billion per year (Table 3.8). The highest annual ecosystem service benefits are generated by Pinhook Swamp at over $1 billion/year. The lowest estimated levels of ecosystem service values are generated by Topsail Hill (nearly $6.9 million/year) and the Florida Keys (at about $7 million/year) (Table 3.9). Even though these ecosystem service

26
benefits are small compared to other conservation areas, they are nonetheless substantial and contribute significantly to the overall environmental and economic health of the state. We must emphasize that the level of ecosystem service benefits shown in Tables 3.8 and 3.9 are first order estimates. These values were not directly derived from primary research on biological or physical processes of the conservation areas addressed in this study, but represents averages derived from studies around the globe. As Kroeger (2005) points out:
“Some service values depend, among other factors, on the proximity of the respective ecosystems to locations of human activity and to levels of particular types of pollution. In addition, all service values depend on the size of the affected economy and the relative scarcity of the particular ecosystem services. Therefore, some of the values used may not be accurate estimators for the actual values provided by the ecosystems in the [ten conservation areas]. To the extent that this is true in the case at hand, the application of benefit transfer will result in errors in our value estimates. Ideally, to avoid such errors, a more detailed analysis of the local context would be required (IUCN, TNC, and World Bank, 2004). For these reasons, the estimated total annual value of the ecosystem services provided by the natural areas in the [ten conservation areas] should only be considered a rough approximation.”
Although the ecosystem service benefits presented here are estimates, they are nonetheless indicative that the non-market value of the natural functions of conservation lands such as climate regulation, water supply, waste management, nutrient recycling, and disturbance regulation can be substantial. Even if benefit levels are overestimated by 50%, the total value of ecosystem service benefits would still be over $900 million a year for the ten conservation areas alone. We believe that the ecosystem service benefits estimated here are probably higher than $900 million/year and will rise in the future due to increasing scarcity of natural areas. The major point is that by protecting and expanding state conservation lands, ecosystem services provide enormous value to residents of Florida

27
IV. Summary, Policy Implications, and Recommendations Conservation areas acquired under the Florida’s Conservation and Recreation Lands, Preservation 2000, and Florida Forever programs provide substantial economic benefits to the state, its residents, and visitors. Florida’s conservation lands are generating enormous economic benefits for the individuals that live near those lands, for all state residents, and for millions of visitors to the state each year. The benefits come from direct use of the conservation areas for recreational activities, as well as from the ecosystem services that these conserved natural lands generate for the public. These economic benefits are a major reason why a successor program to Florida Forever must be established and implemented. The conservation areas of Florida provide a variety of direct use benefits, especially in the form of consumptive and non-consumptive recreational activities. One of the conservation areas covered in our study (Babcock-Webb) is estimated to generate over $100,000 per year in entrance fees alone and is an indicator of the demand that residents have for conservation areas similar to Babcock-Webb. Harding et al. (2003) estimated that the total direct use benefits generated by 17 conservation areas in the form of consumptive and non-consumptive recreational use amounted to between $105 and $338 million in 2001-02. The additional consumer surplus for these activities was estimated at about $85 million in that same year. Impacts on the local and state economies from these recreational visits included an estimated $124 million in retail sales, the support of 1,200 jobs, an additional $21.7 million in wages, and the generation of $7.2 million in state sales tax. For 2001-02, the values represented only a portion of the benefits derived from the direct use of Florida’s conservation areas. Not included are direct uses associated with activities such as complementary production or harvesting activities, renewable energy generation, real estate value premiums, education, and research. At the state-level, recent reports have found that the recreational benefits of hunting, fishing, and wildlife watching in Florida, a good portion of which can be attributed to the state’s conservation areas, exceeds $8 billion per year in expenditures (Department of Interior et al. 2006). Based on these findings, Harding (Personal Communication, 2008) has estimated that for 2007 expenditures for hunting, fishing, and wildlife watching generated about $6.8 billion in retail sales, nearly $706 million in state and local taxes, supported 120,000 jobs, and had an overall economic impact of about $11.6 billion. There are also important indirect ecosystem service benefits generated by existing state conservation areas (water quality improvement, carbon sequestration, wildlife habitat, etc.) that would increase substantially with an expansion of Florida’s state land protection program. We estimated that the ecosystem service benefits generated the 10 Florida conservation areas exceeds $5.6 billion/year. This is the equivalent of over $5,000/acre/year on average across all conservation areas and ecosystem types. However, depending on the make-up of various ecosystem-types and the services they generate, the values for ecosystem services across all conservation areas ranged between over $8,300 and $1,053 per acre. Because the monetary values used in this study were derived from earlier studies, our estimates for ecosystem services should be considered as preliminary at this time. Nonetheless, primary research specific to Florida has found that the average annual

28
willingness to pay for water quality and quantity ecosystem services in Northeast Florida (Condon 2004) would be, on average, $44 per household per year, and for improvements in water quality, biodiversity, and carbon sequestration, about $138 per household per year for silvo-pasture systems in the Lake Okeechobee watershed (Shrestha and Alavalapati 2004). There are several policy implications that can be derived from the findings in this report. First, increasing the number of state conservation areas through a successor program to Florida Forever will not only protect the state’s incredible natural resource base, but also be a sound public investment in Florida’s economic prosperity. Further investment in additional conservation areas will continue to meet the growing demand for these areas by residents throughout the state and will benefit the entire state economy. Second, the estimates of direct and indirect economic benefits of various conservation areas can be used to inform the prioritization of habitats for protection. The exception would be the need for providing sufficient habitat for listed upland species where ecosystem service information is more limited6. Third, with increasing scarcity of natural lands and open space, it is in the public’s best interest to continue acquiring land in the form of conservation areas in order to protect and enhance the current conservation land base and generate increased direct and indirect use benefits in the future. Greater economic value can be gained from conservation areas that are well managed and restored, and preventing overly intensive uses that diminish the natural and economic values. In addition to the findings presented in this report, there is a great need for further data collection and research to more accurately estimate the extent of the benefits generated by Florida’s conservation areas. There is a real lack of data on the extent of physical areas conserved, visitation, and the direct receipts generated by Florida’s existing conservation areas. There is a need for better information on the lands acquired thus far and what level of revenues and costs they are generating. For example, annual or bi-annual surveys should be conducted to collect information on visitation levels and demographics, types of activities engaged in, expenditure levels, and management costs for conservation areas. There needs to be more primary research on types of ecosystem services that are generated by Florida’s conservation areas and the associated public and private economic benefits attributable to those services. One topic that deserves attention is the ecological and economic contributions of state conservation lands to a robust and productive saltwater sports fishery. Saltwater fishing generates billions of dollars in retail sales for Florida businesses each year, some of which must reflect the required ecological inputs from conservation areas in the form of breeding and feeding grounds. This paper judiciously applied ecosystem service benefit levels from other locations which may underestimate the value of these same services in the Florida context. Lastly, cost estimates should be obtained for the Florida Forever and predecessor programs in order to calculate a cost/benefit ratio, recognizing near term (e.g., recent storm
6 Craig Diamond, personal communication. October 2007.

29
attenuation, park revenues) and long term (e.g., carbon sequestration, sustainable tourist industry) costs and benefits.

30
References Baker, T. and L. Macdonald. 2004. Investing in Nature: The Economic Benefits of Conserving Natural
Areas in Northeast Florida.” Defenders of Wildlife. Washington DC Barbier, E. 2000. “Valuing the environment as input: review of applications to mangrove-
fisheries linkages.” Ecological Economics. 35:47-61. Condon, B. 2004. Ecosystem Services and Conservation Alternatives: A Case Study of Public Preferences
and Values in Northeast Florida. Master of Science Thesis. University of Florida. Gainesville, Florida.
Costanza, R., R. d’Arge, R. de Groot, S. Farber, M. Grasso, B. Hannon, K. Limburg, S. Naeem, R.O’Neill, J. Paruelo, R. Raskin, P. Sutton, and M. van den Belt. 1997. “The value of the world’s ecosystem services and natural capital. Nature 387:253-60”.
DCA Century Commission. 2006 Annual Report. www.centurycommission.org Financial Trend Forecaster® InflationData.com -
www.inflationdata.com/inflation/Inflation_Rate/InflationCalculator.asp Florida Department of Environmental Protection. 2001. “Florida and the Environment:
Naturally”. www.dep.state.fl.us/ Florida Division of Forestry (FL DOF) - www.fl-dof.com/ Florida Fish and Wildlife Conservation Coalition. 2006. “Revised Report on the Economics
of Fish and Wildlife Recreation.” www.myfwc.com/wildlifelegacy/ Florida Fish and Wildlife Conservation Commission (FFWCC). www.myfwc.com
www.myfwc.com/WMA-Planning/default.htm#Current_CMPs www.myfwc.com/imperiledspecies/pdf/Threatened-and-Endangered-Species-2006.pdf
Florida Natural Areas Inventory (FNAI) www.fnai.org, www.fnai.org/naturalcommguide.cfm Florida Recreation and Park Association (FRPA) –www.frpa.org and Florida’s Fast Facts,
2/10/06 Harding, D., M. Thomas and N. Stratis. 2003. The Economics of Selected Florida Wildlife
Management Areas. Florida Fish and Wildlife Conservation Coalition. Tallahassee, FL. International Union for the Conservation of Nature and Natural Resources (IUCN), The
Nature Conservancy (TNC), and World Bank. 2004. How much is an ecosystem worth? Assessing the economic value of conservation. Washington DC: World Bank. 33 pp.
Hodges, A. and C. Kiker. 2002. Economic Benefits of Natural Land Conservation: Case Study of Northeast Florida. Final Report. Institute of Food and Agricultural Sciences, Food and Resource Economics Department. University of Florida. Gainesville, FL.
Hodges, A. 2006. “Protecting Ecosystem Services in Florida.” White paper written for the DCA Century Commission, Topic Areas on Sustainability. University of Florida. April 24, 2006.
Kroeger, T. 2005. “The Economic Value of Ecosystem Services in Four Counties in Northeastern Florida.” Conservation Economics Working Paper #2. Conservation Economics Program. Defenders or Wildlife. Washington D.C.
Kroeger, T. and P. Manalo. 2006. A review of the economic benefits of species and habitat conservation. Report prepared for the Doris Duke Charitable Foundation. Washington, DC: Conservation Economics Program, Defenders of Wildlife. July 26, 2006. 97 pp.
Larkin, S., J. Alavalapati, and R. Shrestha. 2005. “Estimating the Cost of Preserving Private Lands in Florida: An Hedonic Analysis. J. of Agriculture and Applied Economics. 37:1. pp. 115-130.

31
Milon, W., A. Hodges, A. Rimal, C. Kiker, and F. Casey. 1999. “Public Preferences and Economic Values for Restoration of the Everglades/South Florida Ecosystem.” Economics Report 99-1. Food and Resource Economics Department. University of Florida. Gainesville, FL.
National Ocean Economics Program (NOEP) – Florida Ocean and Coastal Economics report (included in the Governor’s Action Plan referenced below) www.dep.state.fl.us/parks/ - (Division of Recreation and Parks) www.floridaforever.org (Florida Forever)
Noss, R. and R. Peters. 1995. “Endangered Ecosystems; A Status Report on America’s Vanishing Habitat and Wildlife.” Defenders of Wildlife. Washington, DC. December 1995. 132 pp.
Shrestha, R. and J. Alavalapati. 2004. “Valuing environmental benefits or silvo-pasture practice: a case study of the Lake Okeechobee watershed in Florida.” Ecological Economics. 49(2004): pp. 349-359.
Southwick Associates. 2007a. Hunting in American: An Economic Engine and Conservation Powerhouse. Association of Fish and Wildlife Agencies. Washington, D.C.
Southwick Associates. 2007b. Sportsfishing in America: An Economic Engine and Conservation Powerhouse. American Sportsfishing Association. Alexandria, Virginia.
Southwick Associates. 2008. The 2006 Economic Benefits of Watchable Wildlife Recreation in Florida. Report prepared for the Florida Fish and Wildlife Conservation Commission. Fernandina Beach, Florida. 21 pp.
The Nature Conservancy - www.nature.org/wherewework/northamerica/states/florida/ Turner, W., D. Wilcove, and H. Swain. 2006. “State of the Scrub - Conservation Progress,
Management Responsibilities, and Land Acquisition Priorities for Imperiled Species of Florida’s Lake Wales Ridge” Archbold Research Station. www.archbold-station.org/
U.S. Department of the Interior, Fish and Wildlife Service, and U.S. Department of Commerce, U.S. Census Bureau. 2008. 2006 National Survey of Hunting, Fishing, and Wildlife-Associated Recreation-Florida Report. Washington DC.
U.S. Forest Service. 2000. Water and the Forest Service. FS-660. January 2000. Washington DC 26 pp.

32
Appendix I
Ecosystems and Plant and Animal Species Found in the Sample Conservation Areas

33
This Appendix provides a brief description of the location, ecosystem types, and the various protected species associated with the eleven conservation areas discussed in this report7.
Aucilla Wildlife Management Area (WMA) The Aucilla WMA is located in Jefferson and Taylor counties and consists of 47,532 acres. Acquisition was accomplished in parts, beginning with CARL funds, and continuing through FF. The purpose of its acquisition was to establish connectivity in a 200-mile stretch with Big Bend, St. Marks, and Lower Suwannee, as well as the preservation of Aucilla River Sinks and the Aucilla River/Floodplains. The primary natural ecosystems in Aucilla are Baygall, hydric hammock, and upland hardwood forest (See Appendix II for more detailed descriptions of various ecosystem types). It also contains large areas of pine plantations. Unique features include the Wacissa and Aucilla rivers, and karst geologic features. There are fourteen protected species within the Aucilla WMA. The wood stork is listed as endangered on both the federal and state levels. Threatened species and Species of Special Concern (SSC) include the American alligator, eastern indigo snake, piping plover, bald eagle, Florida black bear, fox squirrel, gopher tortoise, limpkin, little blue heron, reddish egret, snowy egret, tri-colored heron, and white ibis. Other species inhabiting the area include the peregrine falcon, American swallow-tailed kite, bobcat, river otter, coyote, and white-tailed deer. Babcock-Webb Wildlife Management Area The Babcock-Webb WMA is located in Charlotte and Lee counties and covers 75,260 acres. State acquisition began as early as 1941, and has continued through CARL, P2000, and FF into 2006. The primary purposes for its initial purchase were wildlife management and public hunting. Today it is designated for use as a wildlife management area. The primary natural ecosystems in Babcock-Webb are dry prairie, pineland, and freshwater marsh/wet prairie. Unique features include extensive South Florida pine flatwoods. The conservation area is home to 18 protected species. Endangered species include the wood stork, the red-cockaded woodpecker, and the Florida mastiff bat. Threatened species and SSC include the bald eagle, crested caracara, Florida sandhill crane, Southeastern American kestrel, roseate spoonbill, limpkin, little blue heron, snowy egret, tri-colored heron, gopher tortoise, eastern indigo snake, American alligator, Florida black bear, Everglades mink, and fox squirrel. Other species inhabiting the area include the peregrine falcon, Northern bobwhite quail, gray fox, red fox, Florida cotton mouse, bobcat, river otter, coyote, and white-tailed deer.
7 This descriptive data was gathered from each area’s management plan, which was prepared by either the Florida Fish and Wildlife Conservation Commission, the Florida Department of Environmental Protection, or the Florida Division of Recreation and Parks.
34
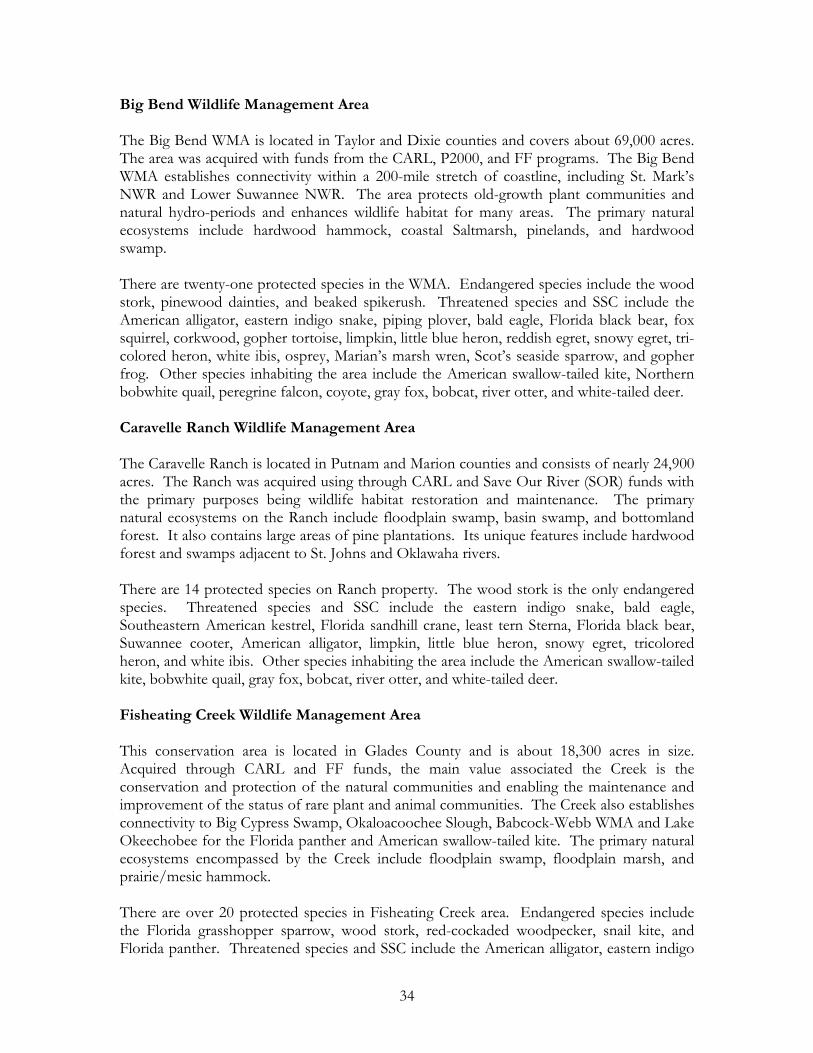
Big Bend Wildlife Management Area The Big Bend WMA is located in Taylor and Dixie counties and covers about 69,000 acres. The area was acquired with funds from the CARL, P2000, and FF programs. The Big Bend WMA establishes connectivity within a 200-mile stretch of coastline, including St. Mark’s NWR and Lower Suwannee NWR. The area protects old-growth plant communities and natural hydro-periods and enhances wildlife habitat for many areas. The primary natural ecosystems include hardwood hammock, coastal Saltmarsh, pinelands, and hardwood swamp. There are twenty-one protected species in the WMA. Endangered species include the wood stork, pinewood dainties, and beaked spikerush. Threatened species and SSC include the American alligator, eastern indigo snake, piping plover, bald eagle, Florida black bear, fox squirrel, corkwood, gopher tortoise, limpkin, little blue heron, reddish egret, snowy egret, tri-colored heron, white ibis, osprey, Marian’s marsh wren, Scot’s seaside sparrow, and gopher frog. Other species inhabiting the area include the American swallow-tailed kite, Northern bobwhite quail, peregrine falcon, coyote, gray fox, bobcat, river otter, and white-tailed deer. Caravelle Ranch Wildlife Management Area The Caravelle Ranch is located in Putnam and Marion counties and consists of nearly 24,900 acres. The Ranch was acquired using through CARL and Save Our River (SOR) funds with the primary purposes being wildlife habitat restoration and maintenance. The primary natural ecosystems on the Ranch include floodplain swamp, basin swamp, and bottomland forest. It also contains large areas of pine plantations. Its unique features include hardwood forest and swamps adjacent to St. Johns and Oklawaha rivers. There are 14 protected species on Ranch property. The wood stork is the only endangered species. Threatened species and SSC include the eastern indigo snake, bald eagle, Southeastern American kestrel, Florida sandhill crane, least tern Sterna, Florida black bear, Suwannee cooter, American alligator, limpkin, little blue heron, snowy egret, tricolored heron, and white ibis. Other species inhabiting the area include the American swallow-tailed kite, bobwhite quail, gray fox, bobcat, river otter, and white-tailed deer. Fisheating Creek Wildlife Management Area This conservation area is located in Glades County and is about 18,300 acres in size. Acquired through CARL and FF funds, the main value associated the Creek is the conservation and protection of the natural communities and enabling the maintenance and improvement of the status of rare plant and animal communities. The Creek also establishes connectivity to Big Cypress Swamp, Okaloacoochee Slough, Babcock-Webb WMA and Lake Okeechobee for the Florida panther and American swallow-tailed kite. The primary natural ecosystems encompassed by the Creek include floodplain swamp, floodplain marsh, and prairie/mesic hammock. There are over 20 protected species in Fisheating Creek area. Endangered species include the Florida grasshopper sparrow, wood stork, red-cockaded woodpecker, snail kite, and Florida panther. Threatened species and SSC include the American alligator, eastern indigo

35
snake, Florida scrub jay, bald eagle, crested caracara, Southeastern American kestrel, Florida sandhill crane, Florida black bear, gopher frog, gopher tortoise, limpkin, little blue heron, snowy egret, tri-colored heron, white ibis, burrowing owl, Florida mouse, and fox squirrel. Other species inhabiting the area include the peregrine falcon, American swallow-tailed kite, Northern bobwhite quail, bobcat, river otter, and white-tailed deer. Florida Keys Wildlife and Environmental Area The Florida Keys conservation area is situated in Monroe County and comprises about 2,270 acres. The area was primarily acquired through the P2000 and FF programs for the purposes of protecting the hardwood hammocks left in the Keys and its many rare plants and animals, including the Lower Keys marsh rabbit and Key deer. The area also protects some of the Keys recreational and commercial fisheries and well as its reefs. The major natural ecosystems in the conservation area include tropical hammock, mangrove swamps, open water, and coastal salt marsh. There are 71 protected species in the conservation area. Endangered species include Schaus’ swallowtail butterfly, American crocodile, Atlantic green turtle, leatherback turtle, Key mud turtle, Atlantic ridley turtle, hawksbill sea turtle, Key Largo woodrat, Key Largo cotton mouse, silver rice rate, Lower Keys marsh rabbit, Key deer, West Indian manatee, Blodgett’s wild-mercury, prickly-apple, tree cactus, Simpson’s prickly-apple, wild cinnamon, Porter’s broad-leafed-spurge, Geiger tree, cupania, small-fruited varnishleaf, milkbark, myrtle-of-the-river, wild cotton, lignum vitae, false boxwood, manchineel, white ironwood, sand flax, whitish passionflower, yellowwood, pride-of-the-Big-Pine, mahogany, brittle thatch palm, Florida thatch palm, banded wild-pine, worm-vine orchid, bay cedar, and sea lavender. Threatened species and SSC include the Atlantic loggerhead turtle, Big Pine Key ring snake, Lower Keys brown snake, Florida ribbon snake, eastern indigo snake, least tern, piping plover, bald eagle, Southeastern American kestrel, white ibis, white-crowned pigeon, joewood, silver palm, Key silverside, rhacoma, Garber’s spurge, Florida tree snail, common snook, Key blenny, red rat snake, Florida Keys mole skink, Black skimmer, brown pelican, roseate tern, roseate spoonbill, little blue heron, reddish egret, snowy egret, tri-colored heron, and osprey. Other species inhabiting the area are the peregrine falcon, American swallow-tailed kite, bobcat, and gray fox. Guana River Wildlife Management Area The Guana River conservation area is located in St. John’s County and was acquired using CARL and FF funding. The conservation area serves to maintain water quality, retain high-quality wildlife habitat, and to restore and maintain the natural condition of native plant communities. The primary natural ecosystems in the area include estuarine tidal marsh, open water, basin marsh, mesic flatwoods, maritime hammock, and scrub. There are an estimated 15 protected species in this conservation area. Endangered species include the wood stork and the West Indian manatee. Threatened species and SSC include the bald eagle, American alligator, eastern indigo snake, piping plover, least tern, Southeastern American kestrel, gopher tortoise, eastern brown pelican, tricolored heron, little blue heron, snowy egret, roseate spoonbill, and American oystercatcher. Other species

36
inhabiting the area include the gray fox, striped skunk, bobcat, American swallow-tailed kite, northern bobwhite quail, peregrine falcon, river otter, and white-tailed deer. Lake Wales Ridge Wildlife Enhancement Area The Lake Wales conservation area is located in Highlands and Polk counties and has been primarily acquired through both CARL and FF program funds. The main objective in acquiring this area is to conserve and protect environmentally unique and irreplaceable lands that contain native, relatively unaltered flora and fauna representing a natural area unique to the region. Primary natural ecosystems comprising the area include oak scrub, schrub/brush, dry prairie, pinelands, and cypress and bay swamps. It also has a significant area of ruderal land and grassland. Its unique features are its endemic scrub communities. There are 57 protected species that inhabit the area. The species listed as Endangered include the Florida panther, wood stork, Curtiss’ milkweed, Florida bonamia, pygmy fringetree, perforate reindeer lichen, pigeon-wing butterfly pea, short-leaved rosemary, Avon Park rattlebox, scrub buckwheat, wedgeleaf button snakeroot, Highland’s St. John’s wort, Edison’s St. John’s wort, pine pinweed, scrub blazing star, scrub beargrass, cutthroat grass, papery whitlow-wort, scrub milkwort, hairy jointweed, Small’s jointweed, scrub plum, hidden stylisma, and Carter’s mustard. Threatened species and SSC include the American swallow-tailed kite, osprey, bald eagle, short-tailed hawk, crested caracara, sandhill crane, hairy woodpecker, Florida scrub Jay, short-tailed shrew, Florida mouse, fox squirrel, Florida black bear, American alligator, eastern indigo snake, bluetail mole skink, gopher tortoise, sand skink, Florida pine snake, Florida gopher frog, Florida scrub lizard, short-tailed snake, brown pelican, great egret, snowy egret, little blue heron, tricolored heron, roseate spoonbill, white ibis, Ashe’s savory, garberia, Florida hartwrightia, nodding pinweed, and Catesby’s lily. Other species inhabiting the area include the gray fox, northern bobwhite quail, bobcat, river otter, coyote, and white-tailed deer. Topsail Hill Preserve State Park Topsail Hill is located in the northwestern panhandle of Florida in Walton and Santa Rosa counties and has been acquired in stages using CARL, P2000, and FF program funding. The purpose for its acquisition was to conserve and to protect environmentally unique and irreplaceable lands that contain native, relatively unaltered flora and fauna unique to the region and the state. The primary natural ecosystems that comprise the area include wet flatwoods, scrub, beach dune, coastal dune lake, mesic flatwoods, and wet prairie. There are 21 protected species in the Park. Endangered species are the Atlantic green turtle, red-cockaded woodpecker, Choctawatchee beach mouse, and Florida manatee. Threatened species and SSC include the American alligator, Atlantic loggerhead turtle, gopher tortoise, southeastern snowy plover, piping plover, little blue heron, reddish egret, snowy egret, tricolored heron, white ibis, Southeastern American kestrel, Florida sandhill crane, bald eagle, brown pelican, black skimmer, least tern, and Florida black bear. Other species inhabiting the area include the gray fox, striped skunk, American swallow-tailed kite, northern bobwhite quail, river otter, and white-tailed deer.

37
Pinhook Swamp
Pinhook Swamp is in the northeastern part of Florida and is located in Columbia and Baker counties. It was acquired through CARL and FF funds for the purposes of restoring, maintaining, and protecting in perpetuity all native ecosystems in the area and to integrate this protection with compatible human uses. The ecosystems that comprise Pinhook Swamp include shrub swamp, floodplain forest, bay swamp, pinelands, freshwater swamp/wet prairie, and hardwood swamp. The Swamp protects the water flow to the Suwannee and St. Mary’s rivers and is a critical link in establishing connectivity between the Ocala and Osceola National Forests (referred to as the O2O project), as well as, between the Osceola National Forest and the Okeefenokee National Wildlife Refuge in southern Georgia.
There are 9 protected species in the Swamp. Endangered species include the gray bat and wood stork. Threatened species and SSC include the red-cockaded woodpecker, bald eagle, Florida black bear, Florida sandhill crane, eastern indigo snake, American alligator, and fox squirrel. Other species inhabiting the area include the American swallow-tailed kite, bobcat, mink, forest river otter, weasel, wild turkey, bald cypress, sweet gum trees, sweet bay trees, pitcher plants, magnolias, brown-headed nuthatch, Bachman’s warbler, and the prothonotary warbler.

38
Appendix II
Description of Florida Ecosystem Types

39
Basin Marsh/Depression Marsh – Wetland herbaceous community occupying a large depression/basin or small rounded depression in sand substrate with peat accumulating toward the center. Often combinations of sawgrass, cattail, buttonbush, and mixed emergents occur. Seasonally inundated, still water; subtropical or temperate; frequent or occasional fire; maidencane, fire flag, pickerelweed. Depression Marshes are similar in vegetation and physical features to, but are generally smaller than, Basin Marshes. Basin Swamp – Forested wetlands of primarily deciduous trees occurring in broad depressions. Basin Swamp is a relatively large and irregularly shaped basin that is not associated with rivers, but is vegetated with hydrophytic trees and shrubs that can withstand an extended hydroperiod. Dominant plants include blackgum, cypress, and slash pine. Other typical plants include red maple, swamp redbay, sweetbay magnolia, loblolly bay, Virginia willow, fetterbush, laurel greenbrier, Spanish moss, wax myrtle, titi, sphagnum moss, and buttonbush. Large basin with peat substrate; seasonally inundated, still water; subtropical or temperate; occasional or rare fire; vegetation characterized by cypress, blackgum, bays and/or mixed hardwoods. Bay Swamp – These hardwood swamps contain broadleaf evergreen trees that occur in shallow, stagnant drainages or depressions often found within pine flatwoods, or at the base of sandy ridges where seepage maintains constantly wet soils. The soils, which are usually covered by an abundant layer of leaf litter, are mostly acidic peat or muck which remain saturated for long periods but over which little water level fluctuation occurs. Overstory trees within bayheads are dominated by sweetbay, swamp bay, and loblolly bay. Depending on the location within the state, other species including pond pine, slash pine, blackgum, cypress, and Atlantic white cedar can occur as scattered individuals, but bay trees dominate the canopy and characterize the community. Understory and groundcover species may include dahoon holly, wax myrtle, fetterbush, greenbriar, royal fern, cinnamon fern, and sphagnum moss.
Baygall – Forested wetlands dominated by evergreen shrubs or bay trees. Baygalls are densely forested, peat-filled seepage depressions often at the base of sandy slopes. The canopy is composed of tall, densely packed, generally straight-boled evergreen hardwoods dominated by sweetbay, swamp red bay, and loblolly bay. A more or less open understory of shrubs and ferns commonly occurs, while sphagnum mats are often interlaced with the convoluted tree roots. Wetland maintained by down slope seepage, usually saturated and occasionally inundated; subtropical or temperate; rare or no fire; bays and/or dahoon holly and/or red maple and/or mixed hardwoods. Beach Dune – Active coastal dune with sand substrate; xeric; temperate or subtropical; occasional or rare fire; sea oats and/or mixed salt-spray tolerant grasses and herbs. Blackwater Stream – Perennial or intermittent/seasonal watercourse characterized by tea-colored water with a high content of particulate and dissolved organic matter derived from drainage through swamps and marshes; generally lacking an alluvial floodplain. Blackwater Streams originate deep in sandy lowlands where extensive wetlands with organic soils function as reservoirs, collecting rainfall and discharging it slowly to the stream. They generally are acidic, but may become circumneutral or slightly alkaline during low-flow stages when influenced by alkaline groundwater.
40
Bottomland Forest – These wetland forests are composed of a diverse assortment of hydric hardwoods which occur on the rich alluvial soils of silt and clay deposited along several Panhandle rivers. They are low-lying, closed-canopy forests of tall, straight trees with either a dense shrubby understory and a little ground cover, or an open understory and ground cover of ferns, herbs, and grasses. Typically flatlands with sand/clay/organic substrate; occasionally inundated; temperate; rare or no fire; water oak, red maple, beech, magnolia, tuliptree, sweetgum, bays, cabbage palm, and mixed hardwoods. Cattail Marsh – While not an exotic species, cattail is an invasive vegetative species under certain conditions. Expansion of this species throughout the Everglades is likely due to nutrient enrichment from farming and housing development (esp. with phosphorus) of water flowing into these areas. Cattail Marshes can develop into dense monocultures, offering limited wildlife and fisheries habitat. Coastal Dune Lake – Basin or lagoon influenced by recent coastal processes; predominantly sand substrate with some organic matter; salinity variable among and within lakes, and subject to saltwater intrusion and storm surges; slightly acidic, hard water with high mineral content (sodium, chloride). Cypress Swamp – This community occurs on nearly level or depressional, poorly drained soils with water at or above ground level for a good portion of the year. It is dominated by either bald or pond cypress and generally occurs as cypress heads or domes. These regularly inundated wetlands form a forested border along large rivers, creeks, and lakes. They have very low numbers of scattered black gum, red maple, and sweetbay. Understory and ground cover are usually sparse due to frequent flooding but sometimes include such species as buttonbush, lizard's-tail, and various ferns. Dome Swamp – Forested wetlands of primarily deciduous trees, often found in depressions within a flatwoods matrix. Trees in the center are taller than those on the edges, giving the stand a dome-shaped profile. Rounded depression in sand/limestone substrate with peat accumulating toward center; seasonally inundated, still water; subtropical or temperate; occasional or rare fire; cypress, blackgum. Dome Swamps generally function as reservoirs that recharge the aquifer when adjacent water tables drop during drought periods.
Dry Prairie – Dry prairies are vast, treeless plains, often intermediate between wet grassy areas and the forested uplands. Dry prairies are large native grass and shrublands occurring on very flat terrain interspersed with scattered cypress domes and strands, bayheads, isolated freshwater marshes, and hardwood hammocks. This community is characterized by many species of grasses, sedges, herbs, and shrubs, including saw palmetto, fetterbush, staggerbush, tar flower, gallberry blueberry, wiregrass, carpet grasses, and various bluestems. The largest areas of these treeless plains historically occurred just north of Lake Okeechobee, and they were subject to annual or frequent fires. Many of these areas have been converted to improved pasture. Flatland with sand substrate; mesic-xeric; subtropical or temperate; annual or frequent fire; wiregrass, saw palmetto, and mixed grasses and herbs.
Estuarine Tidal Marsh/Coastal Saltmarsh – Expansive intertidal or supratidal area occupied primarily by rooted, emergent vascular macrophytes (e.g., cord grass, needlerush,

41
saw grass, saltwort, saltgrass, and glasswort); may include various epiphytes and epifauna. These herbaceous and shrubby wetland communities occur statewide in brackish waters along protected low energy estuarine shorelines of the Atlantic and Gulf coasts. The largest continuous areas of salt marsh occur north of the range of mangroves, and border tidal creeks, bays and sounds. Plant distribution within salt marshes is largely dependent on the degree of tidal inundation, and many large areas are completely dominated by one species. Generally, smooth cordgrass typically occupies the lowest elevations immediately adjacent to tidal creeks and pools, while black needlerush dominates less frequently inundated zones. The highest elevations form transitional areas characterized by glasswort, saltwort, saltgrass, sea oxeye daisy, marsh elder, and saltbush.
Estuarine Unconsolidated Substrate – Expansive subtidal, intertidal and supratidal area composed primarily of loose mineral matter (e.g., coralgal, gravel, marl, mud, sand and shell); octocorals, sponges, stony corals, nondrift macrophytic algae, blue-green mat-forming algae and seagrasses are all sparse, if present. Exotics – Upland and wetland areas dominated by non-native trees that were planted or have escaped and invaded native plant communities. These exotics include melaleuca, Australian pine, Brazilian pepper, and eucalyptus. Floodplain Forests – Primarily deciduous forest occurring along rivers and larger streams and composed of trees tolerant of prolonged flooding. This forest consists of a closed canopy of tall, straight trees with little shrub or herb layer and large areas of bare mucky soil exposed. Floodplain with alluvial substrate of sand, silt, clay or organic soil; seasonally inundated; temperate; rare or no fire; diamondleaf oak, overcup oak, water oak, swamp chestnut oak, blue palmetto, cane, and mixed hardwoods. Floodplain Marsh – Wetlands of herbaceous vegetation and low shrubs that occur in river floodplains. Floodplain with organic/sand/alluvial substrate; seasonally inundated; subtropical; frequent or occasional fire; maidencane, pickerelweed, sagittaria spp., buttonbush, and mixed emergents. Floodplain Swamp – Floodplain swamps occur on flooded soils along stream channels and in low spots and oxbows within river floodplains. Floodplain with organic/alluvial substrate; usually inundated; subtropical or temperate; rare or no fire; vegetation characterized by cypress, tupelo, blackgum, and/or pop ash.
Freshwater Marsh/Wet Prairie – Herbaceous plant communities occurring on sites where the soil is usually saturated or covered with surface water for one or more months during the growing season. This community has the appearance of an open expanse of grasses, sedges, rushes, and other herbaceous plants. These wetland communities are dominated by a wide assortment of herbaceous plant species growing on sand, clay, marl, and organic soils in areas of variable water depths and inundation regimes. Freshwater marshes occur within depressions, along broad, shallow lake and river shorelines, and are scattered in open areas within hardwood and cypress swamps. Wet prairies commonly occur in shallow, periodically inundated areas and are usually dominated by aquatic grasses, sedges, and their associates. Wet Prairie occurs on low, relatively flat, poorly drained terrain of the coastal plain. Soils

42
typically consist of sands often with a substantial clay or organic component. Flatland with sand substrate; seasonally inundated; subtropical or temperate; annual or frequent fire; maidencane, beakrush, spikerush, wiregrass, pitcher plants, St. John's wort, mixed herbs.
Grassland and Agriculture – These are upland communities where the predominant vegetative cover is very low growing grasses and forbs on intensively managed sites such as improved pastures, lawns, golf courses, road shoulders, cemeteries, or weedy, fallow agricultural fields, etc. This very early succession category includes all sites with herbaceous vegetation during the time period between bare ground, and the shrub and brush stage.
Hardwood Hammock – This wetland community occurs on poorly drained soils subject to constant seepage or high water tables. This community has an evergreen appearance and supports a luxurious growth of vegetation. It has a diversity of species and supports plants found in both drier and wetter sites. Hardwood Swamp – This community is found on level or nearly level, very poorly drained soils bordering rivers and low-lying areas which are either partially submerged or saturated part of the year. The swamp hardwood community is characterized by periodic flooding and a predominance of deciduous hardwood trees and shrubs. Hydric Hammock – Forested wetlands with a canopy of mixed deciduous and evergreen hardwoods, usually including diamond-leaf oak, with cabbage palm in the sub canopy. Occurs in the ecotone between floodplain swamp and upland communities. Hydric Hammock occurs on low, flat, wet sites where limestone may be near the surface and frequently outcrops. Soils are sands with considerable organic material that, although generally saturated, are inundated only for short periods following heavy rains. Lowland with sand/clay/organic soil, often over limestone; mesic-hydric; subtropical or temperate; rare or no fire; water oak, cabbage palm, red cedar, red maple, bays, hackberry, hornbeam, blackgum, needle palm, and mixed hardwoods.
Mangrove Swamp – These dense, brackish water swamps occur along low-energy shorelines and in protected, tidally influenced bays of southern Florida. This community is composed of freeze-intolerant tree species that are distributed south of a line from Cedar Key on the Gulf coast to St Augustine on the Atlantic coast. These swamp communities are usually dominated by red, black, and white mangroves that progress in a sere from seaward to landward areas, respectively, while buttonwood trees occur in areas above high tide. Openings and transitional areas in mangrove swamps sometimes contain glasswort, saltwort, and other salt marsh species. All three major species of mangroves are mapped as a single class with no effort made to differentiate these species into separate zones. Mangrove swamps are habitat for the common snook, Key silversides, American crocodile, American alligator, Florida ribbon snake, striped mud turtle, osprey, black-whiskered vireo, mangrove cuckoo, and other common resident marine and terrestrial, and migratory species.
Maritime/Tropical Hammock – A broad-leafed evergreen forest that is highly influenced by wind and salt spray. Usually represented by several stages of succession including oak-scrub, pine-cedar-palmetto-oak, or a combination of various stands including mixed hardwoods. Vegetative density in the understory can vary from dense stands of saw palmetto

43
and scrub oaks to relatively open, grassy areas having a few low shrubs, high leaf litter, and fallen tree trunks. A cold-sensitive tropical community with very high plant species diversity, it can contain over 100 species of trees and shrubs. Stabilized coastal dune with sand substrate; xeric-mesic; subtropical or temperate; rare or no fire; mixed hardwoods and/or live oak.
Mesic Flatwoods – Upland forest with an open pine canopy and understory composed of varying mixtures of shrubs and grasses. Most extensive ecosystem in Florida - characterized by a low, flat topography with poorly drained, acidic, sandy soils. Flatland with sand substrate; mesic; subtropical or temperate; frequent fire; slash pine and/or longleaf pine with saw palmetto, gallberry and/or wiregrass or cutthroat grass understory. Mesic Hammock – Upland forest of evergreen broadleaved trees. This community occurs on moist, level or nearly level soils. It characteristically has a species-rich over story comprising species typical of both wet and dry hardwood hammocks. Flatland with sand substrate; mesic; temperate; occasional or rare fire; live oak, cabbage palm, and saw palmetto. Pinelands – The pinelands category includes north and south Florida pine flatwoods, and south Florida Pine rock lands. Pine flatwoods occur on flat sandy terrain where the over story is characterized by longleaf pine, slash pine, or pond pine. Generally, flatwoods dominated by longleaf pine occur on well-drained sites, while pond pine is found in poorly drained areas, and slash pine occupies intermediate or moderately moist areas. The understory and groundcover within these three communities are somewhat similar and include several common species such as saw palmetto, gallberry, wax myrtle, and a wide variety of grasses and herbs. Generally wiregrass and runner oak dominate longleaf pine sites; fetterbush and bay trees are found in pond pine areas, while saw palmetto, gallberry, and rusty lyonia occupy slash pine flatwoods sites. Fire is a major disturbance factor. An additional pine flatwoods forest type occurs in extreme south Florida on rock lands where the over story is the south Florida variety of slash pine, and tropical hardwood species occur in the understory. Pine Plantations – Pine plantations are not considered natural communities by FNAI. Pine plantations consist primarily of planted slash pine in various stages of growth. Prairie Hammock – A clump of tall cabbage palms and live oaks in the midst of prairie or marsh communities. These hammocks generally have a very open understory although saw palmetto typically rings the perimeter of these rounded clumps. Prairie Hammocks occur on slight rises in relatively flat terrain. Soils generally consist of sands overlying calcareous marls but may be a more complex association of marl, peat, and sand over limestone. Prairie Hammocks may flood during extreme high water, but they are seldom inundated for more than 10 to 40 days each year. Oak and palm dominated Prairie Hammocks on drier sites tolerate occasional light ground fires, but more diverse hammocks rarely burn. Sites with heavy shrub layers are liable to be severely damaged by a canopy fire. Flatland with sand/organic soil over marl or limestone substrate; mesic; subtropical; occasional or rare fire; live oak and/or cabbage palm. Ruderal – Disturbed land, including barren land, cleared land, and levee.

44
Sandhill – Forest of widely spaced pine trees with a sparse understory of deciduous oaks and a fairly dense ground cover of grasses and herbs on rolling hills of sand. Upland with deep sand substrate; xeric; temperate; frequent fire (2-5 years); longleaf pine and/or turkey oak with wiregrass understory. Fire is an important factor in controlling hardwood competition and other aspects of sandhill ecology. Their soils are composed of deep, marine-deposited, yellowish sands that are well-drained and relatively sterile. Sandhills are important aquifer recharge areas because the porous sands allow water to move rapidly through with little runoff and minimal evaporation. Scrub – Closed to open canopy forest of sand pines with dense clumps or vast thickets of scrub oaks and other shrubs dominating the understory. The ground cover is generally very sparse, being dominated by ground lichens or, rarely, herbs. Open patches of barren sand are common. Where the over story of sand pines is widely scattered or absent altogether, the understory and barren sands are exposed to more intense sunlight. Fire is an important ecological management tool, and commonly results in even-aged stands within regenerated sites. The distribution of sand pine scrub is almost entirely restricted to within the state of Florida. Old dune with deep fine sand substrate; xeric; temperate or subtropical; occasional or rare fire (20 - 80 years). Oak scrub and rosemary scrub are two sub-types. Scrubby Flatwoods – Upland community similar to flatwoods in structure and species composition, but including scrub oaks. Scrubby flatwoods occur at slightly lower elevation than sand pine scrub on well-drained white sands. Flatland with sand substrate; xeric-mesic; subtropical or temperate; occasional fire; longleaf pine or slash pine with scrub oaks and wiregrass understory. Seepage Slope – Wetland on or at base of slope with organic/sand substrate; maintained by down slope seepage, usually saturated but rarely inundated; subtropical or temperate; frequent or occasional fire; sphagnum moss, mixed grasses and herbs or mixed hydrophytic shrubs.
Shrub and Brushland – This association includes a variety of situations where natural upland community types have been recently disturbed through clear-cutting commercial pinelands, land clearing, or fire, and are recovering through natural succession processes. This type could be characterized as an early condition of old field succession, and the community is dominated by various shrubs, tree saplings, and lesser amounts of grasses and herbs. Common species include wax myrtle, saltbush, sumac, elderberry, saw palmetto, blackberry, gallberry, fetterbush, staggerbush, broomsedge, dog fennel, together with oak, pine and other tree seedlings or saplings.
Shrub Swamp – Wetland communities dominated by dense, low-growing, woody shrubs or small trees. Shrub swamps are usually characteristic of wetland areas that are experiencing environmental change, and are early to mid- succession in species complement and structure. These changes are a result of natural or man-induced perturbations due to increased or decreased hydroperiod, fire, clear cutting or land clearing, and siltation. Shrub swamps statewide may be dominated by one species, such as willow, or an array of opportunistic plants may form a dense, low canopy. Common species include willow, wax myrtle, primrose willow, buttonbush, and saplings of red maple, sweetbay, black gum, and other hydric tree

45
species indicative of wooded wetlands. In northern Florida, some shrub swamps are a fire-maintained sub climax of bay swamps. These dense shrubby areas are dominated by black titi, swamp cyrilla, fetterbush, sweet pepperbush, doghhobble, large gallberry, and myrtle-leaf holly.
Slough – Sloughs are the deepest drainages within Strand Swamps and Swale systems, inundated with flowing water except during extreme droughts. Broad, shallow channel with peat over mineral substrate; seasonally inundated, flowing water; subtropical; occasional or rare fire; pop ash and/or pond apple or water lily. Sloughs are often aligned with the lowest part of linear depressions in the underlying limestone bedrock. Spring-run Stream – Perennial watercourse with deep aquifer headwaters and characterized by clear water, circumneutral pH and, frequently, a solid limestone bottom. Perennial watercourse fed by springs. The clarity of the water permits a dense growth of aquatic plants. Strand Swamp – Forested wetlands of primarily deciduous trees occurring in shallow elongated depressions. They are generally situated in troughs in a flat limestone plain. Canopy plants are mainly temperate, while understory and epiphytic plants are mainly tropical. Broad, shallow channel with peat over mineral substrate; seasonally inundated, flowing water; subtropical; occasional or rare fire; cypress and/or willow. Swale – Marshes situated in broad shallow channels with flowing water and characterized by emergent grasses, sedges, and herbs up to ten feet tall. The dominant species is sawgrass, and Swales are generally located over linear depressions in the underlying limestone. Sand/peat substrate; seasonally inundated, flowing water; subtropical or temperate; frequent or occasional fire; sawgrass, maidencane, pickerelweed, and/or mixed emergents. Upland Hardwood Forest – Upland forest community, with a diverse mixture of northern deciduous and evergreen hardwood species in the canopy and sub canopy, found on richer soils, often where limestone is at, or near, the surface. Upland with sand/clay and/or calcareous substrate; mesic; temperate; rare or no fire; spruce pine, magnolia, beech, pignut hickory, white oak, and mixed hardwoods. Canopy is densely closed, except during winter in areas where deciduous trees predominate. Thus, air movement and light penetration are generally low, making the humidity high and relatively constant. Included is Mixed Pine-Hardwood, which occurs on rolling uplands. Upland Mixed Forest – Upland with sand/clay substrate; mesic; temperate; rare or no fire; loblolly pine and/or shortleaf pine and/or laurel oak and/or magnolia and spruce pine and/or mixed hardwoods. Quite similar to Upland Hardwood Forests in physical environment and species. The primary difference between these communities is that Upland Mixed Forests generally lack shortleaf pine, American beech and other more northern species that typically occur in Upland Hardwood Forests. Disturbed sites in both may require hundreds of years to reach full development with species compositions representative of climax conditions. Wet Flatwoods – Wetland forest with pine canopy and shrubby and/or herbaceous understory. Flatland with sand substrate; seasonally inundated; subtropical or temperate;

46
frequent fire; vegetation characterized by slash pine or pond pine and/or cabbage palm with mixed grasses and herbs. Xeric Hammock – Upland with deep sand substrate; xeric-mesic; temperate or subtropical; rare or no fire; combinations of live oak, sand live oak, laurel oak and other oaks, sparkleberry, saw palmetto. Either a scrubby, dense, low canopy forest with little understory other than palmetto, or a multi-storied forest of tall trees with an open or closed canopy. When fire occurs, it is nearly always catastrophic and may revert to Xeric Hammock into another community type. Xeric Hammock only develops on sites that have been protected from fire for 30 or more years.