A Preclinical Model for ERα-Positive Breast Cancer Points ... · d Mammary stroma induces...
34
Article A Preclinical Model for ERa-Positive Breast Cancer Points to the Epithelial Microenvironment as Determinant of Luminal Phenotype and Hormone Response Graphical Abstract Highlights d Tissue microenvironment is critical for the growth of ER + breast cancer cells d Mammary stroma induces TGFb/SLUG signaling and basal differentiation in MCF7 cells d Mouse milk ducts enable physiological growth of ER + breast cancer cells d Mouse intraductal ER + PDXs are robust, retransplantable, and predictive Authors George Sflomos, Valerian Dormoy, Tauno Metsalu, ..., Jaak Vilo, Ayyakkannu Ayyanan, Cathrin Brisken Correspondence cathrin.brisken@epfl.ch In Brief Sflomos et al. show that engrafting human estrogen receptor a-positive breast tumors into mouse milk ducts, in contrast to mammary fat pads, efficiently generates retransplantable xenografts that mimic the original tumors. They identify differential induction of SLUG by these microenvironments as a key factor. Accession Numbers GSE68694 GSE74608 Sflomos et al., 2016, Cancer Cell 29, 1–16 March 14, 2016 ª2016 Elsevier Inc. http://dx.doi.org/10.1016/j.ccell.2016.02.002
Transcript of A Preclinical Model for ERα-Positive Breast Cancer Points ... · d Mammary stroma induces...

Article
A Preclinical Model for ER
a-Positive Breast CancerPoints to the Epithelial Microenvironment asDeterminant of LuminalPhenotypeandHormoneResponseGraphical Abstract
Highlights
d Tissue microenvironment is critical for the growth of ER+
breast cancer cells
d Mammary stroma induces TGFb/SLUG signaling and basal
differentiation in MCF7 cells
d Mouse milk ducts enable physiological growth of ER+ breast
cancer cells
d Mouse intraductal ER+ PDXs are robust, retransplantable,
and predictive
Sflomos et al., 2016, Cancer Cell 29, 1–16March 14, 2016 ª2016 Elsevier Inc.http://dx.doi.org/10.1016/j.ccell.2016.02.002
Authors
George Sflomos, Valerian Dormoy,
Tauno Metsalu, ..., Jaak Vilo,
Ayyakkannu Ayyanan, Cathrin Brisken
In Brief
Sflomos et al. show that engrafting
human estrogen receptor a-positive
breast tumors into mouse milk ducts, in
contrast to mammary fat pads, efficiently
generates retransplantable xenografts
that mimic the original tumors. They
identify differential induction of SLUG by
these microenvironments as a key factor.
Accession Numbers
GSE68694
GSE74608

Please cite this article in press as: Sflomos et al., A Preclinical Model for ERa-Positive Breast Cancer Points to the Epithelial Microenvironment asDeterminant of Luminal Phenotype and Hormone Response, Cancer Cell (2016), http://dx.doi.org/10.1016/j.ccell.2016.02.002
Cancer Cell
Article
A Preclinical Model for ERa-Positive Breast CancerPoints to the Epithelial Microenvironment asDeterminantofLuminalPhenotypeandHormoneResponseGeorge Sflomos,1 Valerian Dormoy,1 Tauno Metsalu,2 Rachel Jeitziner,1 Laura Battista,1 Valentina Scabia,1
Wassim Raffoul,3 Jean-Francois Delaloye,3 Assya Treboux,3 Maryse Fiche,3 Jaak Vilo,2 Ayyakkannu Ayyanan,1
and Cathrin Brisken1,*1ISREC – Swiss Institute for Experimental Cancer Research, School of Life Sciences, Ecole polytechnique federale de Lausanne (EPFL),SV2.832 Station 19, 1015 Lausanne, Switzerland2Institute of Computer Science, University of Tartu, Liivi 2, Tartu 50409, Estonia3Lausanne University Hospital, 1011 Lausanne, Switzerland
*Correspondence: [email protected]://dx.doi.org/10.1016/j.ccell.2016.02.002
SUMMARY
Seventy-five percent of breast cancers are estrogen receptor a positive (ER+). Research on these tumors ishampered by lack of adequate in vivo models; cell line xenografts require non-physiological hormone sup-plements, and patient-derived xenografts (PDXs) are hard to establish. We show that the traditional graftingof ER+ tumor cells into mammary fat pads induces TGFb/SLUG signaling and basal differentiation when theyrequire low SLUG levels to grow in vivo. Grafting into the milk ducts suppresses SLUG; ER+ tumor cellsdevelop, like their clinical counterparts, in the presence of physiological hormone levels. Intraductal ER+
PDXs are retransplantable, predictive, and appear genomically stable. The model provides opportunitiesfor translational research and the study of physiologically relevant hormone action in breast carcinogenesis.
INTRODUCTION
About 90% of potential oncology drugs fail in clinical trials
(Arrowsmith, 2011; Hait, 2010), in part because the preclinical
models used to test them do not adequately reflect their clinical
counterparts. Breast cancer is the leading cause of cancer-
related death among women worldwide. While there are some
preclinical models, there is a paucity of in vivo models for the
estrogen receptor a-positive (ER+) subtypes, which represent
more than 75% of all cases (Hidalgo et al., 2014). The lack of a
clinically relevant model hampers progress in understanding
how hormones, increasingly recognized as important factors
in breast carcinogenesis, impinge on disease progression and
therapy.
Many cell lines reflecting different breast cancer subtypes
have been established. In those that can grow as xenografts, a
Significance
A high percentage of potential oncology drugs fail in clinical trinadequate. Breast cancer is the leading cause of cancer-relatin vivo models for the ER+ subtypes, which represent more thatumor cells to their site of origin, themilk ducts. All ER+ cell linescounterparts. Disease progresses with invasion andmetastasisimportant in breast carcinogenesis, can now be studied in a refor development and evaluation of therapies.
million or more cells must be injected either subcutaneously or
into themammary fat pad of immune-compromisedmice; the re-
sulting tumors grow much faster than their human counterparts
(Zhang et al., 2013). Cell lines derived from the most frequent
specific histological subtypes, the ER+ lobular carcinomas, do
not grow in vivo at all (Guiu et al., 2014; Sikora et al., 2014).
The few ER+ cell lines that grow as xenografts depend on exog-
enous 17b-estradiol (E2) (Vargo-Gogola and Rosen, 2007). This
results in serum E2 levels equivalent to mid-menstrual cycle
levels in premenopausal women (100–400 pg/ml) (Kratz et al.,
2004) whereas most ER+ breast cancers occur in postmeno-
pausal womenwith E2 levels <18 pg/ml. The hormonal treatment
has detrimental effects on the E2-sensitive urogenital tracts of
female mice, which some investigators have bypassed using
male mice, circumstances that may further reduce the clinical
relevance (Clinchy et al., 2000). Finally, the injection of tumor
ials, partly because preclinical models used to test them areed death among women worldwide, but we lack appropriaten 75% of all cases. We address these issues by xenograftingand patient-derived xenografts growmimicking their clinical, which become amenable to study. The action of hormones,levant context. Importantly, this model opens opportunities
Cancer Cell 29, 1–16, March 14, 2016 ª2016 Elsevier Inc. 1

Please cite this article in press as: Sflomos et al., A Preclinical Model for ERa-Positive Breast Cancer Points to the Epithelial Microenvironment asDeterminant of Luminal Phenotype and Hormone Response, Cancer Cell (2016), http://dx.doi.org/10.1016/j.ccell.2016.02.002
cells into adipose tissue relates poorly to the human disease
where it may take many years for tumor cells originating from
the milk ducts to invade the stroma and select for metastatic
cells (DeRose et al., 2011).
Patient-derived xenografts (PDXs) mimic the human disease
more accurately (Hidalgo et al., 2014) but they are difficult to
establish from ER+ tumors, with a 2.5% engraftment rate in a
series of 423 ER+ tumors grafted into immune-compromised
mice (Cottu et al., 2012). Genetically engineered mouse models
(GEMMs) have been developed, in which the entire tumorigenic
process including metastasis can be studied (Weinberg, 2011),
but few of these produce ER+ tumors (Zhang et al., 2013).
To our knowledge, Stat1�/� mice are currently the only GEMM
with consistent ERa expression in the majority of tumor cells
and with functional E2 dependence, i.e. decreased growth
upon ovariectomy (Chan et al., 2012).
Here, we address these concerns and the need for a model to
study hormone response in vivo in clinically relevant settings.
RESULTS
Intraductal Growth of Breast Cancer Cell LinesThe mouse intraductal (MIND) model, in which cells are injected
into the mouse milk duct system, was initially developed for
studying ductal carcinomas in situ (DCIS) (Behbod et al., 2009;
Valdez et al., 2011). To test the hypothesis that mousemilk ducts
offer a supportive microenvironment for human breast cancer
cells in the presence of physiological hormone levels, we ob-
tained breast cancer cell lines of different molecular subtypes
(Neve et al., 2006) (Table S1). After infection with DsRed and
luciferase2 expressing lentivirus, between 50,000 and 100,000
cells were injected into the thoracic and inguinal mammary
glands of adult female SCID/Beige mice through the teat,
creating a MIND xenograft (Behbod et al., 2009) (Figure 1A). All
cell lines grew without hormone supplements with engraftment
rates between 30%and 100%with the exception of MDAMB231
cells, which grew only in 1 out of 26 grafts (Figure 1B). The find-
ings included ER+ cell lines, such as the most widely studied
MCF7 (Lee et al., 2015), HCC1428, ZR751, and MDAMB134VI,
which is derived from a lobular carcinoma and does not seem
to have been established in vivo previously (Logan et al.,
2015), as well as the androgen receptor (AR)+ MDAMB453
(Figures 1B, S1A, and S1B), which usually requires exogenous
5a-dihydrotestosterone (Ni et al., 2011). In vivo monitoring of en-
grafted mice by luminescence showed that the ER+ cell lines
grow exponentially (Figure 1C). The initial signal detected from
intraductally injected MDAMB231 cells dropped to background
levels within a week (Figures S1C and S1D).
The basal-like cell lines BT20 and HCC1806 gave rise to
palpable tumors within 3 and 8 weeks, respectively. The en-
grafted ER+ cell lines merely dilated the milk ducts. MCF7 and
T47D cells caused focal distensions (Figures 1D and 1E), and
BT474 cells extensively dilated the milk ducts (Figure 1F). We
used primate-specific Alu repeats to unequivocally identify hu-
man cells (Schmid and Deininger, 1975) (Figures S1E and S1F).
BT20 and HCC1806 were highly invasive, whereas the luminal
cell lines expanded predominantly within the ducts (Figure S1G).
All xenografts preserved histopathological features of their
clinical counterparts (Figure 1G); MCF7 cells showed moderate
2 Cancer Cell 29, 1–16, March 14, 2016 ª2016 Elsevier Inc.
nuclear pleomorphism and tubular differentiation (‘‘gland in the
gland’’), T47D cells were poorly differentiated, and the HER2+
BT474 cells gave rise to DCIS-like structures with marked
nuclear pleomorphism, solid architecture, and central necrosis,
termed ‘‘comedo necrosis’’ frequently associated with HER2+
DCIS (Bane, 2013). HCC1806 formed keratin pearls character-
istic of the rare basaloid breast carcinoma from which they are
derived (Volk-Draper et al., 2012) (Figure 1G).
Fat pad (FP) xenografts have high proliferative indices, irre-
spective of ER status and molecular subtype. In contrast, in
the MIND grafts, Ki67 indices were lower in luminal (MCF7,
BT474, and T47D) than in basal-like (BT20 andHCC1806) tumors
with 23%, 36%, and 23% versus 89% and 77%, respectively
(Figure 1H). Thus, the ER+ MIND xenografts resemble their
clinical counterparts both histopathologically and with respect
to tumor kinetics. The extensive intraductal growth is reminis-
cent of the prolonged DCIS state of many luminal breast cancers
in the clinic (Sgroi, 2010).
MCF7-MIND versus MCF7-FPTo discern the impact of the engraftment site on disease charac-
teristics, we comparedMCF7-MINDwithMCF7 grafted to the FP
(MCF7-FP). MCF7-FP gave rise to large, highly vascularized
tumors within 4–6 weeks (Figure 2A). The MCF7-MINDs became
palpable at 5 months after injection. Macroscopically, milk ducts
distended by MCF7 cells appeared as white lines in a barely
enlarged mammary FP (Figure 2B, arrows). This was reflected
in lower growth rates of MCF7-MIND versus MCF7-FP (Fig-
ure 2C). CD31 immunohistochemistry (IHC) indicated high endo-
thelial cell density in MCF7-FP with an average of 76 units/cm2
(Figures 2D and 2E), whereas in the MCF7-MIND an average of
31 units/cm2 was found selectively around ducts distended by
tumor cells (Figures 2E and 2F). The Ki67 index of MCF7-FP
was 82% compared with 23% in MCF7-MIND (Figures 2G–2I),
which is close to that of human ER+ in situ and invasive breast
cancers, known to have lower proliferative indices than triple-
negative (TN) tumors (Fiche et al., 2000). The apoptotic index
measured by cleaved CK18 was 50 times higher in MCF7-FP
than in MCF7-MIND (Figures S2A and S2B). Invasive breast car-
cinomas often show a desmoplastic reaction involving collagen
deposits and accounting for the characteristic ‘‘hardness’’
upon palpation. Picrosirius red, which stains type I and III colla-
gens, revealed few dispersed fibers in MCF7-FP tumors, in line
with their soft consistency (Figure 2J). In MCF7-MIND, collagen
fibers accumulated around the ducts (Figure 2K); some invasive
areas showed higher collagen content reminiscent of desmopla-
sia seen in human breast cancers (Figure 2L).
Microcalcifications are a common clinical characteristic of
DCIS and are typically detected by mammography (Cox et al.,
2012; Hofvind et al., 2011). They were absent from MCF7-FP
(Figure 2M), HCC1806-MIND, and BT20-MIND (Figure S2C)
butpresent inMCF7-andBT474-MINDasassessedbyH&Estain-
ing, mammography (Figures 2N and S2C), or micro-computed
tomography (Figure S2D).
Tumor Progression in the MCF7-MIND ModelDispersed tumor cells were detected in the stroma by Alu
in situ hybridization (Alu-ISH) 12 weeks after intraductal injec-
tion (Figure 3A). H&E staining revealed invasion (Figure 3B) and

A
MINDFP
B
D
E F
G MCF7 T47D BT474 BT20 HCC1806
H
C
MCF7
T47D
BT474
BT20
HCC1806
020406080
100
Ki67
inde
x (%
)
0 10 20 30 40 50 60 70 80 90 100
MCF7T47D
BT474ZR751
MDAMB134VIMDAMB415
HCC1428MDAMB453MDAMB231
HCC38HCC1806
BT20
% engraftment rate 0 20 40 600.1
1
10
100
days post injection
Fol
d ch
ange
rad
ianc
e
BT474-MINDT47D-MINDMCF7-MIND
Figure 1. Intraductal Growth of Human Breast Cancer Cell Lines
(A) Scheme of the two xenograft approaches: tumor cells are injected either into the mammary fat pad (FP) or intraductally, via the teat (MIND).
(B) Bar graph showing MIND engraftment rates of 12 breast cancer cell lines representing distinct molecular subtypes. Tumor growth was assessed by
bioluminescence and whole-mount analysis (number of analyzed glands 60 R n R 6).
(C) Tumor growth of ER+ MCF7-, BT474-, and T47D-MINDs assessed by bioluminescence. Shown are means ± SEM.
(D–F) Whole-mount stereo micrographs of representative mammary glands (nR 3) 8 weeks after intraductal injection of 53 104 MCF7 (D), T47D (E), or BT474 (F)
cells. Arrowheads point to areas of intraductal growth. Scale bars: 2.5 mm (D), 0.5 mm (E), 5 mm (F).
(G) H&E-stained sections of different MINDs. Scale bars: 50 mm (MCF7, T47D); 200 mm (BT474); 100 mm (BT20); 25 mm (HCC1806).
(H) Bar graph showing Ki67 index of MCF7-, T47D-, BT474-, BT20-, and HCC1806-MIND 8 weeks after injection and 4 weeks for BT20 due to humane reasons.
Data are shown as means ± SD.
See also Figure S1 and Table S1.
Cancer Cell 29, 1–16, March 14, 2016 ª2016 Elsevier Inc. 3
Please cite this article in press as: Sflomos et al., A Preclinical Model for ERa-Positive Breast Cancer Points to the Epithelial Microenvironment asDeterminant of Luminal Phenotype and Hormone Response, Cancer Cell (2016), http://dx.doi.org/10.1016/j.ccell.2016.02.002

7 mm7 mm
020406080
100
Ki6
7in
dex
(%) p<0.0001
FP MIND
020406080
100
Blo
od v
esse
ls/c
m 2 p<0.01
FP MIND
MCF7-FP
MCF7-MIND
0 20 40 60
1
10
100
Fol
d ch
ange
rad
ianc
e
Days post injection
BA C
G
M
J
D
H I
LK
N
E F
Figure 2. MCF7-MIND versus MCF7-FP
(A) Representative photograph of inguinal mam-
mary gland 8 weeks after FP injection with 13 105
MCF7 cells. The arrow indicates blood vessels.
Scale bar, 2 mm.
(B) Representative photograph of inguinal mam-
mary gland with MCF7-MIND 20 weeks after
injection of 5 3 104 MCF7 cells. Arrows indicate
ducts engorged with tumor cells and appear
white. Scale bar, 2 mm.
(C) Growth of MCF7-MIND and -FP assessed by
radiance. Shown are means ± SEM.
(D–F) CD31 IHC of MCF7-FP (D) and MCF7-MIND
(F), and quantification of vessel density in both
models (E).
(G–I) Ki67 IHC on MCF7-FP (G) and MCF7-MIND
(I), and their quantification (H).
(J–L) Picrosirius red-stained histological sections
from MCF7-FP (J), and MCF7-MIND beginning
invasion (K) and invasive (L).
(M and N) H&E staining of mammary tissue (left)
and mammographs (right) of paraffin-embedded
mammary glands, 6 weeks after FP injection (M)
and 5 months after MIND injection (N). Image on
the right (N) shows higher magnification of boxed
area marked in the adjacent lower-magnifica-
tion image. Dotted lines highlight where tumor
samples were embedded.
Graphs represent means ± SD, p values by
Student’s t test. Scale bars, 50 mm (D, F, G, I, J–N).
See also Figure S2.
Please cite this article in press as: Sflomos et al., A Preclinical Model for ERa-Positive Breast Cancer Points to the Epithelial Microenvironment asDeterminant of Luminal Phenotype and Hormone Response, Cancer Cell (2016), http://dx.doi.org/10.1016/j.ccell.2016.02.002
intravasation of tumor cells (Figure 3C). Three to 6 months after
injection, Alu-ISH showed human cells in the lungs (Figure 3D)
that expressed ERa (Figure 3E). Bioluminescence imaging of or-
gans resected post mortem revealed metastatic cells in multiple
organs, the number of which increased over time (Figures 3F and
3G). The most frequent sites of metastasis were bones, lungs,
and brain followed by the liver, pancreas, and kidney (Figures
3F and 3G). Thus, MCF7-MIND xenografts recapitulate the tu-
mor progression of their clinical counterpart (Figure 3H) a finding
that extended to ZR751-, BT474-, T47D-, and HCC1428-MIND
(Figure 3I). The sensitive bioluminescence approach also de-
tected lung metastases in the MCF7-FP, but few brain and no
bone metastases (Figure 3I). Thus, the MIND model improves
the physiological relevance of luminal breast cancer xenografts.
Response to Endocrine TherapyThe selective ER modulator tamoxifen, the selective ER down-
regulator fulvestrant, and aromatase inhibitors are mainstays in
endocrine therapy of ER+ tumors (Howell et al., 2004). To test
whether MCF7-MIND is endocrine responsive and thereby eval-
uate its utility as a preclinical model for drug testing, we treated
mice 4 weeks after cell injection with tamoxifen, fulvestrant, or
solvent (Figure 4A). The treatments inhibited significantly tumor
4 Cancer Cell 29, 1–16, March 14, 2016 ª2016 Elsevier Inc.
growth as measured by in vivo lumines-
cence after 14 days (Figure 4B). In con-
trols, 20% ± 0.8% of the cells were
Ki67+; tamoxifen decreased the Ki67
index to 8.4% ± 5% (Figure 4C) and
induced cleaved CK18 in 18% of the
tumor cells (Figures 4D and 4E), indicating that both decreased
cell proliferation and increased apoptosis contributed to
reduced tumor growth rates.
To mimic the use of fulvestrant in the advanced metastatic
setting, we initiated treatment when metastatic disease was pre-
sent (Figure 4F). A 2-month treatment decreased tumor burden
as measured by in vivo luminescence (Figure 4G), ex vivo DsRed
signal (Figure 4H), and ductal width (Figure 4I). Fulvestrant, which
targets ER for degradation (Osborne et al., 2004), abrogated
expression of both ER and its target, the progesterone receptor
(PR) (Figure 4J). Postmortem analysis showed lung and brain
metastases in control mice but not in fulvestrant-treated mice
(Figure 4K).
Finally, postmenopausal patients with ER+ tumors are
frequently treated with aromatase inhibitors to achieve further
estrogen depletion. As mice have more restricted aromatase
expression than humans in non-ovarian tissue (Chow et al.,
2009), we used ovariectomy to deplete E2 levels in MCF7-
MIND bearing mice. All the control mice had to be euthanized
within 8 months because of tumor burden, whereas 60% of the
ovariectomized females were still alive after a year (Figure 4L).
Thus, MCF7-MIND xenografts can be used as a model to study
different settings of endocrine therapy in luminal breast cancer.

C D E
A
5
x1e5
1310
x1e4
6 2 x1e6
0.5
11.5F
H
days post injection30-90 90-180 180-270
30-90 90-180 180-270
days post injection
B
G
liver
brain
lungs
I
bones3.54
4.55
5.56
6.57
7.58
Ex
vivo
rad
ianc
e (lo
g10)
lungbrainliverbonekidneypancreasmean
ER PR HER2 lung brain liver boneMIND:
ZR751 + neg neg 88 3/5 0/5 1/5 5/5
ZR751 + neg neg 150 4/4 1/4 4/4 0/4
BT474 + + + 175 2/3 3/3 3/3 -
BT474 + + + 215 1/1 1/1 1/1 -
BT474 + + + 260 1/1 1/1 1/1 -
T47D + + neg 45 2/2 1/2 2/2 -
HCC1428 + + neg 45 0/1 0/1 0/1 1/1
FP:MCF7 + + neg 45 10/10 2/10 0/4 0/4
xenograft cell line characteristics time in mice (days)
organs positive by IVIS
Figure 3. Hallmarks of Tumor Progression in
the MCF7-MIND Model
(A–C) H&E-stained sections of MCF7-MIND
3 months after injection showing individual tumor
cells that have invaded the stroma (A), small invasive
focus next to in situ carcinoma (B), and disseminated
tumor cells in a vessel, which is probably a lymph
vessel (C). Images on the right show higher magni-
fication of boxed areasmarked in the adjacent lower-
magnification image. Scale bars: 50 mm (A and C),
100 mm (B).
(D) Alu-ISH of a lung section 5 months after intra-
ductal injection of MCF7 cells showing tumor cell
colony (arrow).
(E) ERa IHC of lung micrometastases. Scale bar,
50 mm.
(F) Ex vivo bioluminescence from metastatic cells in
different organs plotted over time of analysis; values
%103 105 were considered as background (graded
gray shading).
(G) Representative images of ex vivo luminescence
showing MCF7-MIND cells in lungs, brain, liver, and
bones dissected at different times after injection.
Scale bar, 1.5 cm.
(H) Scheme summarizing the hallmarks of tumori-
genesis in MCF7-MINDs over time.
(I) Summary of metastases from the ER+ ZR751-,
BT474-, T47D-, and HCC1428-MINDs andMCF7-FP,
5–37 weeks post injection; mice were euthanized and
bioluminescence was measured in various organs.
Please cite this article in press as: Sflomos et al., A Preclinical Model for ERa-Positive Breast Cancer Points to the Epithelial Microenvironment asDeterminant of Luminal Phenotype and Hormone Response, Cancer Cell (2016), http://dx.doi.org/10.1016/j.ccell.2016.02.002
To further assess the utility of the model for translational
research and to mimic the clinical settings where patients are
treated with endocrine therapy for long periods or until relapse,
we treatedMCF7-MIND bearing tumors for 3monthswith fulves-
Cancer Cell 29
trant or solvent. MIND bearing mammary
glands were dissociated to single cells,
and tumor cells were separated from
mouse cells by fluorescence-activated cell
sorting (FACS) based on DsRed expres-
sion. Their transcriptome was analyzed by
RNA sequencing (Table S2). We identified
4,497 differentially expressed protein cod-
ing genes (logFC >2, p < 0.05) with 1,924
increased and 2,573 decreased upon
endocrine treatment (Figures 4M and Table
S3). Consistent with fulvestrant abrogating
ER protein expression, Kyoto Encyclopedia
of Genes and Genomes (KEGG) analysis
showed decreased expression of genes
involved in ER signaling (Figure S3A).
MetaCore analysis for biomarkers re-
vealed ‘‘Breast Neoplasms’’ and ‘‘Breast
Diseases’’ as the two top significant sig-
natures, indicating clinical relevance (Fig-
ureS3B). BothMetaCoremaps (FigureS3C)
and network (Figure S3D) analyses re-
vealed epithelial to mesenchymal transition
(EMT) as the second most significant sig-
nature. Consistently, when 32 established
EMT genes were used to interrogate the
data the samples clustered into control and fulvestrant-treated
groups (Figure 4N). This corresponds to what is observed in
clinical samples where residual tumor cells surviving endocrine
therapy are enriched for tumor-initiating cells with EMT features
, 1–16, March 14, 2016 ª2016 Elsevier Inc. 5

A D
photon flux ≥1e6 2 weeks
injection endpoint
B C
Tamoxifen
cleaved CK18DAPI
E
G
photon flux ≥1e9 8 weeks
injection
fulvestrant
endpoint
F H I
ERJ
lungsbrain
Vehicle Fulvestrant
lungsbrain
PR
K
vehicletamoxifenfulvestrant
020406080
100
ER
α(%
)
p<0.0001
020406080
100
PR
(%)
05
10152025
% K
i67
p=0.01
0
50
100
control
ovariectomized% S
urvi
val
LER
PR
Fulvestrant
Fulvestrant
Vehicle
Vehicle
Vehicl
e
p=0.001
Tamox
ifen
Vehicl
e % C
leav
ed C
K18
0
10
20
30
40p<0.01
Vehicle
Protein coding genes
2k 4k
all
increased
decreased
0 100 200 300 Days after injection
M N
Ful
vest
rant
Veh
icle
Vehicl
e
Tamox
ifen
Fulves
trant
Days of treatment
05
1015202530
0 2 4 6 8 10 12 14F
old
chan
ge r
adia
nce
0
2
4
6
8
10
0 7 18 25 33 40 47 54 61
fulvestrant
Days of treatment
Fol
d ch
ange
rad
ianc
e
0200400600800
1000
Duc
tal w
idth
(μm
) p<0.0001
Vehicle
Fulves
trant
vehicle
vehicle tamoxifen
fulvestrant
Figure 4. Response of MCF7-MIND to Endocrine Therapy
(A) Experimental scheme for short-term endocrine treatment: 4 weeks after injection of MCF7 when radiance R10 3 106, a 14-day-treatment with tamoxifen,
fulvestrant, or vehicle was initiated.
(B) Graph showing tumor growth based on bioluminescence (n = 3). Statistical significance for the difference in fold-change radiance between treatment and
control groups, p < 0.02 calculated by unpaired Student’s t test, was reached after 14 days of treatment.
(C) Ki67 index of vehicle and tamoxifen-treated tumors.
(D and E) Immunofluorescence (D) and quantification (E) for cleaved CK18, an alternative marker of apoptosis adapted for cells, like MCF7, that do not express
cleaved caspase-3 (Janicke, 2009), on vehicle and tamoxifen-treated tumors. Scale bar, 50 mm.
(legend continued on next page)
6 Cancer Cell 29, 1–16, March 14, 2016 ª2016 Elsevier Inc.
Please cite this article in press as: Sflomos et al., A Preclinical Model for ERa-Positive Breast Cancer Points to the Epithelial Microenvironment asDeterminant of Luminal Phenotype and Hormone Response, Cancer Cell (2016), http://dx.doi.org/10.1016/j.ccell.2016.02.002

Please cite this article in press as: Sflomos et al., A Preclinical Model for ERa-Positive Breast Cancer Points to the Epithelial Microenvironment asDeterminant of Luminal Phenotype and Hormone Response, Cancer Cell (2016), http://dx.doi.org/10.1016/j.ccell.2016.02.002
(Creighton et al., 2009), and suggests that the model may serve
to identify biomarkers.
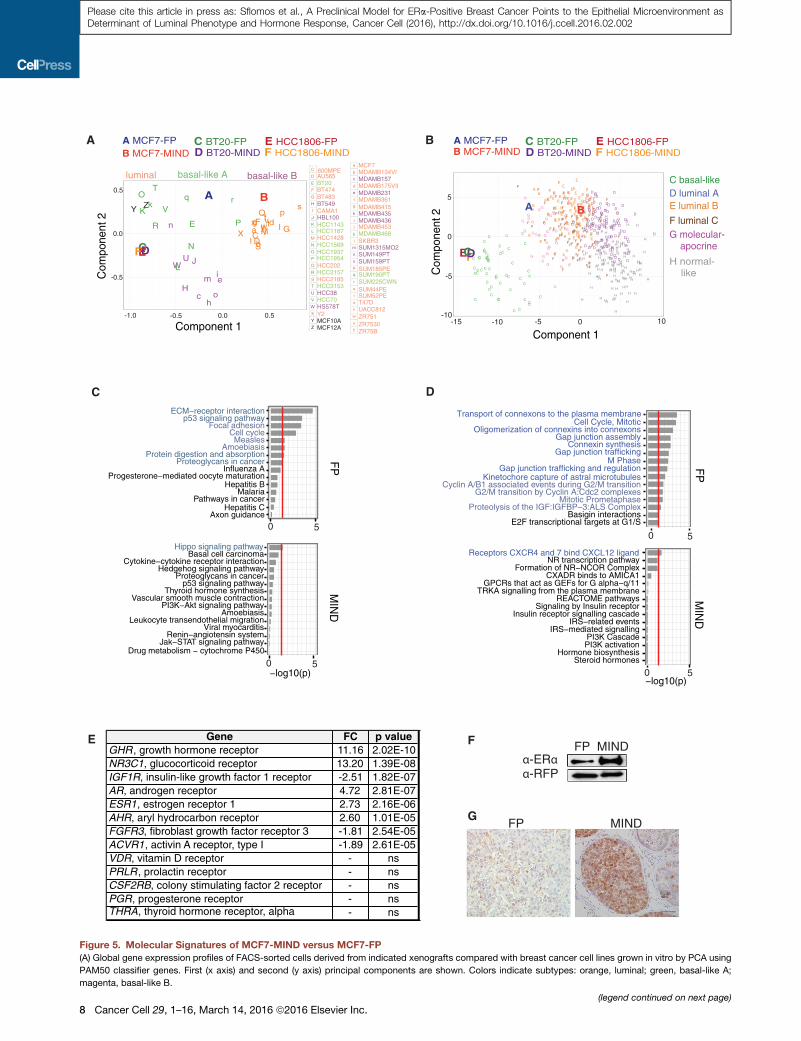
Molecular Signatures of MIND versus FP ModelTogain additional insights into themolecularmechanisms under-
lying the biological differences between the two models, we
analyzed global gene expression of FACS-sorted MCF7:
DsRed/luc2 cells that had been grown asMIND or FP using Affy-
metrix U133 Plus 2.0 arrays. Strikingly, 3,249 genes were differ-
entially expressed between the two sites (R2-fold; p < 0.05)
(Figure S4A and Table S4). Principal component analysis (PCA)
and the PAM50 gene expression classifier for intrinsic subtype
classification (Parker et al., 2009) were used to compare the
models with a panel of 48 breast cancer cell lines (Neve et al.,
2006). MCF7-MIND clustered with the luminal and MCF7-FP
with the basal-like breast cancer cell lines (Figure 5A). In compar-
ison with clinical breast tumor samples profiled with the same
Affymetrix microarray platform (Guedj et al., 2012) and PAM50,
the MCF7-MIND clustered with luminal B and MCF7-FP fell
outside any tumor subtype cluster (Figure 5B).
To assess whether themicroenvironment at the site of engraft-
ment influences other breast cancer cells, we also profiled two
basal-like cell lines, BT20 and HCC1806. Strikingly, not a single
gene was differentially expressed between the two sites (Table
S5), and both lines clustered with the basal-like cell lines and
patient tumors (Figures 5A and 5B). Thus, the molecular signa-
ture of MCF7-MIND but not MCF7-FP resembles their clinical
counterparts, and the in vivo observation that the intraductal
microenvironment specifically favors tumor cells of the luminal
type is corroborated at the molecular level.
To address the factors underlying the different pheno-
types, we analyzed the most significantly changed genes bio-
informatically. KEGG and REACTOME functional enrichment
analysis revealed eight and 13, respectively, distinct terms en-
riched in the MCF7-FP (Figures 5C and 5D). Consistent with
the low Ki67 index in MCF7-MIND, several genes related to
cell proliferation and cell cycle E2F1, MCM2, MKI67, MYBL2,
BUB1, PLK1, CCNE1, CCND1, and CCNB1 were among the
most differentially expressed genes, with higher levels in the
MCF7-FP (Perou et al., 1999) (Tables S4, S5, S6, and S7).
ECM components, focal adhesions, gap junction trafficking,
and gap junction regulation as well as synthesis and oligomeri-
zation of connexins and transport of connexins to the plasma
membrane were predicted to be affected, indicating differen-
tial regulation of gap junctions (Goodenough and Paul, 2009).
(F) Experimental scheme for long-term fulvestrant treatment: Six weeks after inje
fulvestrant was initiated (n R 3 per group).
(G) Graph showing tumor growth measured by radiance. Statistical significance
(H) Fluorescence stereomicroscopy of mammary glands with MCF7DsRed/luc2
four times longer than control gland. Scale bar, 1 mm.
(I) Box plot showing ductal width in glands from control and fulvestrant-treated an
upper and lower borders of the box represent lower and upper quartiles, and lin
(J) ER- and PR-IHC on glands from mice treated with vehicle or fulvestrant, and
(K) Bioluminescence images of lungs and brains isolated from mice after treatme
(L) Kaplan-Meier plot showing survival of females ovariectomized (blue) or sham
log-rank (Mantel-Cox) test.
(M) Bar plot showing protein coding genes, expression levels of which were alte
(N) Heatmap of EMT-related genes in MCF7-MIND fulvestrant-treated and contr
See also Figure S3 and Tables S2 and S3.
By contrast, in MCF7-MIND only one term was enriched in either
analysis, theHippo signalingpathway andCXCR4/7 andCXCL12
(Figures 5C and 5D), respectively. Both of these have been
implicated in breast cancer metastasis (Lamar et al., 2012;
Muller et al., 2001), suggesting that the high propensity of
MCF7-MINDs tometastasizemay relate to their activation. Using
thegeneontology termsignaling pathways, interferon-, cytokine-
mediated-, and vitamin D-receptor signaling pathways were
found to be upregulated in MCF7-FP (Table S6).
The ability of ER+ cell lines to grow asMIND xenografts without
exogenous hormones was unexpected, and led us to assess the
expression of hormone receptors and receptors of downstream
signaling pathways (Table S7). The receptors with known roles in
mammary gland development upregulated in MCF7-MIND were
those for growth hormone, androgen, E2, aryl hydrocarbon, and
glucocorticoids. PR and the prolactin receptor were expressed
at comparable levels in both microenvironments whereas in-
sulin, fibroblast growth factor, and activin A receptors showed
increased expression in MCF7-FP (Figure 5E). The increased
ER and AR protein levels are confirmed (Figures 5F and 5G).
Other ER+ cell lines similarly showed increased ER but not PR
expression in the MIND setting (Figures S4B–S4K).
TheRole of SLUG inMaintaining Luminal Cell PhenotypeMCF7-FP cluster with basal-like cell lines, and the basal markers
CK5, CK6, TP63, S100A4, SNAI2 (SLUG), VIM (vimentin), and
ANXA1 (annexin A1) (de Graauw et al., 2010; Liu et al., 2013)
were among the 50 most significantly enriched genes in
MCF7-FP (Table S4), suggesting that the FP microenvironment
induces a basal/EMT-like state. Gene set enrichment analysis
revealed that EMT-related genes were enriched in MCF7-FP
(Figure 6A). SLUG, vimentin, and annexin A1 proteins were
readily detected in cultured MCF10A cells, which are basal
cells, and in MCF7-FP but not in MCF7 cells in vitro nor in
MCF7-MIND (Figure 6B). Similarly, Caveolin-1, ITGA6, and p63
were increased in MCF7-FP versus MCF7-MIND (Figure 6C).
p63, a transcription factor important in maintaining basal cell
fate (Yalcin-Ozuysal et al., 2010) is expressed in a subset of
MCF7-MIND cells (Figure 6D).
To directly assess whether the intraductal environment can
induce a basal to luminal transition, we isolated MCF7-FP by
FACS, reinjected the cells intraductally, and harvested them
from the intraductal site on day 1 and day 20 after injection.
The transcript levels of the luminally expressed ESR1 and AR
increased 5.1- and 11.3-fold, respectively (Figure 6E), whereas
ction of MCF7DsRed/luc2, when radiance R10 3 109, 60-day-treatment with
(p = 0.014) by Mann-Whitney U test was reached at 18 days of treatment.
treated with vehicle or fulvestrant; note fulvestrant-treated gland was exposed
imals. Horizontal lines outside the box depict minimum and maximum values,
e inside the box identifies the median.
histograms showing percentage of ER+ and PR+ cells. Scale bars, 20 mm.
nt with vehicle (n = 3) or fulvestrant (n = 3). Scale bar, 1 cm.
-operated (red) 20 weeks after injection with MCF7-MIND (n = 5); p < 0.05 by
red in MCF7-MIND by fulvestrant treatment.
ols shown median-centered and log-scaled. Data are shown as means ± SD.
Cancer Cell 29, 1–16, March 14, 2016 ª2016 Elsevier Inc. 7
B
H normal- like
G molecular- apocrine
C basal-likeD luminal AE luminal B
F luminal C
C D
E
A
C
D
E
F
G
H
I
J
K
L
M
N
O
P
Q
R
S
T
U
V
W
X
Y
Z
a
b
c
d
e
fg
h
i
j
k
l
m
n
o
p
q
r
s
t
u
v
w
x
y
A MCF7-FPB MCF7-MIND
yx w
vu t
srq
p
o
n
m
l
k
j
i
h
g f
e
d
c
b
a
ZY
X
W
V
U
T
S
R
QP
O
N
M
L
K
J
I
H
GFE
DC
BA
Com
pone
nt 2
Component 1
600MPE AU565
BT474BT20
BT549 BT483
CAMA1 HBL100HCC1143 HCC1187
HCC1569 HCC1937HCC1954
HCC1428
HCC202 HCC2157 HCC2185 HCC3153 HCC38HCC70HS578T Y2MCF10A MCF12A
MCF7 MDAMB134VIMDAMB157MDAMB175VII MDAMB231
MDAMB435
MDAMB361 MDAMB415
MDAMB453
SKBR3
SUM185PE
SUM44PESUM52PET47D UACC812ZR751 ZR7530 ZR75B
MDAMB436
SUM149PT SUM159PT
SUM190PT
MDAMB468
SUM1315MO2
SUM225CWN
-1.0 -0.5 0.0 0.5
-0.5
0.0
0.5
luminal basal-like A basal-like B
H
H
H
H
H HH
H
H
H
H
H
HH
HH
H
H
H H
H
H
HH
H
HHH
H
H
HH
HH
H
H
H
H
H
HH
H
H
H
HH
HH
H
HH
H
H
H H
H
H
H
H
H
H
H
H
H
H H
H
H
H
H
H
H
H
H H
H
H
H
H
H
H
H
H
H
H
H
H
H
H
H
H
H
H HH
H
HH
H
HH
HH
H
H
HH
H
HH
H
H
HH
H
H
H
H
H
H
H
H
H
H
HH
HH
H
H
H
H
G
G
G
G
G
G
G
G
G
G
G
G
G
G
G
G
GG
G
G
G
G
G
G
GG
G
GG
G
G
G
G
G
G
G
G
GG
GF
F
F
F
F
FF
FF
F
F
F
F
F
F
F
F
F
F
FF
F
F
F
F
F
F
F
FF
F
F
F
FF
F
FF
F
F
F
F
F
F F
F
F
F
FF
F
F
F
F
F
F
F
F
F
F
F
F
F
F
F
F
F
FF
F
F
F
F
F
F
F
F
F
FF
F
F
F
F
F
F
FF
FF
F
EE
E
EEE
E
E
E E
EE
E
E
E
EE
EE
E
E
E
E
E
E
E
EE
EE
E
EE
E
E
EEE E
EE
E
E
E
E
E
E
E
E
EEE
E
E
E
E
E
E
E
E
E
E
EEE
E
E
E
E
E
E E
E
E
E
EE
E
E
E
E
EE
E
E
E
E
E
E
E
EE
E E E
E
E
E
E
E
E
E
E
D
D
D
D
D
D
D
DD
D
D
D
D
D
D
D
D
DD
D
D
D
D
D
D
D
D
D
DD
D
D
D
D
D
DD
D D DD
D
DD
D
D
D
D
D
DD
DD
D
D
DD
D
D
D
D D
D
DD
D
D
D
D
DDD
D
D
D
D
D
D
D
D
DD
D
D
DD
D
D
D
D
D
D
D
D
D
D
D
D
D
D
DD
D
D
D
D
D
D
D
D
D
D
DD
D
DD
D
CC
C
C
CC
C
CC
C
C
C
C
C
C
C
C
C
C
C
CC
CC
C
C
C
C
CC
C
C
C
CC
C
C
C
C
C
C
CC
C
C
C
C
C
C
C
C
C
BA
Component 1
Com
pone
nt 2
5
-5
0
-10-15 -10 -5 0 10
5
−log10(p)
0
Drug metabolism − cytochrome P450Jak−STAT signaling pathway
Renin−angiotensin systemViral myocarditis
Leukocyte transendothelial migrationAmoebiasis
PI3K−Akt signaling pathwayVascular smooth muscle contraction
Thyroid hormone synthesisp53 signaling pathway
Proteoglycans in cancerHedgehog signaling pathway
Cytokine−cytokine receptor interactionBasal cell carcinoma
Axon guidanceHepatitis C
Pathways in cancerMalaria
Hepatitis BProgesterone−mediated oocyte maturation
Influenza AProteoglycans in cancer
Protein digestion and absorptionAmoebiasis
MeaslesCell cycle
Focal adhesionp53 signaling pathway
ECM−receptor interaction
50
E2F transcriptional targets at G1/SBasigin interactions
Proteolysis of the IGF:IGFBP−3:ALS ComplexMitotic Prometaphase
G2/M transition by Cyclin A:Cdc2 complexesCyclin A/B1 associated events during G2/M transition
Kinetochore capture of astral microtubulesGap junction trafficking and regulation
M PhaseGap junction trafficking
Connexin synthesisGap junction assembly
Oligomerization of connexins into connexonsCell Cycle, Mitotic
Transport of connexons to the plasma membrane
Steroid hormonesHormone biosynthesis
PI3K activationPI3K Cascade
IRS−mediated signallingIRS−related events
Insulin receptor signalling cascadeSignaling by Insulin receptor
REACTOME pathwaysTRKA signalling from the plasma membrane
GPCRs that act as GEFs for G alpha−q/11CXADR binds to AMICA1
Formation of NR−NCOR ComplexNR transcription pathway
50
0−log10(p)
MIN
DF
P
5
MIN
DF
P
α-ERαα-RFP
FP MINDF
G
C
C BT20-FP
D
D BT20-MIND
E
E HCC1806-FP
F
F HCC1806-MINDA MCF7-FPB MCF7-MIND
C BT20-FPD BT20-MIND
E HCC1806-FPF HCC1806-MIND
FDEC
Gene FC p valueGHR , growth hormone receptor 11.16 2.02E-10NR3C1, glucocorticoid receptor 13.20 1.39E-08IGF1R, insulin-like growth factor 1 receptor -2.51 1.82E-07AR, androgen receptor 4.72 2.81E-07ESR1, estrogen receptor 1 2.73 2.16E-06AHR, aryl hydrocarbon receptor 2.60 1.01E-05FGFR3, fibroblast growth factor receptor 3 -1.81 2.54E-05ACVR1, activin A receptor, type I -1.89 2.61E-05VDR, vitamin D receptor - nsPRLR , prolactin receptor - nsCSF2RB, colony stimulating factor 2 receptor - nsPGR, progesterone receptor - nsTHRA, thyroid hormone receptor, alpha - ns
FP MIND
Hippo signaling pathwayReceptors CXCR4 and 7 bind CXCL12 ligand
Figure 5. Molecular Signatures of MCF7-MIND versus MCF7-FP
(A) Global gene expression profiles of FACS-sorted cells derived from indicated xenografts compared with breast cancer cell lines grown in vitro by PCA using
PAM50 classifier genes. First (x axis) and second (y axis) principal components are shown. Colors indicate subtypes: orange, luminal; green, basal-like A;
magenta, basal-like B.
(legend continued on next page)
8 Cancer Cell 29, 1–16, March 14, 2016 ª2016 Elsevier Inc.
Please cite this article in press as: Sflomos et al., A Preclinical Model for ERa-Positive Breast Cancer Points to the Epithelial Microenvironment asDeterminant of Luminal Phenotype and Hormone Response, Cancer Cell (2016), http://dx.doi.org/10.1016/j.ccell.2016.02.002

Please cite this article in press as: Sflomos et al., A Preclinical Model for ERa-Positive Breast Cancer Points to the Epithelial Microenvironment asDeterminant of Luminal Phenotype and Hormone Response, Cancer Cell (2016), http://dx.doi.org/10.1016/j.ccell.2016.02.002
basal markers such as cytokeratins 6A and 14, vimentin, N-cad-
herin, and the transcription factors SLUG and DNp63 decreased
up to 95% (CK14) within a day (Figure 6F). At the protein level, ER
was upregulated between days 4 and 8 (Figures 6G and 6H).
Thus, the intraductal environment suppresses the basal differen-
tiation induced by the FP and promotes expression of luminal
genes.
To test the basal transcription factors functionally, we ectopi-
cally expressed DNp63 and SLUG in MCF7 cells, and examined
the effectsongrowth inMINDandFP. Ectopic expressionof either
proteinwascompatiblewithFPgrowth,but ectopicSLUGexpres-
sion abrogated growth in MIND (Figure 6I). Next, we asked
whether inhibition of SLUG expression enables MCF7 cells to
grow in the FP without exogenous E2. Indeed, MCF7-shSLUG
cells survived and grew (Figure 6J), suggesting that SLUG abro-
gates luminal features required for in vivo growth. As SLUG is a
key effector of transforming growth factor b (TGFb)/SMAD3
signaling (Xue et al., 2014), we asked whether TGFb signaling is
activated in the MCF7-FP. MetaCore network analysis showed
that TGFb signaling is increased at the transcriptional level in
the MCF7-FP versus MCF7-MIND (Figure S5). Biochemically,
increased phosphorylation of specifically SMAD3, not SMAD2
(Figure 6K), was detected in MCF7-FP. Of interest, another
SMAD3-specific TGFb target gene SERPINE1 (Dennler et al.,
1998) was increased 24.9-fold in the FP (Table S4).
Physiological and Clinical Relevance of the IntraductalApproachOur findings that the FP microenvironment induces SLUG
expression in MCF7 cells, which inhibited their growth, raised
the question whether the difficulties experienced in establishing
ER+ PDXs are related to the engraftment site. To test this, we
obtained tumor tissue from ten patients with ER+ breast cancer,
seven no special type (NST) and three lobular, and one with a TN
breast cancer (Figure 7A). Single-cell suspensions were pre-
pared from tumor tissues, lentivirally transduced with GFP and
luciferase for subsequent tracing, and, depending on the number
of tumor cells obtained, injected into 6–23 glands of 2–11 mice.
All 11 tumors established xenografts (Figure 7A). In vivo tumor
growth followed a biphasic growth pattern with a decrease in
slope at around 10 weeks (Figure 7B). The ER+ tumors were fol-
lowed for up to 1 year in their recipients; the TN tumor cells grew
more rapidly and recipients had to be euthanized by 30 weeks
after injection. The presence of GFP-expressing human cancer
cells was confirmed 12–40 weeks after injection by fluores-
cence stereomicroscopy (Figure 7C) and subsequent whole
mounting, which revealed focally dilated milk ducts (Figure 7D).
Alu-ISH confirmed the identity of human cells (Figure 7E), and
H&E staining revealed thatMIND-PDXs sharemorphological fea-
tures of the patient tumors (Figure S6A). Most growth was in situ
but invasive areas were identified (Figure S6A). The MIND-PDXs
(B) PCA of global gene expression profiles of patient samples and of cells derived f
(C and D) KEGG (C) or REACTOME (D) pathway analyses performed on genes
15 groups based on p values are shown. Red line p value cutoff = 0.05, x axis �(E) Summary of differentially expressed receptors involved in mammary gland de
(F) ERa and red fluorescent protein (RFP) immunoblot of MCF7-FP and MCF7-M
(G) AR IHC on histological sections of MCF7-FP and MCF7-MIND. Scale bar, 50
See also Figure S4 and Tables S4, S5, S6, and S7.
resembled the patient tumors with regard to ER and PR status
(Figure S6B); the Ki67 index was frequently lower in the MIND-
PDXs (Figures 7F–7H), which may relate to the fact that it is
mostly established on in situ components in the PDXs whereas
clinically it is assessed on the invasive parts.
An unresolved paradox in breast cancer research is the obser-
vation that primary cells from normal breast epithelium are more
easily established in culture than are tumor cells (Hines et al.,
2015). To assess whether the MIND approach reflects the
biological properties of transformed and normal cells, we grafted
cells from reduction mammoplasties intraductally. All four pa-
tient samples established themselves and proliferated (Fig-
ure S6C), but grew at lower rates than the tumor cells (p <
0.05) and plateaued at levels that are 100-fold lower than those
reached by the tumor cells (Figure 7I). Individuals with mutations
in BRCA1 are at increased risk for breast cancer and have a
larger progenitor cell compartment (Lim et al., 2009; Molyneux
et al., 2010). Cells from three patients who hadBRCA1mutations
and underwent prophylactic mammectomy (Figure S6D) were
engrafted and showed a trend to grow faster than the cells
from control individuals (Figure 7I), further supporting the biolog-
ical relevance of the MIND-PDXs.
We followed engrafted animals for up to 13 months and
detected evidence of metastasis in all ten ER+ and the TN
MIND-PDXs, but not BRCA1 nor normal cell grafts (Figure 7J).
As observed in breast cancer patients, ER+ PDXs frequently
metastasized to brain (7 of 17) and bone (12 of 17), but rarely
to liver or lungs (1 of 17) (Figure 7J).
Toward Personalized Clinical ModelsPersonalized medicine requires that cancer cells from individual
patients be tested for response to therapy. Hence, we treated
mice engrafted with TN PDX with doxorubicin and cyclophos-
phamide for 4 weeks similarly to patients, who receive four
cycles of this combined chemotherapy. Tumor growth was
inhibited (Figure 8A) and tumor shrinkage was evident upon
stereoscopic inspection of the engrafted glands (Figure 8B).
The GFP-labeled tumor cells were readily detected in dis-
tended ducts of the control mice, but fluorescence was sparse
in the treated animals (Figure 8B). Postmortem radiance
showed metastases in brain and bones of control but not of
treated animals (Figure 8C). Mice bearing five different ER+
PDX-MINDs received endocrine therapy with fulvestrant for at
least 4 weeks. Tumor growth decreased in four cases; only a
lobular carcinoma with ERBB2 amplification, a genetic alter-
ation associated with resistance to endocrine therapy, did not
respond (Figure 8D). Thus, PDX-MINDs respond to therapy
just as in the clinics.
All five ER+ PDXs tested re-engrafted with an average 91%
success rate, superior to the initial 76% (Figure S7A). Thus,
ER+ tumors, including lobular carcinomas, can readily be
rom indicated xenografts. Color-coded letters indicate breast cancer subtypes.
upregulated in MCF7-FP (upper panel) and MCF7-MIND (lower panel). Top
log10 of the p value. Pathways that are altered shown in blue, p < 0.05.
velopment. Fold change (FC) reflects gene expression of MIND/FP.
IND xenografts.
mm.
Cancer Cell 29, 1–16, March 14, 2016 ª2016 Elsevier Inc. 9

MCF7-FP, E2MCF7-MIND
Fol
d ch
ange
rad
ianc
e
0 20 40 600.1
1
10
100
1000controlSLUG
p=0.74
0 10 20 30 400.1
1
10
100
Days post injection
Days post injection
0 20 40 600.01
0.1
1
HG
10
100controlSLUG
0 10 20 300.1
1
10
100
p< 0.0001
0 10 20 300.1
1
10
100
0 10 20 300.1
1
10
100scramblesh SLUG
ARESR1
0 1 20 0 1 200
5
10
FE
Rel
.mR
NA
expr
essi
on
Rel
.mR
NA
expr
essi
on
Days post injection Days post injection
SNAI2 TP63 KRT6A KRT14 VIM CDH2
0 1 20 0 1 20 0 1 20 0 1 20 0 1 20 0 1 200.0
0.5
1.0
1.5
Run
ning
Enr
ichm
ent
Sco
re (
RE
S)
A B
α-Caveolin-1
α-RFP
α-p63
α-RFP
α-ITGA6
α-RFP
C
p63
DAPI
MCF7-FP MCF7-MIND FP MIND D
Fol
d ch
ange
rad
ianc
e
MCF7-FP, no E2MCF7-FP, E2
I
ER
DAPI
merge
day 1 day 4 day 8 day 20
I II III I II III I II III I II III0
20406080
100
ER
sco
re (
%)
J
p< 0.02
α-pSMAD3
FP MIND 2D
α-RFP
MGα-pSMAD2
K
MIND FP012345
Rel
ativ
e le
vels
control
ΔNp63control
ΔNp63
scramblesh SLUG
0 20 40 600.1
1
10
100
controlshSLUG
MCF7-MIND
α-SLUG
α-Vimentin
α-Annexin A1
α-RFP
FP MCF10AMIND MCF7
in vivo in vitro
20 μg80 μg
α-LaminB1
day 1 day 4 day 8 day 20
Figure 6. MicroenvironmentAffectsLuminal
Breast Cancer Cells through SLUG
(A) Gene set enrichment analysis showing over-
representation of EMT category among genes
differentially expressed between MCF7-FP
and -MIND. High values on the left part of the
red line show the enrichment with genes over-
expressed in the FP (total number of genes
17,067). FDR shows the corrected p value
(q value) adjusted for gene set size. NES denotes
normalized enrichment score. Empirical null
distribution of enrichment score calculated by
randomly shuffling sample labels 1,000 times.
(B) Immunoblot of proteins encoded by selected
differentially expressed genes from MCF7-MIND,
MCF7-FP, and MCF7 and MCF10A growing in 2D
in vitro. ForMCF10A, 4-fold less protein lysatewas
loaded.
(C) Immunoblot analyses of selected proteins from
MCF7-FP and MCF7-MIND.
(D) p63 IF of MCF7-MIND and MCF7-FP 1 month
after injection counterstained with DAPI. Scale
bars, 50 mm.
(E) Bar plot showing relative ESR1 and AR mRNA
expression normalized to TBP1 mRNA in FACS-
sorted MCF7-FP cells at different times after
intraductal injection.
(F) Bar plot showing relative mRNA expression of
various basal markers normalized to TBP1 mRNA
in FACS-sorted MCF7-FP cells at different times
after intraductal injection.
(G) IF micrographs of mammary glands engrafted
with FACS-sorted MCF7-FP cells at different
times after injection. Dashed outlines highlight
perimeter of cross-sectioned milk duct. Scale bar,
100 mm.
(H) Quantification of ER positivity based on signal
intensity.
(I) Graphs showing bioluminescence of MCF7-FP
or -MIND xenografts stably expressing luc2 and
either GFP only or GFP together with DNp63 or
SLUG after contralateral injection.
(J) Graph showing bioluminescence signal of
xenografts of MCF7-FP and MCF7-MIND stably
expressing luc2 and either GFP scramble or
GFP shSLUG. MCF7-FP was tested both in the
presence (E2) and absence (no E2) of exogenous
E2. Graphs in (I) and (J) show means ± SEM.
Statistical significance was determined by Mann-
Whitney U test.
(K) Immunoblot analysis of pSMAD2 and
pSMAD3 in control mousemammary glands (MG),
MCF7-FP, MCF7-MIND, and MCF7 cells growing
in 2D; RFP loading control and quantification of the
pSMAD3 level. Data in bar plots are shown as
means ± SD.
See also Figure S5.
Please cite this article in press as: Sflomos et al., A Preclinical Model for ERa-Positive Breast Cancer Points to the Epithelial Microenvironment asDeterminant of Luminal Phenotype and Hormone Response, Cancer Cell (2016), http://dx.doi.org/10.1016/j.ccell.2016.02.002
established asMIND. The TNPDX reached transplant generation
10 within 2 years (Figure S7B).
To assess whether tumor cells preserve their genomic char-
acteristics when they grow as PDX-MIND, we sequenced 52
commonly mutated cancer genes (Table S8) using DNA isolated
from ten paraffin-embedded tumors and respective PDXs. Anal-
10 Cancer Cell 29, 1–16, March 14, 2016 ª2016 Elsevier Inc.
ysis of MCF7- and MDAMB453-MINDs revealed the expected
PIK3CA E545K and PIK3CA H1047R mutations and TP53
P33R polymorphism (Figure 8E). Mutations and/or polymor-
phisms in patient samples were frequent in TP53 (100%),
PIK3CA (80%), and KDR (20%); individual tumors had EGFR,
FGFR2, SMAD4, KRAS, ATM, AKT1, and SMARCB1 mutations.

PDX 3
PR ER
Alu-ISH
B
C
D
F G
PDX 8
1
10
100
1000
Weeks after initial detection
1
10
1000
100
0 10 30 20 40 50 0 10 3020
PDX 4, NST
Ki67
PDX 7, lobular
40 50 60
Weeks after initial detection
Time post injection (weeks)
TN, 1 patient
NST, 6 patients
lobular, 3 patients
BRCA1, 3 patients
normal, 4 patients
10
100
1000
10000
10 20 30 40 50 60
Fol
d ch
ange
rad
ianc
e
I J
Fol
d ch
ange
rad
ianc
e
A
subtype
1 65 NST 3 pT2pN1a Luminal B 38
2 51 NST 2 pT2pN1a Luminal B 68
3 53 NST 1 pT2pN1a Luminal A 83
4 58 NST 2 pT1cpN1a Luminal B 90
5 87 NST 2 pT1cpN0 Luminal A 17
6 75 lobular 2 pT2pN3 Luminal A 100
7 69 lobular 3 pT2pN0 Luminal B 100
8 31 NST 3 pT2pN1mi Luminal B 78
9 78 lobular 2 pT1cpN0 Luminal A 87
10 39 medullary 3 pT2pN0 Basal-like 87
11 39 NST 2 pT1cpN0 Luminal B 70
patient agetumor type grade pTNM
engraftment rate (%)
H
ER PR Ki670
1
2
3
MIN
D/p
rimar
y tu
mor
mean individual gland
mean individual gland
Alu-ISH
H & E
1 100 0 90 95 0 30
2 100 10 25 90 0-100 5
3 100 90 17 100 95 5
4 100 5 29 100 12 35
5 95 30 20 100 28 30
6 100 100 16 92 25 5
7 100 0 26 75 0 2
8 100 60 80 90 40 60
9 100 80 10 95 40 1
10 0 0 >90 0 0 98
PDX-MINDPatient tumor
patient ER PR Ki67 ER PR Ki67
ER PR HER2 bones brain lungs liver
1 pos. neg. neg. 60 0/2 1/2 0/2 0/2
2 pos. pos. neg. 60 1/2 2/2 0/2 0/2
3 pos. pos. neg. 50 1/2 1/2 0/2 0/2
4 pos. pos. neg. 45 2/2 1/2 0/2 0/2
6 pos. pos. neg. 40 3/3 0/3 0/3 1/3
7 pos. neg. pos. 60 2/2 1/2 0/2 0/2
8 pos. pos. neg. 15 1/2 0/2 0/2 0/2
8 pos. pos. neg. 30 0/1 1/1 1/1 0/1
9 pos. pos. neg. 24 1/1 0/1 0/1 0/1
10 neg. neg. neg. 10 3/6 1/6 2/6 1/6
10 neg. neg. neg. 30 1/6 0/6 2/6 0/6
organs positive by IVISpatient
tumor characteristics time in mice (weeks)
PDX 3
PDX 4
ED
Figure 7. ER+ MIND-PDXs
(A) Summary of the characteristics of patient tumors and the MINDs derived from them.
(B) Graphs showing the radiance of PDX-MINDs, no specific type (NST) or lobular, in individual glands (black) and mean thereof ± SEM (red).
(legend continued on next page)
Cancer Cell 29, 1–16, March 14, 2016 ª2016 Elsevier Inc. 11
Please cite this article in press as: Sflomos et al., A Preclinical Model for ERa-Positive Breast Cancer Points to the Epithelial Microenvironment asDeterminant of Luminal Phenotype and Hormone Response, Cancer Cell (2016), http://dx.doi.org/10.1016/j.ccell.2016.02.002

Please cite this article in press as: Sflomos et al., A Preclinical Model for ERa-Positive Breast Cancer Points to the Epithelial Microenvironment asDeterminant of Luminal Phenotype and Hormone Response, Cancer Cell (2016), http://dx.doi.org/10.1016/j.ccell.2016.02.002
The results were concordant in all ten pairs. Only threemutations
present in tumor samples at low allele frequencies (SMAD4,
SMARCB1, and PIK3CA) were not detected in the respective
PDXs, suggesting dilution or loss of tumor subpopulations
upon grafting. No de novo mutations were detected in any of
the PDXs. Thus, PDX-MINDs do not acquire additional mutations
in critical cancer genes and appear genomically stable.
DISCUSSION
The MIND approach addresses a long-standing need for better
preclinical models of ER+ breast cancer, and shows that the
intraductal microenvironment enables ER+ breast cancer cells
to grow in vivo and to recapitulate the human disease. It offers
several advantages over existing preclinical models. First, the
proliferative indices are relatively low, with 23%–35% Ki67 for
ER+ cell lines. Second, tumors grow with systemic E2 levels of
10–60 pg/ml, comparable with those of postmenopausal women
(<59 pg/ml) in whom most ER+ breast cancers occur, so that
mechanisms of endocrine resistance can now be studied in the
context of appropriate E2 levels (Yue et al., 1994). Furthermore,
it obviates the deleterious effects of excess E2, such as urinary
retention, cystitis, hydronephrosis, and renal failure, which
limited the utility of traditional xenografts (Gakhar et al., 2009;
Levin-Allerhand et al., 2003; Pearse et al., 2009). The clinical rele-
vance of the MCF7-MIND model is reflected at the molecular
level in gene expression signatures similar to those of clinical
samples. It remains to be tested whether the utility of the model
extends to other hormone-responsive cancers, such as ovarian
and thyroid carcinomas, and to selectively established adeno-
matous versus squamous lung carcinomas.
A potential drawback of MCF7-MIND as a preclinical model is
the required immune suppression. The immune system is impor-
tant in tumorigenesis (de Visser et al., 2006) and may affect
the outcome of therapy. Its impact may differ between tumor
subtypes, and its role in the luminal cancers is poorly defined
(Kroemer et al., 2015). Future studies should extend the MIND
model to mice with a humanized immune system (Kalscheuer
et al., 2012).
The model offers opportunities to study breast cancer pro-
gression. The critical transition from in situ to invasive disease
and spontaneous metastasis to relevant sites are now amenable
to mechanistic studies when previous work relied on injection
of a large number of tumor cells into the circulation or specific
organ sites (Minn et al., 2005; Wang et al., 2015).
(C) Fluorescence stereo micrographs of inguinal mammary gland 20 weeks after
engrafted mammary gland. Scale bar, 3 mm.
(D) Stereo micrographs of whole-mounted mammary glands 20 weeks after injec
(E) Overview and blow-up of adjacent sections stained by H&E and Alu-ISH from P
of the engrafted mammary gland. Scale bars, 2 mm and 50 mm.
(F) Alu-ISH and Ki67-, ER-, and PR-IHC on histological sections of MIND derived
(G) Summary of ER, PR, and Ki67 status in patient tumors and corresponding PD
(H) Box plot showing range of ratios of ER, PR, and Ki67 expression. For patien
presented the value of 0 for % PR+ or ER+ cells. Horizontal lines outside the bo
represent lower and upper quartiles, and line inside the box identifies the median
(I) Mean radiance of MIND-PDXs of different tumor types or breast epithelial cel
means ± SEM of measurements performed on multiple samples.
(J) Summary of the metastatic spread in clinical relevant organs measured by ex
See also Figure S6.
12 Cancer Cell 29, 1–16, March 14, 2016 ª2016 Elsevier Inc.
The distinct microenvironments dramatically alter gene
expression in luminal tumor cells. The stroma bestows EMT-
like changes on MCF7 cells and induces a basal differentiation
program with high-level expression of SLUG. The intraductal
microenvironment induces expression of ER and other hormone
and growth factor receptors important in mammary gland devel-
opment. It will be interesting to determine whether the observa-
tion that the hippo and the CXCR4/7 CXCL12 pathways, which
are enriched in MCF7-MIND, is generalizable and functionally
relevant to the metastatic behavior of the tumor cells. The genes
modulated by fulvestrant show little overlap with established
in vitro targets (Patani et al., 2014), but treatment duration and
analytical platform differed. Of interest, we noticed that some
genes among the 800 most differentially expressed genes,
such as calpain 8 (CAPN8), heparanase (HPSE), and sphingo-
myelin phosphodiesterase 3 (SMPD3), were identified as in vivo
E2 targets in the bovine breast with roles in ECM turnover and
signaling (Li et al., 2006).
The finding that ER+ PDXs grow readily in the mouse milk
ducts suggests that the differences in hormone levels, the lack
of human stroma, and human specific paracrine factors previ-
ously held responsible for the low engraftment rates are not so
important (Rong et al., 1992; Utama et al., 2006). As some of
the tumors proliferate less as PDX-MIND, we cannot exclude
that some of the above factorsmay be important for these partic-
ular tumors. However, the observation that MIND tumors show
two distinct growth rates point to the possibility that the differ-
ences in cell proliferation relate to the time of analysis. The
ease with which primary tumor cells can now be grown in vivo
opens exciting perspectives for translational research and
personalized breast cancer therapy.
EXPERIMENTAL PROCEDURES
The details of cell culture, immunofluorescence, immunoblotting, qRT-PCR,
and Alu-FISH are included in Supplemental Experimental Procedures.
Clinical Samples
The Commission cantonale d’ethique de la recherche sur l’etre humain
approved the studies (45-05 and 72-04), and informed consent was obtained
from all subjects. Normal breast tissue was obtained from women undergoing
reduction mammoplasties with no previous history of breast cancer, as
described by Tanos et al. (2013), and freshly resected tumor material of
pinhead size was obtained from the pathologist. Human tissue was mechani-
cally dissociated, digested overnight at 37�C with 10 mg/ml collagenase A
(11088793001; Roche) in DMEM/F-12 (11039-021; Gibco) supplemented
with 1% penicillin-streptomycin (15070-063; Thermo Fisher Scientific) and
injection of PDXs (patients 3 and 8). Dashed outlines highlight perimeter of the
tion of primary cancer cells from patients 3 and 4. Scale bars, 2 mm.
DX-MIND derived from tumor in patient 1. Dashed outlines highlight perimeter
from the tumor in patient 4. Scale bar, 50 mm.
X-MINDs.
ts 1, 7, and 10, the ratios were corrected to 1 when patient tumor and PDX
x depict minimum and maximum values, upper and lower borders of the box
.
ls derived from normal donors or BRCA1 mutation carriers. Curves represent
vivo luminescence at indicated times after PDX-MIND engraftment.

A
Trea
ted
Con
trol
1 2 3 4 5 6 7 8 9 10
B C
Fol
d ch
ange
rad
i anc
e
1
10
100
1000
10000
Time post injection (weeks)
4 cycles of doxorubicine and cyclophosphamide
D
controltreated
Patient 7, lobular HER2 Patient 11, NST Patient 9, lobular Patient 8, NST Patient 6, lobular
Days of treatment
0 10 20 30 40
1
10
0 10 20 30 40
1
10
0 10 20 30 40
1
10
0 10 20 30 40
1
10
100
0 10 20 30 40
1
10
Fol
d ch
ange
rad
ianc
e
Trea
ted
Con
trol
+
p<0.01 p=0.4 p<0.01 p<0.01 p<0.05
fulvestrantcontrol
lungs liver stomach bone
brain
brain
bone lungs liver stomach
E
p.E545K c.G1633A exon10 35.19%MCF7
No. Patient-PDXs ID Gene Chr AA variant Substitution Position AlleleFreq
PIK3CA 3 p.Q546R c.A1637G exon10 **TP53 17 p.P33R c.C98G exon3 76.57%
PIK3CA 3 p.Q546R c.A1637G exon10 17%
TP53 17 p.P33R c.C98G exon3 65.77%
PIK3CA 3 p.N107S c.A320G exon2 33.24%PIK3CA 3 p.E545K c.G1633A exon10 18.15%KDR 4 p.Q472H c.A1416T exon11 54.65%TP53 17 p.P33R c.C98G exon3 42.25%SMARCB1 22 p.W385X c.G1154A exon9 5.37%
PIK3CA 3 p.N107S c.A320G exon2 47%PIK3CA 3 p.E545K c.G1633A exon10 19.77%KDR 4 p.Q472H c.A1416T exon11 53.48%TP53 17 p.P33R c.C98G exon3 **PIK3CA 3 p.N1044K c.T3132A exon21 22.82%ATM 11 p.P604S c.C1810T exon12 45.39%TP53 17 p.P33R c.C98G exon3 98.34%
PIK3CA 3 p.N1044K c.T3132A exon21 17.04%ATM 11 p.P604S c.C1810T exon12 39.56%TP53 17 p.P33R c.C98G exon3 97.68%
PIK3CA 3 p.I391M c.A1173G exon7 7.6%TP53 17 p.P87fs c.259_265del exon2 57.03%TP53 17 p.P33R c.C98G exon3 90.71%
PIK3CA 3 p.I391M c.A1173G exon7 **TP53 17 p.P87fs c.259_265del exon2 99.51%TP53 17 p.P33R c.C98G exon3 85.84%
AKT1 14 p.D46E c.C138A exon3 88.4%TP53 17 p.P33R c.C98G exon3 97.71%
AKT1 14 p.D46E c.C138A exon3 99.54%TP53 17 p.P33R c.C98G exon3 97.29%
6T7
PDX-MIND 7
7
T8
PDX-MIND 8
10T11
9
T10
PDX-MIND 10
8
T9
PDX-MIND 9
PDX-MIND 11
No. Patient-PDXs ID Gene Chr AA variant Substitution Position AlleleFreq
PIK3CA 3 p.I391M c.A1173G exon3 32.43%TP53 17 p.P33R c.C98G exon3 87.7%
PIK3CA 3 p.I391M c.A1173G exon3 23.24%TP53 17 p.P33R c.C98G exon3 89.05%
EGFR 7 p.S123T c.C368T exon3 17.05%TP53 17 p.P33R c.C98G exon3 95.45%
EGFR 7 p.S123T c.C368T exon3 20.01%TP53 17 p.P33R c.C98G exon3 96.78%
PIK3CA 3 p.E545K c.G1633A exon10 21.2%FGFR2 10 p.N437K c.T1311A exon9 22.83%TP53 17 p.P33R c.C98G exon3 67.36%
PIK3CA 3 p.E545K c.G1633A exon10 46.83%FGFR2 10 p.N437K c.T1311A exon9 49.12%TP53 17 p.P33R c.C98G exon3 62.18%
PIK3CA 3 p.Q546K c.C1636A exon10 26.42%PIK3CA 3 p.N1044K c.T3132A exon21 24.78%TP53 17 p.P33R c.C98G exon3 86.4%SMAD4 18 p.R361C c.C1081T exon9 16.5%
PIK3CA 3 p.Q546K c.C1636A exon10 48.59%TP53 17 p.P33R c.C98G exon3 90.82%
PIK3CA 3 p.H1047R c.A3140G exon21 24.25%KIT 4 p.V473M c.G1417A exon9 6.94%KDR 4 p.Q472H c.A1416T exon11 37.47%KRAS 12 p.G12V c.G35T exon2 27.71%TP53 17 p.P33R c.C98G exon3 80.06%
PIK3CA 3 p.H1047R c.A3140G exon21 1.43%KIT 4 p.V473M c.G1417A exon9 **KDR 4 p.Q472H c.A1416T exon11 50.55%KRAS 12 p.G12V c.G35T exon2 4.37%TP53 17 p.P33R c.C98G exon3 66.67%
1T1
PDX-MIND 1
2T2
PDX-MIND 2
5
T6
PDX-MIND 6
3
T3
PDX-MIND 3
4T4
PDX-MIND 4
p.H1047R c.A3140G exon21 62.28%
TP53 17 p.P33R c.C98G exon3 98.56%MDAMB453
PIK3CAPIK3CA
33
Figure 8. Clinical Relevance of MIND-PDXs
(A) Bioluminescence of TN PDX-MIND from patient 10 treated with doxorubicin and cyclophosphamide for 4 weeks (gray area) and control. Each black and red
line represents one gland. Blue and purple lines represent the mean ± SEM of control and treated glands, respectively (n R 3).
(legend continued on next page)
Cancer Cell 29, 1–16, March 14, 2016 ª2016 Elsevier Inc. 13
Please cite this article in press as: Sflomos et al., A Preclinical Model for ERa-Positive Breast Cancer Points to the Epithelial Microenvironment asDeterminant of Luminal Phenotype and Hormone Response, Cancer Cell (2016), http://dx.doi.org/10.1016/j.ccell.2016.02.002

Please cite this article in press as: Sflomos et al., A Preclinical Model for ERa-Positive Breast Cancer Points to the Epithelial Microenvironment asDeterminant of Luminal Phenotype and Hormone Response, Cancer Cell (2016), http://dx.doi.org/10.1016/j.ccell.2016.02.002
1% fungizone (cat. #15290-018; Thermo Fisher) in continuous agitation
(40 rpm) as described by Sflomos et al. (2015). Samples were rinsed and eryth-
rocytes lysed with Red Blood Cell Lysis Buffer (R7757; Sigma) and dissociated
to single cells with 0.25%Gibco Trypsin-EDTA (15400-054; Thermo Fisher) for
2 min. Trypsin was inactivated with PBS/2% calf serum (CS) followed by incu-
bation with 5 mg/ml DNase (1284932; Roche) in L-15medium (11415; Gibco) at
37�C for 2 min. 2%CS in PBS was added, and the cells were filtered through a
70-mm pore size filter (cat. #352350; BD Falcon) and counted. Primary tumor
cells were transduced with bifunctional reporter fusion gene ffLuc2/EGFP
lentivirus (GFP-luc2) under control of the cytomegalovirus promoter. Lentiviral
spin infection was performed at 25�C for 2.5 hr at 2,500 rpm as described by
Yalcin-Ozuysal et al. (2010).
Animal Experiments
Animal experiments were performed in accordance with protocols approved
by the Service de la Consommation et des Affaires Veterinaires of Canton
de Vaud. SCID/beige and NOD.Cg-Prkdcscid Il2rgtm1Wjl/SzJ mice (NSG) were
purchased from Charles River and Jackson Laboratories, respectively. Mice
were anesthetized by intraperitoneal injection with 10 mg/kg xylazine and
90 mg/kg ketamine (Graeub). Intraductal injections of single-cell suspensions
were performed as described by Behbod et al. (2009) but without surgically
opening the mouse. Engrafted mammary glands were harvested 4–32 weeks
after intraductal injections and 2–6 weeks after FP injections, fixed in 4% para-
formaldehyde for IHC or snap-frozen for RNA and protein isolation. Mammary
gland whole mounts were prepared as described by Ayyanan et al. (2011).
Stereomicrographs were acquired with an M205 FA (Leica).
ACCESSION NUMBERS
The Gene Expression Omnibus accession numbers for the transcriptomics
data reported in this study are GEO: GSE68694 and GSE74608.
SUPPLEMENTAL INFORMATION
Supplemental Information includes Supplemental Experimental Procedures,
seven figures, and eight tables and can be found with this article online at
http://dx.doi.org/10.1016/j.ccell.2016.02.002.
AUTHOR CONTRIBUTIONS
Conceptualization, G.S., M.F., C.B.; Formal Analysis, T.M., R. J., J.V.; Investi-
gation, G.S., V.D., A.A., V.S., L.B.; Resources, W.R., J.D., A.T., M.F., Writing,
G.S., C.B; Funding Acquisition, C.B.
ACKNOWLEDGMENTS
We thank E. Anderson and J. Rougemont for advice, M. Wirth, J. Dessimoz,
O. Burri, S. Leuba, and the EPFL core facilities for technical assistance,
B. Bisig and E. Missiaglia for the mutation analysis, S. Cagnet and V. Simanis
for reading of the manuscript, D. Lepori for the mammography, R. de Hoogt, S.
Vidic (Janssen Pharmaceuticals, Beerse, Belgium), W. van Weerden (Erasmus
University, Rotterdam) and S.A. Mani (M.D. Anderson, Houston) for lentiviral
vectors, and E. Hill (AstraZeneca Pharmaceuticals) for providing fulvestrant
(ICI 182780). Microarray and RNA-sequencing data were generated and
analyzed at the Genomic Technologies Facility of the University of Lausanne.
The research leading to these results has received support from the Innovative
Medicines Initiative Joint Undertaking (grant agreement no. 115188) for the
(B) Representative light (left) and epifluorescence stereoscopic (right) images of in
solvent. Scale bars, 1 cm (left) and 0.2 mm (right).
(C) Representative ex vivo luminescence images of indicated organs from engra
(D) Response to endocrine therapy in 5 ER+ PDXs measured by radiance at and a
and fulvestrant-treated glands. Statistical significance was determined by Mann
(E) Mutational repertoire of primary tumors and matched PDX as well as MCF
mutations are highlighted by green in the box on the right, whereas mutations det
that visual inspection of the sequence data identified mutations also in the PDX,
See also Figure S7 and Table S8.
14 Cancer Cell 29, 1–16, March 14, 2016 ª2016 Elsevier Inc.
PREDECT consortium (www.predect.eu) resources composed of financial
contributions from EU-FP7 and EFPIA companies in kind contribution. The
Web address of the Innovative Medicines Initiative is http://www.imi.europa.
eu/. V.D. and V.S. were supported by the Swiss Cancer Research foundation,
and R.J. and L.B. by the SNF.
Received: May 4, 2015
Revised: November 16, 2015
Accepted: February 8, 2016
Published: March 3, 2016
REFERENCES
Arrowsmith, J. (2011). Trial watch: phase III and submission failures: 2007-
2010. Nat. Rev. Drug Discov. 10, 87.
Ayyanan, A., Laribi, O., Schuepbach-Mallepell, S., Schrick, C., Gutierrez, M.,
Tanos, T., Lefebvre, G., Rougemont, J., Yalcin-Ozuysal, O., and Brisken, C.
(2011). Perinatal exposure to bisphenol A increases adult mammary gland
progesterone response and cell number. Mol. Endocrinol. 25, 1915–1923.
Bane, A. (2013). Ductal carcinoma in situ: what the pathologist needs to know
and why. Int. J. Breast Cancer 2013, 914053.
Behbod, F., Kittrell, F.S., LaMarca, H., Edwards, D., Kerbawy, S., Heestand,
J.C., Young, E., Mukhopadhyay, P., Yeh, H.W., Allred, D.C., et al. (2009). An
intraductal human-in-mouse transplantation model mimics the subtypes of
ductal carcinoma in situ. Breast Cancer Res. 11, R66.
Chan, S.R., Vermi, W., Luo, J., Lucini, L., Rickert, C., Fowler, A.M., Lonardi, S.,
Arthur, C., Young, L.J., Levy, D.E., et al. (2012). STAT1-deficient mice sponta-
neously develop estrogen receptor alpha-positive luminal mammary carci-
nomas. Breast Cancer Res. 14, R16.
Chow, J.D., Simpson, E.R., and Boon, W.C. (2009). Alternative 50-untranslatedfirst exons of the mouse Cyp19A1 (aromatase) gene. J. Steroid Biochem. Mol.
Biol. 115, 115–125.
Clinchy, B., Gazdar, A., Rabinovsky, R., Yefenof, E., Gordon, B., and Vitetta,
E.S. (2000). The growth and metastasis of human, HER-2/neu-overexpressing
tumor cell lines in male SCID mice. Breast Cancer Res. Treat. 61, 217–228.
Cottu, P., Marangoni, E., Assayag, F., de Cremoux, P., Vincent-Salomon, A.,
Guyader, C., de Plater, L., Elbaz, C., Karboul, N., Fontaine, J.J., et al. (2012).
Modeling of response to endocrine therapy in a panel of human luminal breast
cancer xenografts. Breast Cancer Res. Treat. 133, 595–606.
Cox, R.F., Hernandez-Santana, A., Ramdass, S., McMahon, G., Harmey, J.H.,
and Morgan, M.P. (2012). Microcalcifications in breast cancer: novel insights
into the molecular mechanism and functional consequence of mammary min-
eralisation. Br. J. Cancer 106, 525–537.
Creighton, C.J., Li, X., Landis, M., Dixon, J.M., Neumeister, V.M., Sjolund, A.,
Rimm, D.L., Wong, H., Rodriguez, A., Herschkowitz, J.I., et al. (2009). Residual
breast cancers after conventional therapy display mesenchymal as well as
tumor-initiating features. Proc. Natl. Acad. Sci. USA 106, 13820–13825.
de Graauw, M., van Miltenburg, M.H., Schmidt, M.K., Pont, C., Lalai, R.,
Kartopawiro, J., Pardali, E., Le Devedec, S.E., Smit, V.T., van der Wal, A.,
et al. (2010). Annexin A1 regulates TGF-beta signaling and promotes metas-
tasis formation of basal-like breast cancer cells. Proc. Natl. Acad. Sci. USA
107, 6340–6345.
de Visser, K.E., Eichten, A., and Coussens, L.M. (2006). Paradoxical roles of
the immune system during cancer development. Nat. Rev. Cancer 6, 24–37.
guinal mammary glands from xenografted mice treated with chemotherapy or
fted mice treated with chemotherapy or solvent. Scale bar, 1.5 cm.
fter the onset of fulvestrant treatment. Lines represent means ± SEM of control
-Whitney U test.
7- and MDAMB453-MINDs. For each patient’s tumor-PDX pair, concordant
ected only in patient tumors are highlighted by yellow. Double asterisks denote
as detailed in Supplemental Experimental Procedures.

Please cite this article in press as: Sflomos et al., A Preclinical Model for ERa-Positive Breast Cancer Points to the Epithelial Microenvironment asDeterminant of Luminal Phenotype and Hormone Response, Cancer Cell (2016), http://dx.doi.org/10.1016/j.ccell.2016.02.002
Dennler, S., Itoh, S., Vivien, D., ten Dijke, P., Huet, S., and Gauthier, J.M.
(1998). Direct binding of Smad3 and Smad4 to critical TGF beta-inducible el-
ements in the promoter of human plasminogen activator inhibitor-type 1 gene.
EMBO J. 17, 3091–3100.
DeRose, Y.S., Wang, G., Lin, Y.C., Bernard, P.S., Buys, S.S., Ebbert, M.T.,
Factor, R., Matsen, C., Milash, B.A., Nelson, E., et al. (2011). Tumor grafts
derived from women with breast cancer authentically reflect tumor pathology,
growth, metastasis and disease outcomes. Nat. Med. 17, 1514–1520.
Fiche, M., Avet-Loiseau, H., Maugard, C.M., Sagan, C., Heymann, M.F.,
Leblanc, M., Classe, J.M., Fumoleau, P., Dravet, F., Mahe, M., and
Dutrillaux, B. (2000). Gene amplifications detected by fluorescence in situ hy-
bridization in pure intraductal breast carcinomas: relation to morphology, cell
proliferation and expression of breast cancer-related genes. Int. J. Cancer 89,
403–410.
Gakhar, G.,Wight-Carter, M., Andrews, G., Olson, S., and Nguyen, T.A. (2009).
Hydronephrosis and urine retention in estrogen-implanted athymic nudemice.
Vet. Pathol. 46, 505–508.
Goodenough, D.A., and Paul, D.L. (2009). Gap junctions. Cold Spring Harb.
Perspect. Biol. 1, a002576.
Guedj, M., Marisa, L., de Reynies, A., Orsetti, B., Schiappa, R., Bibeau, F.,
MacGrogan, G., Lerebours, F., Finetti, P., Longy, M., et al. (2012). A refined
molecular taxonomy of breast cancer. Oncogene 31, 1196–1206.
Guiu, S., Wolfer, A., Jacot, W., Fumoleau, P., Romieu, G., Bonnetain, F., and
Fiche, M. (2014). Invasive lobular breast cancer and its variants: how special
are they for systemic therapy decisions? Crit. Rev. Oncol. Hematol. 92,
235–257.
Hait, W.N. (2010). Anticancer drug development: the grand challenges. Nat.
Rev. Drug Discov. 9, 253–254.
Hidalgo, M., Amant, F., Biankin, A.V., Budinska, E., Byrne, A.T., Caldas, C.,
Clarke, R.B., de Jong, S., Jonkers, J., Maelandsmo, G.M., et al. (2014).
Patient-derived xenograft models: an emerging platform for translational
cancer research. Cancer Discov. 4, 998–1013.
Hines, W.C., Yaswen, P., and Bissell, M.J. (2015). Modelling breast cancer
requires identification and correction of a critical cell lineage-dependent
transduction bias. Nat. Commun. 6, 6927.
Hofvind, S., Iversen, B.F., Eriksen, L., Styr, B.M., Kjellevold, K., and Kurz, K.D.
(2011). Mammographic morphology and distribution of calcifications in ductal
carcinoma in situ diagnosed in organized screening. Acta Radiol. 52, 481–487.
Howell, A., Robertson, J.F., Abram, P., Lichinitser, M.R., Elledge, R., Bajetta,
E., Watanabe, T., Morris, C., Webster, A., Dimery, I., and Osborne, C.K.
(2004). Comparison of fulvestrant versus tamoxifen for the treatment of
advanced breast cancer in postmenopausal women previously untreated
with endocrine therapy: a multinational, double-blind, randomized trial.
J. Clin. Oncol. 22, 1605–1613.
Janicke, R.U. (2009). MCF-7 breast carcinoma cells do not express caspase-
3. Breast Cancer Res. Treat. 117, 219–221.
Kalscheuer, H., Danzl, N., Onoe, T., Faust, T., Winchester, R., Goland, R.,
Greenberg, E., Spitzer, T.R., Savage, D.G., Tahara, H., et al. (2012). A model
for personalized in vivo analysis of human immune responsiveness. Sci.
Transl. Med. 4, 125ra130.
Kratz, A., Ferraro, M., Sluss, P.M., and Lewandrowski, K.B. (2004). Case
records of the Massachusetts General Hospital. Weekly clinicopathological
exercises. Laboratory reference values. N. Engl. J. Med. 351, 1548–1563.
Kroemer, G., Senovilla, L., Galluzzi, L., Andre, F., and Zitvogel, L. (2015).
Natural and therapy-induced immunosurveillance in breast cancer. Nat.
Med. 21, 1128–1138.
Lamar, J.M., Stern, P., Liu, H., Schindler, J.W., Jiang, Z.G., and Hynes, R.O.
(2012). The Hippo pathway target, YAP, promotes metastasis through its
TEAD-interaction domain. Proc. Natl. Acad. Sci. USA 109, E2441–E2450.
Lee, A.V., Oesterreich, S., and Davidson, N.E. (2015). MCF-7 cells—changing
the course of breast cancer research and care for 45 years. J. Natl. Cancer
Inst. 107, djv073.
Levin-Allerhand, J.A., Sokol, K., and Smith, J.D. (2003). Safe and effective
method for chronic 17beta-estradiol administration to mice. Contemp. Top.
Lab. Anim. Sci. 42, 33–35.
Li, R.W., Meyer, M.J., Van Tassell, C.P., Sonstegard, T.S., Connor, E.E., Van
Amburgh, M.E., Boisclair, Y.R., and Capuco, A.V. (2006). Identification of
estrogen-responsive genes in the parenchyma and fat pad of the bovine
mammary gland by microarray analysis. Physiol. Genomics 27, 42–53.
Lim, E., Vaillant, F., Wu, D., Forrest, N.C., Pal, B., Hart, A.H., Asselin-Labat,
M.L., Gyorki, D.E., Ward, T., Partanen, A., et al. (2009). Aberrant luminal
progenitors as the candidate target population for basal tumor development
in BRCA1 mutation carriers. Nat. Med. 15, 907–913.
Liu, T., Zhang, X., Shang, M., Zhang, Y., Xia, B., Niu, M., Liu, Y., and Pang, D.
(2013). Dysregulated expression of Slug, vimentin, and E-cadherin correlates
with poor clinical outcome in patients with basal-like breast cancer. J. Surg.
Oncol. 107, 188–194.
Logan, G.J., Dabbs, D.J., Lucas, P.C., Jankowitz, R.C., Brown, D.D., Clark,
B.Z., Oesterreich, S., and McAuliffe, P.F. (2015). Molecular drivers of lobular
carcinoma in situ. Breast Cancer Res. 17, 76.
Minn, A.J., Gupta, G.P., Siegel, P.M., Bos, P.D., Shu, W., Giri, D.D., Viale, A.,
Olshen, A.B., Gerald, W.L., and Massague, J. (2005). Genes that mediate
breast cancer metastasis to lung. Nature 436, 518–524.
Molyneux, G., Geyer, F.C., Magnay, F.A., McCarthy, A., Kendrick, H., Natrajan,
R., Mackay, A., Grigoriadis, A., Tutt, A., Ashworth, A., et al. (2010). BRCA1
basal-like breast cancers originate from luminal epithelial progenitors and
not from basal stem cells. Cell Stem Cell 7, 403–417.
Muller, A., Homey, B., Soto, H., Ge, N., Catron, D., Buchanan, M.E.,
McClanahan, T., Murphy, E., Yuan, W., Wagner, S.N., et al. (2001).
Involvement of chemokine receptors in breast cancer metastasis. Nature
410, 50–56.
Neve, R.M., Chin, K., Fridlyand, J., Yeh, J., Baehner, F.L., Fevr, T., Clark, L.,
Bayani, N., Coppe, J.P., Tong, F., et al. (2006). A collection of breast cancer
cell lines for the study of functionally distinct cancer subtypes. Cancer Cell
10, 515–527.
Ni, M., Chen, Y., Lim, E., Wimberly, H., Bailey, S.T., Imai, Y., Rimm, D.L., Liu,
X.S., and Brown, M. (2011). Targeting androgen receptor in estrogen receptor-
negative breast cancer. Cancer Cell 20, 119–131.
Osborne, C.K.,Wakeling, A., andNicholson, R.I. (2004). Fulvestrant: an oestro-
gen receptor antagonist with a novel mechanism of action. Br. J. Cancer 90
(Suppl 1 ), S2–S6.
Parker, J.S., Mullins, M., Cheang, M.C., Leung, S., Voduc, D., Vickery, T.,
Davies, S., Fauron, C., He, X., Hu, Z., et al. (2009). Supervised risk predictor
of breast cancer based on intrinsic subtypes. J. Clin. Oncol. 27, 1160–1167.
Patani, N., Dunbier, A.K., Anderson, H., Ghazoui, Z., Ribas, R., Anderson, E.,
Gao, Q., A’Hern, R., Mackay, A., Lindemann, J., et al. (2014). Differences in
the transcriptional response to fulvestrant and estrogen deprivation in ER-pos-
itive breast cancer. Clin. Cancer Res. 20, 3962–3973.
Pearse, G., Frith, J., Randall, K.J., and Klinowska, T. (2009). Urinary retention
and cystitis associated with subcutaneous estradiol pellets in female nude
mice. Toxicol. Pathol. 37, 227–234.
Perou, C.M., Jeffrey, S.S., van de Rijn, M., Rees, C.A., Eisen, M.B., Ross, D.T.,
Pergamenschikov, A., Williams, C.F., Zhu, S.X., Lee, J.C., et al. (1999).
Distinctive gene expression patterns in human mammary epithelial cells and
breast cancers. Proc. Natl. Acad. Sci. USA 96, 9212–9217.
Rong, S., Bodescot, M., Blair, D., Dunn, J., Nakamura, T., Mizuno, K., Park, M.,
Chan, A., Aaronson, S., and Vande Woude, G.F. (1992). Tumorigenicity of the
met proto-oncogene and the gene for hepatocyte growth factor. Mol. Cell Biol.
12, 5152–5158.
Schmid, C.W., and Deininger, P.L. (1975). Sequence organization of the
human genome. Cell 6, 345–358.
Sflomos, G., Shamsheddin, M., and Brisken, C. (2015). An ex vivo model to
study hormone action in the human breast. J. Vis. Exp. e52436.
Sgroi, D.C. (2010). Preinvasive breast cancer. Ann. Rev. Pathol. 5, 193–221.
Sikora, M.J., Cooper, K.L., Bahreini, A., Luthra, S., Wang, G., Chandran, U.R.,
Davidson, N.E., Dabbs, D.J., Welm, A.L., and Oesterreich, S. (2014). Invasive
Cancer Cell 29, 1–16, March 14, 2016 ª2016 Elsevier Inc. 15

Please cite this article in press as: Sflomos et al., A Preclinical Model for ERa-Positive Breast Cancer Points to the Epithelial Microenvironment asDeterminant of Luminal Phenotype and Hormone Response, Cancer Cell (2016), http://dx.doi.org/10.1016/j.ccell.2016.02.002
lobular carcinoma cell lines are characterized by unique estrogen-mediated
gene expression patterns and altered tamoxifen response. Cancer Res. 74,
1463–1474.
Tanos, T., Sflomos, G., Echeverria, P.C., Ayyanan, A., Gutierrez, M., Delaloye,
J.-F., Raffoul, W., Fiche, M., Dougall, W., Schneider, P., et al. (2013).
Progesterone/RANKL is a major regulatory axis in the human breast. Sci.
Transl. Med. 5, 182ra155.
Utama, F.E., LeBaron, M.J., Neilson, L.M., Sultan, A.S., Parlow, A.F., Wagner,
K.U., and Rui, H. (2006). Human prolactin receptors are insensitive to mouse
prolactin: implications for xenotransplant modeling of human breast cancer
in mice. J. Endocrinol. 188, 589–601.
Valdez, K.E., Fan, F., Smith, W., Allred, D.C., Medina, D., and Behbod, F.
(2011). Human primary ductal carcinoma in situ (DCIS) subtype-specific pa-
thology is preserved in a mouse intraductal (MIND) xenograft model.
J. Pathol. 225, 565–573.
Vargo-Gogola, T., and Rosen, J.M. (2007). Modelling breast cancer: one size
does not fit all. Nat. Rev. Cancer 7, 659–672.
Volk-Draper, L.D., Rajput, S., Hall, K.L., Wilber, A., and Ran, S. (2012). Novel
model for basaloid triple-negative breast cancer: behavior in vivo and
response to therapy. Neoplasia 14, 926–942.
16 Cancer Cell 29, 1–16, March 14, 2016 ª2016 Elsevier Inc.
Wang, H., Yu, C., Gao, X., Welte, T., Muscarella, A.M., Tian, L., Zhao, H., Zhao,
Z., Du, S., Tao, J., et al. (2015). The osteogenic niche promotes early-stage
bone colonization of disseminated breast cancer cells. Cancer Cell 27,
193–210.
Weinberg, R. (2011). Robert Weinberg. Nat. Biotech. 29, 192.
Xue, J., Lin, X., Chiu, W.T., Chen, Y.H., Yu, G., Liu, M., Feng, X.H., Sawaya, R.,
Medema, R.H., Hung, M.C., and Huang, S. (2014). Sustained activation of
SMAD3/SMAD4 by FOXM1 promotes TGF-beta-dependent cancer metas-
tasis. J. Clin. Invest. 124, 564–579.
Yalcin-Ozuysal, O., Fiche, M., Guitierrez, M., Wagner, K.U., Raffoul, W., and
Brisken, C. (2010). Antagonistic roles of Notch and p63 in controllingmammary
epithelial cell fates. Cell Death Differ. 17, 1600–1619.
Yue, W., Zhou, D., Chen, S., and Brodie, A. (1994). A new nude mouse model
for postmenopausal breast cancer using MCF-7 cells transfected with the
human aromatase gene. Cancer Res. 54, 5092–5095.
Zhang, X., Claerhout, S., Prat, A., Dobrolecki, L.E., Petrovic, I., Lai, Q., Landis,
M.D., Wiechmann, L., Schiff, R., Giuliano, M., et al. (2013). A renewable tissue
resource of phenotypically stable, biologically and ethnically diverse, patient-
derived human breast cancer xenograft models. Cancer Res. 73, 4885–4897.

Cancer Cell, Volume 29
Supplemental Information
A Preclinical Model for ERa-Positive Breast Cancer
Points to the Epithelial Microenvironment as
Determinant of Luminal Phenotype andHormoneResponse
George Sflomos, Valerian Dormoy, Tauno Metsalu, Rachel Jeitziner, LauraBattista, Valentina Scabia, Wassim Raffoul, Jean-Francois Delaloye, AssyaTreboux, Maryse Fiche, Jaak Vilo, Ayyakkannu Ayyanan, and Cathrin Brisken

Supplemental Data
Table S1. Related to Figure 1. Characteristics of the breast cancer cell lines used.
Cell line ER PR HER2 EGFR AR VDR Source Age Intrinsic Subtype ATCC type
MCF7 + + - - - - Pleural effusion 69 Luminal Adeno
carcinoma
BT474 + + + - + + Primary tumor 60 Luminal Ductal
carcinoma
T47D + ++ - - + + Pleural effusion 54 Luminal Ductal
carcinoma
BT20 - - - amplif. - + Primary tumor 74 Basal-like (A)1 Carcinoma
HCC1428 + + - - + - Pleural effusion 49 Luminal Adeno
carcinoma
HCC1806 - - - - - - Primary tumor 60 Basal-like (B)
Acantholytic squamous carcinoma
MDAMB231 - - - - - - Pleural effusion 51 Basal-like (B) Adeno
carcinoma
MDAMB453 - - + - + + Pericardial effusion 48 Luminal Metastatic
carcinoma
SUM225 - - + - - - Chest wall recurrence
of DCIS - Luminal -
ZR751 + - - - + + Ascites fluid 63 Luminal
Ductal Carcinoma
MDAMB134VI + - - - - - Pleural
effusion 47 Luminal Ductal
carcinoma
MDAMB415 + - - - - - Pleural effusion 38 Luminal
Adeno Carcinoma
HCC38 - - - - - - Primary tumor 50 Basal-like (B) Ductal
Carcinoma
1The basal-like A subtype resemble more the basal-like primary tumor subtype whereas the basal-like B subtype exhibits a stem-cell like gene expression profile (Kao et al., 2009; Neve et al., 2006).

A
D
02468
10
4 6 8 12days post injection
phot
on fl
ux (l
og 1
0)
ZR751
0 10 20 30 40 500.1
1
10
100
days post injection0 10 20 30
0.1
1
10
100
0 10 20 30 40 500.01
0.1
1
10
100
MDAMB453HCC1428
Fold
cha
nge
radi
ance
B
0 20 40 60 800.1
1
10
100
Fold
cha
nge
radi
ance
days post injection
MCF7 T47D BT474 BT20 HCC1806
E F
G
day 4 day 12C
Figure S1. Related to Figure 1. Characterization of breast cancer cell line-MINDs.
(A) Graphs showing mean radiance ± SEM of glands engrafted intraductally with HCC1428-, ZR751-, and MDAMB453-M (n 5). (B) Mean radiance ± SEM of glands engrafted intraductally with MDAMB134VI (n=6). (C) Representative mice engrafted with MDAMB231-MIND at 4 and 12 days after injection (n=15). (D) Graph showing mean radiance ± SEM of mice bearing MDAMB231-MIND (n=15). (E) Representative micrograph of mouse mammary gland section negative upon Alu-ISH staining, counterstain: fast red. Scale bar, 50 μm. (F) Micrograph of normal human breast tissue section (reduction mammoplasty specimen) positive by Alu-ISH as indicated by dark purple color. Scale bar, 50 μm. (G) Alu-ISH of cancer cell lines growing intraductally. From left to right: MCF7 cells (arrow) growing inside murine milk ducts, “empty” murine milk duct (arrowhead); T47D-MIND with micro invasive focus (arrow); BT474-MIND with in situ (bottom) and invasive component (top); invasive BT20 cells, at the pushing border a pseudo capsule has formed (arrows). HCC1806 cells growing intraductally with an invasive focus (arrow). Scale bars, 100 μm.

clea
ved
CK1
8D
API c
leav
ed C
K18
MCF7-MINDMCF7-FP
0
5
10
15
20
25
MCF7-FP MCF7-MINDclea
ved
CK1
8 in
dex
(%)
A B
BT474 BT20HCC1806
D
CER positiveTriple negative
Figure S2. Related to Figure 2. Apoptosis and microcalcifications in FP and MIND cell line xenografts. (A) Immunofluorescence for cleaved CK18 on MCF7-FP and MCF7-MIND 6 or 8 weeks after injection. Scale bars, 10 mm. (B) Bar plot showing percentage of cleaved CK18+ tumor cells in MCF7-FP and MCF7-MIND. Data are shown as means ± SD, p values by Student's t-test. (C) Mammographs of paraffin-embedded mouse mammary glands, white dotted lines mark the engrafted mammary glands. Micro calcifications are detected in BT474-MIND, not in the triple negative (TN) and rapidly invasive HCC1806-, BT20-MINDs. (D) Representative mCT image of mouse 8 months after intraductal injection with MCF7 cells. The white dotted line marks the engrafted mammary gland, arrows point to calcified areas in the blow-up.
p<0.001

B
D
A
C
0 10 20 30 40 50Lung Neoplasm
Endocrine System DiseaseEndocrine Gland Neoplasm
Neoplasm by SiteSkin and Connective Tissue Diseases
Skin DiseasesNeoplasms
Pathological ProcessesBreast Diseases
Breast Neoplasms
0 2 4 6 8 10Feeding and Neurohormone signaling
CadherinsIntegrin-mediated cell-matrix adhesion
Cell matrix interactionsBlood vessel morphogenesis
Attractive and repulsive receptorsRegulation of cytoskeleton rearrangement
NOTCH signalingRegulation of EMT
ESR1-nuclear pathway
-log (pValue)
0 2 4 6 8 10GF, WNT and cytoskeletal signaling
NF-AT signaling in cardiac hypetropyIGF family signaling in Colorectal Cancer
WNT Signaling pathwaySkin and Connective Tissue Diseases
Chemokines and AdhesionECM Remodelling
Ovarian Cancer (main signaling cascades)Regulation of EMT
Ligand-independent activation of AR in Prostate Cancer
Figure S3. Related to Figure 4. Bioinformatic analysis of fulvestrant-induced gene expression changes in MCF7-MIND. (A) KEGG analysis of ER signaling in MCF7-MIND cells treated with fulvestrant for 3 months, adjusted p value=2.7e-04. (B-D) Metacore analyses of genes altered by fulvestrant treatment, Biomarkers-Diseases (B) Maps (C) and Networks (D).

Table S2. Related to Figure 4. Gene expression in MCF7-MIND with and without fulvestrant
treatment. Provided as MS Excel File.
Table S3. Related to Figure 4. MCF7-MIND gene expression changes in response to
fulvestrant treatment. Provided as MS Excel File.

BT474
DAP
I E
RER
/DAP
I
DAP
I P
RMCF7 T47D
PR/D
API
A
F
BT474MCF T47D
PGR
PR e
xpre
ssio
n (A
U)
(nor
mal
ized
by α-
actin
)
ERα
expr
essi
on (A
U)
(nor
mal
ized
by α-
actin
)
α-ERα α-actin
α-PRα-actin
MCF7
T47D
BT474
MCF7
T47D
BT474
MDAMB231
020406080
100
020406080
100
0
20
40
60
80
100
MCF7 BT474 T47D
ER p
ositiv
e ce
lls (%
)
MCF7 BT474 T47D
PR p
ositiv
e ce
lls (%
)
D E
∗ ∗
∗
G
MCF
7BT
474
T47D
MIND
FP
020406080
100
MCF7 BT474 T47D
I
020406080
100
MCF7 BT474 T47D
MCF
7BT
474
T47D
MIND FP
020406080
100
MCF7 BT474 T47D
KJ
020406080
100
MCF7 BT474 T47D
MIND
FP
MIND
FP
100
0
20
40
60
80
ER p
ositiv
e ce
lls (%
)
H
B C 7
ER p
ositiv
e ce
lls (%
)ER
pos
itive
cells
(%)
PR p
ositiv
e ce
lls (%
)PR
pos
itive
cells
(%)
ESR1
57.6% 22.7% 19.7% 12.3%75.9% 11.7% 89.9% 5.3% 4.8%
FC > 1.5
0 250050007500
100001250015000
2000022500250002750030000
UC
Num
ber o
f pro
bese
ts
FP MIND UC FP MIND UC FP MIND
FC > 2no FC cutoff
17500
MDAMB231
MDAMB231
MDAMB231

Figure S4. Related to Figure 5. Global gene expression in MCF7-MIND and MCF7-FP and
hormone receptor expression in different experimental settings.
(A) Number of differentially expressed probe sets, based on fold change >1,5 or fold change >2.
UC: unchanged.
(B, C) Immunofluorescence for ER (C) and PR (D) (red) on MCF7, BT474, and T47D cells in vitro.
DAPI, nuclear counter stain (blue). Scale bars, 10 µm.
(D, E) Bar plots showing percentage of ER+ (D) and PR+ (E) cells in MCF7, BT474, and T47D
cells.
(F) Immunoblot analysis of ER and PR expression in protein lysates from the ER+ cell lines
MCF7, BT474 and T47D, and the triple negative cells MDAMB231 in vitro (2D) and bar plots
showing the relative protein quantity.
(G) Breast cancer cell lines analyzed for ESR1 and PGR transcripts expression using the GOBO
bioinformatics tool (Ringner et al., 2011).
(H) IHC for ER and of mammary glands bearing MCF7, BT474 and T47D-MIND two months after
MIND injections or mammary glands 4-6 weeks after FP injection. Scale bars, 50 µm.
(I) Bar plot showing percentage of ER+ cells in MCF7-, BT474-, and T47D-MIND versus -FP (J)
IHC for PR and of mammary glands bearing MCF7, BT474 and T47D-MIND two months after
MIND injections or mammary glands 4-6 weeks after FP injection. Scale bars, 50 µm.
(K) Bar plot showing percentage of PR+ cells in MCF7-, BT474-, and T47D-MIND versus -FP.
All the bar plots show data as means ± SD.
Table S4. Related to Figure 5. Differential gene expression in MCF7-MIND versus MCF7-FP.
Provided as MS Excel File
Table S5. Related to Figure 5. Global gene expression in basal-like breast cancer cell lines in
MIND versus FP. Provided as MS Excel File.
Table S6. Related to Figure 5. MCF7-MIND versus MCF7-FP: top 500 GO terms. Provided as
MS Excel File.
Table S7. Related to Figure 5. Differentially expressed receptors in MCF7-MIND versus MCF7-
FP. Provided as MS Excel File.

0 10 20 30 40JNK network
IGF network in colorectal cancerTGFβ networkEGFR network
Ras and Ros protein on G1/S transition Regulation of cytoskeleton proteins
Clathrin-coated vesicle cycleChemokines and adhesion
Cytoskeleton remodelingTGFβ, WNT and cytoskeletal remodeling
Maps (MetaCore)
-log (pValue)
Figure S5. Related to Figure 6. Differentially expressed signaling
networks in MCF7-MIND and MCF7-FP.
MetaCore Maps analysis of genes differentially expressed between MCF7-
MIND and MCF7-FP.

1 41 BRCA1 5 23 23 1002 33 BRCA1 5 18 14 783 44 BRCA1 5 24 23 96
patient age mutantnr of mice
nr of injected glands
nr of positive glands
take rate (%)
1 27 no 10 58 36 622 20 no 10 47 25 533 54 no 5 22 15 684 29 no 6 21 20 95
nr of mice
nr of injected glands
nr of positive glands
take rate (%)patient age mutant
A
B C
*
Tumor
PDX
Patient 1 Patient 2 Patient 3 Patient 4 Patient 5 Patient 6
Patient 7 Patient 8 Patient 9 Patient 1
Tumor
PDX
Patient 10 (TN)
Alu ER PR KI67
D
Figure S6. Related to Figure 7. Histopathology of patient tumors and respective PDX-MINDs. (A) Micrographs of H&E stained sections from patient tumors and their respective MIND-PDXs 20 weeks after injection. Scale bar, 50 μm (Tumors) and 20 μm (PDXs). Invasive component detected in tumor from patient 1 is highlighted by asterix in the additional panel. (B) ER, PR and Ki67 status of PDX-MINDs. Micrographs of Alu-ISH and Ki67- ER - and PR-IHC on histological sections different patient derived tumor cells growing as MINDs. Scale bar, 50 μm. (C) Summary of reduction mammoplasties and PDXs derived from them. (D) Summary of mammectomies from BRCA1 mutation carriers and PDXs derived from them.
PDX-1
PDX-2
PDX-3
PDX-5
PDX-6
PDX-7
PDX-8
PDX-9
PDX-10

A1st generation 2nd generation
1 13 5 382 22 15 683 12 10 834 10 9 905 6 1 176 9 9 1007 11 11 1008 23 18 789 23 21 87
1011 23 16 70
average: 76
patientnr of injected
glandsnr of positive
glandstake rate
(%)
11 9 8217 17 10014 13 9317 16 94
40 35 8891
nr of injected glands
nr of positive glands
take rate (%)
B1st generation later generations
10 40 35 87patient
nr of injected glands
nr of positive glands
take rate (%)
G2 54 48 89G3 12 16 75G4 11 9 82G5 13 13 100G6 8 8 100G7 6 6 100
nr of positive glands
take rate (%)
nr of injected glands
Figure S7. Related to Figure 8. Serial engraftment of MIND-PDXs. (A) Summary of the ER+ patient tumors and the MIND-PDXs derived from them in the first and second engraftment cycle. (B) Summary of the serial engraftments performed on the triple negative (TN) patient 10 tumor over 7 cycles.
Table S8. Related to Figure 8. Ion Torrent panel of 52 frequently mutated cancer genes. Provided as MS Excel File.

Supplemental Experimental Procedures
Cell Culture, Lentivirus Production, Lentiviral Infection, Generation of Stable Cell Lines and Cells Injected In Vivo
ER+ breast cancer cell lines MCF7, T47D, BT474, HCC1428, MDAMB415, MDAMB134VI and ZR751 as well as ER- breast cancer cell lines BT20, MDAMB231, MDAMB453 and HCC1806 were purchased from American Type Culture Collection (ATCC). All cells except BT474 and MDAMB134VI were grown at 37 oC in humidified incubator in an atmosphere of 5% CO2 and were maintained in Dulbecco's modified Eagle's medium (DMEM) medium (cat# 31966, Gibco) supplemented with 10% FCS (cat# 10270-106, Thermo Fisher Scientific Inc.) and penicillin/streptomycin (cat# 15070-063, Thermo Fisher Scientific Inc.). BT474 cells were maintained in RPMI (cat# 61870-010, Thermo Fisher Scientific Inc.) supplemented with 10% FCS and penicillin/streptomycin. MDAMB134VI ER+ lobular cell line was maintained in 1:1 DMEM:L-15 (cat# 11415-064, Thermo Fisher Scientific Inc.) supplemented with 10% FCS and 1% penicillin/streptomycin. Production and purification of lentiviruses were performed as described (Barde et al., 2010; Tiscornia et al., 2006). Breast cancer cell lines were lentivirally transduced to express firefly luciferase (luc2) under the control of CMV promoter (vector pCDH-CMV-MCS-EF1-puro-luc2) and DsRed fluorescent protein by hPGK-DsRed and selected for the brightest DsRed subpopulation by FACS sorting. For gain-of-function studies ΔNp63 and control PINCO EGFP retroviral vectors were used as described previously (Yalcin-Ozuysal et al., 2010) and pLOC-SLUG (Mani et al., 2008). For loss-of-function studies siSLUG-pLKO.1 (Gupta et al., 2005) was purchased from Addgene. Female SCID Beige mice were injected intraductally with 1x10⁵-2x10⁵ cells from breast cancer cell lines (per gland). Female NSG mice were injected intraductally with 2x10⁵-4x10⁵ cells per gland from reduction mammoplasties and with 1x10⁵-2x10⁵ breast cancer cells per gland freshly isolated from tumor tissue.
Alu-In Situ Hybridization (Alu-ISH)
Alu-ISH was performed using a FITC labeled Alu probe (Roche Diagnostics, Rotkreuz, Switzerland). Fully automated Ventana Discovery xT instrument and respective reagents (Roche Diagnostics, Rotkreuz, Switzerland) were used for IHC. Briefly, dewaxed and rehydrated paraffin sections were pretreated with the RiboMap kit followed by the protease 1 treatment for 8 minutes at 37 °C. The Alu probe was hybridized for 1 hour at 47 °C. Sections were washed 3 times with Ribowash (2x SSC) for 8 minutes at 45 °C. After incubation with an anti-FITC biotin (dilution 1:300, Jackson ImmunoResearch Laboratories), chromogenic revelation was performed with BlueMap kit for 2 hours. Nuclear Fast Red (Carl Roth) counterstaining was performed on a Prisma Automate (Sakura) for 5 minutes. Slides were mounted with xylene-based glue (Sakura).
Immunoblot Analysis
Tissue was homogenized in 25mM Tris-HCl, pH 7.5, 0.42M NaCl, 1.5mM MgCl2, 0.5mM EDTA, 1 mM DTT, 10% glycerol containing protease (cat# 11836153001, Roche AG) and phosphatase inhibitor cocktail (cat# 04906845001, PhosStop, Roche, AG), followed by 20 min centrifugation at 4 0C (14,000 x g). Protein levels were quantified and normalized to RFP or β-‐actin using the open source image processing software Image Studio Lite version 5.2 (LI-COR®). In vitro cellular extracts were made from sub-confluent cells. 40-80 µg of total cell lysate per sample was run on 10% or 12% SDS polyacrylamide gel. Proteins were transferred to nitrocellulose membranes, blocked in 5% Tris-Buffered Saline and Tween 20 (TBST) or nonfat dried milk (cat# A0830, AppliChem) and incubated at 4°C overnight with the primary antibodies. Membranes were washed, incubated for 45 min with secondary antibodies and revealed with ECL or WesternSure PREMIUM Chemiluminescent Substrate (cat# 926-95010, LI-COR®) as described previously (Sflomos et al., 2011). The following secondary antibodies were used: goat anti-rabbit immunoglobulins/HRP (cat# P0448, DAKO), goat anti-mouse immunoglobulins/HRP (cat# P0447, DAKO), IRDye® 800CW goat-anti-rabbit antibody (cat# 926-32211, LI-COR®) and IRDye® 680RD goat-anti-mouse antibody (cat# 926-68070, LI-COR®). The following primary antibodies were used:

Antibody Clone Catalog Number Company Species α-ERα HC-20 sc-543 Santa Cruz Rabbit α-RFP PM005 - MBL Rabbit α-p63 4A4 sc-8431 Santa Cruz Mouse α-Cleaved CK18 M30 CytoDEATH™ 12140322001 Roche Mouse α-Integrin alpha 6 - ab75737 Abcam Rabbit α-Annexin A1 3299S - Cell Signaling Rabbit α-SLUG C19G7 9585 Cell Signaling Rabbit α-Vimentin D21H3 5741 Cell Signaling Rabbit α-Caveolin-1 N-20 sc-894 Santa Cruz Rabbit α-actin 20-33 A5060 Sigma Rabbit α-SMAD2/3 D7G7 8685 Cell Signaling Rabbit α-pSMAD2/3 D27F4 8828 Cell Signaling Rabbit α-Lamin B1 119D5-F1 ab8982 Abcam Mouse
Immunohistochemical Assays
Tumor tissues were fixed for 2-4 hours in 4% paraformaldehyde and paraffin embedded. 4 µm sections were mounted onto 76 x 26 mm microscope slides (Rogo-Sampaic, France) and stained with hematoxylin-eosin. IHC was performed using Ventana automated staining device (Ventana Medical Systems Inc, Roche AG) for progesterone receptor (cat# 790-2223, clone 1E2), estrogen receptor (cat# 790-4324, clone SP1), androgen receptor (cat# 760-4605, clone SP107) and Kiel 67 antigen (Ki67) (cat# 790-4286, clone 30-9). Proliferation index was calculated by quantification of proportion of cells positive for (Ki67). The number of positive nuclei was measured by automated open source software Fiji or manually scored and divided by the total number of nuclei. The mean number of total nuclei counted was 2000. For the measurement of the ductal width, the mean number of total ducts counted was 50.
Immunofluorescence Assays
Antigen retrieval was performed using 10mM Trisodium Citrate Buffer, pH 6.0 for 20 minutes at 95 0C. followed by blocking with 1% BSA for 30 minutes and overnight incubation with p63 (cat# sc-8431, Santa Cruz) and cleaved CK18 (cat# 12140322001, Roche) antibodies and 1 hour incubation with secondary antibodies. Nuclei were counterstained 10 minutes with DAPI (4',6-Diamidino-2-Phenylindole, Sigma) and mounted with Dabco (cat# 0718, Carl Roth). Images were taken by confocal Zeiss LSM700 microscope. The secondary antibodies used are listed in the table below:
Antibody Catalog Number Company Species
Alexa Fluor® 568 A-10037 Thermo Fisher Scientific Donkey anti-Mouse IgG Alexa Fluor® 568 SA5-10042 Thermo Fisher Scientific Donkey anti-Rabbit IgG Alexa Fluor® 488 A-11029 Thermo Fisher Scientific Goat anti-Mouse IgG Alexa Fluor® 488 A-21206 Thermo Fisher Scientific Donkey anti-Rabbit IgG
Bioluminescence Imaging, micro CT and Mammography
Bioluminescence was detected with Xenogen IVIS Imaging System 200 (Caliper Life Sciences) in accordance with the manufacturer’s recommendations and protocols. Mice were monitored weekly. Fifteen min after intraperitoneal administration of 150 mg/kg luciferin (cat# L-8220, Biosynth AG) images were acquired and analyzed with Living Image software (Caliper Life Sciences, Inc.). For metastasis detection, 10 minutes prior to sacrifice mice were injected with luciferin and the resected organs were immediately imaged. For 3D visualization of mammary gland microcalcifications a

microcomputed tomography (mCT) scanner (Quantum FX micro CT Imaging System, PerkinElmer, Inc.) was used and low-resolution (Bin-4) protocol was performed using 90kV. The reconstructed 3D images were viewed and analyzed using Analyze Software System (Mayo Clinic Rochester, MN). Paraffin-embedded tissue blocks were analyzed by cabinet x-ray (Faxitron, USA).
Pharmacological Treatments
When bioluminescence from tumors reached approximately 106 total flux (p/s/cm²/sr), animals were randomly assigned to different groups (n≥4) and treated with i) tamoxifen 1mg per mouse (cat# T5648, Sigma), ii) fulvestrant 5 mg per mouse (cat# S1191, SelleckChem), or iii) equal volume of vehicle, mineral oil (cat# M5310, Sigma). Subcutaneous injections were repeated every other day for tamoxifen (weekends not included) and once a week for fulvestrant. Triple negative-MIND preclinical model was treated with doxorubicin (Adriamycin, cat# S1208, SelleckChem) and cyclophosphamide for 4 weeks. Doxorubicin was applied intraperitoneally at 50 µg/mouse/week and cyclophosphamide was added at 125 µg/ml to the drinking water protected from the light and replaced every week. To facilitate MCF7-FP ER+ tumors to form, mice received slow release estrogen pellets containing 0,5 mg of 17-β-estradiol by subcutaneous placement in the neck area, as described previously (Duss et al., 2007). Data were analyzed as described in the text using the GraphPad Prism version 6.07 for Windows, GraphPad Software, La Jolla California USA, www.graphpad.com.
Estrogen Deprivation in Vivo Studies
Ovariectomy was performed 20 weeks after intraductal injection of 1x10⁵ MCF7-DsRed/luc2 cells. Tumor growth was monitored by IVIS technology and Kaplan-Meier plot was performed using GraphPad Prism version 6.07.
Transcriptomic Analyses
Eight- to twelve-week-old female SCID/Beige mice (CB17.Cg-PrkdcscidLystbg-J/Crl) obtained from Charles River were injected with 2x10⁵ MCF7-DsRed/luc2 cells into the fat pad or 5x10⁴ MCF7-DsRed/luc2 cells intraductally. MoFlo Astrios FACS sorter (Beckman Coulter, Inc.) was used to sort xenografted MCF7 cells based on DsRed expression 6-10 weeks after surgery; total RNA was extracted using Trizol (cat# 15596-026, Thermo Scientific Inc.), purified with the miRNeasy Mini Kit (Qiagen) and quantified by NanoDrop®ND-1000. RNA quality was assessed by Agilent 2100 Bioanalyzer (Agilent, Palo Alto, USA) and only the samples with a RIN score > 7.0 were included for analysis. Basal-like cell lines were injected into eight- to twelve-week-old female SCID/Beige mice with 5x10⁵ BT20-GFP/luc2 cells or 5x10⁵ HCC1806-GFP/luc2 cells either into the mammary fat pad or 2x10⁵ BT20-DsRed/luc2 cells (n=3) or 2x10⁵ HCC1806-DsRed/luc2 cells intraductally. 3-4 weeks xenografted BT20 and HCC1806 basal-like breast cancer cells were sorted by FACS based on GFP expression. For each sample, 300 ng of total RNA was amplified using the message amp II enhanced kit (cat# AM1791, Ambion). 12.5 µg of biotin-labelled cRNA were chemically fragmented. Affymetrix GeneChip Human Genome U133A 2.0 Arrays (Affymetrix, Santa Clara, CA, USA) were hybridized with 11 µg of fragmented target, at 45 °C for 17 hours, washed and stained according to Affymetrix GeneChip® Expression Analysis Manual (Fluidics protocol FS450_0007). Arrays were scanned using the GeneChip® Scanner 3000 7G (Affymetrix) and raw data was extracted from the scanned images and analyzed with the Affymetrix Power Tools software package (Affymetrix). Statistical analyses were performed using R and Bioconductor packages (http://www.Bioconductor.org). Hybridization quality was assessed using the Expression Console software (Affymetrix). Normalized expression signals were calculated from Affymetrix CEL files using RMA. Differential hybridized features were identified using Bioconductor package “limma” that implements linear models for microarray data (Smyth, 2004). The P values were adjusted for multiple testing with Benjamini and Hochberg’s method to control false discovery rate (FDR) (Benjamini et al., 2001). Probe sets showing ≥ 2-fold change and a FDR ≤0.05 were considered significant. A collection of breast cancer cell lines (Neve et al., 2006) analyzed for hormone receptor expression using the GOBO bioinformatics tool (Ringner et al., 2011).

mRNA Extraction and Semi Quantitative RT-PCR
DsRed positive breast cancer cell lines were sorted by FACS and semi quantitative RT-PCR was performed as described (Tanos et al., 2013). The primers used are listed in the table below:
Primer Sequences Used With Fluidigm
Gene Forward Reverse
VIM AGATGAAGGCCAGTGAGCTG AGATTACCGCACCGCTTAGA *SLUG GCATTTCTTCACTCCGAAGC TGAATTCCATGCTCTTGCAG **SLUG CTGGGCGCCCTGAACATGCAT GGCTTCTCCCCCGTGTGAGTTCTA AR CCCACTTGTGTCAAAAGCGA AATGGGCAAAACATGGTCCC TP63 ATGCCCAGACTCAATTTAGTG TTCTGCGCGTGGTCTGTGT
ESR1 TGGAGATCTTCGACATGCTG TCCAGAGACTTCAGGGTGCT
CDH2 CTGGGAACATGACAATCACG GGAATAAACCACAGGGCTCA
FN1 ACCCTGTGACTCAGCCACTT ACAAAGACGGAAAAGGCATC
KRT14 ACCTAGACAAGGTGCGTGCT GGCATTGTCAATCTGCAAAA
KRT6A GCCTTGTATGATGCAGAGCT GTACCAGGACTCAGCCTCAG
*(Phillips et al., 2014) **(Zheng et al., 2014)
Ion Torrent Technology
Somatic Mutations Profiling Using the Ion Torrent Technology
Somatic mutations (substitutions, insertions or deletions) were evaluated using an Ion AmpiSeq Custom Cancer Hotspot panel generated by the combination of the Ion Hotspot cancer panel V2 and Ion AmpliSeq™ Colon and Lung Cancer Panel v2, designed to amplify 218 amplicons covering approximately 2800 COSMIC mutations from the 52 most commonly reported oncogenes and tumor suppressor genes (Ion Torrent, Life Technologies, Carlsbad, CA). The list of those genes can be found in Table S9. The average coverage was around 2000X (range: 1097-3224) with 99% of targeted regions covered with a minimum of 100X.
DNA Extraction and Quantification
Genomic DNA was extracted from the FFPE samples using the QIAamp® DNA FFPE Tissue Handbook, according to the manufacturer’s instructions (cat# 56404, Qiagen, Valencia, CA, USA). DNA quantity was measured using the NanoDrop® ND-1000 full spectrum (220-750nm) spectrophotometer (Thermo Fisher Scientific, Inc.).
Ion Torrent Sequencing Library Preparation
Targeted sequencing libraries were produced starting from 10 ng of dsDNA. The multiplexed amplicons were then used to generate barcoded libraries using the Ion AmpliSeq™ Library Kit 2.0 and the Ion Xpress™ barcoded adapters (Thermo Fisher Scientific). Pooled amplicons were end-repaired, and Ion Torrent adapter P1 and barcoded were ligated with DNA ligase. Following a first cycle of AMPure bead purification (Beckman Coulter), 5 cycles of amplification were performed. This was followed by 2 cycles of purification and libraries quantification by Qubit (Thermo Fisher Scientific). Sample emulsion PCR, emulsion breaking, and enrichment were performed using PGM™ Hi‑Q™ OT2 kit (Thermo Fisher Scientific), according to the manufacturer’s instructions. Briefly, an input concentration of one DNA template copy/Ion Sphere Particles (ISPs) was added to the emulsion PCR master mix and the emulsion was generated using the Ion OneTouch2 (Thermo Fisher Scientific).

Template-positive ISPs were quantified by Qubit for QC and enriched by Ion OneTouch™ ES. Sequencing was undertaken using 318 chipsV2 and PGM™ Hi‑Q™ sequencing kit on the Ion Torrent PGM for 500 cycles (Thermo Fisher Scientific).
Ion Torrent Data Analysis
FastQ files generated by the Ion torrent suite software (v.4.6) were aligned to the Human genome GRCh37 assembly by Novoalign v.3.02.07 (default setting). Sample quality assessment included fragment size distribution, per base sequence quality and content, GC content and coverage was performed in R (v.3.2.2) using different packages (qrqc, ShortReads and lattice). Variant calling and annotation was done using VarScan v.2.3.7 and ANNOVAR v.2015-06-17. Variants were filtered based on the following criteria: minimum coverage > 100, minimum ALT reads >20, minimum variant frequency >5% and bias in strand for reads supporting variant <0.05. Mutations/indels systematically identified only in the PDXs population (potential mouse DNA) or observed more than 2 times with an allele frequency <10% were used to generate a list as technical artifacts. From this list known polymorphisms and mutations were removed. The final table of mutations was generated filtering technical artefacts, synonymous or non-coding variants. Variants observed either in the human or PDX pairs were further evaluated by visual inspection of the BAM files using IGV 2.3 software (Broad Institute of MIT and Harvard) in order to make sure they were not excluded by the stringent thresholds imposed.
RNA-Seq Experiment and Data Analysis
RNA-sequencing libraries were prepared by first generating double-stranded cDNA from 10 ng total RNA extracted as described above, from GFP+ tumor cells sorted by FACS, with the NuGEN Ovation RNA-Seq System V2 (NuGEN Technologies, San Carlos, California, USA). 100 ng of the resulting double-stranded cDNA were fragmented to 350 pb using Covaris S2 (Covaris, Woburn, Massachusetts, USA). Sequencing libraries were prepared from the fragmented cDNA with the Illumina TruSeq Nano DNA Library Prep Kit (Illumina, San Diego, California, USA) according to the protocol supplied by the manufacturer. Cluster generation was performed with the libraries using the Illumina TruSeq SR Cluster Kit v4 reagents and sequenced on the Illumina HiSeq 2500 with TruSeq SBS Kit v4 reagents. Sequencing data were processed using the Illumina Pipeline Software version 1.82. For the mapping and counting, the standard parameters on the HTS station web application (David et al., 2014) where used, with an additional option for local alignments in bowtie2. The amplified lanes where added up. After filtering out the low expression tags, TMM normalization was performed in R (Robinson and Oshlack, 2010). A scaling normalization method for differential expression analysis of RNA-seq data was applied (Robinson and Oshlack, 2010). The differential expression was analyzed using generalized linear models (GLM) in edgeR with a GLM likelihood ratio test (Robinson et al., 2010).
Bioinformatic and Statistical Analysis
MCF7-FP and MCF7-MIND were compared to patient tumors (Guedj et al., 2012); accession number: E-MTAB-365 and breast cancer cell lines (Neve et al., 2006) accession number: E-TABM-157 using public gene expression data from ArrayExpress (Brazma et al., 2003). For both comparisons, a set of PAM50 classifier genes was used (Nielsen et al., 2010). Supervised risk predictor of breast cancer based on intrinsic subtypes was used as a feature space and PCA was performed using R. To find functional categories overlapping with differentially expressed genes, the g:Profiler web tool was used (Reimand et al., 2007). Analysis was carried out separately for up- and down-regulated genes. All significant genes were sorted based on fold change and top 500 genes with largest fold change were analyzed with “ordered query” checked and otherwise default options. KEGG and Reactome pathways and gene ontology (Ashburner et al., 2000) biological processes were retained for further analysis. Signaling pathways were filtered out from GO terms by searching for signaling-related keywords in the term names. One gene ontology category was used to look more closely at molecular profiles: epithelial to mesenchymal transition (GO:0001837). Heatmaps were generated using heatmap package in R. Euclidean distance and complete linkage were used for clustering. The epithelial to mesenchymal transition progression was further studied using Gene Set Enrichment Analysis (Subramanian et al., 2005). R implementation of GSEA was run with default parameters. Box plots were created by GraphPad Prism version 6.07. Groups were compared using an unpaired, two-tailed t-test or a Mann-Whitney test as described in the text and significance criterion of p<0.05. For all other data, two-tailed, paired Student’s t test was used to calculate statistical significance.

Supplemental References Ashburner, M., Ball, C. A., Blake, J. A., Botstein, D., Butler, H., Cherry, J. M., Davis, A. P., Dolinski, K., Dwight, S. S., Eppig, J. T., et al. (2000). Gene ontology: tool for the unification of biology. The Gene Ontology Consortium. Nat. Genet. 25, 25-29. Barde, I., Salmon, P., and Trono, D. (2010). Production and titration of lentiviral vectors. Curr. Protoc. Neurosci. Chapter 4, Unit 4.21. Benjamini, Y., Drai, D., Elmer, G., Kafkafi, N., and Golani, I. (2001). Controlling the false discovery rate in behavior genetics research. Behavioural brain research. 125, 279-284. Brazma, A., Parkinson, H., Sarkans, U., Shojatalab, M., Vilo, J., Abeygunawardena, N., Holloway, E., Kapushesky, M., Kemmeren, P., Lara, G. G., et al. (2003). ArrayExpress--a public repository for microarray gene expression data at the EBI. Nucleic Acids Res. 31, 68-71. David, F. P., Delafontaine, J., Carat, S., Ross, F. J., Lefebvre, G., Jarosz, Y., Sinclair, L., Noordermeer, D., Rougemont, J., and Leleu, M. (2014). HTSstation: a web application and open-access libraries for high-throughput sequencing data analysis. PloS one 9, e85879. Duss, S., Andre, S., Nicoulaz, A. L., Fiche, M., Bonnefoi, H., Brisken, C., and Iggo, R. D. (2007). An oestrogen-dependent model of breast cancer created by transformation of normal human mammary epithelial cells. Breast Cancer Res. 9, R38. Gupta, P. B., Kuperwasser, C., Brunet, J. P., Ramaswamy, S., Kuo, W. L., Gray, J. W., Naber, S. P., and Weinberg, R. A. (2005). The melanocyte differentiation program predisposes to metastasis after neoplastic transformation. Nat. Genet. 37, 1047-1054. Kao, J., Salari, K., Bocanegra, M., Choi, Y. L., Girard, L., Gandhi, J., Kwei, K. A., Hernandez-Boussard, T., Wang, P., Gazdar, A. F., et al. (2009). Molecular profiling of breast cancer cell lines defines relevant tumor models and provides a resource for cancer gene discovery. PloS one. 4, e6146. Mani, S. A., Guo, W., Liao, M. J., Eaton, E. N., Ayyanan, A., Zhou, A. Y., Brooks, M., Reinhard, F., Zhang, C. C., Shipitsin, M., et al. (2008). The epithelial-mesenchymal transition generates cells with properties of stem cells. Cell. 133, 704-715. Nielsen, T. O., Parker, J. S., Leung, S., Voduc, D., Ebbert, M., Vickery, T., Davies, S. R., Snider, J., Stijleman, I. J., Reed, J., et al. (2010). A comparison of PAM50 intrinsic subtyping with immunohistochemistry and clinical prognostic factors in tamoxifen-treated estrogen receptor-positive breast cancer. Clin. Cancer Res. 16, 5222-5232. Phillips, S., Prat, A., Sedic, M., Proia, T., Wronski, A., Mazumdar, S., Skibinski, A., Shirley, S. H., Perou, C. M., Gill, G., et al. (2014). Cell-state transitions regulated by SLUG are critical for tissue regeneration and tumor initiation. Stem cell reports. 2, 633-647. Reimand, J., Kull, M., Peterson, H., Hansen, J., and Vilo, J. (2007). g:Profiler--a web-based toolset for functional profiling of gene lists from large-scale experiments. Nucleic Acids Res. 35, W193-200. Ringner, M., Fredlund, E., Hakkinen, J., Borg, A., and Staaf, J. (2011). GOBO: gene expression-based outcome for breast cancer online. PloS one. 6, e17911. Robinson, M. D., McCarthy, D. J., and Smyth, G. K. (2010). edgeR: a Bioconductor package for differential expression analysis of digital gene expression data. Bioinformatics. 26, 139-140. Robinson, M. D., and Oshlack, A. (2010). A scaling normalization method for differential expression analysis of RNA-seq data. Genome Biol. 11, R25. Sflomos, G., Kostaras, E., Panopoulou, E., Pappas, N., Kyrkou, A., Politou, A. S., Fotsis, T., and Murphy, C. (2011). ERBIN is a new SARA-interacting protein: competition between SARA and SMAD2 and SMAD3 for binding to ERBIN. J. Cell Sci. 124, 3209-3222. Smyth, G. K. (2004). Linear models and empirical bayes methods for assessing differential expression in microarray experiments. Stat Appl Genet Mol Biol. 3, Article3. Subramanian, A., Tamayo, P., Mootha, V. K., Mukherjee, S., Ebert, B. L., Gillette, M. A., Paulovich, A., Pomeroy, S. L., Golub, T. R., Lander, E. S., and Mesirov, J. P. (2005). Gene set enrichment analysis: a knowledge-based approach for interpreting genome-wide expression profiles. Proc. Natl. Acad. Sci. U S A. 102, 15545-15550. Tiscornia, G., Singer, O., and Verma, I. M. (2006). Production and purification of lentiviral vectors. Nature Protocols. 1, 241-245. Zheng, H., Shen, M., Zha, Y. L., Li, W., Wei, Y., Blanco, M. A., Ren, G., Zhou, T., Storz, P., Wang, H. Y., and Kang, Y. (2014). PKD1 phosphorylation-dependent degradation of SNAIL by SCF-FBXO11 regulates epithelial-mesenchymal transition and metastasis. Cancer Cell. 26, 358-373.


![Molecular Mechanism of SAHA on Regulation of Au- … · alpha (ERα) positive, thus ... lysosomes for degradation and recycling[13]. In pa r-ticular, ... is currently in clinical](https://static.fdocuments.in/doc/165x107/5b8172767f8b9a2b678c62b5/molecular-mechanism-of-saha-on-regulation-of-au-alpha-er-positive-thus.jpg)