A PRE-FEASIBILITY STUDY FOR DEEP SEAWATER AIR · PDF filea pre-feasibility study for deep...
78
A PRE-FEASIBILITY STUDY FOR DEEP SEAWATER AIR CONDITIONING SYSTEMS IN THE CARIBBEAN TOPIC ENERGY EFFICIENCY October 2015
Transcript of A PRE-FEASIBILITY STUDY FOR DEEP SEAWATER AIR · PDF filea pre-feasibility study for deep...
A PRE-FEASIBILITY STUDY FOR DEEP SEAWATER AIR CONDITIONING SYSTEMS IN THE CARIBBEAN
TOPIC ENERGY EFFICIENCY October 2015
A PRE-FEASIBILITY STUDY FOR DEEP SEAWATER AIRCONDITIONING SYSTEMS IN THE CARIBBEAN ii
Final Report A PRE-FEASIBILITY STUDY FOR DEEP SEAWATER AIRCONDITIONING SYSTEMS IN THE CARIBBEAN October 2015 Published by CAF- Latin America Development Bank Energy Vice-presidency/ Directorate of Analysis and Energy Strategies Hamilton Moss, Corporate Vice-president Mauricio Garrón, Director Alvaro Atilano, Principal Executive. Study Coordinator Prepared By MAKAI OCEAN ENGINEERING, INC.
The ideas and proposals contained in this issue are the exclusive responsibility of the authors and do not reflect the official position of CAF. © 2015 Corporación Andina de Fomento
TABLE OF CONTENTS
TABLE OF CONTENTS .......................................................................................................................... I
LIST OF FIGURES ................................................................................................................................ III
LIST OF TABLES .................................................................................................................................. IV
1. INTRODUCTION ....................................................................................................................... 6 1.1. PURPOSE OF STUDY .......................................................................................................... 6 1.2. METHOD OF STUDY ............................................................................................................ 6 1.3. CONCEPTUAL DESIGN ....................................................................................................... 7 1.4. REPORT ................................................................................................................................ 7 1.5. CONCLUSIONS OF STUDY ................................................................................................. 8
2. SITE DATA .............................................................................................................................. 10 2.1. MONTEGO BAY .................................................................................................................. 10
2.1.1. System Design ....................................................................................................... 10 2.1.2. Offshore Data ......................................................................................................... 11 2.1.3. Optimization ........................................................................................................... 12
2.2. PUERTO PLATA ................................................................................................................. 14 2.2.1. System Design ....................................................................................................... 14 2.2.2. Offshore Data ......................................................................................................... 14 2.2.3. Optimization ........................................................................................................... 15
3. MODELING RESULTS ............................................................................................................ 17 3.1. MONTEGO BAY .................................................................................................................. 17
3.1.1. Technical Output .................................................................................................... 17 3.1.2. Costs ...................................................................................................................... 19
3.2. PUERTO PLATA ................................................................................................................. 21 3.2.1. Technical Output .................................................................................................... 22 3.2.2. Costs ...................................................................................................................... 24
4. SWAC SYSTEM CONCEPTUAL DESIGN ............................................................................. 28 4.1. OVERVIEW ......................................................................................................................... 28 4.2. DISTRIBUTION SYSTEM LAYOUT .................................................................................... 30
5. SENSITIVITY ANALYSIS........................................................................................................ 35 5.1. MONTEGO BAY .................................................................................................................. 35
5.1.1. Electrical Cost ........................................................................................................ 35 5.1.1. Cooling Load .......................................................................................................... 36 5.1.2. Hybrid SWAC ......................................................................................................... 40 5.1.3. Thermal Energy Storage ........................................................................................ 44
5.2. PUERTO PLATA ................................................................................................................. 48 5.2.1. Electrical Cost ........................................................................................................ 48 5.2.2. Cooling Load .......................................................................................................... 51 5.2.3. Hybrid SWAC ......................................................................................................... 53 5.2.4. Thermal Energy Storage ........................................................................................ 56
6. RISK ANALYSIS ..................................................................................................................... 60

A PRE-FEASIBILITY STUDY FOR DEEP SEAWATER AIRCONDITIONING SYSTEMS IN THE CARIBBEAN ii
6.1. HURRICANES ..................................................................................................................... 60 6.1.1. Montego Bay .......................................................................................................... 60 6.1.2. Puerto Plata ............................................................................................................ 61 6.1.3. Risk Mitigation ........................................................................................................ 61
6.2. EARTHQUAKES ................................................................................................................. 61 6.2.1. Montego Bay .......................................................................................................... 61 6.2.2. Puerto Plata ............................................................................................................ 64 6.2.3. Risk Mitigation ........................................................................................................ 66
6.3. BUILDING RETROFIT ........................................................................................................ 66
7. MARKETING PLAN ................................................................................................................ 69 7.1. CUSTOMER PROFILES ..................................................................................................... 69
7.1.1. Load Segmentation ................................................................................................ 69 7.2. SWAC DEVELOPMENT STRATEGY ................................................................................. 70
7.2.1. Developer Interest .................................................................................................. 70 7.2.2. Market Preparation ................................................................................................. 70
7.3. CUSTOMER-UTILITY RELATIONSHIP .............................................................................. 72 7.3.1. Customer Requirements ........................................................................................ 72 7.3.2. Rate Structure ........................................................................................................ 72
8. CONCLUSIONS ...................................................................................................................... 75 8.1. MONTEGO BAY .................................................................................................................. 75 8.2. PUERTO PLATA ................................................................................................................. 75

A PRE-FEASIBILITY STUDY FOR DEEP SEAWATER AIRCONDITIONING SYSTEMS IN THE CARIBBEAN iii
LIST OF FIGURES
Figure 1-1: Simplified schematic of the SWAC model iteration cycle.. ..................................................... 6 Figure 2-1. Onshore Cooling Network in Montego Bay .................................................................................. 10 Figure 2-2: Nautical chart for zone off Montego Bay. The red line represents a potential pipe path
with the shortest distance to deep water ...................................................................................... 11 Figure 2-3: Bathymetry and seawater temperature profiles used for Montego Bay ................................... 12 Figure 2-4. Onshore Cooling Network in Puerto Plata ................................................................................... 14 Figure 2-5: Nautical chart for zone of Puerto Plata. The red line represents a potential pipeline path
with the shortest distance to deep water. ..................................................................................... 15 Figure 2-6: Bathymetry and seawater temperature profiles used for Puerto Plata .................................... 15 Figure 4-1: Schematic showing major components of a SWAC system (right) compared to
conventional AC (left) ...................................................................................................................... 28 Figure 4-2: HDPE fusion used to join two lengths of pipe during the assembly process. ......................... 29 Figure 4-3: Controlled submergence of an HDPE pipe designed by Makai. ............................................... 29 Figure 4-4: Aerial image of the NELHA sump-style pump station, located in Kona, HI, USA. ................. 30 Figure 4-5: Conceptual Distribution Piping Layout in Montego Bay ............................................................. 31 Figure 4-6: Conceptual Distribution Piping Layout in Puerto Plata ............................................................... 32 Figure 4-7: Distribution Pipe Installed under a Roadway ............................................................................... 32 Figure 4-8: Typical closed loop trench connection .......................................................................................... 33 Figure 4-9: Installation of Distribution Pipe around Existing Utilities ............................................................ 34 Figure 5-1: Comparison of the Effect of Electrical Rate on SWAC (blue) and Conventional AC (red)
in Montego Bay in levelized cost units of $/ton/year. ................................................................. 35 Figure 5-2: Comparison of the Effect of Load Factor on SWAC and Conventional AC in Montego
Bay ..................................................................................................................................................... 38 Figure 5-3: Schematic of Pure SWAC .............................................................................................................. 41 Figure 5-4: Schematic of Hybrid SWAC ........................................................................................................... 41 Figure 5-5: The Effect of Hybrid SWAC on Levelized Cost in Montego Bay .............................................. 42 Figure 5-6: Diagram of Chilled Water Storage Operation .............................................................................. 45 Figure 5-7: The Effect of TES Tank Capacity on SWAC Levelized Cost in Montego Bay ........................ 46 Figure 5-8: Comparison of the Effect of Electrical Rate on SWAC and Conventional AC in Puerto
Plata ................................................................................................................................................... 49 Figure 5-9: Comparison of the Effect of Load Factor on SWAC and Conventional AC in Puerto
Plata ................................................................................................................................................... 51 Figure 5-10: The Effect of Hybrid SWAC on Levelized Cost in Puerto Plata ................................................ 54 Figure 5-11: The Effect of TES Tank Capacity on SWAC Levelized Cost in Puerto Plata ......................... 57 Figure 6-1: Major Hurricanes near Jamaica Since 1842 ................................................................................ 60 Figure 6-2: Major Hurricanes near the Dominican Republic since 1842 ..................................................... 61 Figure 6-3: Earthquakes near Jamaica since 1900 ........................................................................................ 62 Figure 6-4: GSHAP Seismic Hazard Map of Jamaica .................................................................................... 63 Figure 6-5: Earthquakes near the Dominican Republic since 1900 ............................................................. 64 Figure 6-6: GSHAP Seismic Hazard Map of the Dominican Republic ......................................................... 65 Figure 6-7: Example of a Rooftop Air Handling Unit ....................................................................................... 66 Figure 6-8: Example of Mini-Split Air Conditioning Systems ......................................................................... 67 Figure 6-9: Example of Window Unit Air Conditioners ................................................................................... 67
A PRE-FEASIBILITY STUDY FOR DEEP SEAWATER AIRCONDITIONING SYSTEMS IN THE CARIBBEAN iv
LIST OF TABLES
Table 2-1: Additional Cooling Data Obtained for Montego Bay ................................................................ 12 Table 2-2: Potential Cooling Customers and Loads in Montego Bay ...................................................... 13 Table 2-3: Potential Cooling Customers and Loads in Puerto Plata ........................................................ 16 Table 3-1: Technical Results of SWAC Modeling for Montego Bay (abbreviated for public
release) .......................................................................................................................................... 18 Table 3-2: Summary of Levelized Cost for a SWAC System in Montego Bay........................................ 19 Table 3-3: Summary of Capital Costs for a SWAC System in Montego Bay (abbreviated for
public release) ............................................................................................................................... 20 Table 3-4: Summary of Operating Cost of a SWAC System in Montego Bay (abbreviated for
public release) ............................................................................................................................... 21 Table 3-5: Summary of Conventional Air Conditioning Costs in Montego Bay ...................................... 21 Table 3-6: Technical Results of SWAC Modeling for Puerto Plata (abbreviated for public release) ... 23 Table 3-7: Summary of Levelized Cost for a SWAC System in Puerto Plata ......................................... 24 Table 3-8: Summary of Capital Costs for a SWAC System in Puerto Plata (abbreviated for public
release) .......................................................................................................................................... 25 Table 3-9: Summary of Operating Cost of a SWAC System in Puerto Plata (abbreviated for
public release) ............................................................................................................................... 26 Table 3-10: Summary of Conventional Air Conditioning Costs in Puerto Plata ........................................ 26 Table 5-1: Cost Output of Montego Bay Electrical Rate Sensitivity Study .............................................. 37 Table 5-2: Cost Output of Montego Bay Load Factor Sensitivity Study (abbreviated for public
release) .......................................................................................................................................... 39 Table 5-3: Technical Output of Montego Bay Load Factor Sensitivity Study (abbreviated for
public release) ............................................................................................................................... 40 Table 5-4: Cost Output of Montego Bay Hybrid SWAC Sensitivity Study ............................................... 43 Table 5-5: Technical Output of Montego Bay Hybrid SWAC Sensitivity Study ...................................... 44 Table 5-6: Cost Output of Montego Bay TES Tank Sensitivity Study ...................................................... 47 Table 5-7: Technical Output of Montego Bay TES Tank Sensitivity Study ............................................. 48 Table 5-8: Cost Output of Puerto Plata Electrical Rate Sensitivity Study ................................................ 50 Table 5-9: Cost Output of Puerto Plata Load Factor Sensitivity Study .................................................... 52 Table 5-10: Technical Output of Puerto Plata Load Factor Sensitivity Study ........................................... 53 Table 5-11: Cost Output of Puerto Plata Hybrid SWAC Sensitivity Study ................................................. 55 Table 5-12: Technical Output of Puerto Plata Hybrid SWAC Sensitivity Study ........................................ 56 Table 5-13: Technical Output of Puerto Plata TES Tank Sensitivity Study ............................................... 58 Table 5-14: Technical Output of Puerto Plata TES Tank Sensitivity Study ............................................... 59 Table 6-1: GSHAP Peak Ground Acceleration Estimates near Montego Bay ........................................ 63 Table 6-2: GSHAP Peak Ground Acceleration Estimates near Puerto Plata ......................................... 65 Table 7-1: Load Segmentation in Montego Bay .......................................................................................... 69 Table 7-2: Load Segmentation in Puerto Plata............................................................................................ 69

A PRE-FEASIBILITY STUDY FOR DEEP SEAWATER AIRCONDITIONING SYSTEMS IN THE CARIBBEAN 5

A PRE-FEASIBILITY STUDY FOR DEEP SEAWATER AIRCONDITIONING SYSTEMS IN THE CARIBBEAN 6
Intake depth & Flow Rate
Pipe & Pump Specifications
HX & Onshore Specifications ∆T, ∆P, kWh
COSTS
1. INTRODUCTION
1.1. PURPOSE OF STUDY At CAF request, Makai Ocean Engineering Incorporated (Makai) has completed a study on the use of cold deep seawater for air conditioning (SWAC) at two sites in the Caribbean; Montego Bay, Jamaica and Puerto Plata, Dominican Republic. Initially 8 Caribbean sites were evaluated for SWAC development, selecting these two sites for more detailed analysis based on their lowest levelized lifetime cost for installing and operating a SWAC system.
The feasiblity study of these two sites, presented in this report, includes a preliminary conceptual design for the seawater intake and return pipes, pump station, chilled water distribution system, and estimates of capital cost, operating cost, and levelized cost book life analysis.
1.2. METHOD OF STUDY During the past 20 years Makai has developed a numerical tool to more effectively enable the preliminary design and cost estimation of SWAC systems for their clients. The tool, referred to as the SWAC Model, uses a limited number of inputs such as individual cooling loads, offshore bathymetry, and other site conditions to compute a basic conceptual design for the entire SWAC system.
The SWAC model iterates on the size of the SWAC system components, location and depth of intake, and water flow rates until all end users of the district cooling system are provided a satisfactory supply water temperature, water pressure, and cooling load. The model incorporates hydraulics throughout the system, temperature gains, and oceanographic site conditions to compute SWAC operating parameters for district cooling systems ranging from just a few individual loads and supply pipelines, to several hundred individual loads and supply pipelines.
Figure 1-1 shows a simplified schematic of the iteration process. The SWAC model was used for the analysis of Montego Bay and Puerto Plata.
Figure 1-1: Simplified schematic of the SWAC model iteration cycle.
The output from the SWAC model includes the critical design parameters for an intake pipeline, a pump/heat exchanger station, an onshore chilled water distribution network, and a discharge pipeline. The software then computes a cost for the design, construction, and long term operation of the SWAC system. The capital costs are estimated using methods similar to marine and civil contractors, with estimates broken down by major equipment, specific labor, and materials. A detailed construction schedule is computed by the SWAC model, which in turn determines the time usage and cost of major equipment, materials requirements, and labor for the project. Overall, the model incorporates the unit costs for over 160 articles of equipment and materials, and 15 different labor rates, which are then applied across cost estimates for 17 fundamental construction steps.

A PRE-FEASIBILITY STUDY FOR DEEP SEAWATER AIRCONDITIONING SYSTEMS IN THE CARIBBEAN 7
For this study Makai worked with local contacts to obtain building load data directly from building operators. The study included an assessment of auxiliary chillers and thermal energy storage (TES). TES has been used in district cooling networks to offset peak cooling demand, and has the potential to reduce the size of the offshore intake pipeline. With TES, cold water is slowly drawn out of the system and pumped into a large storage tank during off-peak hours and is discharged back into the system during peak hours. The use of a traditional chiller with SWAC, referred to as auxilliary chilling, can be used to additionally cool the SWAC supply water in order to reduce the offshore pipe size or depth requirements. In some instances, where the relative costs for larger or longer pipes are high, these systems can reduce the liftetime costs of the seawater cooing system.
Both auxiliary chillers and TES allow cold water intake systems to be designed for less than the peak usages. These systems are not beneficial for all networks, and due to the dependencies among the various system components, a numerical model is required to properly assess the consequences and economics of these design options.
1.3. CONCEPTUAL DESIGN The modeling study resulted in a conceptual design for each site with a lowest levelized cost. For these scenarios additional design details were provided. The conceptual designs are based on past design experience and pipeline installations. The conceptual designs include descriptions of the:
Anchoring Designs and Hydrodynamic Loads Construction Process Installation Process Shore Crossing Methods Pump Station Heat Exchangers
1.4. REPORT The remainder of this report summarizes the detailed analysis done on SWAC systems at Montego Bay, Jamaica, and Puerto Plata, Dominican Republic. The report describes:
1. Summary of site data and cooling customer data collected since the preliminary analysis phase. 2. More detailed modeling and optimization using Makai’s SWAC model, including analysis of hybrid
SWAC and thermal energy storage systems. 3. Conceptual design of each SWAC system, provided as an abbreviated overview of our design
process and examples that have been successfully applied in other projects. 4. Sensitivity studies investigating the impact of variations in electrical rate, variations in cooling
load, inclusion of hybrid SWAC, and addition of thermal energy storage on the levelized cost of SWAC at each site.
5. Risk analysis investigating the possibility of hurricanes and earthquakes that could pose a threat to the SWAC system.
6. General marketing plan to guide CAF in encouraging SWAC development in the Caribbean.

A PRE-FEASIBILITY STUDY FOR DEEP SEAWATER AIRCONDITIONING SYSTEMS IN THE CARIBBEAN 8
1.5. CONCLUSIONS OF STUDY A section of concluding remarks in the last chapter of this report summarizes the results of the modeling efforts and conceptual designs. It was found that SWAC is economically viable and competitive against conventional air conditioning at the Puerto Plata and Montego Bay sites. The Highlights of the conclusions of this report include:
1. A SWAC system in Montego Bay is estimated to have a capital cost of about $100 million (USD) and supply about 7600 tons of cooling. Levelized costs are estimated to be 34% lower than conventional AC systems at $3,458/ton/year.
2. A SWAC system in Puerto Plata is estimated to have a capital cost of about $68 million (USD)
and supply about 6800 tons of cooling. Levelized costs are estimated to be 48% lower than conventional AC systems at $2,435/ton/year.
3. Puerto Plata is shown to benefit from the use of a thermal energy storage system to offset peak
load hours. 4. Both sites are sensitive to changes in cooling load and electrical rate, but the levelized cost of
SWAC remains lower than conventional AC even if the cooling load is ½ that assumed in this analysis.
5. Resort hotels at both sites are wary of inquiries relating to cooling equipment, cooling cost, and energy use. Makai recommends that CAF include local stakeholders in the SWAC planning process.
Cost SummarySystem Specifications
Peak AC Load (Tons) 7,676Average AC Load (Tons) 4,732Cost of Electricity ($/kW-h) 0.36
Levelized Cost ($/ton/year)SWAC Capital Cost 2,235SWAC Operating Cost 1,140SWAC Periodic Costs 82SWAC Total 3,458
Conventional AC 5,247
Cost SummarySystem Specifications
Peak AC Load (Tons) 6,835Average AC Load (Tons) 4,438Cost of Electricity ($/kW-h) 0.32
Levelized Cost (k$/ton/year)SWAC Capital Cost 1,626SWAC Operating Cost 748SWAC Periodic Costs 61SWAC Total 2,435
Conventional AC 4,691

A PRE-FEASIBILITY STUDY FOR DEEP SEAWATER AIRCONDITIONING SYSTEMS IN THE CARIBBEAN 9
6. Both sites are at risk for a direct hit from a category 5 hurricane. The SWAC systems should be designed to handle the loads associated with such a storm. The offshore pipe will likely require post-deployment anchoring in the shallower near shore zones. Previous pipelines have been designed to handle these types of hydrodynamic loads.
7. Installation of a SWAC system is expected to be technical viable, but actual costs and feasibility of the system will depend on more detailed bathymetric and site conditions. Makai has designed and installed deep HDPE intake pipes in conditions similar to those expected offshore at both sites.

A PRE-FEASIBILITY STUDY FOR DEEP SEAWATER AIRCONDITIONING SYSTEMS IN THE CARIBBEAN 10
2. SITE DATA This section summarizes the site data collection performed to support the feasibility SWAC study at Montego Bay and Puerto Plata. Bathymetric and oceanographic data collection was collected from publically available resources to support a feasibility level study. Wave estimates were obatined from available wave model hindcasts, and Makai estimated extreme storm waves from a parametrization of hurricane force winds and fetches. Makai coordinated with local contacts to collect AC usage data at each site. Success collecting additional data was limited. The majority of potential cooling customers at both sites were unwilling to share information with our team. These customers viewed SWAC is a disruptive technology, fearing it could change the local cooling and energy usage industries.
2.1. MONTEGO BAY Montego Bay is characterized by a large resort area. There is a cluster of cooling load within Montego Bay itself, and a large number of luxury resorts spread along the north coast. The nearby Bogue Power Station also represents a potential cooling customer if SWAC-powered gas turbine inlet cooling is installed, but has not been included in this analysis. Most of the resorts are modern enough and already make use of chilled water cooling system. These buildings would connect to a district cooling SWAC system with minimal retrofit. A few of the cooling customers may use rooftop or split-unit cooling systems, which would require retrofit before they could be connected to a SWAC system. Retrofit costs were not included in the SWAC analysis presented in this report. For additional information on retrofit costs, see Section 6.3.
2.1.1. System Design The cold seawater intake pipe landing site was placed in the middle of the available cooling load to minimize the size of the distribution pipes heading east and west. Figure 2-1 shows a schematic of the onshore network connecting all of the cooling loads. Details of the distribution network layout and conceptual design are loacted in Section 4.2.
Figure 2-1. Onshore Cooling Network in Montego Bay
OFFSHORE INTAKE
ONSHORE DISTRIBUTION
NETWORK
A PRE-FEASIBILITY STUDY FOR DEEP SEAWATER AIRCONDITIONING SYSTEMS IN THE CARIBBEAN 11
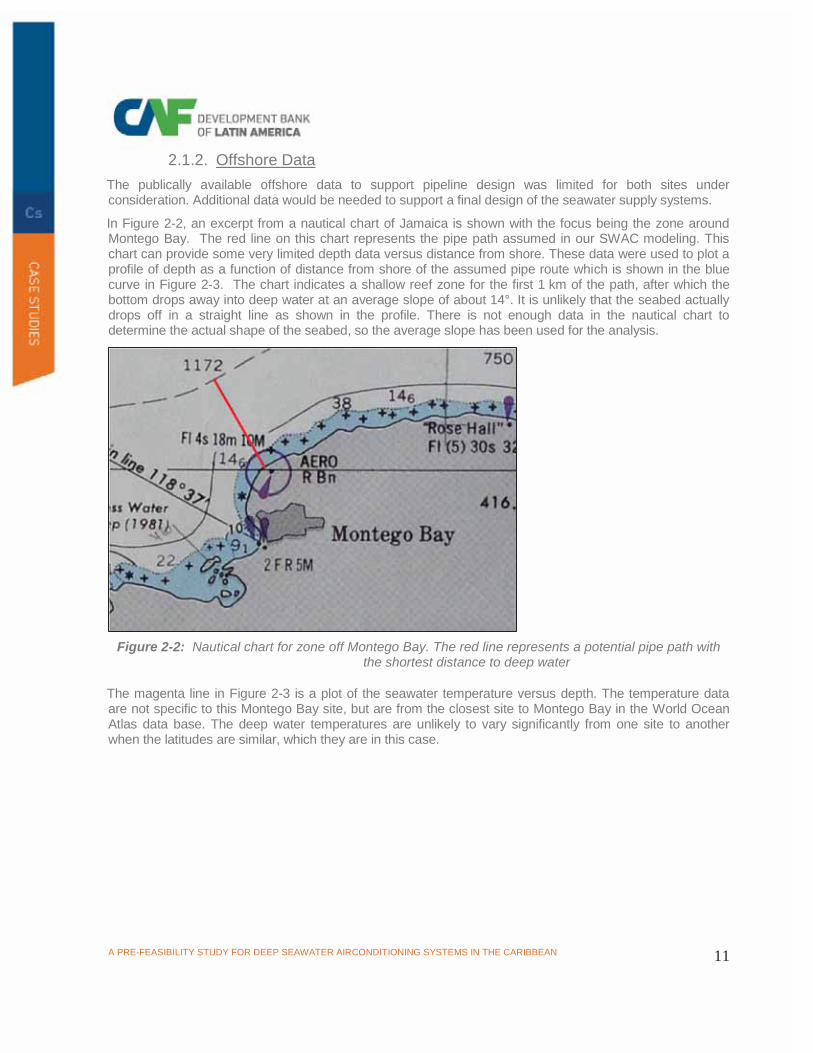
2.1.2. Offshore Data The publically available offshore data to support pipeline design was limited for both sites under consideration. Additional data would be needed to support a final design of the seawater supply systems.
In Figure 2-2, an excerpt from a nautical chart of Jamaica is shown with the focus being the zone around Montego Bay. The red line on this chart represents the pipe path assumed in our SWAC modeling. This chart can provide some very limited depth data versus distance from shore. These data were used to plot a profile of depth as a function of distance from shore of the assumed pipe route which is shown in the blue curve in Figure 2-3. The chart indicates a shallow reef zone for the first 1 km of the path, after which the bottom drops away into deep water at an average slope of about 14°. It is unlikely that the seabed actually drops off in a straight line as shown in the profile. There is not enough data in the nautical chart to determine the actual shape of the seabed, so the average slope has been used for the analysis.
Figure 2-2: Nautical chart for zone off Montego Bay. The red line represents a potential pipe path with
the shortest distance to deep water
The magenta line in Figure 2-3 is a plot of the seawater temperature versus depth. The temperature data are not specific to this Montego Bay site, but are from the closest site to Montego Bay in the World Ocean Atlas data base. The deep water temperatures are unlikely to vary significantly from one site to another when the latitudes are similar, which they are in this case.

A PRE-FEASIBILITY STUDY FOR DEEP SEAWATER AIRCONDITIONING SYSTEMS IN THE CARIBBEAN 12
Figure 2-3: Bathymetry and seawater temperature profiles used for Montego Bay
2.1.3. Optimization Several iterations of the SWAC model were run prior to determing the most economical solution. It was found that the Hilton Rose Hall, the Palmyra, and the Ritz-Carlton resorts do not contribute to SWAC system profitability. They are located too far from the seawater intake, and the cost of the distribution piping required to serve them exceeds the benefits from an economy of scale. Therefore those customers are not included in the results that follow.
Table 2-1 lists additional data obtained. Makai relied on the cooling load estimates developed during the preliminary analysis for the all other potential cooling customers.
Table 2-1: Additional Cooling Data Obtained for Montego Bay
Client Actual Installed Load (tons)
SWAC Load Used (tons)
Cooling Equipment
Holiday Inn Sunspree 500 500 Mini-split and Air Handling Units
Sunset Beach Resort 400 400 Mini-split and Air Handling Units
Half Moon Resort 600 600 Mini-splits, Air Handling Units, and Window Units
Hilton 800 533 Chilled Water
Of the three resorts that shared data, only the Hilton has a system that could be conveniently connected to a SWAC system without retrofit. The other three resorts will need to modify the cooling systems within their buildings to take advantage of a SWAC system. See section 6.3 for a discussion of the economic impact of building retrofit.
01002003004005006007008009001000
0 2 4 6 8 10 12 14 16 18 20 22 24 26 28 30 32
0
200
400
600
800
1000
1200
0 1000 2000 3000 4000 5000 6000
Dep
th, m
eter
s
Temperature, Deg C
Dep
th, m
eter
s
Distance, meters
Temperature & Bathymetry Profiles - Montego Bay Profile
Temperature
A PRE-FEASIBILITY STUDY FOR DEEP SEAWATER AIRCONDITIONING SYSTEMS IN THE CARIBBEAN 13
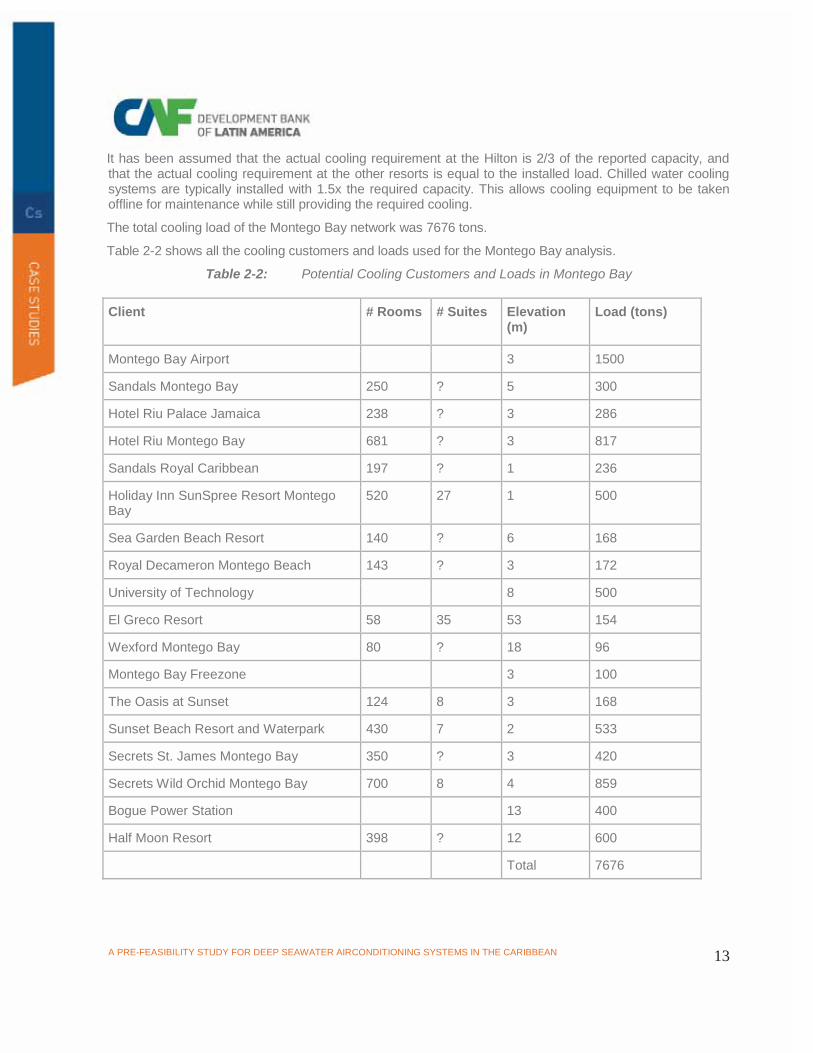
It has been assumed that the actual cooling requirement at the Hilton is 2/3 of the reported capacity, and that the actual cooling requirement at the other resorts is equal to the installed load. Chilled water cooling systems are typically installed with 1.5x the required capacity. This allows cooling equipment to be taken offline for maintenance while still providing the required cooling.
The total cooling load of the Montego Bay network was 7676 tons.
Table 2-2 shows all the cooling customers and loads used for the Montego Bay analysis.
Table 2-2: Potential Cooling Customers and Loads in Montego Bay
Client # Rooms # Suites Elevation (m)
Load (tons)
Montego Bay Airport 3 1500
Sandals Montego Bay 250 ? 5 300
Hotel Riu Palace Jamaica 238 ? 3 286
Hotel Riu Montego Bay 681 ? 3 817
Sandals Royal Caribbean 197 ? 1 236
Holiday Inn SunSpree Resort Montego Bay
520 27 1 500
Sea Garden Beach Resort 140 ? 6 168
Royal Decameron Montego Beach 143 ? 3 172
University of Technology 8 500
El Greco Resort 58 35 53 154
Wexford Montego Bay 80 ? 18 96
Montego Bay Freezone 3 100
The Oasis at Sunset 124 8 3 168
Sunset Beach Resort and Waterpark 430 7 2 533
Secrets St. James Montego Bay 350 ? 3 420
Secrets Wild Orchid Montego Bay 700 8 4 859
Bogue Power Station 13 400
Half Moon Resort 398 ? 12 600
Total 7676

A PRE-FEASIBILITY STUDY FOR DEEP SEAWATER AIRCONDITIONING SYSTEMS IN THE CARIBBEAN 14
2.2. PUERTO PLATA Puerto Plata is a dense resort area. A large number of luxury resorts are clustered in the Playa Dorada complex, with other resorts nearby. Similar to Montego Bay, most of the resorts are modern enough to make use of chilled water cooling systems and could connect to SWAC with minimal retrofit.
2.2.1. System Design The cold seawater intake pipe landing site was placed on the peninsula that houses the Playa Dorada complex near the highest density of cooling load. Figure 2-4 shows a schematic of the onshore network connecting all of the cooling loads and the landing site of the offshore pipe.
Figure 2-4. Onshore Cooling Network in Puerto Plata
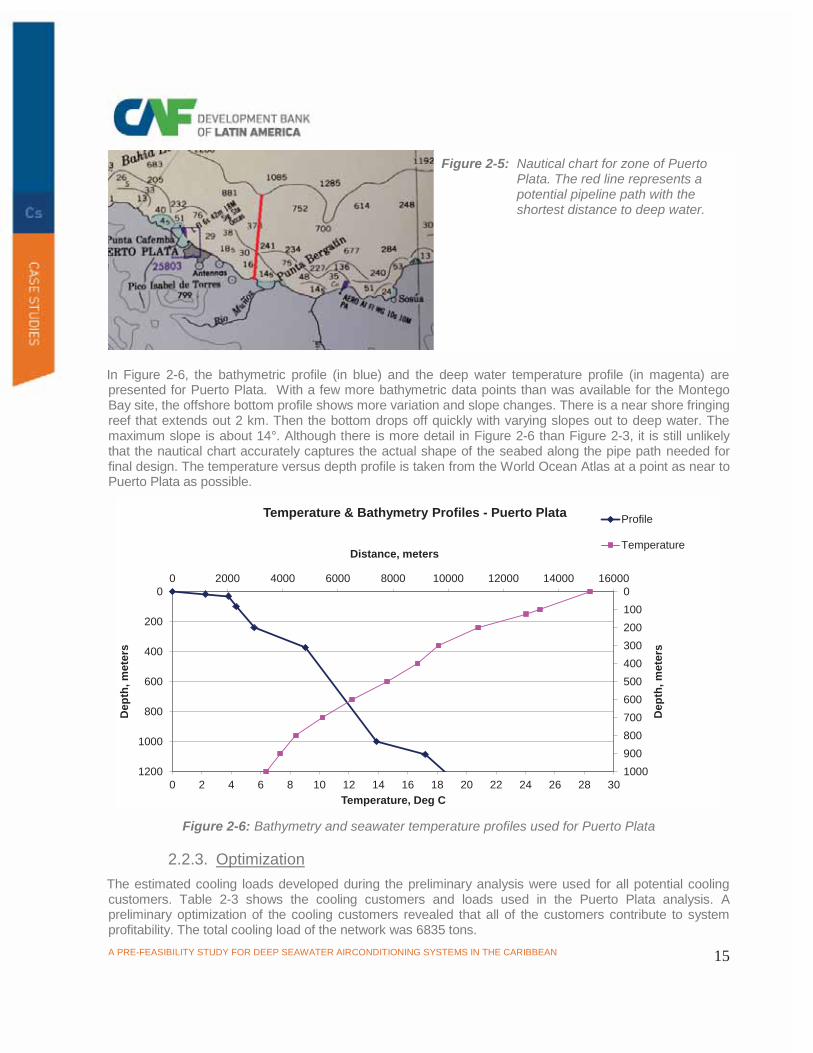
2.2.2. Offshore Data An excerpt from a nautical chart of the water around the Dominican Republic is shown in Figure 2-5. The red line is the pipeline alignment assumed in our modeling for this site. The alignment provides the shortest path to deep water from the selected shore crossing location.
OFFSHORE INTAKE
ONSHORE DISTRIBUTION
NETWORK
A PRE-FEASIBILITY STUDY FOR DEEP SEAWATER AIRCONDITIONING SYSTEMS IN THE CARIBBEAN 15
In Figure 2-6, the bathymetric profile (in blue) and the deep water temperature profile (in magenta) are presented for Puerto Plata. With a few more bathymetric data points than was available for the Montego Bay site, the offshore bottom profile shows more variation and slope changes. There is a near shore fringing reef that extends out 2 km. Then the bottom drops off quickly with varying slopes out to deep water. The maximum slope is about 14°. Although there is more detail in Figure 2-6 than Figure 2-3, it is still unlikely that the nautical chart accurately captures the actual shape of the seabed along the pipe path needed for final design. The temperature versus depth profile is taken from the World Ocean Atlas at a point as near to Puerto Plata as possible.
Figure 2-6: Bathymetry and seawater temperature profiles used for Puerto Plata
2.2.3. Optimization The estimated cooling loads developed during the preliminary analysis were used for all potential cooling customers. Table 2-3 shows the cooling customers and loads used in the Puerto Plata analysis. A preliminary optimization of the cooling customers revealed that all of the customers contribute to system profitability. The total cooling load of the network was 6835 tons.
01002003004005006007008009001000
0 2 4 6 8 10 12 14 16 18 20 22 24 26 28 30
0
200
400
600
800
1000
1200
0 2000 4000 6000 8000 10000 12000 14000 16000
Dep
th, m
eter
s
Temperature, Deg C
Dep
th, m
eter
s
Distance, meters
Temperature & Bathymetry Profiles - Puerto Plata Profile
Temperature
Figure 2-5: Nautical chart for zone of Puerto Plata. The red line represents a potential pipeline path with the shortest distance to deep water.

A PRE-FEASIBILITY STUDY FOR DEEP SEAWATER AIRCONDITIONING SYSTEMS IN THE CARIBBEAN 16
Table 2-3: Potential Cooling Customers and Loads in Puerto Plata
Client # Rooms # Suites
Estimated Load (tons)
Paradise Beach 280 145 685
Gran Ventana 167 173 615
Gran Ventana 2 166 0 200
Barcelo 386 199 940
Casa Colonial 0 50 120
Playa Dorada Mall 80 ? 100
Blue Bay Villas 0 245 440
Fun Royale 184 ? 220
Caribbean Village 336 ? 400
Dorada Club 206 ? 250
Celusima Playa Naco 200 14 515
Viva Wyndam 84 120 390
Puerto Plata Village 340 46 520
Blue Jack Tar Hotel 69 6 100
Iberostar 498 18 640
Be Live Grand Marien 584 ? 700
Total: 6835

A PRE-FEASIBILITY STUDY FOR DEEP SEAWATER AIRCONDITIONING SYSTEMS IN THE CARIBBEAN 17
3. MODELING RESULTS During a preliminary study (not shown in this report), it was found Montego Bay and Puerto Plata to be the lowest levelized cost sites of the 8 Caribbean sites chosen for study. This chapter describes the results from additional study of the Montego Bay and Puerto Plata sites. In the case of Montego Bay, the cooling customer loads were updated with the new information from Makai’s local contacts, summarized above in Table 2-2 and Table 2-3. At both sites a more detailed modeling effort was undertaken that included refined cooling curves (AC usage throughout the day), inclusion of hybrid SWAC (auxiliary chillers) and thermal energy storage systems, and sensitivity studies on varying electrical rates and assumed building loads.
3.1. MONTEGO BAY The detailed modeling in Montego Bay made use of updated cooling customer loads and adjusted cooling load curves. Makai also updated the cooling load curve for the Bogue Power Station, Airport, Freezone, and University of Technology. It was assumed that the cooling load for the power station is uniform throughout the day, and only varies seasonally. The cooling load for the other customers has been updated to reflect the fact that they are commercial businesses rather than resorts.
It was also considered two alternative SWAC system designs for Montego Bay: a hybrid SWAC system that makes use of chillers to augment seawater cooling, and the inclusion of a thermal energy storage tank. Neither option reduced the levelized cost of SWAC for the site, so they have not been included in the conceptual design or sensitivity studies for the site. See section 5.1.2 for a discussion of hybrid SWAC in Montego Bay, and section 5.1.3 for a discussion of thermal energy storage.
3.1.1. Technical Output Table 3-1 shows the technical details of the modeled system. The schematic shows the temperature, pressure, and water flow throughout the water distribution system. The technical output of Table 3-1 shows the specifications and operating conditions of the major SWAC components including the offshore pipe dimensions, pump station parameters, heat exchangers, and the freshwater distribution piping. A SWAC system in Montego Bay requires a seawater intake pipe that is 1200 mm in diameter, 4.5 km long, and reaches to 879 m water depth. The discharge pipe is 1000 mm in diameter and 1.1 km long in order to reach 50 m water depth. The seawater pump station must be excavated such that the pumps can be located 2.2 m below sea level. Table 3-1 has been abbreviated for public release.

A PRE-FEASIBILITY STUDY FOR DEEP SEAWATER AIRCONDITIONING SYSTEMS IN THE CARIBBEAN 18
Table 3-1: Technical Results of SWAC Modeling for Montego Bay (abbreviated for public release)

A PRE-FEASIBILITY STUDY FOR DEEP SEAWATER AIRCONDITIONING SYSTEMS IN THE CARIBBEAN 19
3.1.2. Costs A detailed cost breakdown was computed for the various sub-systems and installation steps of the SWAC system. The cost estimates were then used to perform a levelized cost analysis, indicating the lifetime costs for the project in units of cost per year per ton of cooling in present value. When comparing two or more scenarios, the one with the lowest levelized cost is generally taken as the most economical.
Table 3-2 summarizes the levelized costs for the SWAC system.
Table 3-2: Summary of Levelized Cost for a SWAC System in Montego Bay
The levelized cost for SWAC was estimated to be $3458/ton/year. This represents an increase in cost from the $3386/ton/year previsouly report to CAF in a preliminary analysis due to a decrease from 5029 tons to 4732 tons of cooling load. The decrease in load was caused by a combination of updated loads for the Holiday Inn Sunspree, Sunset Beach Resort and Waterpark, and Halfmoon Resort; and changes to the load curves for the Airport, Freezone, and University. Since the commercial load curve has lower nighttime loads than the resort curve, the annual average cooling consumed by these buildings was reduced. The uniform load applied to the Bogue power station helped offset the reduction.
The levelized cost of SWAC in Montego Bay indicates that it is still a good candidate site for SWAC development. The levelized cost of Conventional AC has been estimated at $5247/ton/year. Thus, the cost of cooling from seawater is 34% less than that of conventional cooling.
Table 3-3 summarizes the capital costs of the SWAC system.
Cost SummarySystem Specifications
Peak AC Load (Tons) 7,676Average AC Load (Tons) 4,732Cost of Electricity ($/kW-h) 0.36
Levelized Cost ($/ton/year)SWAC Capital Cost 2,235SWAC Operating Cost 1,140SWAC Periodic Costs 82SWAC Total 3,458
Conventional AC 5,247
A PRE-FEASIBILITY STUDY FOR DEEP SEAWATER AIRCONDITIONING SYSTEMS IN THE CARIBBEAN 20
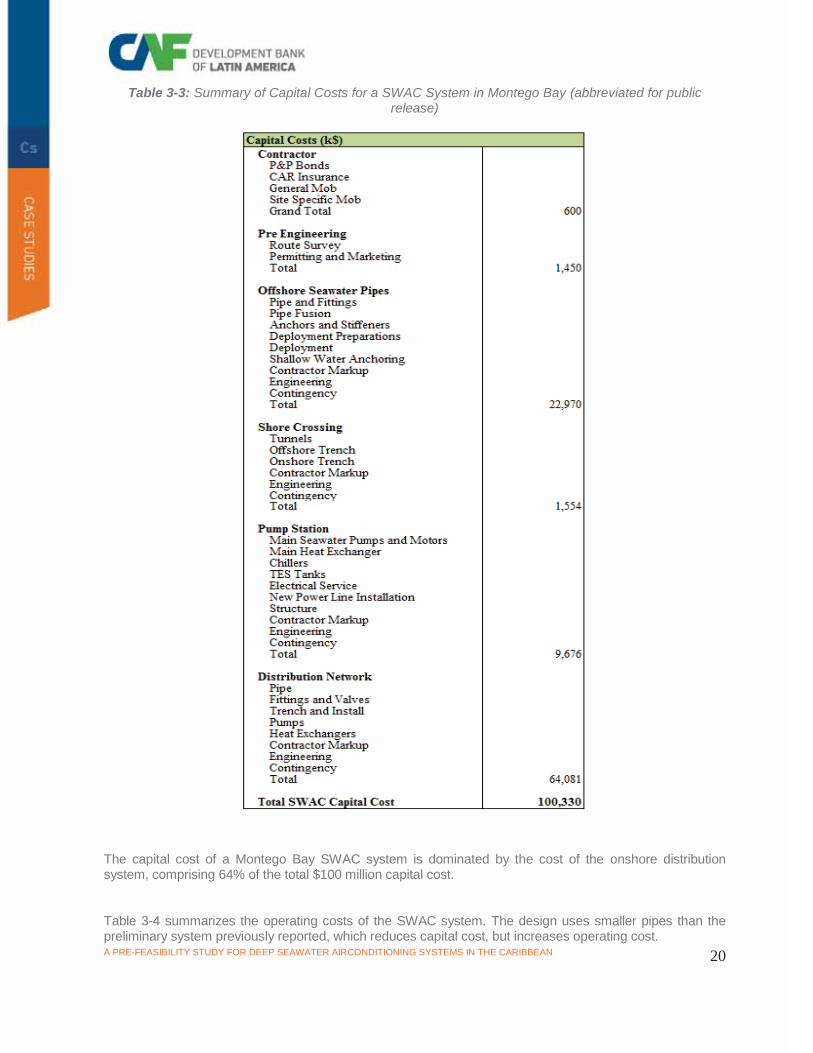
Table 3-3: Summary of Capital Costs for a SWAC System in Montego Bay (abbreviated for public release)
The capital cost of a Montego Bay SWAC system is dominated by the cost of the onshore distribution system, comprising 64% of the total $100 million capital cost.
Table 3-4 summarizes the operating costs of the SWAC system. The design uses smaller pipes than the preliminary system previously reported, which reduces capital cost, but increases operating cost.

A PRE-FEASIBILITY STUDY FOR DEEP SEAWATER AIRCONDITIONING SYSTEMS IN THE CARIBBEAN 21
Table 3-4: Summary of Operating Cost of a SWAC System in Montego Bay (abbreviated for public release)
Table 3-5 summarizes the cost of conventional air conditioning in Montego Bay. The operating cost for conventional cooling is 4.4 times higher than that for SWAC, with over $20 million per year spent on electricity. A simple payback period for the SWAC system can be calculated by dividing the SWAC system capital cost by the savings in operating cost between SWAC and conventional cooling. The simple payback period is 6 years.
Table 3-5: Summary of Conventional Air Conditioning Costs in Montego Bay
3.2. PUERTO PLATA Two alternative SWAC system designs were considered as part of the SWAC analysis for Puerto Plata: a hybrid SWAC system that uses chillers to augment the seawater cooling, and inclusion of a thermal energy
Conventional Air Conditioning
Total Conv. AC Capital Costs (k$) 12,090Annual Conventional AC Costs (k$/year)
Electricity 20,892Water/Sewage 0Personnel 319Maintenance Contract 115Administration and Overhead 38
Total Conv. AC Operating Costs 21,710

A PRE-FEASIBILITY STUDY FOR DEEP SEAWATER AIRCONDITIONING SYSTEMS IN THE CARIBBEAN 22
storage system. The hybrid SWAC system was of no economic benefit but inclusion of thermal energy storage did reduce the levelized cost of SWAC cooling. See section 5.2.3 for a discussion of hybrid SWAC in Puerto Plata, and section 5.2.4 for a discussion of thermal energy storage.
3.2.1. Technical Output Table 3-6 shows the technical details of the modeled system. The schematic shows the temperature, pressure, and water flow throughout the system.
As described in sections 5.1.3 and 5.2.4, the thermal energy storage system will store cold water during off-peak hours, and supply the water back into the system during peak cooling hours. This enables the SWAC cold water intake and district cooling system to be designed for less than peak load.

A PRE-FEASIBILITY STUDY FOR DEEP SEAWATER AIRCONDITIONING SYSTEMS IN THE CARIBBEAN 23
Table 3-6: Technical Results of SWAC Modeling for Puerto Plata (abbreviated for public release)
A SWAC system in Puerto Plata requires a seawater intake pipe that is 1100 mm in diameter, 8.0 km long, and reaches to 1082 m water depth. This pipe is 200mm smaller and 200m longer than that from the

A PRE-FEASIBILITY STUDY FOR DEEP SEAWATER AIRCONDITIONING SYSTEMS IN THE CARIBBEAN 24
preliminary analysis of Puerto Plata. Use of thermal energy storage reduces the seawater flow rate, but requires colder seawater. The discharge pipe is 800 mm in diameter and 2.2 km long in order to reach 50 m water depth. The seawater pump station must be excavated such that the pumps can be located 3.1 m below sea level.
The cold water intake pipe in Puerto Plata must reach approximately 200 m deeper than those at other sites. This is because the seawater off the north coast of the Dominican Republic is warmer than that elsewhere.
3.2.2. Costs Table 3-7 summarizes the levelized cost of the SWAC system.
Table 3-7: Summary of Levelized Cost for a SWAC System in Puerto Plata
The levelized cost of SWAC is 48% less than that of conventional cooling at $2435/ton/year compared to $4,691/ton/year, respectively. Puerto Plata is a good candidate for SWAC development.
Table 3-8 summarizes the capital cost of the SWAC system. The onshore distribution system is more compact than Montego Bay, accounting for approximately 25% of the $68.4 million capital cost. The offshore pipe accounts for approximately 50% of the capital cost.
Cost SummarySystem Specifications
Peak AC Load (Tons) 6,835Average AC Load (Tons) 4,438Cost of Electricity ($/kW-h) 0.32
Levelized Cost (k$/ton/year)SWAC Capital Cost 1,626SWAC Operating Cost 748SWAC Periodic Costs 61SWAC Total 2,435
Conventional AC 4,691

A PRE-FEASIBILITY STUDY FOR DEEP SEAWATER AIRCONDITIONING SYSTEMS IN THE CARIBBEAN 25
Table 3-8: Summary of Capital Costs for a SWAC System in Puerto Plata (abbreviated for public release)

A PRE-FEASIBILITY STUDY FOR DEEP SEAWATER AIRCONDITIONING SYSTEMS IN THE CARIBBEAN 26
Table 3-9 summarizes the operating costs of the SWAC system. The majority of the operating cost is electricity for running the seawater and chilled water pumps, comprising 63% of the total operating cost.
Table 3-9: Summary of Operating Cost of a SWAC System in Puerto Plata (abbreviated for public release)
Table 3-10 summarizes the cost of conventional air conditioning in Puerto Plata.
Table 3-10: Summary of Conventional Air Conditioning Costs in Puerto Plata
Conventional Air Conditioning(k$)
Total Conv. AC Capital Costs 10,765Annual Conventional AC Costs (k$/year)
Electricity 17,416Water/Sewage 0Personnel 284Maintenance Contract 103Administration and Overhead 34
Total Conv. AC Operating Costs 18,145

A PRE-FEASIBILITY STUDY FOR DEEP SEAWATER AIRCONDITIONING SYSTEMS IN THE CARIBBEAN 27
The operating cost for conventional cooling is 5.9 times higher than that for SWAC with over $17 million/year for electricity. A simple payback period for the SWAC system can be calculated by dividing the SWAC system capital cost by the savings in operating cost between SWAC and conventional cooling. The simple payback period is 4.5 years.

A PRE-FEASIBILITY STUDY FOR DEEP SEAWATER AIRCONDITIONING SYSTEMS IN THE CARIBBEAN 28
4. SWAC SYSTEM CONCEPTUAL DESIGN This chapter describes a much abbreviated conceptual design for the SWAC seawater supply systems at Montego Bay and Puerto Plata. The conceptual design includes additional information on pipeline assembly and installation, pump station consturction and equipment, heat exchangers, and onshore distribution. A more detailed preliminary design was completed by Makai but, due to inclusion of proprietary design details, was omitted for public release of this report.
4.1. OVERVIEW The SWAC system is comprised of three major sub-systems: a seawater supply system, heat exchangers, and a chilled water distribution loop. Figure 4-1 shows a schematic of the typical SWAC system (without auxiliary chillers or thermal energy storage). The figure shows the cold water intake pipe, pump station, and discharge pipe that comprise the seawater supply system. A freshwater chilled loop supplies water to the buildings. The freshwater loop is continually cooled by passing through a heat exchanger with the cold seawater in a closed loop configuration.
The seawater is drawn up from deep water, typically at a temperature below 7.0oC, through a flexible intake pipeline. Makai designs the SWAC intakes using high density polyethylene pipe, or HDPE. HDPE pipe has several advantages over alternative materials. HDPE is strong, durable, flexible, and cost effective. The HDPE pipe is ballasted using a variety of concrete weight designs, most commonly a variation of concrete anchor clamped tight around the HDPE pipe.
The intake pipe transmits seawater across the shoreline through a buried section of pipe in either a trench or tunnel. Tunnels are typically constructed using micro-tunneling or horizontal directional drilling technologies, depending on the diameter of pipe. For the cost analysis at Montego Bay and Puerto Plata a trenched pipe has been assumed.
Figure 4-1:Schematic showing major components of a SWAC system (right) compared to conventional
AC (left)

A PRE-FEASIBILITY STUDY FOR DEEP SEAWATER AIRCONDITIONING SYSTEMS IN THE CARIBBEAN 29
The offshore pipeline, from the buried shore-crossing out to the deep water intake, is installed in two steps; assembly and submergence. During assembly the HDPE pipeline and ballast anchors are staged in a harbor or similarly calm staging site with good access. Segments of HDPE pipe are fused together and anchors are added to the fused pipe sections (see Figure 4-2). Once assembled the longer pipeline segments are flanged together and towed in a single length to the selected alignment, where it is then installed on the seafloor using the controlled submergence process (see Figure 4-3). Once on-site, the controlled submergence occurs in less than a single 24 hour period. Generally, the ballast anchoring is enough to stabilize and resist hydrodynamic motion of the pipe on the seafloor. In nearshore zones, where wave and currents can create large forces on the pipe (typically <50m depth), additional post-deployment anchors are required which fix the pipe to the seafloor. A variety of embedment and rock-bolt anchoring options exist depending on the condition of the seabed. These anchors are typically installed with divers. Based on the anticipated wave heights at Puerto Plata and Montego Bay some additional anchoring in depths less than 50m would be required.
Once installed, the offshore seawater HDPE intake pipe is operated as a suction pipe. Seawater is pumped up through the pipe by pumps located in an onshore sump. The pump station is typically designed using either a wet or dry sump. The pump sumps must be installed deep enough to account for the total head loss in the offshore intake pipe. For Montego Bay and Puerto Plata, a proprietary wet sump station design was assumed. The design uses a combination of novel installation methods and standard construction materials to reduce pump station costs. Figure 4-4 shows an existing pump station located at the Natural Energy Laboratory Authority of Hawai`i (NELHA). This particular pump station is a wet sump design, and services a 1.4m diameter cold water intake pipe, similar to the pump stations that would be appropriate for Montego Bay and Puerto Plata.
Figure 4-2: HDPE fusion used to join two lengths of pipe during the assembly process.
Figure 4-3: Controlled submergence of an HDPE pipe designed by Makai.

A PRE-FEASIBILITY STUDY FOR DEEP SEAWATER AIRCONDITIONING SYSTEMS IN THE CARIBBEAN 30
Leaving the pump station, the cold seawater flows through a heat exchanger where heat is transferred from the warmed freshwater flow of the onshore distribution. The heat exchangers must be constructed of marine grade materials to resist corrosion. Entrapment of sealife in the heat exchangers is mitigated by the use of a coarse strainer to filter the seawater prior to the heat exchangers.
The selection of the heat exchanger is critical to the SWAC system and impacts the total cost and operating efficiencies of the SWAC system. For example, a change in the total surface area or performance of the heat exchanger will change the amount of cooling provided from the seawater, which in turn may increase the amount of total flow required. A change in total flow will impact the design of the onshore and offshore pipe systems, as well as the pump station. The Makai SWAC model iterates on the design and incorporates these inter-dependencies to specify the components that provide the lowest overall system cost. The size and type of heat exchangers assumed in this study are those which have provided a lowest estimated levelized cost for the system.
After flowing through the heat exchanger the warmed seawater is then discharged back into the ocean at a depth shallower than the intake. For this preliminary analysis it was assumed a discharge at the depth of 50m. At this depth, the returned seawater would still be several degrees cooler than the relatively shallow ambient waters where it is discharged. The actual depth selected will depend on more detailed local site conditions, environmental regulations, and diffuser dispersion modeling.
The chilled water distribution takes the cold chilled (fresh) water from the SWAC heat exchanger and supplies it to each cooling customer on the network. It also collects the warmed water that has expended its useful cooling capacity and returns it to the heat exchanger for re-cooling. The freshwater distribution is a closed-loop system. It was assumed that all distribution pipes are insulated to prevent heat infiltration from the ground in which the pipes are buried.
4.2. DISTRIBUTION SYSTEM LAYOUT Makai laid out conceptual distribution piping networks during the preliminary phase of this study. The distribution layouts were reviewed during the analysis described in this report, but no changes were made. Figure 4-5 shows the distribution piping layout in Montego Bay, and Figure 4-6 shows the layout in Puerto Plata.
Figure 4-4: Aerial image of the NELHA sump-style pump station, located in Kona, HI, USA.

A PRE-FEASIBILITY STUDY FOR DEEP SEAWATER AIRCONDITIONING SYSTEMS IN THE CARIBBEAN 31
Figure 4-5: Conceptual Distribution Piping Layout in Montego Bay
The distribution pipe design assumes that the cold water intake pipe can be brought ashore and connected to a pump station near the airport. This places the pump station near the center of the distribution system. The effect is that the distribution is split into eastern and western portions. This minimizes the size of the distribution pipes that must be installed; if the pump station were located at the east end of the distribution system (near the Holiday Inn Sunspree), then the distribution piping would have to be large enough to serve the entire network. With a centrally located pump station, the distribution piping that goes east is sized to meet the eastern load, while the piping that goes west is sized to meet the western load – no pipes are required to carry the full SWAC flow outside the pump station.
The Puerto Plata distribution system is extremely compact; most of the potential customers lie within the Playa Dorada complex. The pump station was located in an open space near the shore. It could be located anywhere on the shoreline of the Playa Dorada complex with little impact on the distribution system design. The analysis was repeated to determine if the Be Live Grand Marien and Iberostar resorts should be included in the SWAC system. Including them reduces the total levelized cost of the system, which means that the revenue obtained is enough to pay for the additional distribution piping required to reach them.
A PRE-FEASIBILITY STUDY FOR DEEP SEAWATER AIRCONDITIONING SYSTEMS IN THE CARIBBEAN 32
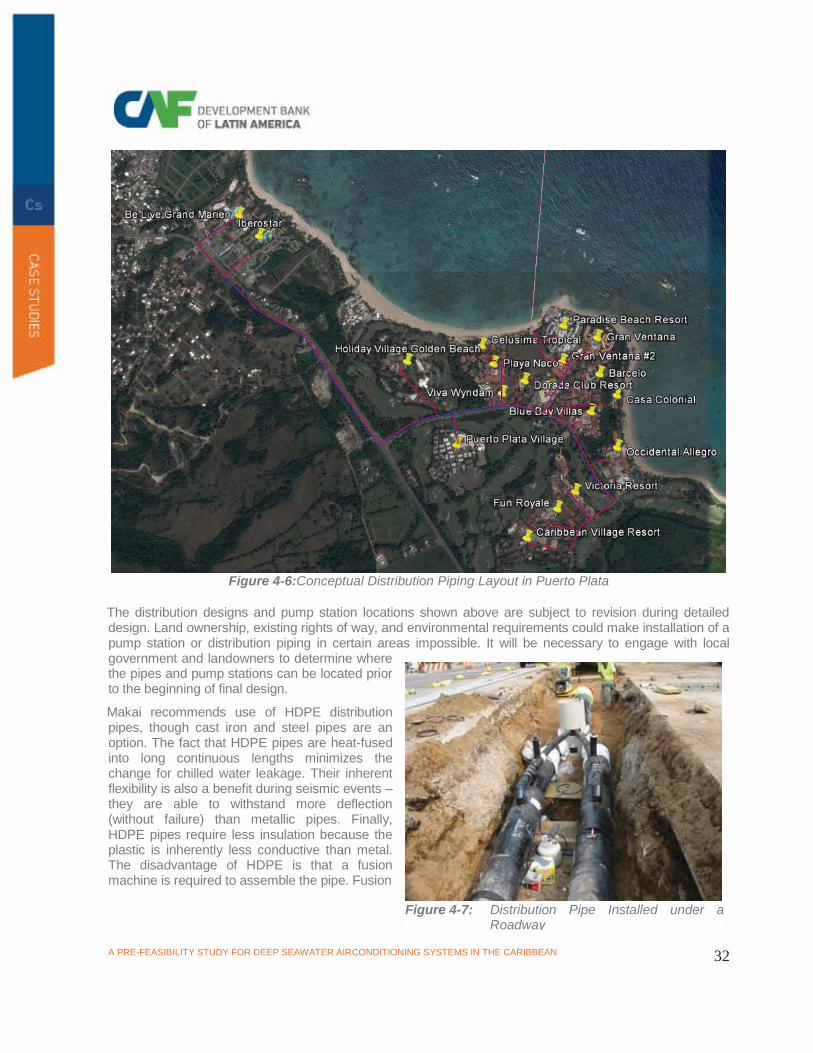
Figure 4-6:Conceptual Distribution Piping Layout in Puerto Plata
The distribution designs and pump station locations shown above are subject to revision during detailed design. Land ownership, existing rights of way, and environmental requirements could make installation of a pump station or distribution piping in certain areas impossible. It will be necessary to engage with local government and landowners to determine where the pipes and pump stations can be located prior to the beginning of final design.
Makai recommends use of HDPE distribution pipes, though cast iron and steel pipes are an option. The fact that HDPE pipes are heat-fused into long continuous lengths minimizes the change for chilled water leakage. Their inherent flexibility is also a benefit during seismic events – they are able to withstand more deflection (without failure) than metallic pipes. Finally, HDPE pipes require less insulation because the plastic is inherently less conductive than metal. The disadvantage of HDPE is that a fusion machine is required to assemble the pipe. Fusion
Figure 4-7: Distribution Pipe Installed under a Roadway

A PRE-FEASIBILITY STUDY FOR DEEP SEAWATER AIRCONDITIONING SYSTEMS IN THE CARIBBEAN 33
machines are larger than welding equipment, and require more specialized operators. Rigorous selection of the distribution piping material is part of the final design process.
Distribution pipes are typically installed in a trench below the surface of the ground. Supply and return pipes are laid parallel in the same trench. In urban environments, it is typically necessary to install the distribution pipes underneath roadways.
The overlying road was removed and the trench opened. After the pipes are installed the trench will be backfilled and the road repaved. To minimize the cost for trenching, the pipes should be installed as shallow as possible. The minimum cover varies depending on the street surface construction, the traffic load, and local construction codes, but a minimum of 2 feet is often acceptable. Figure 4-8 shows a schematic of a completely installed pair of distribution pipes, including refinishing of the original surface.
Figure 4-8: Typical closed loop trench connection
The space underneath roads is a common location for installation of utilities, and there may be other pipes for water, sewer, natural gas, or electrical conduits already in place. The SWAC distribution pipe installation process will need to take these other utilities into account. It is likely that the pipes will need to be installed without interrupting the service of the existing utilities. This is a common requirement, and pipe installation contractors are familiar with the techniques required to work around existing pipes. Figure 4-9 shows the installation of distribution pipes around existing utilities.

A PRE-FEASIBILITY STUDY FOR DEEP SEAWATER AIRCONDITIONING SYSTEMS IN THE CARIBBEAN 34
Figure 4-9: Installation of Distribution Pipe around Existing Utilities
An alternative to the open trench approach shown above is horizontal directional drilling. Directional drilling pushes pipe into the ground without the need to dig up the entire pipe path. The benefit is that current use of the space above the pipe path (e.g. – road traffic) may not be impeded during construction. Drilling requires detailed knowledge of the precise locations of existing utilities, as well as the geological characteristics of the area. The final selection of distribution pipe installation typically depends on local environmental requirements or government requirements that traffic not be impeded, and is usually determined during final design.

A PRE-FEASIBILITY STUDY FOR DEEP SEAWATER AIRCONDITIONING SYSTEMS IN THE CARIBBEAN 35
5. SENSITIVITY ANALYSIS Makai used the SWAC model to perform sensitivity studies on the effect of electrical rate, cooling load, hybrid SWAC, and thermal energy storage tank (TES) capacity on the levelized cost of SWAC systems in Montego Bay and Puerto Plata. The electrical rate and cooling load sensitivity studies provide insight into how those elements impact the economic viability of the SWAC system. The hybrid SWAC and TES capacity studies investigate the effects of alternative design concepts on levelized cost.
The sections below include a variety of technical and cost output tables from the SWAC model. In order to present the results of each sensitivity study within a single table, some parts of the output have been omitted compared to the tables presented in sections 3.1 and 3.2. Those portions that have been omitted are unchanged by the sensitivity study, and therefore are not needed to understand the results. Some tabulated data has also been abbreivated for the public release of this report.
5.1. MONTEGO BAY
5.1.1. Electrical Cost A sensitivity study of electrical rate reveals how changes in the cost of electricity impact the relative economics of SWAC and conventional cooling. The economic module of the SWAC model was exercised for a variety of electrical rates centered about the current cost of $0.36/kW-hr. Figure 5-1 shows the resulting levelized cost ($/ton/year) of SWAC and conventional AC as a function of varying electrical rates ($/kW-hr).
Figure 5-1: Comparison of the Effect of Electrical Rate on SWAC (blue) and Conventional AC (red) in
Montego Bay in levelized cost units of $/ton/year.
The levelized cost of conventional air conditioning is much more sensitive to electrical rate than is SWAC, as seen by the steeper slope on the red area than the blue area in Figure 5-1. This is due to the fact that the
0
1,000
2,000
3,000
4,000
5,000
6,000
7,000
0.25 0.27 0.29 0.31 0.33 0.35 0.37 0.39 0.41 0.43 0.45
Leve
lized
Cos
t ($/
ton/
year
)
Electrical Rate ($/kW-hr)
Levelized Cost vs. Electrical Rate Conventional AC
SWAC

A PRE-FEASIBILITY STUDY FOR DEEP SEAWATER AIRCONDITIONING SYSTEMS IN THE CARIBBEAN 36
majority of the cost of SWAC is in capital – only a small portion of the lifecycle cost is due to the electrical cost to operate the pumps. In contrast, the majority of the lifecycle cost of conventional air conditioning goes to electricity to operate the chillers. The above relationships mean that SWAC is favored when electrical rates are high, and conventional cooling is favored when electrical rates are low. The cost of electricity in Montego Bay is high enough the levelized cost of SWAC does not exceed that of conventional cooling within the bounds of the sensitivity study.
Table 5-1 shows the detailed economic output of the sensitivity study.
Cooling capital cost is unaffected by electrical rate, and the SWAC operating cost rises more slowly than the conventional cooling operating cost. The maximum electrical rate considered ($0.45/kW-hr) represents an 80% increase in electrical cost over the minimum rate ($0.25/kW-hr). SWAC operating costs rise 59% over this range, while conventional cooling costs rise 76%. The magnitude of the difference is significant, with SWAC operating costs rising by $2.2 million while conventional cooling cost rises by $11.6 million. The simple payback period for SWAC varies from 8.7 years at the minimum electrical rate to 4.8 years at the maximum rate.
5.1.1. Cooling Load SWAC system economics are sensitive to total system size. Larger SWAC systems are more economically viable than smaller SWAC systems. The fact that the cooling loads in Montego Bay are mostly estimates, and the fact that the cooling equipment in use is unknown for most potential customers, means that there is a large uncertainty in the actual cooling load available for connection to SWAC. To determine the impact of the uncertainty on the SWAC viability, a sensitivity study on load factor was carried out. Load factor is a ratio between actual cooling load and expected cooling load. A load factor of 0.5 means that all cooling loads connected to the system are 50% of the expected values. Varying load factor allows the SWAC model to investigate a variety of system sizes. The extent of the distribution system is constant for each system size, but the diameter of distribution and offshore pipes used is varied as the chilled water flow rate varies. The onshore pipe diameters are not optimized for each load factor, so the levelized cost at a load factor of 1.0 is slightly higher than that shown in
Table 3-2.
.

A PRE-FEASIBILITY STUDY FOR DEEP SEAWATER AIRCONDITIONING SYSTEMS IN THE CARIBBEAN 37
Table 5-1: Cost Output of Montego Bay Electrical Rate Sensitivity Study
Figure 5-2 (following page) shows the impact of load factor on SWAC levelized cost
Cost SummarySystem Specifications
Parameter: Electrical Rate ($/kWh) 0.25 0.26 0.27 0.28 0.29 0.30 0.31 0.32 0.33 0.34 0.35 0.36 0.37 0.38 0.39 0.40 0.41 0.42 0.43 0.44 0.45Peak AC Load (Tons) 7,676 7,676 7,676 7,676 7,676 7,676 7,676 7,676 7,676 7,676 7,676 7,676 7,676 7,676 7,676 7,676 7,676 7,676 7,676 7,676 7,676Average AC Load (Tons) 4,732 4,732 4,732 4,732 4,732 4,732 4,732 4,732 4,732 4,732 4,732 4,732 4,732 4,732 4,732 4,732 4,732 4,732 4,732 4,732 4,732Cost of Electricity ($/kW-h) 0.25 0.26 0.27 0.28 0.29 0.30 0.31 0.32 0.33 0.34 0.35 0.36 0.37 0.38 0.39 0.40 0.41 0.42 0.43 0.44 0.45
Levelized CostSWAC Capital Cost 2,235 2,235 2,235 2,235 2,235 2,235 2,235 2,235 2,235 2,235 2,235 2,235 2,235 2,235 2,235 2,235 2,235 2,235 2,235 2,235 2,235SWAC Operating Cost 861 886 912 937 962 988 1,013 1,038 1,064 1,089 1,114 1,140 1,165 1,191 1,216 1,241 1,267 1,292 1,317 1,343 1,368SWAC Periodic Costs 82 82 82 82 82 82 82 82 82 82 82 82 82 82 82 82 82 82 82 82 82SWAC Total 3,179 3,204 3,229 3,255 3,280 3,305 3,331 3,356 3,381 3,407 3,432 3,458 3,483 3,508 3,534 3,559 3,584 3,610 3,635 3,660 3,686
Conventional AC 3,783 3,916 4,049 4,182 4,315 4,448 4,581 4,714 4,848 4,981 5,114 5,247 5,380 5,513 5,646 5,779 5,912 6,045 6,178 6,311 6,444
Capital CostsTotal SWAC Capital Cost 100,330 100,330 100,330 100,330 100,330 100,330 100,330 100,330 100,330 100,330 100,330 100,330 100,330 100,330 100,330 100,330 100,330 100,330 100,330 100,330 100,330
Operating CostPumps
Electricity 2,765 2,875 2,986 3,096 3,207 3,318 3,428 3,539 3,649 3,760 3,871 3,981 4,092 4,202 4,313 4,424 4,534 4,645 4,755 4,866 4,976Maintenance 2 2 2 2 2 2 2 2 2 2 2 2 2 2 2 2 2 2 2 2 2Personnel 65 65 65 65 65 65 65 65 65 65 65 65 65 65 65 65 65 65 65 65 65Subtotal 2,832 2,943 3,053 3,164 3,275 3,385 3,496 3,606 3,717 3,828 3,938 4,049 4,159 4,270 4,381 4,491 4,602 4,712 4,823 4,933 5,044
Total Operating Cost 3,755 3,866 3,976 4,087 4,198 4,308 4,419 4,529 4,640 4,751 4,861 4,972 5,082 5,193 5,304 5,414 5,525 5,635 5,746 5,857 5,967
Conventional Air Conditioning
Total Conv. AC Capital Costs 12,090 12,090 12,090 12,090 12,090 12,090 12,090 12,090 12,090 12,090 12,090 12,090 12,090 12,090 12,090 12,090 12,090 12,090 12,090 12,090 12,090Annual Conventional AC Costs
Electricity 14,508 15,089 15,669 16,249 16,830 17,410 17,990 18,571 19,151 19,731 20,312 20,892 21,472 22,053 22,633 23,213 23,794 24,374 24,954 25,535 26,115Water/Sewage 0 0 0 0 0 0 0 0 0 0 0 0 0 0 0 0 0 0 0 0 0Personnel 319 319 319 319 319 319 319 319 319 319 319 319 319 319 319 319 319 319 319 319 319Maintenance Contract 115 115 115 115 115 115 115 115 115 115 115 115 115 115 115 115 115 115 115 115 115Administration and Overhead 38 38 38 38 38 38 38 38 38 38 38 38 38 38 38 38 38 38 38 38 38
Total Conv. AC Operating Costs 15,327 15,907 16,487 17,068 17,648 18,228 18,809 19,389 19,969 20,550 21,130 21,710 22,291 22,871 23,451 24,032 24,612 25,192 25,773 26,353 26,933
A PRE-FEASIBILITY STUDY FOR DEEP SEAWATER AIRCONDITIONING SYSTEMS IN THE CARIBBEAN 38
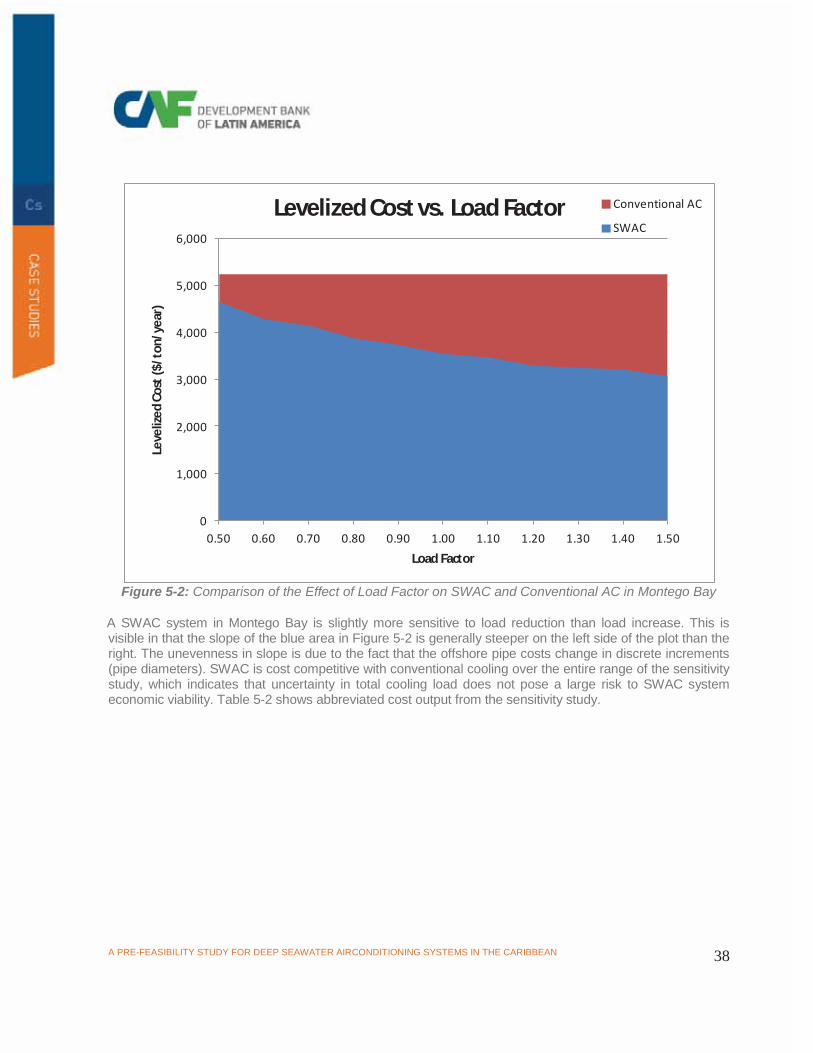
Figure 5-2: Comparison of the Effect of Load Factor on SWAC and Conventional AC in Montego Bay
A SWAC system in Montego Bay is slightly more sensitive to load reduction than load increase. This is visible in that the slope of the blue area in Figure 5-2 is generally steeper on the left side of the plot than the right. The unevenness in slope is due to the fact that the offshore pipe costs change in discrete increments (pipe diameters). SWAC is cost competitive with conventional cooling over the entire range of the sensitivity study, which indicates that uncertainty in total cooling load does not pose a large risk to SWAC system economic viability. Table 5-2 shows abbreviated cost output from the sensitivity study.
0
1,000
2,000
3,000
4,000
5,000
6,000
0.50 0.60 0.70 0.80 0.90 1.00 1.10 1.20 1.30 1.40 1.50
Leve
lized
Cos
t ($/
ton/
year
)
Load Factor
Levelized Cost vs. Load Factor Conventional AC
SWAC

A PRE-FEASIBILITY STUDY FOR DEEP SEAWATER AIRCONDITIONING SYSTEMS IN THE CARIBBEAN 39
Table 5-2: Cost Output of Montego Bay Load Factor Sensitivity Study (abbreviated for public release)
The levelized cost of conventional cooling is unaffected by changes in load factor. This is because both the capital and operating costs of conventional cooling scale linearly with cooling load. SWAC, however, exhibits an economy of scale; both capital and operating costs rise more slowly with increasing load. The maximum cooling load (150% of the expected load) represents a 300% increase over the minimum cooling load (50% of the expected load). Over this range, SWAC capital costs increase by 203%, and SWAC operating costs increase by 196%. Conventional cooling capital cost and operating cost increases by 300%. The simple payback period varies from 8.9 years at the minimum load to 5.2 years at the maximum load.
Table 5-3 shows the technical differences in SWAC system design for the different load factors.
Cost SummarySystem Specifications
Parameter: Load Factor 0.50 0.60 0.70 0.80 0.90 1.00 1.10 1.20 1.30 1.40 1.50Peak AC Load (Tons) 3,838 4,606 5,373 6,141 6,908 7,676 8,444 9,211 9,979 10,746 11,514Average AC Load (Tons) 2,366 2,839 3,312 3,786 4,259 4,732 5,205 5,678 6,152 6,625 7,098Cost of Electricity ($/kW-h) 0.36 0.36 0.36 0.36 0.36 0.36 0.36 0.36 0.36 0.36 0.36
Levelized CostSWAC Capital Cost 3,009 2,845 2,745 2,564 2,439 2,375 2,332 2,219 2,148 2,145 2,039SWAC Operating Cost 1,486 1,310 1,284 1,212 1,201 1,086 1,058 1,004 1,030 1,002 970SWAC Periodic Costs 149 126 111 99 90 82 75 70 66 62 59SWAC Total 4,645 4,281 4,140 3,875 3,730 3,542 3,466 3,293 3,244 3,210 3,068
Conventional AC 5,247 5,247 5,247 5,247 5,247 5,247 5,247 5,247 5,247 5,247 5,247
Capital CostsOffshore Seawater Pipes
Total 15,684 18,216 21,686 21,884 22,779 22,971 24,099 24,292 24,391 25,516 25,683
Pump StationTotal 6,517 6,813 7,323 8,275 8,753 9,672 10,147 11,060 12,023 11,923 12,596
Distribution NetworkTotal 41,934 48,121 53,674 58,358 63,377 70,331 77,286 80,551 85,298 93,691 95,316
Total SWAC Capital Cost 67,530 76,600 86,250 92,080 98,510 106,580 115,150 119,520 125,330 134,790 137,260
Operating CostPumps
Subtotal 2,460 2,611 3,066 3,346 3,802 3,787 4,087 4,241 4,799 5,033 5,248Heat Exchangers
Subtotal 104 112 120 127 135 142 150 157 165 172 180
Total Operating Cost 3,241 3,429 3,919 4,228 4,714 4,737 5,076 5,253 5,840 6,119 6,349
Conventional Air Conditioning
Total Conv. AC Capital Costs 6,045 7,254 8,463 9,672 10,881 12,090 13,299 14,508 15,717 16,926 18,135Total Conv. AC Operating Costs 10,855 13,026 15,197 17,368 19,539 21,710 23,881 26,052 28,223 30,394 32,565

A PRE-FEASIBILITY STUDY FOR DEEP SEAWATER AIRCONDITIONING SYSTEMS IN THE CARIBBEAN 40
Table 5-3: Technical Output of Montego Bay Load Factor Sensitivity Study (abbreviated for public release)
The offshore pipe diameters change by 0.5m diameter over the range of cooling loads and the intake pipe varies from 900 mm diameter to 1400 mm diameter, while the return pipe varies between 710 mm and 1000 mm. The intake pipe must also go deeper at reduced load. This is to account for the fact that pipes with lower flow rates are more subject to warming than pipes with higher flow rates. The seawater pump energy, chilled water pump energy, and heat exchanger area also scale with the cooling load. Low load factors require less water flow and less heat transfer area than high load factors.
5.1.2. Hybrid SWAC Hybrid SWAC is a term that applies to SWAC systems that use a chiller to augment seawater cooling. One of the major design factors that drive offshore intake pipe cost is the temperature of water required. In “pure” SWAC (which is the type of system discussed in the rest of this report), the intake pipe must acquire water cold enough to supply all cooling customers with adequately cold chilled water after all heat gains in pipes have been accounted for. In hybrid SWAC, seawater that is warmer than required is obtained. This results in chilled water coming out of the heat exchanger that is too warm to meet cooling customer temperature requirements. An auxiliary chiller downstream of the heat exchanger is used to drop the chilled water to the required temperature. In doing so, the chiller is absorbing some of the cooling load coming from the distribution system. Figure 5-3 shows a schematic of pure SWAC, and Figure 5-4 shows a schematic of hybrid SWAC.
Technical SummaryParameter: Load Factor 0.5 0.6 0.7 0.8 0.9 1 1.1 1.2 1.3 1.4 1.5Peak AC Load (Tons) 3838 4605.6 5373.2 6140.8 6908.4 7676 8443.6 9211.2 9978.8 10746.4 11514Average AC Load (Tons) 2366 2839 3312 3786 4259 4732 5205 5678 6152 6625 7098
Intake PipeDepth of Intake (m) -898 -893 -890 -884 -883 -880 -879 -876 -874 -874 -872Length of Intake Pipe (m) 4550 4530 4516 4492 4486 4473 4469 4460 4450 4449 4443Outside Diameter of Intake Pipe (m) 0.90 1.00 1.10 1.10 1.20 1.20 1.30 1.30 1.30 1.40 1.40Deep Water Temperature (°C) 5.90 5.97 6.03 6.11 6.14 6.19 6.20 6.23 6.27 6.27 6.30
Return PipeOutside Diameter of Return Pipe (m) 0.71 1.00 1.00 1.00 1.00 1.00 1.00 1.00 1.00 1.00 1.00Max Temperature of Returned Water (°C) 12.36 12.33 12.31 12.29 12.28 12.27 12.26 12.25 12.25 12.25 12.24
Seawater Pump StationMass Flow (kg/s) 603 724 845 965 1086 1207 1328 1448 1569 1690 1810Seawater pumping power (kW) 141 147 174 202 234 265 300 335 374 414 458
Chilled Water Pump StationTotal Flow (kg/s) 574 689 804 919 1034 1149 1263 1378 1493 1608 1723Freshwater pumping power (kW) 617 660 777 837 950 914 974 987 1125 1160 1184
Heat ExchangersSW dT Across Heat Exchanger (°C) 5.86 5.83 5.81 5.80 5.78 5.77 5.77 5.76 5.75 5.75 5.74SW Flow (kg/s) 603 724 845 965 1086 1207 1328 1448 1569 1690 1810FW Flow (kg/s) 574 689 804 919 1034 1149 1263 1378 1493 1608 1723

A PRE-FEASIBILITY STUDY FOR DEEP SEAWATER AIRCONDITIONING SYSTEMS IN THE CARIBBEAN 41
Figure 5-3: Schematic of Pure SWAC
Figure 5-4: Schematic of Hybrid SWAC
The advantage of a hybrid SWAC system is that the offshore pipe can be made shorter. The disadvantage is that the chiller has a large operating cost that erodes the advantage of SWAC over conventional cooling. A hybrid system can be cost effective when it is too expensive to acquire adequately cold water, but “cool” water that can absorb some (but not all) of the cooling load is available at reduced cost. In such a case, the capital cost savings from the shortened cold water pipe outweighs the increased operating cost caused by the auxiliary chiller.
Makai investigated the benefit of hybrid SWAC by performing a sensitivity study on auxiliary chiller temperature drop. In a hybrid SWAC system, the amount of cooling load absorbed by the chiller (and the amount by which the intake pipe can be shortened) is controlled by the chiller temperature drop. A high temperature drop results in a short intake pipe, but a high operating cost because the chiller must absorb

A PRE-FEASIBILITY STUDY FOR DEEP SEAWATER AIRCONDITIONING SYSTEMS IN THE CARIBBEAN 42
more of the cooling load. A low temperature drop requires a longer intake pipe, but has a lower operating cost. The sensitivity study can determine whether hybrid SWAC is cost effective, as well as the temperature drop at which a cost effective system should operate. Figure 5-5 shows the impact of hybrid SWAC on the Montego Bay system.
Figure 5-5: The Effect of Hybrid SWAC on Levelized Cost in Montego Bay
Hybrid SWAC is not cost effective in Montego Bay – the minimum levelized cost on the curve is where the temperature drop is zero (pure SWAC). This conclusion is sensitive to the assumed bathymetric profile. Hybrid SWAC is typically cost effective when there is a long flat section of seabed just inshore of the depth at which a pure SWAC intake would be placed. Since no detailed bathymetry offshore of Montego Bay is available, it is unknown whether such a plateau exists. The assumed bathymetric profile assumes a steady increase in depth, so results could vary once more detailed bathymetry data is obtained. Table 5-4 shows the detailed cost output of the hybrid SWAC sensitivity study.
0
1,000
2,000
3,000
4,000
5,000
6,000
7,000
0.00 0.50 1.00 1.50 2.00 2.50
Leve
lized
Cos
t ($/
ton/
year
)
Chiller Temperature Drop (deg C)
Levelized Cost vs. Chiller dT
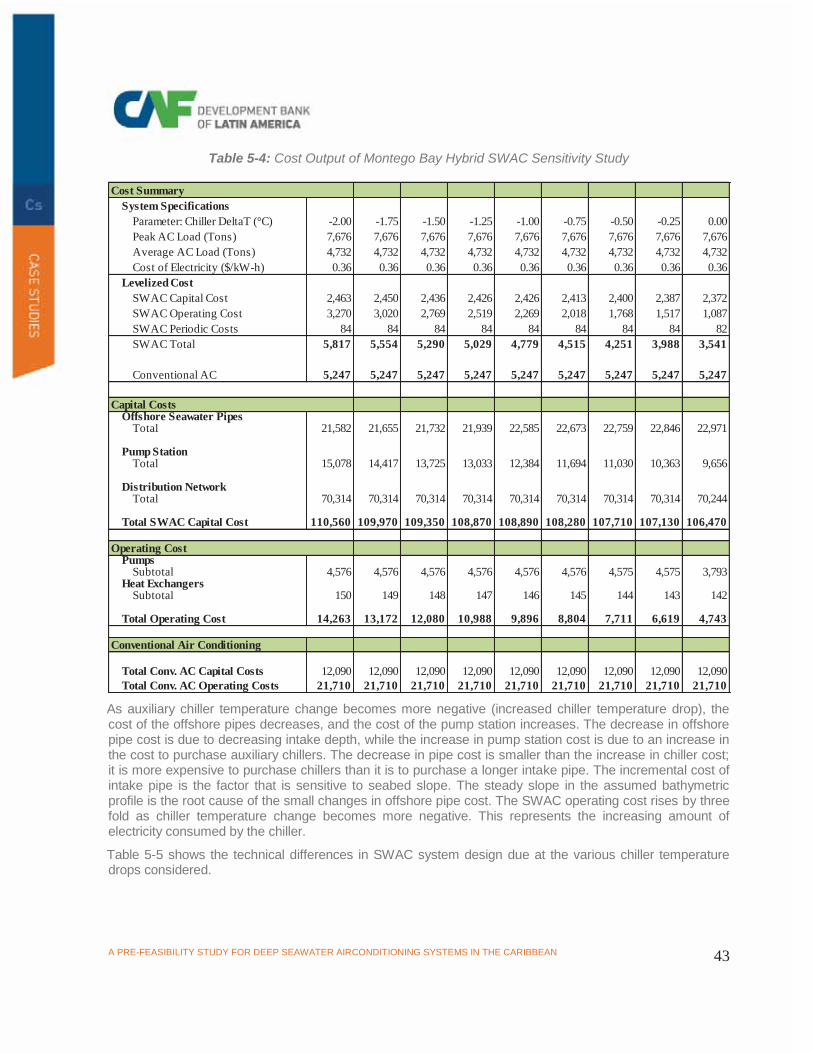
A PRE-FEASIBILITY STUDY FOR DEEP SEAWATER AIRCONDITIONING SYSTEMS IN THE CARIBBEAN 43
Table 5-4: Cost Output of Montego Bay Hybrid SWAC Sensitivity Study
As auxiliary chiller temperature change becomes more negative (increased chiller temperature drop), the cost of the offshore pipes decreases, and the cost of the pump station increases. The decrease in offshore pipe cost is due to decreasing intake depth, while the increase in pump station cost is due to an increase in the cost to purchase auxiliary chillers. The decrease in pipe cost is smaller than the increase in chiller cost; it is more expensive to purchase chillers than it is to purchase a longer intake pipe. The incremental cost of intake pipe is the factor that is sensitive to seabed slope. The steady slope in the assumed bathymetric profile is the root cause of the small changes in offshore pipe cost. The SWAC operating cost rises by three fold as chiller temperature change becomes more negative. This represents the increasing amount of electricity consumed by the chiller.
Table 5-5 shows the technical differences in SWAC system design due at the various chiller temperature drops considered.
Cost SummarySystem Specifications
Parameter: Chiller DeltaT (°C) -2.00 -1.75 -1.50 -1.25 -1.00 -0.75 -0.50 -0.25 0.00Peak AC Load (Tons) 7,676 7,676 7,676 7,676 7,676 7,676 7,676 7,676 7,676Average AC Load (Tons) 4,732 4,732 4,732 4,732 4,732 4,732 4,732 4,732 4,732Cost of Electricity ($/kW-h) 0.36 0.36 0.36 0.36 0.36 0.36 0.36 0.36 0.36
Levelized CostSWAC Capital Cost 2,463 2,450 2,436 2,426 2,426 2,413 2,400 2,387 2,372SWAC Operating Cost 3,270 3,020 2,769 2,519 2,269 2,018 1,768 1,517 1,087SWAC Periodic Costs 84 84 84 84 84 84 84 84 82SWAC Total 5,817 5,554 5,290 5,029 4,779 4,515 4,251 3,988 3,541
Conventional AC 5,247 5,247 5,247 5,247 5,247 5,247 5,247 5,247 5,247
Capital CostsOffshore Seawater Pipes
Total 21,582 21,655 21,732 21,939 22,585 22,673 22,759 22,846 22,971
Pump StationTotal 15,078 14,417 13,725 13,033 12,384 11,694 11,030 10,363 9,656
Distribution NetworkTotal 70,314 70,314 70,314 70,314 70,314 70,314 70,314 70,314 70,244
Total SWAC Capital Cost 110,560 109,970 109,350 108,870 108,890 108,280 107,710 107,130 106,470
Operating CostPumps
Subtotal 4,576 4,576 4,576 4,576 4,576 4,576 4,575 4,575 3,793Heat Exchangers
Subtotal 150 149 148 147 146 145 144 143 142
Total Operating Cost 14,263 13,172 12,080 10,988 9,896 8,804 7,711 6,619 4,743
Conventional Air Conditioning
Total Conv. AC Capital Costs 12,090 12,090 12,090 12,090 12,090 12,090 12,090 12,090 12,090Total Conv. AC Operating Costs 21,710 21,710 21,710 21,710 21,710 21,710 21,710 21,710 21,710

A PRE-FEASIBILITY STUDY FOR DEEP SEAWATER AIRCONDITIONING SYSTEMS IN THE CARIBBEAN 44
Table 5-5: Technical Output of Montego Bay Hybrid SWAC Sensitivity Study
The cold water intake depth decreases as chiller temperature change becomes more negative (larger temperature drop). However, the change in length is not enough to allow a reduction in intake pipe diameter. This is another factor that minimizes the savings from hybrid SWAC at Montego Bay.
5.1.3. Thermal Energy Storage Thermal energy storage (TES) is a method of evening out daily variations in cooling load. In a SWAC system without TES, the seawater system must be sized to meet the peak cooling loads. Therefore, the system is oversized the majority of the time. A TES system stores cooling energy during low-load periods and supplements the seawater system during high-load periods. This allows a smaller and less expensive seawater system while still meeting peak loads.
There are a variety of TES systems available – the SWAC model assumes cold water storage. In a cold water storage system, a tank is filled with chilled water during periods of low cooling load (e.g. – at night). During the day, the stored chilled water is discharged into the chilled water supply system to augment the seawater system. Figure 5-6 illustrates the chilled water storage concept.
Technical SummaryParameter: Chiller DeltaT (°C) -2 -1.75 -1.5 -1.25 -1 -0.75 -0.5 -0.25 0Peak AC Load (Tons) 7676 7676 7676 7676 7676 7676 7676 7676 7676Average AC Load (Tons) 4732 4732 4732 4732 4732 4732 4732 4732 4732
Intake PipeDepth of Intake (m) -752 -768 -783 -799 -815 -831 -847 -863 -880Length of Intake Pipe (m) 3940 4005 4070 4136 4203 4271 4338 4405 4473Outside Diameter of Intake Pipe (m) 1.20 1.20 1.20 1.20 1.20 1.20 1.20 1.20 1.20Deep Water Temperature (°C) 8.21 7.95 7.70 7.45 7.20 6.94 6.69 6.44 6.19
Return PipeOutside Diameter of Return Pipe (m) 1.00 1.00 1.00 1.00 1.00 1.00 1.00 1.00 1.00Max Temperature of Returned Water (°C) 14.83 14.51 14.19 13.87 13.55 13.23 12.91 12.59 12.27
Seawater Pump StationMass Flow (kg/s) 1206 1206 1206 1206 1206 1206 1207 1207 1207Seawater pumping power (kW) 267 267 267 267 267 267 267 267 267
Chilled Water Pump StationTotal Flow (kg/s) 1149 1149 1149 1149 1149 1149 1149 1149 1149Freshwater pumping power (kW) 1162 1162 1162 1162 1162 1162 1162 1162 914
Heat ExchangersSW dT Across Heat Exchanger (°C) 6.35 6.28 6.21 6.13 6.06 5.99 5.92 5.85 5.77SW Flow (kg/s) 1206 1206 1206 1206 1206 1206 1207 1207 1207FW Flow (kg/s) 1149 1149 1149 1149 1149 1149 1149 1149 1149

A PRE-FEASIBILITY STUDY FOR DEEP SEAWATER AIRCONDITIONING SYSTEMS IN THE CARIBBEAN 45
Figure 5-6: Diagram of Chilled Water Storage Operation
During the blue-shaded times, chilled water from the SWAC heat exchanger is diverted away from the distribution system and into the TES tank. The reduced chilled water flow to the distribution system is acceptable because the cooling load requirement is less than that supplied by the seawater system. During the red-shaded times, all chilled water from the SWAC heat exchanger is sent to the distribution system, but it is not enough to meet the full cooling load. Chilled water stored in the TES tank is added to that coming from the heat exchanger to meet the system’s cooling needs.
A TES tank can be sized to completely even out a SWAC system’s daily variation. In such cases, the SWAC system is sized to meet the average load and the TES system supplies all above-average loads. Alternatively, the tank could also be sized to handle only the highest loads, while the SWAC system is sized to handle some loads larger than average, but not the highest loads. Makai used a sensitivity study to analyze TES in order to determine both its overall economic viability and the optimum TES tank size. Figure 5-7 shows the results of the Montego Bay TES system sensitivity study.
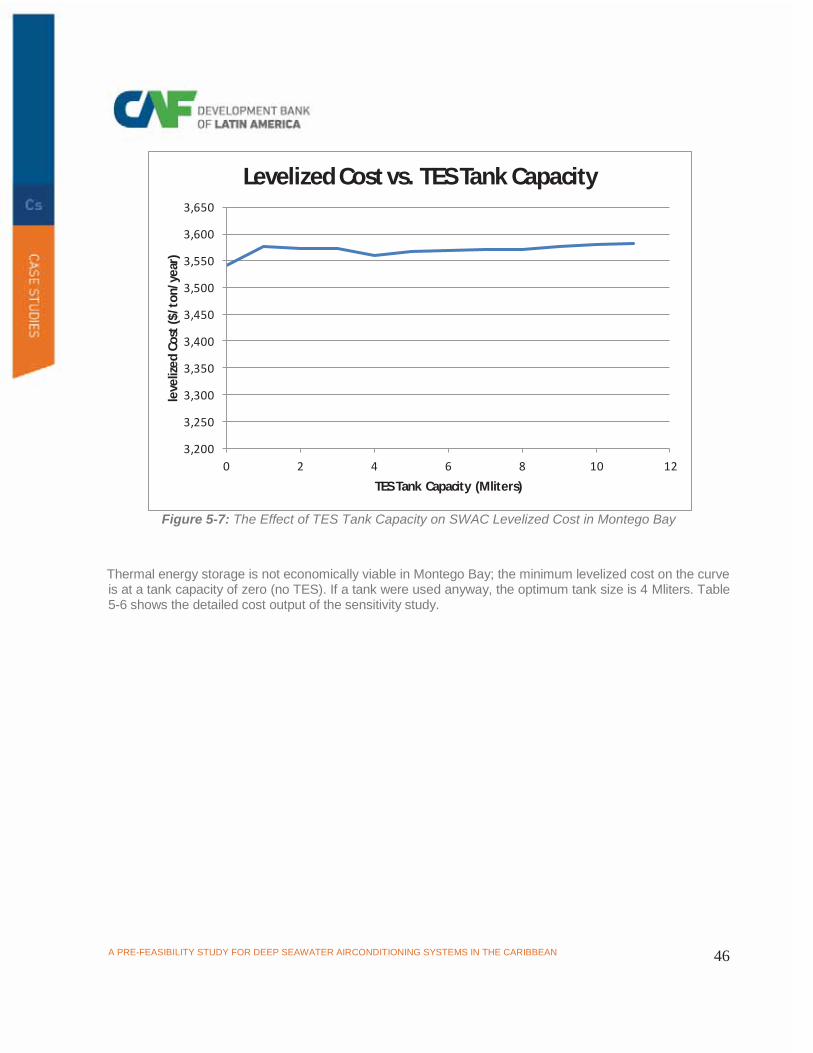
A PRE-FEASIBILITY STUDY FOR DEEP SEAWATER AIRCONDITIONING SYSTEMS IN THE CARIBBEAN 46
Figure 5-7: The Effect of TES Tank Capacity on SWAC Levelized Cost in Montego Bay
Thermal energy storage is not economically viable in Montego Bay; the minimum levelized cost on the curve is at a tank capacity of zero (no TES). If a tank were used anyway, the optimum tank size is 4 Mliters. Table 5-6 shows the detailed cost output of the sensitivity study.
3,200
3,250
3,300
3,350
3,400
3,450
3,500
3,550
3,600
3,650
0 2 4 6 8 10 12
leve
lized
Cos
t ($/
ton/
year
)
TES Tank Capacity (Mliters)
Levelized Cost vs. TES Tank Capacity

A PRE-FEASIBILITY STUDY FOR DEEP SEAWATER AIRCONDITIONING SYSTEMS IN THE CARIBBEAN 47
Table 5-6: Cost Output of Montego Bay TES Tank Sensitivity Study
The cost of the offshore pipe decreases as tank capacity increases. This is driven by the reduction in required seawater flow rate. Reduced flow rate allows use of thinner pipe wall and/or reduced pipe diameter, both of which reduce cost. The total capital cost of the SWAC system increases as tank size increases, which means the cost of the TES tank exceeds the savings from the cold water pipe. The cost for electricity to run the seawater pumps decreases as tank capacity increases, but the maintenance cost for the tank almost completely offsets the savings.
Table 5-7 shows the technical SWAC design differences at the different tank sizes considered.
Cost SummarySystem Specifications
Parameter: TES Tank Capacity (Ml) 0.00 1.00 2.00 3.00 4.00 5.00 6.00 7.00 8.00 9.00 10.00 11.00Peak AC Load (Tons) 7,676 7,676 7,676 7,676 7,676 7,676 7,676 7,676 7,676 7,676 7,676 7,676Average AC Load (Tons) 4,732 4,732 4,732 4,732 4,732 4,732 4,732 4,732 4,732 4,732 4,732 4,732Cost of Electricity ($/kW-h) 0.36 0.36 0.36 0.36 0.36 0.36 0.36 0.36 0.36 0.36 0.36 0.36
Levelized CostSWAC Capital Cost 2,375 2,397 2,398 2,400 2,389 2,397 2,399 2,400 2,403 2,406 2,410 2,413SWAC Operating Cost 1,086 1,098 1,093 1,090 1,088 1,089 1,089 1,088 1,088 1,088 1,089 1,089SWAC Periodic Costs 82 83 82 82 82 82 82 82 81 81 81 81SWAC Total 3,542 3,577 3,573 3,573 3,559 3,568 3,569 3,571 3,572 3,576 3,580 3,583
Conventional AC 5,247 5,247 5,247 5,247 5,247 5,247 5,247 5,247 5,247 5,247 5,247 5,247
Capital CostsOffshore Seawater Pipes
Total 22,971 22,895 22,832 22,783 21,986 21,961 21,942 21,960 21,922 21,904 21,880 21,855
Pump StationTotal 9,672 10,688 10,770 10,920 11,225 11,703 11,812 11,942 12,077 12,260 12,429 12,598
Distribution NetworkTotal 70,331 70,376 70,415 70,431 70,450 70,337 70,336 70,275 70,274 70,274 70,290 70,289
Total SWAC Capital Cost 106,580 107,560 107,620 107,740 107,220 107,560 107,650 107,740 107,840 108,000 108,160 108,310
Operating CostPumps
Subtotal 3,787 3,715 3,661 3,619 3,580 3,555 3,522 3,492 3,462 3,435 3,408 3,383Heat Exchangers
Subtotal 142 139 136 135 133 131 129 128 126 125 123 122
Total Operating Cost 4,737 4,789 4,766 4,756 4,747 4,752 4,748 4,748 4,746 4,747 4,748 4,749
Conventional Air Conditioning
Total Conv. AC Capital Costs 12,090 12,090 12,090 12,090 12,090 12,090 12,090 12,090 12,090 12,090 12,090 12,090Total Conv. AC Operating Costs 21,710 21,710 21,710 21,710 21,710 21,710 21,710 21,710 21,710 21,710 21,710 21,710

A PRE-FEASIBILITY STUDY FOR DEEP SEAWATER AIRCONDITIONING SYSTEMS IN THE CARIBBEAN 48
Table 5-7: Technical Output of Montego Bay TES Tank Sensitivity Study
Seawater flow rate decreases as tank size increases. At a tank size of 4 Mliters, the intake pipe diameter drops from 1100mm to 1000mm. This drop is the cause for the local minimum in cost seen in Figure 5-11. The biggest factor preventing thermal energy storage from benefitting a Montego Bay SWAC system is the average load. The annual average cooling load in Montego Bay is 62% of the peak load. That leaves 38% of the peak load for the TES tank. The consequence is that TES can only reduce the seawater flow rate by 38%. Most thermal energy storage systems are installed when the annual average load is less than 50% of the peak load.
5.2. PUERTO PLATA
5.2.1. Electrical Cost A sensitivity study of electrical rate reveals how changes in the cost of electricity impact the relative economics of SWAC and conventional cooling. The economic module of the SWAC model was exercised for a variety of electrical rates centered about the current cost of $0.32/kW-hr. Figure 5-8 shows the results of the sensitivity study.
Technical SummaryParameter: TES Tank Capacity (Ml) 0 1 2 3 4 5 6 7 8 9 10 11Peak AC Load (Tons) 7676 7676 7676 7676 7676 7676 7676 7676 7676 7676 7676 7676Average AC Load (Tons) 4732 4732 4732 4732 4732 4732 4732 4732 4732 4732 4732 4732
Intake PipeDepth of Intake (m) -880 -884 -888 -890 -891 -893 -895 -898 -900 -905 -911 -917Length of Intake Pipe (m) 4473 4492 4507 4518 4519 4528 4538 4548 4558 4580 4603 4627Outside Diameter of Intake Pipe (m) 1.20 1.20 1.20 1.20 1.10 1.10 1.10 1.10 1.10 1.10 1.10 1.10Deep Water Temperature (°C) 6.19 6.11 6.06 6.02 6.01 5.98 5.94 5.91 5.87 5.84 5.80 5.77
Return PipeOutside Diameter of Return Pipe (m) 1.00 1.00 1.00 1.00 1.00 1.00 1.00 1.00 1.00 1.00 1.00 1.00Max Temperature of Returned Water (°C) 12.27 12.28 12.28 12.28 12.29 12.29 12.30 12.30 12.30 12.31 12.31 12.32
Seawater Pump StationMass Flow (kg/s) 1207 1144 1099 1064 1031 1001 972 943 916 892 868 844Seawater pumping power (kW) 265 249 237 228 219 211 204 198 191 185 179 174
Chilled Water Pump StationTotal Flow (kg/s) 1149 1089 1046 1013 981 953 925 898 872 849 826 804Freshwater pumping power (kW) 914 865 831 803 778 758 736 713 692 674 655 637
Heat ExchangersSW dT Across Heat Exchanger (°C) 5.77 5.83 5.86 5.89 5.92 5.94 5.97 5.99 6.02 6.03 6.05 6.07SW Flow (kg/s) 1207 1144 1099 1064 1031 1001 972 943 916 892 868 844FW Flow (kg/s) 1149 1089 1046 1013 981 953 925 898 872 849 826 804

A PRE-FEASIBILITY STUDY FOR DEEP SEAWATER AIRCONDITIONING SYSTEMS IN THE CARIBBEAN 49
Figure 5-8: Comparison of the Effect of Electrical Rate on SWAC and Conventional AC in Puerto Plata
The levelized cost of conventional air conditioning is much more sensitive to electrical rate than is SWAC, as seen by the steeper slope on the red area than the blue area in Figure 5-8. This is due to the fact that the majority of the cost of SWAC is in capital – only a small portion of the lifecycle cost is due to the electrical cost to operate the pumps. In contrast, the majority of the lifecycle cost of conventional air conditioning goes to electricity to operate the chillers. The above relationships mean that SWAC is favored when electrical rates are high, and conventional cooling is favored when electrical rates are low. The cost of electricity in Puerto Plata is high enough the levelized cost of SWAC does not exceed that of conventional cooling within the bounds of the sensitivity study.
Table 5-8 shows the detailed economic output of the sensitivity study.
0
1,000
2,000
3,000
4,000
5,000
6,000
7,000
0.22
0.23
0.24
0.25
0.26
0.27
0.28
0.29
0.30
0.31
0.32
0.33
0.34
0.35
0.36
0.37
0.38
0.39
0.40
0.41
0.42
Leve
lized
Cos
t ($/
ton/
year
)
Electrical Rate ($/kW-hr)
Levelized Cost vs. Electrical Rate Conventional AC
SWAC

A PRE-FEASIBILITY STUDY FOR DEEP SEAWATER AIRCONDITIONING SYSTEMS IN THE CARIBBEAN 50
Table 5-8: Cost Output of Puerto Plata Electrical Rate Sensitivity Study
Cost SummarySystem Specifications
Parameter: Electrical Rate ($/kWh) 0.22 0.23 0.24 0.25 0.26 0.27 0.28 0.29 0.30 0.31 0.32 0.33 0.34 0.35 0.36 0.37 0.38 0.39 0.40 0.41 0.42Peak AC Load (Tons) 6,835 6,835 6,835 6,835 6,835 6,835 6,835 6,835 6,835 6,835 6,835 6,835 6,835 6,835 6,835 6,835 6,835 6,835 6,835 6,835 6,835Average AC Load (Tons) 4,438 4,438 4,438 4,438 4,438 4,438 4,438 4,438 4,438 4,438 4,438 4,438 4,438 4,438 4,438 4,438 4,438 4,438 4,438 4,438 4,438Cost of Electricity ($/kW-h) 0.22 0.23 0.24 0.25 0.26 0.27 0.28 0.29 0.30 0.31 0.32 0.33 0.34 0.35 0.36 0.37 0.38 0.39 0.40 0.41 0.42
Levelized Cost ($/ton/year)SWAC Capital Cost 1,626 1,626 1,626 1,626 1,626 1,626 1,626 1,626 1,626 1,626 1,626 1,626 1,626 1,626 1,626 1,626 1,626 1,626 1,626 1,626 1,626SWAC Operating Cost 605 620 634 648 662 676 691 705 719 733 748 762 776 790 804 819 833 847 861 876 890SWAC Periodic Costs 61 61 61 61 61 61 61 61 61 61 61 61 61 61 61 61 61 61 61 61 61SWAC Total 2,292 2,307 2,321 2,335 2,349 2,364 2,378 2,392 2,406 2,420 2,435 2,449 2,463 2,477 2,492 2,506 2,520 2,534 2,548 2,563 2,577
Conventional AC 3,361 3,494 3,627 3,760 3,893 4,026 4,159 4,292 4,425 4,558 4,691 4,824 4,957 5,091 5,224 5,357 5,490 5,623 5,756 5,889 6,022
Capital CostsTotal SWAC Capital Cost 68,430 68,430 68,430 68,430 68,430 68,430 68,430 68,430 68,430 68,430 68,430 68,430 68,430 68,430 68,430 68,430 68,430 68,430 68,430 68,430 68,430
Operating CostPumps
Electricity 1,280 1,338 1,396 1,454 1,513 1,571 1,629 1,687 1,745 1,804 1,862 1,920 1,978 2,036 2,094 2,153 2,211 2,269 2,327 2,385 2,443Maintenance 1 1 1 1 1 1 1 1 1 1 1 1 1 1 1 1 1 1 1 1 1Personnel 65 65 65 65 65 65 65 65 65 65 65 65 65 65 65 65 65 65 65 65 65Subtotal 1,347 1,405 1,463 1,521 1,579 1,638 1,696 1,754 1,812 1,870 1,929 1,987 2,045 2,103 2,161 2,219 2,278 2,336 2,394 2,452 2,510
Total Operating Cost 2,476 2,534 2,593 2,651 2,709 2,767 2,825 2,883 2,942 3,000 3,058 3,116 3,174 3,232 3,291 3,349 3,407 3,465 3,523 3,582 3,640
Conventional Air Conditioning
Total Conv. AC Capital Costs 10,765 10,765 10,765 10,765 10,765 10,765 10,765 10,765 10,765 10,765 10,765 10,765 10,765 10,765 10,765 10,765 10,765 10,765 10,765 10,765 10,765Annual Conventional AC Costs
Electricity 11,974 12,518 13,062 13,606 14,151 14,695 15,239 15,784 16,328 16,872 17,416 17,961 18,505 19,049 19,593 20,138 20,682 21,226 21,770 22,315 22,859Water/Sewage 0 0 0 0 0 0 0 0 0 0 0 0 0 0 0 0 0 0 0 0 0Personnel 284 284 284 284 284 284 284 284 284 284 284 284 284 284 284 284 284 284 284 284 284Maintenance Contract 103 103 103 103 103 103 103 103 103 103 103 103 103 103 103 103 103 103 103 103 103Administration and Overhead 34 34 34 34 34 34 34 34 34 34 34 34 34 34 34 34 34 34 34 34 34
Total Conv. AC Operating Costs 12,702 13,247 13,791 14,335 14,879 15,424 15,968 16,512 17,056 17,601 18,145 18,689 19,233 19,778 20,322 20,866 21,410 21,955 22,499 23,043 23,587
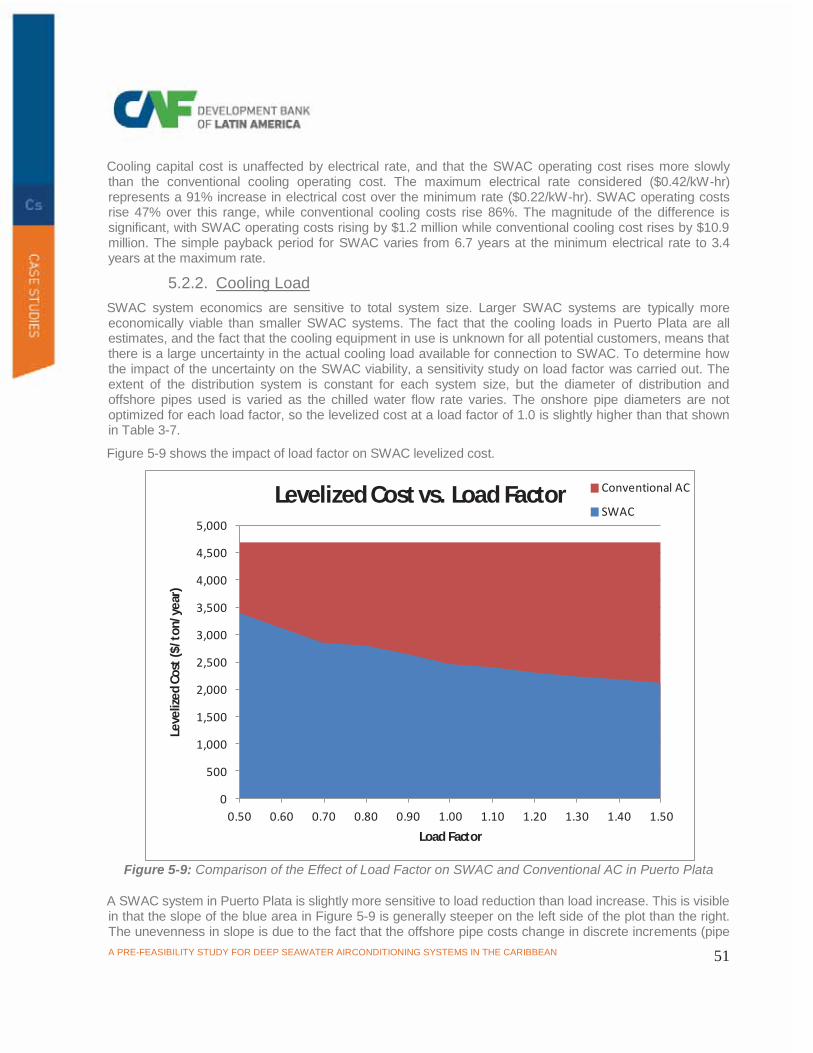
A PRE-FEASIBILITY STUDY FOR DEEP SEAWATER AIRCONDITIONING SYSTEMS IN THE CARIBBEAN 51
Cooling capital cost is unaffected by electrical rate, and that the SWAC operating cost rises more slowly than the conventional cooling operating cost. The maximum electrical rate considered ($0.42/kW-hr) represents a 91% increase in electrical cost over the minimum rate ($0.22/kW-hr). SWAC operating costs rise 47% over this range, while conventional cooling costs rise 86%. The magnitude of the difference is significant, with SWAC operating costs rising by $1.2 million while conventional cooling cost rises by $10.9 million. The simple payback period for SWAC varies from 6.7 years at the minimum electrical rate to 3.4 years at the maximum rate.
5.2.2. Cooling Load SWAC system economics are sensitive to total system size. Larger SWAC systems are typically more economically viable than smaller SWAC systems. The fact that the cooling loads in Puerto Plata are all estimates, and the fact that the cooling equipment in use is unknown for all potential customers, means that there is a large uncertainty in the actual cooling load available for connection to SWAC. To determine how the impact of the uncertainty on the SWAC viability, a sensitivity study on load factor was carried out. The extent of the distribution system is constant for each system size, but the diameter of distribution and offshore pipes used is varied as the chilled water flow rate varies. The onshore pipe diameters are not optimized for each load factor, so the levelized cost at a load factor of 1.0 is slightly higher than that shown in Table 3-7.
Figure 5-9 shows the impact of load factor on SWAC levelized cost.
Figure 5-9: Comparison of the Effect of Load Factor on SWAC and Conventional AC in Puerto Plata
A SWAC system in Puerto Plata is slightly more sensitive to load reduction than load increase. This is visible in that the slope of the blue area in Figure 5-9 is generally steeper on the left side of the plot than the right. The unevenness in slope is due to the fact that the offshore pipe costs change in discrete increments (pipe
0
500
1,000
1,500
2,000
2,500
3,000
3,500
4,000
4,500
5,000
0.50 0.60 0.70 0.80 0.90 1.00 1.10 1.20 1.30 1.40 1.50
Leve
lized
Cos
t ($/
ton/
year
)
Load Factor
Levelized Cost vs. Load Factor Conventional AC
SWAC

A PRE-FEASIBILITY STUDY FOR DEEP SEAWATER AIRCONDITIONING SYSTEMS IN THE CARIBBEAN 52
diameters). SWAC is cost competitive with conventional cooling over the entire range of the sensitivity study, which indicates that uncertainty in total cooling load does not pose a large risk to SWAC system economic viability. Table 5-9 shows the detailed cost output from the sensitivity study.
Table 5-9: Cost Output of Puerto Plata Load Factor Sensitivity Study
The levelized cost of conventional cooling is unaffected by changes in load factor. This is because both the capital and operating costs of conventional cooling scale linearly with cooling load. SWAC, however, exhibits an economy of scale; both capital and operating costs rise more slowly with increasing load. The maximum cooling load (150% of the expected load) represents a 300% increase over the minimum cooling load (50% of the expected load). Over this range, SWAC capital costs increase by 178%, and SWAC operating costs increase by 209%. Conventional cooling capital cost and operating cost increases by 300%. The simple payback period varies from 6.9 years at the minimum load to 3.7 years at the maximum load.
Table 5-10 shows the technical differences in SWAC system design for the different load factors.
Cost SummarySystem Specifications
Parameter: Load Factor 0.50 0.60 0.70 0.80 0.90 1.00 1.10 1.20 1.30 1.40 1.50Peak AC Load (Tons) 3,418 4,101 4,785 5,468 6,152 6,835 7,519 8,202 8,886 9,569 10,253Average AC Load (Tons) 2,219 2,663 3,107 3,550 3,994 4,438 4,882 5,325 5,769 6,213 6,657Cost of Electricity ($/kW-h) 0.32 0.32 0.32 0.32 0.32 0.32 0.32 0.32 0.32 0.32 0.32
Levelized CostSWAC Capital Cost 2,298 2,117 1,918 1,943 1,790 1,666 1,607 1,519 1,480 1,422 1,360SWAC Operating Cost 1,009 924 858 788 788 733 738 730 700 706 704SWAC Periodic Costs 94 83 76 69 65 61 58 56 54 52 51SWAC Total 3,400 3,124 2,851 2,800 2,643 2,461 2,403 2,304 2,235 2,180 2,114
Conventional AC 4,691 4,691 4,691 4,691 4,691 4,691 4,691 4,691 4,691 4,691 4,691
Capital Costs (k$)Offshore Seawater Pipes
Total 24,948 28,070 28,166 34,572 34,581 34,725 36,279 36,494 38,157 38,405 38,563
Pump StationTotal 8,054 8,614 9,781 10,582 11,748 12,306 13,738 14,964 15,755 16,974 18,242
Distribution NetworkTotal 11,673 12,965 14,739 16,235 17,470 19,071 20,327 21,191 23,000 24,330 24,953
Total SWAC Capital Cost 48,360 53,470 56,510 65,420 67,820 70,130 74,410 76,710 81,010 83,800 85,850
Operating Cost ($/year)Pumps
Subtotal 1,152 1,309 1,453 1,527 1,806 1,864 2,141 2,364 2,464 2,745 2,983Heat Exchangers
Subtotal 90 95 99 104 109 114 119 124 129 133 138
Total Operating Cost 2,063 2,267 2,456 2,580 2,901 3,000 3,320 3,582 3,725 4,044 4,319
Conventional Air Conditioning
Total Conv. AC Capital Costs 5,383 6,459 7,536 8,612 9,689 10,765 11,842 12,918 13,995 15,071 16,148Total Conv. AC Operating Costs 9,072 10,887 12,701 14,516 16,330 18,145 19,959 21,774 23,588 25,403 27,217
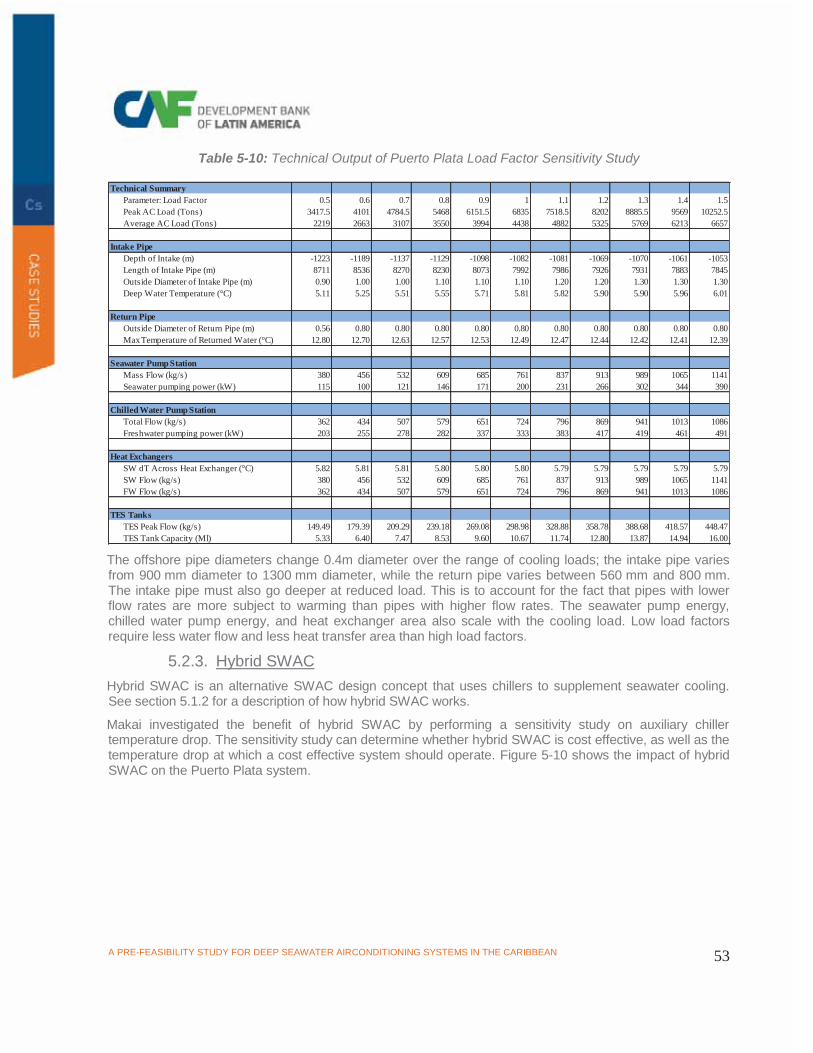
A PRE-FEASIBILITY STUDY FOR DEEP SEAWATER AIRCONDITIONING SYSTEMS IN THE CARIBBEAN 53
Table 5-10: Technical Output of Puerto Plata Load Factor Sensitivity Study
The offshore pipe diameters change 0.4m diameter over the range of cooling loads; the intake pipe varies from 900 mm diameter to 1300 mm diameter, while the return pipe varies between 560 mm and 800 mm. The intake pipe must also go deeper at reduced load. This is to account for the fact that pipes with lower flow rates are more subject to warming than pipes with higher flow rates. The seawater pump energy, chilled water pump energy, and heat exchanger area also scale with the cooling load. Low load factors require less water flow and less heat transfer area than high load factors.
5.2.3. Hybrid SWAC Hybrid SWAC is an alternative SWAC design concept that uses chillers to supplement seawater cooling. See section 5.1.2 for a description of how hybrid SWAC works.
Makai investigated the benefit of hybrid SWAC by performing a sensitivity study on auxiliary chiller temperature drop. The sensitivity study can determine whether hybrid SWAC is cost effective, as well as the temperature drop at which a cost effective system should operate. Figure 5-10 shows the impact of hybrid SWAC on the Puerto Plata system.
Technical SummaryParameter: Load Factor 0.5 0.6 0.7 0.8 0.9 1 1.1 1.2 1.3 1.4 1.5Peak AC Load (Tons) 3417.5 4101 4784.5 5468 6151.5 6835 7518.5 8202 8885.5 9569 10252.5Average AC Load (Tons) 2219 2663 3107 3550 3994 4438 4882 5325 5769 6213 6657
Intake PipeDepth of Intake (m) -1223 -1189 -1137 -1129 -1098 -1082 -1081 -1069 -1070 -1061 -1053Length of Intake Pipe (m) 8711 8536 8270 8230 8073 7992 7986 7926 7931 7883 7845Outside Diameter of Intake Pipe (m) 0.90 1.00 1.00 1.10 1.10 1.10 1.20 1.20 1.30 1.30 1.30Deep Water Temperature (°C) 5.11 5.25 5.51 5.55 5.71 5.81 5.82 5.90 5.90 5.96 6.01
Return PipeOutside Diameter of Return Pipe (m) 0.56 0.80 0.80 0.80 0.80 0.80 0.80 0.80 0.80 0.80 0.80Max Temperature of Returned Water (°C) 12.80 12.70 12.63 12.57 12.53 12.49 12.47 12.44 12.42 12.41 12.39
Seawater Pump StationMass Flow (kg/s) 380 456 532 609 685 761 837 913 989 1065 1141Seawater pumping power (kW) 115 100 121 146 171 200 231 266 302 344 390
Chilled Water Pump StationTotal Flow (kg/s) 362 434 507 579 651 724 796 869 941 1013 1086Freshwater pumping power (kW) 203 255 278 282 337 333 383 417 419 461 491
Heat ExchangersSW dT Across Heat Exchanger (°C) 5.82 5.81 5.81 5.80 5.80 5.80 5.79 5.79 5.79 5.79 5.79SW Flow (kg/s) 380 456 532 609 685 761 837 913 989 1065 1141FW Flow (kg/s) 362 434 507 579 651 724 796 869 941 1013 1086
TES TanksTES Peak Flow (kg/s) 149.49 179.39 209.29 239.18 269.08 298.98 328.88 358.78 388.68 418.57 448.47TES Tank Capacity (Ml) 5.33 6.40 7.47 8.53 9.60 10.67 11.74 12.80 13.87 14.94 16.00

A PRE-FEASIBILITY STUDY FOR DEEP SEAWATER AIRCONDITIONING SYSTEMS IN THE CARIBBEAN 54
Figure 5-10: The Effect of Hybrid SWAC on Levelized Cost in Puerto Plata
Hybrid SWAC is not cost effective in Puerto Plata – the minimum levelized cost on the curve is where the temperature drop is zero (pure SWAC). This conclusion is extremely sensitive to the assumed bathymetric profile. Hybrid SWAC is typically cost effective when there is a long flat section of seabed just inshore of the depth at which a pure SWAC intake would be placed. Since no detailed bathymetry offshore of Puerto Plata is available, it is unknown whether such a plateau exists. The assumed bathymetric profile assumes a steady increase in depth, so it is unsurprising that hybrid SWAC is not cost effective. Figure 5-11 shows the detailed cost output of the hybrid SWAC sensitivity study.
0
500
1,000
1,500
2,000
2,500
3,000
3,500
4,000
4,500
0.00 0.50 1.00 1.50 2.00 2.50
Leve
lized
Cos
t ($/
ton/
year
)
Chiller Temperature Drop (deg C)
Levelized Cost vs. Chiller dT

A PRE-FEASIBILITY STUDY FOR DEEP SEAWATER AIRCONDITIONING SYSTEMS IN THE CARIBBEAN 55
Table 5-11: Cost Output of Puerto Plata Hybrid SWAC Sensitivity Study
As auxiliary chiller temperature change becomes more negative (increased chiller temperature drop), the cost of the offshore pipes decreases, and the cost of the pump station increases. The decrease in offshore pipe cost is due to decreasing intake depth, while the increase in pump station cost is due to an increase in the cost to purchase auxiliary chillers. The decrease in pipe cost is smaller than the increase in chiller cost; it is more expensive to purchase chillers than it is to purchase a longer intake pipe. The incremental cost of intake pipe is the factor that is sensitive to seabed slope. The steady slope in the assumed bathymetric profile is the root cause of the small changes in offshore pipe cost. The SWAC operating cost rises dramatically as chiller temperature change becomes more negative. This represents the increasing amount of electricity consumed by the chiller.
Table 5-12 shows the technical differences in SWAC system design due at the various chiller temperature drops considered.
Cost SummarySystem Specifications
Parameter: Chiller DeltaT (°C) -2.00 -1.75 -1.50 -1.25 -1.00 -0.75 -0.50 -0.25 0.00Peak AC Load (Tons) 6,835 6,835 6,835 6,835 6,835 6,835 6,835 6,835 6,835Average AC Load (Tons) 4,438 4,438 4,438 4,438 4,438 4,438 4,438 4,438 4,438Cost of Electricity ($/kW-h) 0.32 0.32 0.32 0.32 0.32 0.32 0.32 0.32 0.32
Levelized CostSWAC Capital Cost 1,731 1,724 1,717 1,712 1,706 1,699 1,697 1,696 1,673SWAC Operating Cost 2,034 1,885 1,735 1,586 1,436 1,287 1,137 987 730SWAC Periodic Costs 63 63 63 63 63 63 63 63 61SWAC Total 3,828 3,672 3,515 3,360 3,205 3,049 2,896 2,746 2,465
Conventional AC 4,691 4,691 4,691 4,691 4,691 4,691 4,691 4,691 4,691
Capital Costs (k$)Offshore Seawater Pipes
Total 33,164 33,272 33,380 33,597 33,778 33,902 34,203 34,563 34,725
Pump StationTotal 16,256 15,850 15,426 15,014 14,594 14,174 13,756 13,364 12,287
Distribution NetworkTotal 19,436 19,436 19,436 19,436 19,436 19,436 19,436 19,436 19,391
Total SWAC Capital Cost 72,870 72,570 72,250 72,060 71,820 71,530 71,420 71,390 70,430
Operating Cost (k$/year)Pumps
Subtotal 2,287 2,287 2,288 2,288 2,288 2,288 2,288 2,288 1,850Chillers
Subtotal 4,893 4,282 3,671 3,059 2,448 1,836 1,224 612 0TES Tanks
Subtotal 462 462 462 462 462 462 462 462 462
Total Operating Cost 8,323 7,711 7,099 6,487 5,876 5,263 4,651 4,039 2,988
Conventional Air Conditioning
Total Conv. AC Capital Costs 10,765 10,765 10,765 10,765 10,765 10,765 10,765 10,765 10,765Total Conv. AC Operating Costs 18,145 18,145 18,145 18,145 18,145 18,145 18,145 18,145 18,145

A PRE-FEASIBILITY STUDY FOR DEEP SEAWATER AIRCONDITIONING SYSTEMS IN THE CARIBBEAN 56
Table 5-12: Technical Output of Puerto Plata Hybrid SWAC Sensitivity Study
The cold water intake depth decreases as chiller temperature change becomes more negative (larger temperature drop). However, the change in length is not enough to allow a reduction in intake pipe diameter. This is another factor that minimizes the savings from hybrid SWAC at Puerto Plata.
5.2.4. Thermal Energy Storage Thermal energy storage (TES) is a method of evening out daily variations in cooling load. The style of thermal energy storage used in the SWAC model is chilled water storage. See section 5.1.3 for a description of thermal energy storage operation. A sensitivity study to analyze TES was used in order to determine both its overall economic viability and the optimum TES tank size. Figure 5-11 shows the results of the Montego Bay TES system sensitivity study.
Technical SummaryParameter: Chiller DeltaT (°C) -2 -1.75 -1.5 -1.25 -1 -0.75 -0.5 -0.25 0Peak AC Load (Tons) 6835 6835 6835 6835 6835 6835 6835 6835 6835Average AC Load (Tons) 4438 4438 4438 4438 4438 4438 4438 4438 4438
Intake PipeDepth of Intake (m) -851 -875 -899 -926 -952 -979 -1008 -1045 -1082Length of Intake Pipe (m) 6939 7042 7144 7257 7370 7483 7612 7801 7992Outside Diameter of Intake Pipe (m) 1.10 1.10 1.10 1.10 1.10 1.10 1.10 1.10 1.10Deep Water Temperature (°C) 7.86 7.60 7.34 7.09 6.83 6.58 6.32 6.07 5.81
Return PipeOutside Diameter of Return Pipe (m) 0.80 0.80 0.80 0.80 0.80 0.80 0.80 0.80 0.80Max Temperature of Returned Water (°C) 15.02 14.70 14.39 14.07 13.76 13.44 13.12 12.81 12.49
Seawater Pump StationMass Flow (kg/s) 760 760 760 760 760 760 760 761 761Seawater pumping power (kW) 197 197 197 198 198 198 198 198 198
Chilled Water Pump StationTotal Flow (kg/s) 724 724 724 724 724 724 724 724 724Freshwater pumping power (kW) 487 487 487 486 486 486 486 486 330
Heat ExchangersSW dT Across Heat Exchanger (°C) 6.37 6.30 6.23 6.16 6.09 6.01 5.94 5.87 5.80SW Flow (kg/s) 760 760 760 760 760 760 760 761 761FW Flow (kg/s) 724 724 724 724 724 724 724 724 724
TES TanksTES Peak Flow (kg/s) 298.98 298.98 298.98 298.98 298.98 298.98 298.98 298.98 298.98TES Tank Capacity (Ml) 10.67 10.67 10.67 10.67 10.67 10.67 10.67 10.67 10.67

A PRE-FEASIBILITY STUDY FOR DEEP SEAWATER AIRCONDITIONING SYSTEMS IN THE CARIBBEAN 57
Figure 5-11: The Effect of TES Tank Capacity on SWAC Levelized Cost in Puerto Plata
Thermal energy storage is a benefit to the Puerto Plata SWAC system. Although TES tanks sized to handle only part of the peak load result in increased levelized cost, a full-sized tank that minimizes the size of the seawater system results in a decrease in levelized cost. The conclusion that thermal energy storage benefits the Puerto Plata system was taken into account when doing the final modeling. The results presented in section 3.2 include a full-size thermal energy storage system.
2,200
2,250
2,300
2,350
2,400
2,450
2,500
2,550
2,600
0 2 4 6 8 10 12
Leve
lized
Cos
t ($/
ton/
year
)
TES Tank Capacity (Mliters)
Levelized Cost vs. TES Tank Capacity

A PRE-FEASIBILITY STUDY FOR DEEP SEAWATER AIRCONDITIONING SYSTEMS IN THE CARIBBEAN 58
Table 5-13: Technical Output of Puerto Plata TES Tank Sensitivity Study
The cost of the offshore pipe decreases as tank capacity increases. This is driven by the reduction in required seawater flow rate. Reduced flow rate allows use of thinner pipe wall and/or reduced pipe diameter, both of which reduce cost. The total capital cost of the SWAC system increases for small tanks, but decreases for larger tanks. Any TES tank larger than 3 Mliters will reduce the total capital cost of the SWAC system. The operating cost for midsize tanks is larger than savings from reduced seawater pumping. This increased operating cost means that a TES tank must be at least 9 Mliters before it can compete with the non-TES SWAC system on a levelized cost basis. There is a decrease in both capital cost and levelized cost at the full-size 11 Mliter tank.
Table 5-7 shows the technical SWAC design differences at the different tank sizes considered.
Cost SummarySystem Specifications
Parameter: TES Tank Capacity (Ml) 0.00 1.00 2.00 3.00 4.00 5.00 6.00 7.00 8.00 9.00 10.00 11.00Peak AC Load (Tons) 6,835 6,835 6,835 6,835 6,835 6,835 6,835 6,835 6,835 6,835 6,835 6,835Average AC Load (Tons) 4,438 4,438 4,438 4,438 4,438 4,438 4,438 4,438 4,438 4,438 4,438 4,438Cost of Electricity ($/kW-h) 0.32 0.32 0.32 0.32 0.32 0.32 0.32 0.32 0.32 0.32 0.32 0.32
Levelized Cost ($/ton/year)SWAC Capital Cost 1,720 1,738 1,735 1,705 1,707 1,706 1,708 1,708 1,709 1,710 1,712 1,676SWAC Operating Cost 716 765 755 749 744 740 738 735 734 732 731 733SWAC Periodic Costs 69 69 68 67 66 65 64 64 63 62 62 61SWAC Total 2,506 2,572 2,558 2,521 2,517 2,512 2,510 2,507 2,506 2,504 2,505 2,470
Conventional AC 4,691 4,691 4,691 4,691 4,691 4,691 4,691 4,691 4,691 4,691 4,691 4,691
Capital Costs (k$)Offshore Seawater Pipes
Total 38,777 38,146 38,044 36,381 36,400 36,338 36,336 36,273 36,206 36,139 36,128 34,725
Pump StationTotal 10,154 11,536 11,502 11,944 11,987 12,030 12,103 12,183 12,276 12,361 12,478 12,395
Distribution NetworkTotal 19,359 19,399 19,398 19,397 19,396 19,395 19,395 19,394 19,393 19,392 19,392 19,391
Total SWAC Capital Cost 72,400 73,180 73,040 71,780 71,850 71,830 71,900 71,910 71,940 71,960 72,060 70,540
Operating Cost (k$/year)Pumps
Subtotal 2,198 2,272 2,203 2,145 2,095 2,051 2,009 1,971 1,935 1,901 1,870 1,850Heat Exchangers
Subtotal 132 129 127 125 124 122 120 119 118 116 115 114
Total Operating Cost 2,931 3,128 3,090 3,062 3,043 3,029 3,017 3,008 3,001 2,995 2,992 2,997
Conventional Air Conditioning
Total Conv. AC Capital Costs 10,765 10,765 10,765 10,765 10,765 10,765 10,765 10,765 10,765 10,765 10,765 10,765Total Conv. AC Operating Costs 18,145 18,145 18,145 18,145 18,145 18,145 18,145 18,145 18,145 18,145 18,145 18,145

A PRE-FEASIBILITY STUDY FOR DEEP SEAWATER AIRCONDITIONING SYSTEMS IN THE CARIBBEAN 59
Table 5-14: Technical Output of Puerto Plata TES Tank Sensitivity Study
Seawater flow rate decreases as tank size increases. At a tank size of 3 Mliters, the intake pipe diameter drops from 1300mm to 1200mm. There is another drop down to 1100mm at a tank size of 11 Mliters. These changes in pipe diameter are responsible for the drops in levelized cost seen in Figure 5-11. The reason TES makes economic sense in Puerto Plata is that the cold water intake pipe is extremely long. At 8 km, an intake pipe at Puerto Plata would be the longest intake pipeline installed to date. The length of the pipe magnifies any savings due to reduction in pipe diameter. The fact that a full-size TES tank reduces the pipe diameter from 1300mm to 1100mm saves enough money on the pipe to pay for the tank.
Technical SummaryParameter: TES Tank Capacity (Ml) 0 1 2 3 4 5 6 7 8 9 10 11Peak AC Load (Tons) 6835 6835 6835 6835 6835 6835 6835 6835 6835 6835 6835 6835Average AC Load (Tons) 4438 4438 4438 4438 4438 4438 4438 4438 4438 4438 4438 4438
Intake PipeDepth of Intake (m) -1041 -1050 -1057 -1053 -1058 -1064 -1069 -1075 -1081 -1087 -1092 -1082Length of Intake Pipe (m) 7779 7826 7863 7842 7870 7899 7927 7956 7985 8015 8044 7992Outside Diameter of Intake Pipe (m) 1.30 1.30 1.30 1.20 1.20 1.20 1.20 1.20 1.20 1.20 1.20 1.10Deep Water Temperature (°C) 6.10 6.03 5.99 6.01 5.98 5.94 5.90 5.86 5.82 5.78 5.75 5.81
Return PipeOutside Diameter of Return Pipe (m) 0.90 0.80 0.80 0.80 0.80 0.80 0.80 0.80 0.80 0.80 0.80 0.80Max Temperature of Returned Water (°C) 12.40 12.41 12.42 12.43 12.44 12.44 12.45 12.46 12.47 12.48 12.49 12.49
Seawater Pump StationMass Flow (kg/s) 1075 1022 984 951 922 895 869 844 820 797 775 761Seawater pumping power (kW) 288 320 300 283 269 256 244 233 222 213 204 198
Chilled Water Pump StationTotal Flow (kg/s) 1023 973 937 905 878 852 827 803 780 759 738 724Freshwater pumping power (kW) 472 448 431 416 402 390 378 367 357 346 337 330
Heat ExchangersSW dT Across Heat Exchanger (°C) 5.65 5.68 5.69 5.71 5.72 5.74 5.75 5.76 5.77 5.78 5.79 5.80SW Flow (kg/s) 1075 1022 984 951 922 895 869 844 820 797 775 761FW Flow (kg/s) 1023 973 937 905 878 852 827 803 780 759 738 724
TES TanksTES Peak Flow (kg/s) 0.00 50.00 86.04 117.43 145.21 171.03 196.03 219.53 242.26 264.21 285.05 298.98TES Tank Capacity (Ml) 0.00 1.00 2.00 3.00 4.00 5.00 6.00 7.00 8.00 9.00 10.00 11.00

A PRE-FEASIBILITY STUDY FOR DEEP SEAWATER AIRCONDITIONING SYSTEMS IN THE CARIBBEAN 60
6. RISK ANALYSIS As part of the conceptual design for the Puerto Plata and Montego Bay SWAC systems Makai has used publically available databases to assess the risks due to earthquakes and hurricanes. Earthquakes pose the greatest risk to rigid structures within the pipelines, such tunnel or trench breakouts, stiff mitered joints, or within the pump station. The HDPE pipelines themselves are extremely durable and flexible and failures due to seismic activity are not likely to occur along the flexible portions. Hurricanes can generate large waves which pose considerable risk to pipelines on the seafloor (typical in water depths less than 150m). These risks can be mitigated with proper design and anchoring to the seafloor. Hurricanes would also have the potential generate substantial damage to buildings such as the pump station due to the high winds and coastal flooding.
6.1. HURRICANES
6.1.1. Montego Bay Historical hurricane information from the National Oceanographic and Atmospheric Association (NOAA) shows that Jamaica has only received a direct hit from one major hurricane since records began. However, multiple category 4 and category 5 hurricanes have passed nearby. Figure 6-1 shows the hurricanes above category 3 (major hurricanes) that have passed Jamaica since 1842.
Figure 6-1: Major Hurricanes near Jamaica Since 1842
Dark purple lines represent category 5 hurricanes, light purple lines represent category 4 hurricanes, and red lines represent category 3 hurricanes. Three storms of particular interest are listed below:
Hurricane Allen (1980) – category 5 hurricane that was downgraded to a category 4 as is passed north of Jamaica.
Hurricane Ivan (2005) – category 4 hurricane that passed south of Jamaica. Hurricane Dean (2007) – category 5 hurricane that was downgraded to a category 4 as it
passed south of Jamaica.

A PRE-FEASIBILITY STUDY FOR DEEP SEAWATER AIRCONDITIONING SYSTEMS IN THE CARIBBEAN 61
All three of these storms had the potential for a direct hit. Even without direct impact, all three storms caused extensive damage. Makai recommends that a Montego Bay SWAC system be designed to withstand a direct hit from a category 5 hurricane.
6.1.2. Puerto Plata Historical hurricane data from NOAA shows that the Dominican Republic has been hit by 3 major hurricanes since records began. Another major hurricane passed north of the island. Figure 6-2 shows the major hurricanes that have passed the Dominican Republic since 1842.
Figure 6-2: Major Hurricanes near the Dominican Republic since 1842
Dark purple lines represent category 5 hurricanes, light purple lines represent category 4 hurricanes, and red lines represent category 3 hurricanes. Three storms of particular interest are listed below:
Okeechobee Hurricane (1928) – category 5 hurricane that passed north of the Dominican Republic, near Puerto Plata.
Dominican Republic Hurricane (1930) – category 5 hurricane that hit to the southwest of Santo Domingo.
Hurricane David (1979) – category 5 hurricane that hit to the southwest of Santo Domingo.
The two storms that hit near Santo Domingo caused extensive damage.
6.1.3. Risk Mitigation Makai recommends that a Puerto Plata SWAC system be designed to withstand a direct hit from a category 5 hurricane.
6.2. EARTHQUAKES
6.2.1. Montego Bay Jamaica sits in a seismically active area. Dr. Ducan Agnew of the Scripps Institute of Oceanography has compiled a Google Earth KMZ file showing earthquakes with a magnitude greater than 6.5 (on the Richter scale) since 1990. An excerpt from the file is shown in
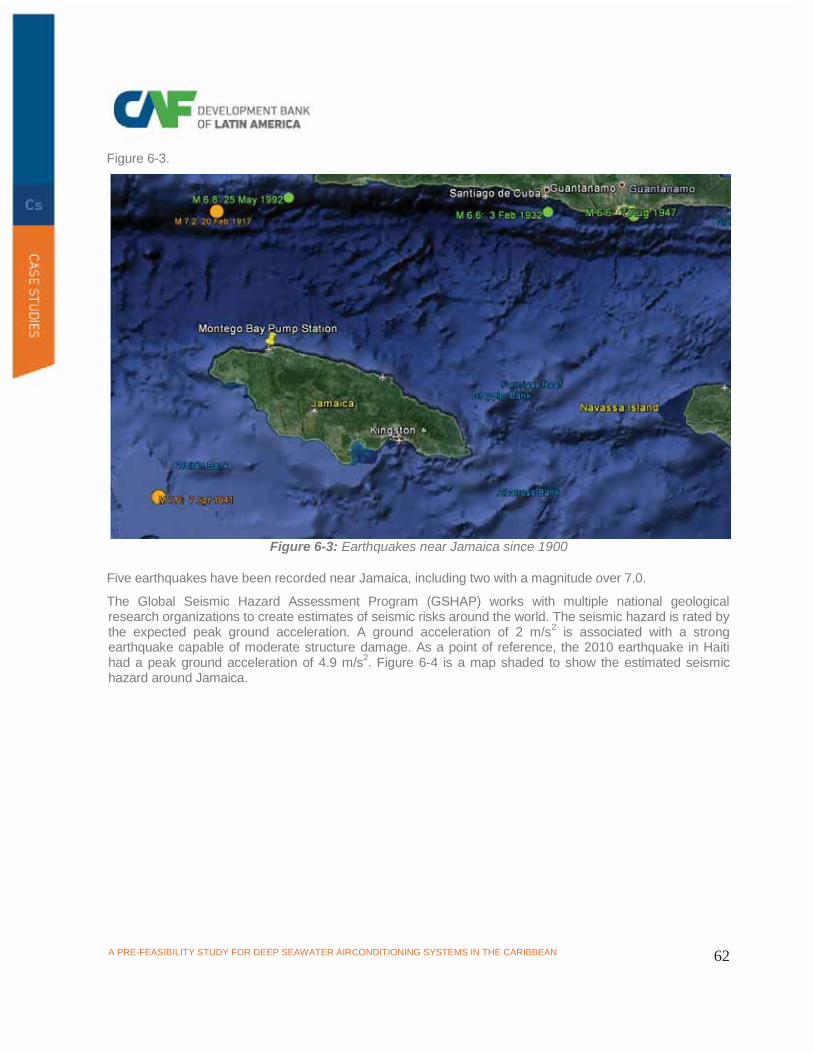
A PRE-FEASIBILITY STUDY FOR DEEP SEAWATER AIRCONDITIONING SYSTEMS IN THE CARIBBEAN 62
Figure 6-3.
Figure 6-3: Earthquakes near Jamaica since 1900
Five earthquakes have been recorded near Jamaica, including two with a magnitude over 7.0.
The Global Seismic Hazard Assessment Program (GSHAP) works with multiple national geological research organizations to create estimates of seismic risks around the world. The seismic hazard is rated by the expected peak ground acceleration. A ground acceleration of 2 m/s2 is associated with a strong earthquake capable of moderate structure damage. As a point of reference, the 2010 earthquake in Haiti had a peak ground acceleration of 4.9 m/s2. Figure 6-4 is a map shaded to show the estimated seismic hazard around Jamaica.

A PRE-FEASIBILITY STUDY FOR DEEP SEAWATER AIRCONDITIONING SYSTEMS IN THE CARIBBEAN 63
Figure 6-4: GSHAP Seismic Hazard Map of Jamaica
The greatest risk is on the south side of the island, away from Montego Bay.
Table 6-1 shows the specific ground acceleration estimates near Montego Bay.
Table 6-1: GSHAP Peak Ground Acceleration Estimates near Montego Bay
Latitude Longitude Acceleration
[deg] [deg] [m/s^2]
18.4 -78.0 2.2
18.4 -77.9 2.3
18.4 -77.8 2.3
18.5 -78.0 2.2
18.5 -77.9 2.3
18.5 -77.8 2. 4
18.6 -78.0 2.3
18.6 -77.9 2.3
18.6 -77.8 2.4
The GSHAP rates Montego Bay at the upper end of the “Moderate Hazard” category.

A PRE-FEASIBILITY STUDY FOR DEEP SEAWATER AIRCONDITIONING SYSTEMS IN THE CARIBBEAN 64
6.2.2. Puerto Plata The Dominican Republic sits in a seismically active area. Dr. Ducan Agnew of the Scripps Institute of Oceanography has compiled a Google Earth KMZ file showing earthquakes with a magnitude greater than 6.5 (on the Richter scale) since 1990. An excerpt from the file is shown in Figure 6-5.
Figure 6-5: Earthquakes near the Dominican Republic since 1900
Seventeen earthquakes have been recorded near the Dominican Republic, including seven with a magnitude over 7.0.
The Global Seismic Hazard Assessment Program (GSHAP) works with multiple national geological research organizations to create estimates of seismic risks around the world. The seismic hazard is rated by the expected peak ground acceleration. A ground acceleration of 2 m/s2 is associated with a strong earthquake capable of moderate structure damage. As a point of reference, the 2010 earthquake in Haiti had a peak ground acceleration of 4.9 m/s2. Figure 6-6 is a map shaded to show the estimated seismic hazard around the Dominican Republic.

A PRE-FEASIBILITY STUDY FOR DEEP SEAWATER AIRCONDITIONING SYSTEMS IN THE CARIBBEAN 65
Figure 6-6: GSHAP Seismic Hazard Map of the Dominican Republic
The greatest risk is on the south side of the island, away from Puerto Plata.
Table 6-2 shows the specific ground acceleration estimates near Montego Bay.
Table 6-2: GSHAP Peak Ground Acceleration Estimates near Puerto Plata
Latitude Longitude Acceleration
[deg] [deg] [m/s^2]
19.7 -70.8 3.1
19.7 -70.7 3.2
19.7 -70.6 3.3
19.8 -70.8 3.1
19.8 -70.7 3.2
19.8 -70.6 3.3
19.9 -70.8 3.1
19.9 -70.7 3.2
19.9 -70.6 3.3
The GSHAP rates Puerto Plata near the middle of the “High Hazard” category.

A PRE-FEASIBILITY STUDY FOR DEEP SEAWATER AIRCONDITIONING SYSTEMS IN THE CARIBBEAN 66
6.2.3. Risk Mitigation The seismic risk of a SWAC system can be separated into two categories: onshore and offshore. Makai recommends that the design of the onshore components of a SWAC system at both sites be supported by geotechnical and/or structural engineers familiar with seismically robust buildings as well as local building codes. Use of HDPE for the distribution system will increase the resiliency of the system. Though HDPE pipes will not withstand large scale ground movement, they can accommodate significantly more motion than steel pipes.
Evaluation of offshore seismic risk will require a detailed seabed survey. The survey may include high-resolution bathymetric data, sub-bottom sonar data, video of the seabed, and seabed samples. An offshore geotechnical engineer will be required to evaluate the seismic risk to the offshore pipes during an earthquake. The primary risk is likely to be collapse of a portion of the seabed. A collapsing seabed will move downhill, and will drag the pipe with it. This situation can put significant tension in the pipe and could cause it to fail. Another possibility is that the pipe could be crushed under debris falling from closer to shore. The design of the offshore pipes can include features to alleviate these risks, but their nature will depend on the specific risks uncovered during the offshore survey.
6.3. BUILDING RETROFIT Makai’s SWAC model assumes that all cooling customers use a chilled water (also known as hydronic) air conditioning system. Chilled water cooling uses a mechanical chiller to produce cold water at 6-7oC. This chilled water is circulated around the customer’s facility and is utilized by fan coil units, air handling units, or chilled beams to cool the conditioned spaces. The additional data gathered in Montego Bay (see section 2.1) showed three hotels that use direct expansion air handling units, mini-split units, and window units.
Direct expansion air handling units are large air conditioners typically placed on the roof of buildings. These air conditioners often take air from multiple spaces within a building and use the evaporator coils of the refrigerant to cool and dehumidify the air before returning it to the building.
Figure 6-7: Example of a Rooftop Air Handling Unit
Mini-split and window units are typically used to cool individual rooms. Mini-splits have the evaporator and condenser in separate locations with refrigerant piping connecting them. The condenser is usually located outside with an integral fan for condenser cooling. The evaporator is located within the room. Unlike a full split-unit, which usually has ducts that direct cool air into multiple rooms within a building, a mini-split is usually ductless and cools only the room where it is located.

A PRE-FEASIBILITY STUDY FOR DEEP SEAWATER AIRCONDITIONING SYSTEMS IN THE CARIBBEAN 67
Figure 6-8: Example of Mini-Split Air Conditioning Systems
Window units are small self-contained air conditioners. They are placed within a window with the condenser portion outdoors and the evaporator portion indoors. They cool only the room in which they are located.
Figure 6-9: Example of Window Unit Air Conditioners
Any building using one of the above three systems will need to be retrofit before it can be connected to a SWAC system. Air handling units will be the easiest components to retrofit – the direct expansion equipment that currently feeds the air handlers would be replaced with chilled water equipment. Some modification to the air handlers may also be required. The mini-split and window units will require more extensive modifications if the areas they serve are to be cooled with SWAC. These units are typically small – on the order of 1-3 tons. Each one will require chilled water distribution pipes and new cooling equipment. The cost and feasibility of the retrofit cannot be determined without a detailed visit to each resort. In the United States, retrofit of cooling systems are estimated based on the floor plan area of a building, and can cost up to $200/m2. Makai recommends that CAF hire an HVAC design firm during the next phase of analysis and ask them to evaluate the retrofit feasibility and cost for each resort to be connected to a SWAC system in Montego Bay and Puerto Plata. Retrofit costs were not included in Makai’s economic analysis.
Retrofitting customer’s buildings introduces a new set of questions:
Who will pay for and maintain the upgrades – the owner of the SWAC utility or the owner of the building?
If the building owner is to be responsible for upgrades, how can the SWAC utility incentivize building owners to make the changes?
How will the need for retrofit affect the SWAC system construction and operation timetable? How many building owners will refuse to upgrade their equipment?
A PRE-FEASIBILITY STUDY FOR DEEP SEAWATER AIRCONDITIONING SYSTEMS IN THE CARIBBEAN 68
The risks posed by building retrofit to the SWAC developer relate to capital cost and system size. If the SWAC developer will be responsible for the retrofit costs, then the capital cost of the SWAC system will increase. It may be possible to offset the extra capital expense in the cooling sales contract with retrofit customers. It is also possible that the owners of buildings that require retrofit will not be interested in connection to the SWAC system. This reduces the total size of the system, which adversely impacts profitability. Makai investigated the impact of reduced load in sections 5.1.1 and 5.2.2.

A PRE-FEASIBILITY STUDY FOR DEEP SEAWATER AIRCONDITIONING SYSTEMS IN THE CARIBBEAN 69
7. MARKETING PLAN Makai worked with Climespace to develop a marketing strategy for a SWAC system. Climespace is an experienced district cooling operator that has been supplying cooling to customers in the heart of Paris since 1991. This section is a discussion on their experience with marketing strategies for district cooling and how such strategies can be applied in Montego Bay and Puerto Plata.
7.1. CUSTOMER PROFILES District cooling customers can be categorized by how they utilize cooling. Basic customers have significant daily load variation. Basic customers include hotels, universities, cinemas, airports, shopping centers, and office buildings. In most district energy systems, these customers require between 1500 and 3500 full-load cooling hours annually (17% - 40% average utilization). The Caribbean differs from other areas serviced by district energy in that consistently high temperatures and humidity keep the annual average cooling loads high. Hotels have been estimated to have a 5690 full-load cooling hours annually (65% average utilization), and commercial buildings have been estimated to have 4190 full-load cooling hours annually (48% average utilization).
A more valuable category of customer includes industrial entities, hospitals, and data centers. These customers have even load curves that require extensive cooling 24 hours per day. An even load curve results in higher revenue per ton of installed load and increase the profitability of a district energy cooling system. The Caribbean again differs from typical district energy sites. There is little industrial load available in Montego Bay or Puerto Plata; the only example being the Bogue Power Station in Montego Bay (if turbine inlet cooling is installed). The cooling demand of Caribbean hospitals is not as high as that found in the United States or France, so they may not fall into the valuable customer category. No data centers are currently located in Montego Bay or Puerto Plata, but the low cost of cooling provided by SWAC may be used to attract them. It may be valuable to investigate the local data infrastructure in the Caribbean to determine of Montego Bay or Puerto Plata could host a data center.
7.1.1. Load Segmentation The majority of the load in Montego Bay, and the entire load in Puerto Plata, are of the basic customer type. The only customer with an even load curve is the Bogue Power Station in Montego Bay. Table 7-1 shows the load segmentation in Montego Bay, and Table 7-2 shows the load segmentation in Puerto Plata.
Table 7-1: Load Segmentation in Montego Bay
Table 7-2: Load Segmentation in Puerto Plata
Estimated Load (Tons) %Hotels-Resorts 5176 67Airport 1500 20Shopping Centers 100 1University 500 7Industrial 400 5
Total 7676
Segmentation
Estimated Load (Tons) %Hotels-Resorts 6835 100
Segmentation

A PRE-FEASIBILITY STUDY FOR DEEP SEAWATER AIRCONDITIONING SYSTEMS IN THE CARIBBEAN 70
Although neither site will be able to take advantage of high-value customers with even load curves, the unique climate of the Caribbean makes basic customers more profitable, which offsets the lack of industrial loads.
7.2. SWAC DEVELOPMENT STRATEGY Development of Caribbean SWAC requires a two-pronged approach: attraction of developer interest and market preparation. Attracting developer interest will require educating developers about the opportunity presented by SWAC, and creating an environment where they can get access to the capital required to create a SWAC system. Preparation of the market will require educating potential SWAC customers, getting the cooperation of local stakeholders in the cooling and energy production industries, and getting government support to speed up the development process.
7.2.1. Developer Interest Seawater air conditioning has several advantages over conventional cooling. These advantages create the opportunity for SWAC to undercut conventional cooling prices, and should be used to attract investment capital and developer interest to the region. The advantages include:
Improved energy efficiency – SWAC uses 10%-20% of the electricity of conventional cooling. This significantly reduces the operating cost and allows a SWAC developer to sell cooling at a price that is insensitive to prevailing energy costs.
Limitation of CO2 emissions – the commercial climate on carbon production is changing. Multiple government and international agencies are working to put economic penalties on technologies that add carbon to the atmosphere. The low energy use of SWAC will allow a developer to avoid emerging carbon costs, and instead take advantage of carbon credits used to reward low-carbon technologies.
No use of refrigerant – refrigerant fluids used in conventional chillers have traditionally been environmentally toxic, able to deplete the ozone layer and acting as greenhouse gasses. Refrigeration codes are in continuous flux as older, more toxic fluids are outlawed and newer and more expensive fluids are mandated. Regulation of refrigerants has also increased, with laws controlling how they are obtained, transported, and disposed of. Since SWAC uses no mechanical chilling, all of these regulatory hurdles are avoided. This simplifies the operation of a SWAC system compared to conventional cooling, and avoids the risk of future changes to refrigerant regulations.
The largest disadvantage of SWAC is the large up-front capital cost. SWAC is 6-9 times more expensive than conventional cooling, which represents a significant risk to a developer. An important tool in mitigating this risk is high-confidence cost estimates. Early-stage SWAC cost estimates have high uncertainty and include large contingency costs. Completion of a high-resolution bathymetric survey would allow a detailed SWAC system conceptual design with a higher confidence cost estimate. No amount of design work can avoid all cost risks (contractor bidding anomalies, environmental permitting challenges, commodity price fluctuations, etc), but a full conceptual design based on high-resolution bathymetry will be of great value to developers.
7.2.2. Market Preparation The fundamental advantages of a SWAC system are not of any value if a developer cannot convert them into a profit. Profitability of a SWAC system is contingent on getting potential cooling customers to recognize the economic advantage of connecting to the district network. The opportunities of interest to the potential SWAC market include:

A PRE-FEASIBILITY STUDY FOR DEEP SEAWATER AIRCONDITIONING SYSTEMS IN THE CARIBBEAN 71
Use of local resources – Makai recommends using local contractors for as much of the work as possible. This supports the local economy, which stakeholders and governments see as positive. It also keeps the capital costs for the project down, which is helpful for developers.
Climate change – any current discussion about energy use includes the topic of climate change. There is a growing interest in energy efficiency in the general populace, and this had translated into an interest by industries that serve the populace, including resorts and commercial facilities. Connection to a SWAC system, particularly in tropical island locations, can represent a major energy savings. This savings can be advertised to resort customers for a competitive advantage over other resorts that use conventional cooling.
Development of local expertise – district cooling systems, including SWAC, requires lager facilities than do site-specific cooling systems. The design and installation of these facilities will require local companies to expand their capabilities, which will improve the commercial and industrial capabilities of the area. This expanded capability can be exported to neighboring cities, or even islands.
Reduction in industrial equipment – cooling equipment is loud and requires maintenance. A facility that connects to a SWAC system need not operate or maintain mechanical chillers. This improves the atmosphere of the facility, which is a premium benefit to resorts, and reduces maintenance costs.
System reliability – A SWAC system can replace dozens (or even hundreds) of individual pieces of cooling equipment. The SWAC system has only few major moving parts (the seawater pumps and chilled water pumps), which it is recommended be installed with on-line backup that automatically compensates for failures. The remainder of a SWAC system consists of static components (pipes) and components that require infrequent maintenance (valves and meters). The significant reduction in the number of components that require maintenance reduces the likelihood of failure. The centralization of all components reduces response time to failure and allows for more consistent maintenance. The end result is improved system uptime compared to site-specific cooling technology.
There are also market-based threats to the long term economic viability of a SWAC system. These threats must be taken into account when creating the SWAC business plan. Some threats include:
Decrease in the price of electricity – SWAC is most economical when electrical rates are high. If electrical rates decrease, then conventional cooling costs decrease significantly, but SWAC costs only decrease slightly. If the fall in electrical rates comes during (or before) the design phase of the SWAC system, then the predicted profitability of the system will fall, and the developer may lose interest. For an already installed SWAC system with contracted customers, a falling electrical rate will erode the perceived value of connection to the SWAC system.
Hurricanes and earthquakes – a SWAC system is subject to natural disasters as much as any facility in the area. Makai typically designs the offshore portions of a SWAC system to withstand the most severe conditions expected within 100 years, and recommends that the onshore facilities be designed to the same standard. With this approach, the SWAC system is likely to survive events that its customers do not.
Insolvency of customers – a SWAC system requires a minimum load to maintain profitability. If customers leave the system due to bankruptcy, natural disaster, or for other reasons, SWAC system revenue will drop. At some point, the revenue will drop to the point that the debt service on capital cost cannot be paid, and the system will become unprofitable.

A PRE-FEASIBILITY STUDY FOR DEEP SEAWATER AIRCONDITIONING SYSTEMS IN THE CARIBBEAN 72
7.3. CUSTOMER-UTILITY RELATIONSHIP The relationship between the SWAC utility and its customers must be tailored to maintain SWAC developer profit while enticing customers to connect to the system. The relationship can be structured in terms of the customer requirements and rate structure
7.3.1. Customer Requirements The customer requirements will define what the SWAC system must deliver in order to provide adequate cooling and dehumidification. The requirements will include:
Peak cooling load – the peak is the maximum amount of cooling that the SWAC system must be able to deliver to the customer. This will typically be the maximum expected cooling demand on the customer’s facility during the peak cooling day. Most of the time, the SWAC system will deliver less than the peak amount of cooling.
Supply temperature – each customer’s cooling equipment will have a maximum allowable chilled water supply temperature. Exceeding this temperature will cause the equipment to provide inadequate cooling, inadequate dehumidification, or both. Therefore, the SWAC system must provide the required temperature (or colder) at all times, regardless of the cooling load.
Flow rate – each piece of the customer’s cooling equipment will have a flow rate requirement. This requirement may be a function of cooling load (for modern equipment), or be constant (for older equipment). The SWAC system must provide the required flow to the customer at all cooling levels.
Some of the customer requirements discussed above may be flexible, even if the customer does not realize it. The SWAC utility employees are likely to have a more sophisticated understanding of cooling systems than do those of the customers (similar to how electrical utilities have a better understand of electrical consumption than their customers). The utility can offer services to customers to help them manage their requirements, to the benefit of the SWAC system. Some options include:
Evaluation of existing cooling equipment – the utility can offer to inspect customer facilities to identify if updating some cooling components could improve the efficiency of the system. The upgrades could reduce peak cooling load, increase supply temperature, or decrease flow rate.
Optimization of cooling control schemes – the utility can evaluate how customer cooling systems are controlled, and make recommendations for more efficient control schemes. The benefit could be a reduction in peak cooling load or in annual average utilization.
Installation of cooling load monitoring equipment – customers may not realize how cooling is in use (or is wasted) at their facility. A monitoring system can reveal opportunities for system optimization.
Some of the above options have a direct benefit to the utility, particularly those that decrease peak cooling load or flow rate. Both options free up capacity for new customers to be added to the system. These options should be encouraged with rate structure incentives as discussed in the next section. Other options, such as those that reduce annual average cooling usage without decreasing peak load, may not be of obvious benefit to the SWAC utility. These options can be used to generate customer satisfaction (which could result in interest from new customers), or to diversify the total cooling load by shifting demand away from peak times (which frees up capacity that can be sold to new customers).
7.3.2. Rate Structure The rate structure describes how customers will be charged for cooling. This structure is vital in successfully marketing SWAC to potential customers, and must be tailored to each customer’s specific needs. Some of the rate structure considerations include:
A PRE-FEASIBILITY STUDY FOR DEEP SEAWATER AIRCONDITIONING SYSTEMS IN THE CARIBBEAN 73
Term – Climespace recommends a contract period of 10 years with a renewal option every 5 years. The contract term is vital to SWAC because a steady, long-term customer base is required to pay for the debt service on the capital investment. Reductions in load do not translate into large reductions in SWAC operating costs.
Existing equipment – most customers will have existing cooling equipment that represent a significant capital investment. If SWAC is to replace this equipment, the rate structure may need to reflect the value of this equipment. Some options include:
The SWAC utility purchases the used cooling equipment. The equipment could be used to create on-line backup in case of seawater system failure (although Makai considers seawater system failure to be unlikely). It could also be used to create a mobile response unit capable of supplying emergency cooling to individual customers.
The early-term rate structure could be discounted to offset the capital investment the customer has already made. The discount can be customized to reflect the age and power of the existing cooling equipment.
The total rate can be broken down into three categories: a fixed charge, a demand charge, and a usage charge.
Fixed charge – covers the fixed costs of delivering cooling to customers. Examples include portions of the cost of the seawater pipe system, heat exchangers, and distribution system.
Demand charge – covers the costs associated with delivering a particular amount of cooling to a customer. This is intended to include the incremental costs of installing distribution pipes, pumps, and heat exchangers to supply each customer. It is recommended that the seawater pumping system be operated at constant volume, so the cost of electricity to run the seawater pumps would also be included in the demand charge.
Usage charge – covers the variable cost per liter of chilled water delivered to the customer. This includes the cost of the electricity required to pump the chilled water to each customer.
Rate structure tuning – the relative ratio of the three components of the rate charged to customers does not have to reflect the actual cost ratios of the utilities. For example, the usage charge can be raised to encourage energy conservation within each customer. Climespace recommends that the fixed charge be 40% of the total rate, and that the sum of the demand charge and usage charge be 60% of the total rate.
Rate structure incentives – the SWAC utility can offer rate incentives to encourage customers to adopt practices that benefit SWAC system profitability. Some examples include average utilization, load curve adherence, and flow rate variability.
Average utilization – customers with high average utilization consume more chilled water per year (without requiring an increase in overall system size) than customers with low average utilization. The fixed charge and/or demand charge for these customers could be lowered in order to attract more of them.
Load curve adherence – customers that use more cooling during off-peak times allow the SWAC utility to sell more chilled water during times when the system is under-utilized. A customer that adheres to a load curve that benefits the SWAC system (makes high use of off-peak times) may be offered discounted rates.
Flow rate variability – the variable cost of operating a SWAC system is sensitive to the flow rate requirements of customer equipment. In the worst case scenario, all customer equipment operates at constant flow and the utilities operating costs are insensitive to cooling load. In such a case, the usage charge collected by the utility drops during off-peak times, but the cost to operate the system does not change. In the best case scenario, customer cooling equipment varies flow rate linearly with cooling load, and the utilities operating costs go down during off-

A PRE-FEASIBILITY STUDY FOR DEEP SEAWATER AIRCONDITIONING SYSTEMS IN THE CARIBBEAN 74
peak times. The utility can offer discounts that encourage customers to make use of cooling components that reduce their flow rate during low-load conditions
Flow rate reduction – modern cooling equipment is able to obtain the same amount of cooling as older equipment, but at a reduced flow rate. Since SWAC cooling capacity is limited by flow, any reduction in customer flow rate requirements represents liberated cooling capacity. If enough customers decrease their flow (without decreasing their cooling usage), then new customers could be added to the SWAC system without having to increase the output of the cold water intake pipe or distribution system. The rate structure could offer discounts to customers who installed updated lower-flow cooling components.

A PRE-FEASIBILITY STUDY FOR DEEP SEAWATER AIRCONDITIONING SYSTEMS IN THE CARIBBEAN 75
8. CONCLUSIONS
8.1. MONTEGO BAY 1. Installation of a SWAC system is expected to be technically viable, but actual costs and feasibility
of the system will depend on more detailed bathymetric and site conditions. Makai has designed and installed deep HDPE intake pipes in conditions similar to those expected offshore of Montego Bay, and multiple pipe design options have been developed to accommodate various seabed features. The general characteristics of the preliminary Montego Bay SWAC system include:
a. Cold water intake depth = 879m b. Intake temperature = 6.2oC c. Temperature delivered to customers = 7.2oC d. Intake pipe length = 4.5km e. Intake pipe diameter = 1200mm f. Number of potential customers = 18 g. Peak cooling load = 7676 tons h. Distribution system total length = 41.2km
2. A SWAC system in Montego Bay, Jamaica is likely to be cost effective. The simple payback period is predicted to be 6 years assuming a cost of electricity of $0.36kWh.
3. A Montego Bay SWAC system does not benefit from the use of hybrid SWAC or installation of a thermal energy storage system.
4. Makai assessed the sensitivity of a SWAC system in Montego Bay to total installed load and electrical rate. A 50% reduction in electrical rate increases the simple payback period to 8.7 years. A 50% reduction in installed load increases the simple payback period to 8.9 years.
5. A detailed bathymetric survey is recommended before further offshore pipe design is carried out. 6. Resort hotels in Montego Bay are wary of inquiries relating to cooling equipment, cooling cost,
and energy use. Makai recommends that CAF include local stakeholders in the SWAC planning process.
7. Montego Bay is at risk for a direct hit from a category 5 hurricane. The SWAC system should be designed handle the loads with such a storm. The offshore pipe will likely require post-deployment anchoring in the shallower near shore zones.
8. The Global Seismic Hazard Assessment Program (GSHAP) rates Montego Bay as having moderate seismic risk. The predicted ground accelerations are 2.9 m/s2, and onshore structure design should take that level of seismic event into account. Makai recommends that a geotechnical survey be carried out before detailed design work on the offshore pipes begins. A marine geotechnical engineer should be hired to evaluate the results of the geotechnical survey and provide design conditions for the pipes.
8.2. PUERTO PLATA 1. Installation of a SWAC system is expected to be technically viable, but actual costs and feasibility
of the system will depend on more detailed bathymetric and site conditions. Makai has designed and installed deep HDPE intake pipes in conditions similar to those expected offshore of Puerto Plata, and multiple pipe design options have been developed to accommodate various seabed features. The general characteristics of the preliminary Puerto Plata SWAC system include:
a. Cold water intake depth = 1082m

A PRE-FEASIBILITY STUDY FOR DEEP SEAWATER AIRCONDITIONING SYSTEMS IN THE CARIBBEAN 76
b. Intake temperature = 5.8oC c. Temperature delivered to customers = 7.2oC d. Intake pipe length = 8.0km e. Intake pipe diameter = 1100mm f. Number of potential customers = 16 g. Peak cooling load = 6835 tons h. Distribution system total length = 13.4km
2. A SWAC system in Puerto Plata, the Dominican Republic is likely to be cost effective. The simple payback period is predicted to be 4.5 years.
3. Makai assessed the sensitivity of a SWAC system in Puerto Plata to total installed load and electrical rate. A 50% reduction in electrical rate increases the simple payback period to 6.7 years. A 50% reduction in installed load increases the simple payback period to 6.9 years.
4. A SWAC system in Puerto Plata does not benefit from hybrid SWAC, but does benefit from installation of a thermal energy storage system.
5. A detailed bathymetric survey is recommended before further offshore pipe design is carried out. 6. Resort hotels in Puerto Plata are wary of inquiries relating to cooling equipment, cooling cost, and
energy use. Makai recommends that CAF include local stakeholders in the SWAC planning process.
7. Puerto Plata is at risk for a direct hit from a category 5 hurricane. The SWAC system should be designed handle the loads with such a storm. The offshore pipe will likely require post-deployment anchoring in the shallower near shore zones.
8. The Global Seismic Hazard Assessment Program (GSHAP) rates Puerto Plata as having high seismic risk. The predicted ground accelerations are 3.2 m/s2, and onshore structure design should take that level of seismic event into account. It is recommended that a geotechnical survey be carried out before detailed design work on the offshore pipes begins. A marine geotechnical engineer should be hired to evaluate the results of the geotechnical survey and provide design conditions for the pipes.