A practical methodology to select fretting palliatives...
24
This is a repository copy of A practical methodology to select fretting palliatives: Application to shot peening, hard chromium and WC-Co coatings . White Rose Research Online URL for this paper: http://eprints.whiterose.ac.uk/7693/ Article: Kubiak, K., Fouvry, S. and Marechal, A.M. (2005) A practical methodology to select fretting palliatives: Application to shot peening, hard chromium and WC-Co coatings. Wear, 259 (1-6). 367 - 376. ISSN 0043-1648 https://doi.org/10.1016/j.wear.2005.01.030 [email protected] https://eprints.whiterose.ac.uk/ Reuse See Attached Takedown If you consider content in White Rose Research Online to be in breach of UK law, please notify us by emailing [email protected] including the URL of the record and the reason for the withdrawal request.
Transcript of A practical methodology to select fretting palliatives...

This is a repository copy of A practical methodology to select fretting palliatives: Application to shot peening, hard chromium and WC-Co coatings.
White Rose Research Online URL for this paper:http://eprints.whiterose.ac.uk/7693/
Article:
Kubiak, K., Fouvry, S. and Marechal, A.M. (2005) A practical methodology to select fretting palliatives: Application to shot peening, hard chromium and WC-Co coatings. Wear, 259 (1-6). 367 - 376. ISSN 0043-1648
https://doi.org/10.1016/j.wear.2005.01.030
[email protected]://eprints.whiterose.ac.uk/
Reuse
See Attached
Takedown
If you consider content in White Rose Research Online to be in breach of UK law, please notify us by emailing [email protected] including the URL of the record and the reason for the withdrawal request.

1
A practical methodology to select fretting palliatives: application to
shot peening, hard chromium and WC-Co coatings
K.J. Kubiak¹, S. Fouvry¹,, A.M Marechal²
¹ LTDS, CNRS UMR 5513, Ecole Centrale de Lyon,36 Avenue Guy de Collongue, 69134
Ecully, France
² SNCF, AEF-S, 21, avenue du Président S. Allende 94407 Vitry Sur Seine, France
Abstract
Considered as a plague for numerous industrial assemblies, fretting, associated to slight
oscillatory displacement, is encountered in all quasi-static contacts subjected to vibration.
Depending on sliding conditions, cracking or wear damage can be observed. During the past
three decades there has been a huge development in surface treatments. Thousands of new
surface treatments and coatings are now available. The critical challenge is to evaluate such
treatments against fretting loadings. To achieve this objective, a fast fretting methodology has
been developed. It consists in quantifying the palliative friction, cracking and wear responses
through a very small number of fretting tests. By defining quantitative variables, a normalized
polar fretting damage chart approach is introduced. Applied to shot peening, chromium
coatings and WC-Co coatings, it demonstrates the potential benefit of a thermal sprayed WC-
Co coating.
Keywords: fretting, fatigue, Cr, WC-Co, friction, cracking, wear.
1. Introduction
Fretting is a slight oscillatory movement, which may occur between contacting surfaces
subjected to vibration or cyclic stress. Considered to be very detrimental for modern industry,
fretting is encountered in all quasi-static assemblies subjected to vibration, and thus concerns
many technologies like helicopters, aircraft, trains, ships, trucks, bridge cables, electrical
connections etc … (Fig. 1) [1].

2
microdisplacements
[< 100 µm]
contact
pressure
blade / disk contactsin turbine engine
prosthesis
electrical connectors
microdisplacements
[< 100 µm]
contact
pressure
blade / disk contactsin turbine engine
prosthesis
electrical connectors
Figure 1 : Illustration of fretting damage.
Partial slip, which is observed for the smallest displacement amplitudes, is characterized by a
closed elliptical fretting loop (i.e. evolution of the tangential force (Q) versus the applied
displacement (h) (Fig. 2)). It corresponds to a composite contact displaying sliding and
sticking zones. Larger gross slip displacement amplitude conditions, characterized by a
quadratic dissipative fretting loop, are related to full sliding conditions. Waterhouse et al. [2]
first indicated a correlation between sliding regime and damage evolution (Fig. 2). Cracking
has been shown to be mainly observed under the partial slip condition, whereas wear is
observed for larger gross slip amplitudes. The damage transition, linked to the displacement
amplitude transition (ht), is not so sharply marked. However, competitive wear and cracking
phenomena are usually observed near this transition. Note that this first description was
supported by the fretting map concept first introduced by Vingsbo [3] and completed by
Vincent and co-authors [4]. Quantitative approaches have since been developed to formalize
either the cracking phenomena from multiaxial fatigue approaches [5-9] or wear kinetics
based on a dissipated energy description [8, 10].
dis
pla
ce
me
nt
am
plit
ud
e partial
slip
Q(N)
(µm)
contact loadings structure of the interface
stickzone
slidingzone
cracking
gross
slip
Q(N)
(µm)
fullsliding
wear
sliding transition : t
dis
pla
ce
me
nt
am
plit
ud
e partial
slip
Q(N)
(µm)
contact loadings structure of the interface
stickzone
slidingzone
cracking
gross
slip
Q(N)
(µm)
fullsliding
wear
sliding transition : t

3
Figure 2 : Illustration of the fretting damage versus the imposed sliding condition.
However, very little has been done to provide a global description of wear and cracking
induced by fretting loadings. Even less has been produced regarding a synthetic and complete
comparison of palliatives like surface treatments. The purpose of this research is to attempt to
answer such a fundamental need by focusing on the two following points:
- The development of a fretting wear test to analyse both wear and cracking induced by
fretting through single contact geometry,
- The development of a simplified test methodology to identify the constitutive fretting
damage parameters describing fretting behaviours (i.e. friction, wear and cracking).
Applied to a reference 30NiCrMo8/52100 steel contact, this methodology has been
extensively used to compare and select several surface treatments like plain shot peening, shot
peening + hard chromium electroplating coatings and shot peening + High Velocity Oxy-Fuel
(HVOF) WC-Co coatings.
2. Experimental procedure
2.1 Fretting test
As previously mentioned, the applied normal loadings must satisfy the stress conditions,
allowing cracking and wear to take place. Displacement control also requires sufficient
resolution to cover both partial and gross slip conditions. These two requirements have been
satisfied by adapting an original fretting wear test apparatus onto a classical tension-
compression (25kN) hydraulic machine already described elsewhere [9]. The contact
configuration is presented in Figure 3a.

4
amplitudes
(b)
dissipatedenergy
Ed
displacement, (µm)
( Q*, * )
tang
ential
forc
eQ
,(N
)
sliding
amplitude g
fixed
mobile20
mm
Q(t)
cylinder52100 steel
measuredtangential
displacement
(t)
measuredtangential
force
plane(studied
materials)
(a)
amplitudes
(b)
dissipatedenergy
Ed
displacement, (µm)
( Q*, * )
tang
ential
forc
eQ
,(N
)
sliding
amplitude g
(b)
dissipatedenergy
Ed
displacement, (µm)
( Q*, * )
tang
ential
forc
eQ
,(N
)
sliding
amplitude g
fixed
mobile20
mm
Q(t)
cylinder52100 steel
measuredtangential
displacement
(t)
measuredtangential
force
plane(studied
materials)
(a)
fixed
mobile20
mm
Q(t)
cylinder52100 steel
measuredtangential
displacement
(t)
measuredtangential
force
plane(studied
materials)
(a)
Figure 3 : Test procedure : (a) Fretting setup; (b) Extraction of the contact loading parameters
from the fretting loop.
By imposing a 5Hz frequency, the normal force (P) is kept constant while the tangential force
(Q) and displacement (h) are recorded, which permits the plotting of Q-h fretting loops (Fig.
3b). Thus quantitative variables including the displacement (h*) and tangential force (Q*)
amplitudes, dissipated energy (Ed) and sliding amplitudes (hg) can be extracted. The global
loading parameters imposed over the test duration like: the average tangential force
amplitude,
N
1i
i** Q
N
1Q (1)
the cumulated dissipated energy,
N
1i
did EE (2)
and Archard’s product of the normal force by the sliding distance:

5
N
1i
gii 4PPS (3)
can then be calculated.
Prior to testing, all specimens are ultrasonically cleaned first in acetone and then the sliding
surfaces are cleaned with ethanol just before contact. All tests are carried out in an ambient
laboratory environment (in air, at room temperature), in unlubricated conditions and with
relative humidity between 40-50%.
2.2 Studied materials and surface treatments
Substrate and counterbody
Inspired by an industrial application, the studied tribo-couple consists of a low alloy
30NiCrMo8 steel (atomic composition: 0.31% C; 1.06% Mn; 1.1 %Cr; 0.79 %Ni) used as the
substrate for surface treatments fretted against a 52100 steel. The 30NiCrMo8 steel was
machined to 10x10x15 mm square cubes and polished on one side to a very low surface
roughness (Ra < 0.05 µm). A similar surface roughness was measured on the 40 mm radius
52100 AISI steel cylinder counterbody. To verify plane strain conditions, the contact length
(L) was fixed at 5 mm inducing an a/L ratio below 0.1 (i.e. a: half width of the Hertzian
contact). The studied 30NiCrMo8 steel was heat treated at 820°C, oil quenched (20°C) and
temperate at 520±5 ºC for 2 hours to obtain the mechanical properties listed in Table 1.
Table 1 : Mechanical properties of the steel involved in the fretting analysis.
52100
(counterbody)
30NiCrMo
(substrate)
Elastic modulus, E (GPa) 210 200
Poisson ratio, 0.29 0.3
Yield stress, Y02 (MPa) 1700 740
Maximum stress, R (MPa) 2000 890
Studied Surface Treatments
Three classical surface treatments, extensively applied against fretting damage, have been
investigated.
Shot peening

6
Shot peening, applied to all the coated substrates, was conducted following the conventional
procedure of 0.0063A (200% recovering and balls of 0.6 mm diameter). Carried out on an air
blast machine it satisfies the MIL-S-13165 standard, equivalent to an ALMEN intensity of
0.2-0.3 mm. The average roughness of the specimens was Ra=2 µm.
Shot peening + WC-Co HVOF coating
A tungsten carbide thermal spray coating was applied to the shot peened specimens, using a
HP/HVOF process. A WC-17% Cobalt powder was used to reach a 140 µm coating thickness.
An average surface roughness Ra=0.1 µm was measured on the coated and polished surfaces.
Shot peening + hard chromium electroplating
As above, a set of shot peened specimens was selected for hard chromium deposition. A
conventional electroplating process was carried out using a chromic acid solution with 250g/l
of CrO3, with a current density from 31 to 46 A/dm2. An average coating thickness of 220 µm
was obtained with a surface roughness Ra equal to 0.2 µm after polishing.
2.3 Procedure of damage quantification
Crack length quantification
Because fretting wear stressing alone can not propagate the crack until the flat specimen
ruptures, cracking is analysed by measuring and comparing the crack length below the surface
as a function of the loading conditions. The following assessment procedure has been applied
(Fig. 4a): The plane specimen on which the fretting test was performed is precisely cut
perpendicularly across the middle of the fretting scar. After careful polishing, optical cross
section observations are made to measure the position and the length of the deepest crack
(lmax). Note that crack orientation and multi-cracking activation are highly dependent on the
imposed partial slip condition [12].

7
L = 5 mm
regularly spaced surface profiles
Averaged worn surface : Sm
Wear volume: V = Sm . L
(a)
VPplane
52100 cylinderVC
total system wear volume:
VT = VP+ VC
(b)
slidingdirection
cutting
Frettingscar
lmax
polishing of
cross section
L = 5 mm
regularly spaced surface profiles
Averaged worn surface : Sm
Wear volume: V = Sm . L
(a)
VPplane
52100 cylinderVC
total system wear volume:
VT = VP+ VC
(b)
slidingdirection
cutting
Frettingscar
lmax
polishing of
cross section
Figure 4 : (a) Fretting crack assessment (partial slip test conditions); (b) Wear volume
estimation (gross slip test conditions).
Wear volume measurement
One advantage of the 2D cylinder / plane configuration is that the wear volume can be
estimated from a limited number of low cost 2D surface profiles (Fig. 4b). The following
procedure was applied: First, the specimens were ultrasonically cleaned to eliminate as much
debris as possible. Several regularly-spaced surface profiles, perpendicular to the fretting scar,
were then made. An average fretting wear surface was then computed which, multiplied by
the contact length (L), allowed the plane wear volume ( PV ) to be estimated. Note that
previous comparison with complete 3D surface profiles has confirmed a wear volume
dispersion which was lower than 7 %. The wear volume of the counter-body ( CV ) was
similarly defined by extracting the cylinder shape from the surface profiles. Finally, the total
wear volume of the fretting contact was estimated:
CPT VVV (4)
3. Development of experimental methodology
3.1 Definition of the contact conditions
Expertises in the field of Tribology and Fatigue have shown that the closer the test
configurations to the industrial application, the finer the palliative endurance predictions. This
condition of similitude is presently illustrated by analysing an axle-pressed fitted assembly.
8
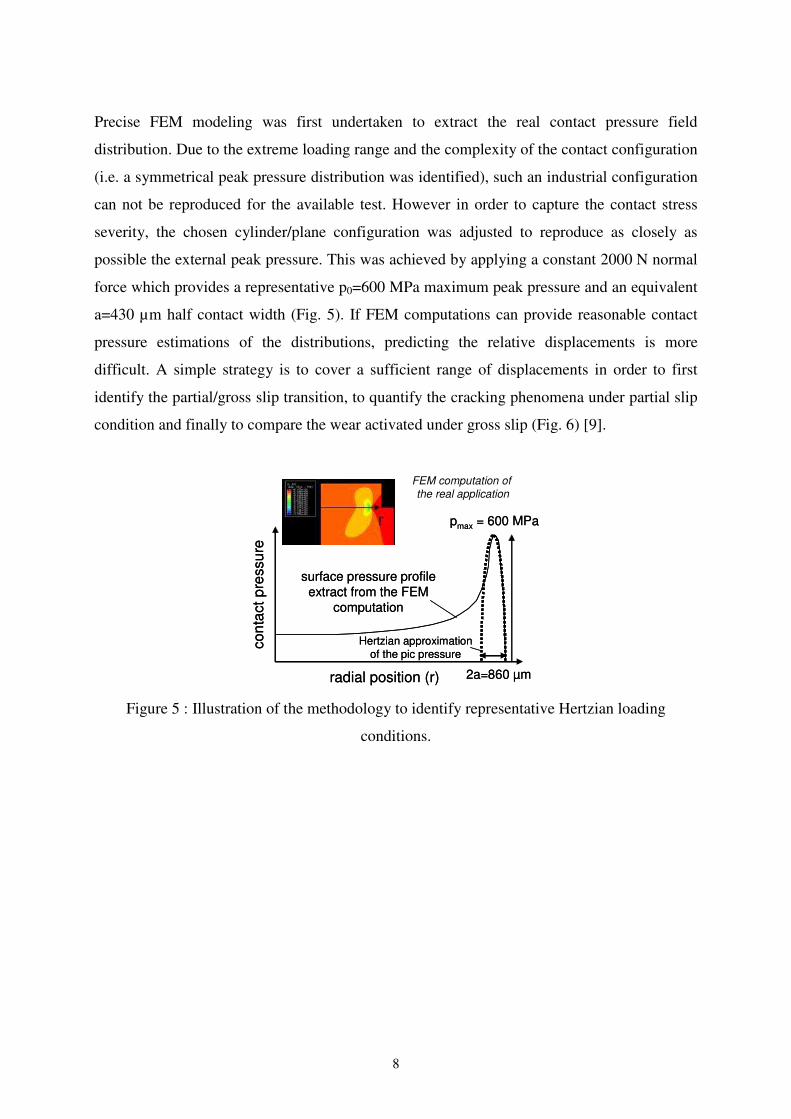
Precise FEM modeling was first undertaken to extract the real contact pressure field
distribution. Due to the extreme loading range and the complexity of the contact configuration
(i.e. a symmetrical peak pressure distribution was identified), such an industrial configuration
can not be reproduced for the available test. However in order to capture the contact stress
severity, the chosen cylinder/plane configuration was adjusted to reproduce as closely as
possible the external peak pressure. This was achieved by applying a constant 2000 N normal
force which provides a representative p0=600 MPa maximum peak pressure and an equivalent
a=430 µm half contact width (Fig. 5). If FEM computations can provide reasonable contact
pressure estimations of the distributions, predicting the relative displacements is more
difficult. A simple strategy is to cover a sufficient range of displacements in order to first
identify the partial/gross slip transition, to quantify the cracking phenomena under partial slip
condition and finally to compare the wear activated under gross slip (Fig. 6) [9].
FEM computation ofthe real application
radial position (r)
surface pressure profileextract from the FEM
computation
con
tactp
ressu
re
pmax = 600 MPa
2a=860 µm
Hertzian approximationof the pic pressure
FEM computation ofthe real application
radial position (r)
surface pressure profileextract from the FEM
computation
con
tactp
ressu
re
pmax = 600 MPa
2a=860 µm
Hertzian approximationof the pic pressure
Figure 5 : Illustration of the methodology to identify representative Hertzian loading
conditions.

9
displacement amplitude (+/- µm)
norm
alfo
rce
(N)
sliding
transition
(I)
cracking
under
partial slip (II)
wear under
gross slip
(III)
fixed representative pressureloading (P= 2000 N, 600 MPa)
PS/GS sliding
transition (I)
(Qt, t)
cracking analysis
under partial slip (II)
(250 103 cycles)
variable
sliding test
tangential force control:
Q* (± N): Qth – 0.9 Qt
(5 tests)
wear analysis
under gross slip (III)
(25 103 cycles)
displacement control:
* (± µm): 25,50,75,100(4 tests)
Figure 6 : Definition of the fretting test methodology (R=40 mm, L=5mm, f=5Hz).
3.2 Fretting sliding analysis and identification of pertinent friction parameters
To identify the displacement amplitude marking the transition from partial to gross slip
sliding conditions, an incremental displacement methodology has been adapted [11]. Very
slight displacement amplitude is imposed at the beginning and increased in regular steps.
Hence, through a single fretting test, a complete overview of the sliding response is provided.
Note that the consistency of this methodology is fully dependent on the incremental
displacement step ( ) and the chosen number of fretting cycles imposed to stabilize the
sliding contact ( N ) during the increment (Fig. 7a). Previous investigations have shown that
perfect coherence with classical constant sliding test conditions is achieved if the incremental
increase of the sliding amplitude remains smaller than =0.2 µm and the stabilized period
above N =1000 cycles. Figure 7b illustrates the reference 30NiCrMo8/52100 contact
response. The normalized tangential force ratio (Q/P) as well as the dissipated energy
criterion *).*Q.4/(EdA are plotted versus the applied displacement amplitude. The sliding
transition (ht) from partial to gross slip is related to an energy discontinuity confirming
Mindlin’s formalism. This discontinuity is associated to a maximum value of the tangential
force amplitude also related to the friction coefficient at the sliding transition (µ t) (i.e.
representative of the friction coefficient operating under partial slip conditions [8]).

10
displacement amplitude * (µm)
0
0.2
0.4
0.6
0.8
1
0 5 10 15 20
(energy ratio)
energy discontinuity
gross slippartial slip
t
sliding
transition
P
Qtt GS
P
*Q
P
*Q
(tangential
force ratio)
*Q..4
EA
g
d
fretting cyclesd
isp
lace
men
tam
plit
ud
e
µm2.0*
(a)
recorded values ofthe sliding condition
cycles1000N (stabilized period)
(increment of displacement
amplitude)
(b) displacement amplitude * (µm)
0
0.2
0.4
0.6
0.8
1
0 5 10 15 20
(energy ratio)
energy discontinuity
gross slippartial slip
t
sliding
transition
P
Qtt GS
P
*Q
P
*Q
(tangential
force ratio)
*Q..4
EA
g
d
0
0.2
0.4
0.6
0.8
1
0 5 10 15 20
(energy ratio)
energy discontinuity
gross slippartial slip
t
sliding
transition
P
Qtt GS
P
*Q
P
*Q
(tangential
force ratio)
*Q..4
EA
g
d
fretting cyclesd
isp
lace
men
tam
plit
ud
e
µm2.0*
(a)
recorded values ofthe sliding condition
cycles1000N (stabilized period)
(increment of displacement
amplitude)
(b)
Figure 7 : Illustration of the incremental sliding method: (a) definition of the procedure; (b)
application to the 30NiCrMo8/52100 contact: identification of the sliding transition ( t ), the
coefficient of friction at the sliding transition ( t ) and the friction coefficient under stabilized
gross slip conditions ( GS ).
Above the sliding transition, the full sliding conditions, by favouring wear, generates a
compliant interfacial third body and promotes a decrease of the friction coefficient. A
stabilized friction value, representative of the friction law under gross slip conditions is then
identified (µGS). The quantitative variables (t, µ t, µGS Qt) defining the tribological behaviour
of the studied tribosystems are compiled in Table 2 and illustrated in Figure 8. Smaller
frictions values are identified well under gross slip conditions. Moreover, smaller fluctuations
can be observed for the coated contacts. Displaying dissimilar material composition, they
limit the adhesion phenomena and provide more stable friction performances. As previously
outlined [12] no significant differences can be observed between the plain and peened
surfaces. Moreover, the decrease of the friction coefficient induced by the two studied

11
coatings is quite limited. A hard chromium coating seems to induce smaller friction
coefficients (0.6 – 0.7) but the difference is not significant and can not be compared with the
drastic modification induced by the application of low friction lubricant coatings [13, 14].
0.00
0.10
0.20
0.30
0.40
0.50
0.60
0.70
0.80
0.90
fric
tio
ncoeff
icie
nt.
plain steel shot
peening
shot
peening +
chromium
coating
shot
peening +
WC-Co
coating
0.00
0.10
0.20
0.30
0.40
0.50
0.60
0.70
0.80
0.90
fric
tio
ncoeff
icie
nt.
plain steel shot
peening
shot
peening +
chromium
coating
shot
peening +
WC-Co
coating
Figure 8 : Comparison of the studied mean friction coefficients defined from the incremental
sliding analysis: friction coefficient defined at the sliding transition (µ t), friction
coefficient defined under stabilized gross slip conditions (µGS).
Table 2: Synthesis of the various fretting parameters extracted from the given fretting
methodology to quantify respectively friction behaviour, cracking responses under stabilized
partial slip and wear kinetics under gross slip conditions.
Surface treatment たt たGS Qt ht
ratio ratio N たm
plain steel 0.81 0.76 1615 16.4
shot peening 0.83 0.77 1669 15.6
shot peening + chromium coating 0.68 0.66 1378 13.6
shot peening + WC-Co coating 0.73 0.72 1469 10.4
Surface treatment P Qth lMAX(たm) [Q≈0.9·Qt(N)]
N N
plain steel 2005 1090 103 1480
shot peening 1997 1100 47 1490
shot peening + chromium coating 2000 0(1)
223 1290

12
shot peening + WC-Co coating 2002 1490(2)
0 1290
(1) The value is associated to zero because the crack nucleation threshold of such a
coating can not be detected by this fretting test apparatus.
(2) No crack has been detected even when applying the highest cyclic loading conditions
(i.e. sliding transition) for the studied pressure field. Hence the crack nucleation
threshold is associated to this maximum possible loading state.
Surface treatment Archard wear coefficient K Energy wear coefficient g(たm³/J)
.TREATK 52100K TOTALK .TREAT 52100 TOTAL
たm³/Nm たm³/Nm たm³/Nm たm³/J たm³/J たm³/J
plain steel (reference) 8481 9650 18132 14534 16372 30906
shot peening 11689 4943 16632 18738 7936 26674
shot peening + chromium coating 1602 8949 10552 2581 14416 11834
shot peening + WC-Co coating 550 1407 1957 920 2356 3276
3.3 Analysis of the fretting cracking under partial slip conditions
Figure 9 illustrates the methodology to quantify the cracking response under partial slip. The
maximum crack length is achieved at the maximum tangential loading close to the sliding
transition. Above this sliding transition the reduction of the friction coefficient and a
competitive effect of wear tend to reduce the crack extension [2, 8]. To investigate a crack,
constant tangential force amplitudes are applied by properly adjusting the partial slip
displacement amplitude. Previous analysis has shown that the crack arrest condition is
reached after a test duration of around 250 000 cycles.

13
lMAX
ma
xcra
ck
leng
thl m
ax(µ
m)
tangential force amplitude Q (N)
gross slippartial slip
Qt
unstable sliding condition
Qt-10%
stable
partialslip
conditions
optimization of thesuccessive loading
conditions (Q*)
lmax(75%Qt)
lmax(90%Qt)
Qth
crack nucleation
threshold
lMAX
ma
xcra
ck
leng
thl m
ax(µ
m)
tangential force amplitude Q (N)
gross slippartial slip
Qt
unstable sliding condition
Qt-10%
stable
partialslip
conditions
optimization of thesuccessive loading
conditions (Q*)
lmax(75%Qt)
lmax(90%Qt)
Qth
crack nucleation
threshold
Figure 9 : Illustration of the simplified fretting cracking methodology: identification of the
basic cracking parameters (crack nucleation threshold: Qth; fretting crack propagation
behaviour: lMAX=lmax(90%Qt)).
To maintain stable partial slip conditions, the first fretting test is adjusted to tangential force
amplitude slightly below the transition value (0.9 Qt). A second test is conducted around 75%
of the transition amplitude. By comparing the corresponding maximum crack lengths, the
successive test conditions are adjusted to fully describe the crack length evolution versus the
tangential force amplitude and to bracket as precisely as possible the threshold crack
nucleation (Qth). Therefore in 4 to 6 fretting tests, two quantitative variables defining the
contact crack nucleation and crack extension can be extracted.
- The threshold crack nucleation tangential force amplitude (Qth)
- The maximum crack length is defined at 90% of the maximum tangential force amplitude
and is obviously related to the maximum crack length of the fretting contact for the studied
pressure condition: lMAX=lmax(90%Qt). The various tribo-systems have been investigated and the
corresponding parameters are compiled in Table 2.
Figure 10 compares crack length evolution versus the applied tangential force amplitude.
Considering the limited number of fretting tests, linear approximations have been applied to
describe cracking evolution. The reference plain 30NiCrMo8 steel presents a crack nucleation
threshold Qth close to 1100 N and tends to propagate up to a maximum crack length lMAX

14
close to 110 µm. Such treatment does not improve crack nucleation resistance but is a
significant benefit regarding propagation.
0
100
200
300
800 1000 1200 1400 1600 1800
tangential force amplitude Q* (N)
ma
xim
um
cra
ck
leng
thl m
ax
(ȝm
)
0
100
200
300
800 1000 1200 1400 1600 1800
tangential force amplitude Q* (N)
ma
xim
um
cra
ck
leng
thl m
ax
(ȝm
)
Figure 10 : Evolution of the crack length versus the applied tangential force amplitude ( :
reference plain 30NiCrMo8 steel; : shot peening; : shot peening + chromium coating; :
shot peening +WC-Co coating).
To interpret such behaviour it is essential to consider the very sharp stress gradient imposed
below the fretting contact. The cumulated cyclic plastic strain, which is at maximum on the
top surface, tends to rapidly relax the initial compressive stresses introduced by the treatment.
Hence the potential beneficial impact of shot peening on the surface crack nucleation is
rapidly erased. When the crack extends below the surface, crossing domains less affected by
contact loading, a higher compressive stress state are maintained which consequently
decreases the propagation rate. The chromium coating cracking results also confirm previous
fatigue investigations [15]. Due its very brittle behaviour, very slight contact loading will
immediately activate coating cracking. Hence, even for loading conditions lower than the
reference crack nucleation threshold, crack lengths equivalent to the coating thickness can be
detected. This confirms the very detrimental effect of such treatment on fretting cracking and
more particularly on the incipient nucleation stage. However the substrate crack propagation
rate appears smaller than for the plain material. Two hypotheses can be made to explain this
evolution:
First, the application of a thick coating protects the substrate from the maximum surface
stress. It consequently decreases the corresponding crack tip stress intensity factors and

15
promotes smaller crack kinetics. On the other hand, to compare the different cracking rates it
is essential to consider similar crack lengths and calculate representative stress intensity
factors. This complex problem involving complete and difficult crack modeling of the coated
contact can not be addressed in the present work.
The second hypothesis concerns the positive impact of the initial peening treatment. Protected
from relaxation phenomena by the coating thickness, the compressive stress fields are
maintained, which limits crack propagation through the substrate.
These two hypotheses are probably true. However, different cross section observations
showing vertical coating cracks which are inclined when they propagate through the substrate
tends to support the second hypothesis (Fig. 11).
hard chromium
coating
220 µm
vertical crack
(mode I)
30NiCrMo8
substrate45°crack
(mode II)
surface
contact border
compressivestressfield
hard chromium
coating
220 µm
vertical crack
(mode I)
30NiCrMo8
substrate45°crack
(mode II)
surface
contact border
compressivestressfield
Figure 11 : Typical evolution of the shot peening + chromium coating fretting cracking
behavior (p0=600 MPa, Q*=1580 N).
The chromium coating is very brittle which can explain the initial mode I controlled vertical
crack. Conversely, the 45° orientation observed through the substrate can only be explained
by very high compressive states maintained just below the coating interface. They impose
severe crack closure conditions and only permit a less efficient shear mode II propagation
regime. The conclusion is that the chromium coating is very detrimental at the fretting crack
nucleation stage, and this demonstrates the need to systematically apply prior shot peening
treatment to limit the substrate propagation rate at least.

16
The analysis of WC-Co shows that no crack nucleations were activated within the studied
loading conditions. This methodology such a treatment appears to be the best fretting cracking
palliative studied according to this methodology. However, more in depth analyses, including
fretting fatigue tests, are required to fully evaluate its crack propagation performance.
3.4 Quantification of wear under gross slip.
To compare the wear behaviour under gross slip, four displacement amplitudes from ±25 to ±
100 µm were applied (Fig. 12). Compared to the cracking phenomena the wear steady state is
reached after a few thousand cycles, so the test duration can be reduced to 25000 cycles.
displacement amplitude (µm)
we
ar
volu
me
V(µ
m3)
25 50 75 100
part
ialslip
gross slip
we
ar
vo
lum
eV
(µm
3)
PS factor (N.m)
K (µm3/N.m)
wea
rvolu
me
V(µ
m3)
friction energy Ed(J)
(µm3/J)
displacement amplitude (µm)
we
ar
volu
me
V(µ
m3)
25 50 75 100
part
ialslip
gross slip
we
ar
vo
lum
eV
(µm
3)
PS factor (N.m)
K (µm3/N.m)
we
ar
vo
lum
eV
(µm
3)
PS factor (N.m)
K (µm3/N.m)
wea
rvolu
me
V(µ
m3)
friction energy Ed(J)
(µm3/J)
Figure 12 : Illustration of the methodology applied to quantify wear under gross slip
conditions.
For the first approximation the Archard model, (i.e. wear volume versus the PS product) [16],
can be applied. A linear approximation is extrapolated to extract the slope of the wear
kinetics, also defined as Archard’s wear coefficient:
PS
VNm/µmK 3
(5)
Recent studies show that an energy approach displays higher stability [17]. This model
compares the wear volume to the friction energy dissipated through the interface ( dE ). The

17
impact of the friction coefficient is thus better taken into consideration. Linear evolutions are
classically observed, allowing the energy wear coefficient to be identified:
d
3
E
VNm/µm
(6)
To interpret the various wear mechanisms and more particularly the transfer phenomena, the
plane, the cylinder but also the total wear system will be analysed. It is interesting to highlight
the intrinsic differences between these two formulations. The energy description rationalizes
the wear damage extension as a function of the energy driven through the interface. It allows
more fundamental investigations by relating for instance the wear damage processes to
thermodynamical concepts [17]. The Archard analysis, which is a more practical approach,
associates the wear kinetics to the main contact loadings imposed on the contact: the normal
force and the sliding distance. Note that under stable friction behaviours, like those observed
in the present study, the two Archard and Energy formulations are proportional and justify the
fact that this analysis mainly focuses on the energy description.
0
1
2
3
0 5000 10000 15000
cumulated dissipated energy Ȉ Ed (J)
tota
lw
ea
rvolu
me
VT
(x1
08
µm
³)
TOTALEdth
0
1
2
3
0 5000 10000 15000
cumulated dissipated energy Ȉ Ed (J)
tota
lw
ea
rvolu
me
VT
(x1
08
µm
³)
TOTALEdth
Figure 13 : Evolution of the total wear volume increase versus the cumulated dissipated
fretting energy: ( : reference plain 30NiCrMo8 steel ; : shot peening; : shot peening +
chromium coating; : shot peening +WC-Co coating).
Figure 13 confirms the linear increase of the system wear volume versus the cumulated
dissipated energy. However this linear evolution does not cross the origin but presents a slight
shift along the energy axis associated to wear incubation threshold energy (Edth). Previous
research [17] has shown that this energy can be related to the cumulated plastic
transformation first required to modify the initial microstructure to a very hard phase, the so-

18
called Tribologically Transformed Structure TTS. This very brittle structure is successively
fractured and generates the incipient wear debris. All the studied tribosystems involve
metallic materials, which promote similar threshold energies. Therefore, the studied wear
palliatives can be analysed directly by comparing the energy and Archard’s wear coefficients
(Table 2). The comparison in terms of system or total wear resistance indicates that the shot
peening treatment has absolutely no impact on wear resistance. The chromium coating
performs rather well, with an energy wear coefficient half that of the reference. Again the best
performance is observed for the WC-Co coating with an energy wear coefficient at least 9
times lower than the reference system. Figure 14 and Table 2, by compiling the different wear
energy and Archard’s coefficients, allow the comparison of flat and cylinder counterbodies.
The reference 30NiCrMo8/52100 contact displays quasi homogeneous wear between the first
two first bodies. More interesting is the 30NiCrMo8 + shot peening/52100 response. The
plastic deformation induced by peening treatment was supposed to increase the surface
hardness of the flat surface and possibly increase the wear resistance. The reverse situation is
in fact observed. To interpret this behavior the brittleness of the plastic transform surface and
the introduction of numerous micro cracks generated during the peening treatment should be
mentioned. The observed higher relative wear kinetics of the peened surface can then be
explained. More complete investigations are however necessary to confirm and better
quantify this aspect.
0
10000
20000
30000
plain steel shot peening
ene
rgy
wea
rco
eff
icie
nt
a(µ
m3/J
)
shot peening
+ chromium
coating
shot peening
+ WC-Co
coating
0
10000
20000
30000
plain steel shot peening
ene
rgy
wea
rco
eff
icie
nt
a(µ
m3/J
)
shot peening
+ chromium
coating
shot peening
+ WC-Co
coating
Figure 14 : Wear kinetics of the studied tribosystems (Energy wear approach): : 52100
cylinder counterbody, : .TREAT studied surface treatment (plane), + : TOTAL whole
contact.

19
The chromium coating displays sharper differences. The wear kinetics of the chromium is
very low whereas the wear of the 52100 steel is quasi identical to the reference. It appears that
most of the wear is in fact generated on the steel counterbody which explains factor two,
previously outlined during the total wear analysis. Fundamental research, focusing on the
52100 steel transfers onto the chromium coating should be undertaken to explain such a
heterogeneous wear response. The WC-Co/52100 tribosystem displays homogeneous and low
wear kinetics. The intrinsic wear resistance of the WC-Co is not significantly different from
the chromium. The main gain is in fact related to a drastic drop of the 52100 wear kinetics.
The advantage of the WC-Co coating is that in addition to providing very low system wear
kinetics, it generates homogeneous and stable wear kinetics of the two counterparts. This
could be of fundamental interest for the maintenance procedures of industrial assemblies.
4. Synthesis and conclusion
Tables 2 compiles the different parameters extracted from this simplified fretting damage
methodology. It permits a quantitative comparison of the different aspects associated to
fretting damage such as friction behaviour under partial and gross slip conditions, cracking
phenomena during the nucleation and propagation stages, and finally wear under gross slip
situations. To provide a synthetic illustration of the palliative’s performance, an optimized
fretting damage chart is introduced. The respective performance of palliatives is normalized
versus the reference system in such a way that the calculated ratio is below one if the
treatment is beneficial or above 1 if it is detrimental. The following variables are considered:
Fretting tribological properties:
)ref(µ
µ
t
tt ,
)ref(µ
µ
GS
GSGS ,
)ref(Q
t
tt ,
)ref(t
tt
, (7)
Fretting cracking properties:
Nucleation:)ref(Q
th
thth , Propagation
)ref(l
ll
MAX
MAXMAX , (8)
Fretting wear properties:
)ref(TOTAL
TOTALTOTAL
,
)ref(52100
5210052100
,
)ref(.TREAT
.TREAT.TREAT
, (9)
)ref(K
KK
TOTAL
TOTALTOTAL ,
)ref(K
KK
52100
5210052100 ,
)ref(K
KK
.TREAT
.TREAT.TREAT , (10)

20
Different plots can be applied, the polar representation, first introduced by Carton and co-
authors [18] for fretting analysis, is user-friendly. It is here extended and normalised to
compare the studied surface treatment responses (Fig. 15).
GSȝ
tQ
tȝ
t
thQ
maxl
1
2
1 20
Friction
properties
Cracking
properties
Wear
properties
TOTAL
TOTALK
52100K
TREAT.K
(a)
TREAT.
52100
GSȝ
tQ
tȝ
t
thQ
maxl
1
2
1 20
Friction
properties
Cracking
properties
Wear
properties
TOTAL
TOTALK
52100K
TREAT.K
(a)
TREAT.
52100
GSȝ
tQ
tȝ
t
maxl
1
2
1 20
(1)
thQ
Friction
properties
Cracking
properties
Wear
properties
TOTAL
TOTALK
52100K
TREAT.K
(b)
TREAT.
52100
GSȝ
tQ
tȝ
t
maxl
1
2
1 20
(1)
thQ
Friction
properties
Cracking
properties
Wear
properties
TOTAL
TOTALK
52100K
TREAT.K
(b)
TREAT.
52100
GSȝ
tQ
tȝ
t
thQ
maxl
1
2
1 20
Friction
properties
Cracking
properties
Wear
properties
TOTAL
TOTALK
52100K
TREAT.K
(c)
TREAT.
52100
GSȝ
tQ
tȝ
t
thQ
maxl
1
2
1 20
Friction
properties
Cracking
properties
Wear
properties
TOTAL
TOTALK
52100K
TREAT.K
(c)
TREAT.
52100

21
Figure 15 : Development of a normalized polar representation to compare the different
fretting palliative responses (reference system: 30NiCrMo8/52100 contact) (a) shot peening
treatment, (b) shot peening + chromium coating, (c) shot peening + WC-Co coating.
A rapid overview shows that the peening treatment does not modify friction behaviour, does
not change the crack nucleation response but increases crack propagation resistance. Wear
resistance is little changed but there are differences between coated (plane) and uncoated
(cylinder) surfaces. The chromium coating slightly decreases the friction coefficients but it is
very detrimental regarding cracking response. It decreases the system wear kinetics but
displays a very heterogeneous response. Finally the WC-Co coating characterized by slightly
lower friction behaviour displays very good cracking performance and presents very low and
homogeneous wear kinetics. This quick methodology demonstrates the potential interest of
applying a thermal spray WC-Co coating against fretting damage. However, if these results
are important for industrial applications, many restrictions must be considered. The present
study was conducted under dry conditions [19]. In numerous cases, lubricants are applied, and
this aspect requires a specific investigation. This analysis is also restricted to constant sliding
conditions whereas most real applications undergo variable and complex loadings. Synergy
damage phenomena can operate during combined partial and gross slip sliding which again
requires specific analyses [17]. This research has been conducted for plain contact loading
without introducing external stressing. Indeed, these results must be carefully interpreted and
specific precautions must be taken before extending such a classification to any different
stressing situations.
To conclude, this fretting palliative selection method appears to be a convenient way to
compare various surface treatments, particularly when a wide range of surface treatments are
potentially interesting. However it cannot replace the complete investigation required for a
definitive validation for an industrial implementation. These two approaches are not
competitive but fully complementary: the fast methodology can be conducted to operate a first
selection among a wide range of possible palliatives whereas classical fretting and fretting
fatigue analyses must be performed to validate a choice through a restricted number of
solutions.
References
22
[1] Hoeppner D. "Mechanisms of fretting fatigue and their impact on test methods
development", ASTM STP 1159, 1992, p. 23-32.
[2] Waterhouse R.B., "Fretting Fatigue", R.B. Waterhouse (Ed.), Applied Science,
London, 1981.
[3] Vingsbo O., Soderberg. S. "On fretting Maps" Wear 126, 1988, p. 131-147.
[4] Vincent L. "Materials and Fretting", Fretting Fatigue, ESIS 18, 1994, p.323-337.
[5] McVeigh P.A., Farris T. N., “Finite element analysis of Fretting Stresses”, Journal of
Tribology, 119, 1997, p. 797-801.
[6] Araujo J. A., Nowell D., “The effect of rapidly varying contact stress fields on fretting
fatigue”, International Journal of Fatigue, 24, 2002, p. 763-775.
[7] Vallellano C., Dominguez J., Navarro A., “On the estimation of fatigue failure under
fretting conditions using notch methodologies”, Fatigue Fract. Eng., M26 (5), 2003, p.
469-478.
[8] Fouvry S., Kapsa Ph., Vincent L., “Quantification of fretting damage“, Wear 200, 1996,
p. 186-205.
[9] Fouvry S., Duo P., Perruchaut Ph. “A quantitative approach of Ti-6Al-4V fretting
damage: Friction, Wear and crack nucleation “,Wear 257, issue 9-10, 2004,p. 916-929.
[10] Mohrbacher H., Blanpain B., Celis J.P., Roos J.R., “ Oxidational wear of TiN coating
on tool steel and nitrided tool steel in unlubricated fretting”, Wear, 180, 1995, p. 43-52.
[11] Voisin J. M., Vannes A. B., Vincent L., Daviot J., Giraud B., "Analysis of a tube-grid
oscillatory contact: methodology for the selection of superficial treatments", Wear, 181-
183, 1995, p. 826-832.
[12] Fridrici V., Fouvry S., Kapsa Ph.,"Effect of shot peening on the fretting wear of Ti-Al-
4V", Wear 250, 2001, p. 642-649.
[13] Fridrici V., Fouvry S., Kapsa Ph., Perruchaut Ph. "Impact of contact size and geometry
on the lifetime of a solid lubricant ", Wear 255, 2003, p. 875-882.
[14] Zhou Z R, Vincent L. "Lubrification in Fretting a review", Wear 225-229, 1999, p. 962-
967.
[15] Nascimento M. P., Souza R. C., Pigatin W. L., Voorwald H. J. C. ,"Effects of surface
treatments on the fatigue strength of AISI 4340 aeronautical steel", International Journal
of Fatigue, Vol. 23, Issue 7, 2001, p.607-618.
[16] Archard J., "Contact and rubbing of flat surfaces", Appl. Phys., 24, 1953, p. 981-988.

23
[17] Fouvry S., Liskiewicz T., Kapsa Ph., Hannel S., Sauger S., " An energy description of
wear mechanisms and its applications to oscillating sliding contacts", Wear 255, 2003,
p. 287-298.
[18] Carton J. -F., Vannes A. B., Vincent L., "Basis of a coating choice methodology in
fretting", Wear, 185, 1995, p.47-57.
[19] McColl I R, Waterhouse R.B., Harris S.J., Tsujikawa M., "Lubricated fretting wear of
high-strength eutectoid steel rope wire", Wear 185, 1995, p. 203-212.