A Practical Implementation of an Agriculture Field ...eprints.lincoln.ac.uk/33702/1/ISES2018.pdf ·...
6
A Practical Implementation of an Agriculture Field Monitoring using Wireless Sensor Networks and IoT Enabled Edmond Nurellari † and Saket Srivastava † † School of Engineering, University of Lincoln, United Kingdom [email protected], [email protected] Abstract—In this work, we consider the problem of designing a state of the art energy - ef f icient wireless sensor network (WSN) practically deployed in a large field. The sensor nodes (SNs) are tasked to monitor a large region of interest (ROI) and report their test statistics to the fusion center (FC) over a wireless fading channel. To maximize the lifetime of the WSN and enable long range communication with minimal transmit power, the long range wide area network (LoRaWAN) communication protocol is adopted. Each of the SN is designed and enabled with several state of the art sensors in order to estimate different and diverse parameters of interest (e.g., soil moisture, soil temperature, and salinity at different soil depth; barometric pressure, ambient humidity, leaf wetness, and etc.). The core feature of the proposed solution is that the SNs learn and adopt over the sensing time. This is very important in extending the operational lifetime of the WSN. The proposed system is validated through the in- field experiments using few concept devices. Experimental results show that the proposed WSN features an effective large ROI monitoring with minimal number of SNs, a significantly reduced SN transmission power required and thus an extended WSN operational lifetime. Index Terms—Wireless sensor network, IoT for agriculture, LoRaWAN, fading, energy efficiency. I. I NTRODUCTION Defined as one of the most important emerging tech- nologies, wireless sensor networks (WSNs), together with Internet of Things (IoT) [1] will revolutionize the world. In fact, the core component of the IoT paradigm is the WSN. Monitoring a region of interest (ROI) is one of the most important applications of WSNs [2]–[4]. We have witnessed their deployment in the last 10 years in several sectors such as health-care, building infrastructure, environment monitoring, agriculture and military [5]–[11]. Very recently, WSN have been designed to add intelligence to the agriculture sector and hence enable smart IoT based farming [12]. In such ap- plication, monitoring different environmental parameters such as temperature, humidity, weather station data, leaf wetness, soil temperature/humidity and many other parameters are of particular interest. The monitoring of these parameters not only allows time and cost minimization but also enables agriculture productivity to be maximized. For example, since the mid- 1990s, increases in UK wheat yields on-farm have stalled, while oil-seed rape farm yields have fluctuated wildly since the This work was supported in part by the Biotechnology and Biological Sciences Research Council through the Industrial Strategy Challenge Fund. 1980s with yields now little different to those of thirty years ago. This is despite genetic yield gain continuing to deliver progress at more than 0.5% per year for winter wheat and 2% for oil-seed rape [13]. Management intensity is considered one avenue to pursue to overcome existing limitations. Generally, the local sensing process is orientated towards estimating some different parameters of interest which can then be optimally combined to arrive at an informed decision. This decision can then be relayed in a pre-specified manner or can be employed for on-field actuation (e.g., in the context of agriculture this can be irrigation switches control, crop harvesting decision time, actuation of self-autonomous vehicle operating in-field, and etc.). We note that the unattended, reliable and continued operation of a WSN over many years is often desirable. Furthermore, designing intelligent WSNs that efficiently utilize the on-board limited energy resources and cope with the impairments in a wireless communication channel is very important. While there are some theoretical studies and considerations of WSNs applied to farming [14]–[16] to name but just a few, there is still limited practical work done towards designing and enabling WSNs for agriculture purposes. Reference [17] deals with efficiency of feedback control method in greenhouse crop irrigation and advocates the water saving by this means. Authors in [18] consider developing SNs that can measure parameters which affect crop growth and quality and design a visualization platform to output the data. Some preliminary initiatives towards developing practical IoT enabled agriculture solution can be found in [19]. Now, the existing work either deal with a single SN de- ployment with limited number of equipped and low resolution sensors or provide some basic data collection algorithms without any insight into the problem. Furthermore, none of the previous work deal with energy - ef f iciency and the ROI coverage maximization constraint to a fixed given number of SNs. This work contributes in designing a private energy-efficient WSN to be practically deployed in an agriculture field to monitor a large ROI (see Fig. 2). Being geographically dis- persed to cover large areas, the SNs are constrained in both bandwidth and power. We design state of the art LoRaWAN enabled SNs that feature low power consumption and long range communication equipped with several state of the art
Transcript of A Practical Implementation of an Agriculture Field ...eprints.lincoln.ac.uk/33702/1/ISES2018.pdf ·...

A Practical Implementation of an Agriculture FieldMonitoring using Wireless Sensor Networks and
IoT EnabledEdmond Nurellari† and Saket Srivastava†
† School of Engineering, University of Lincoln, United [email protected], [email protected]
Abstract—In this work, we consider the problem of designinga state of the art energy − efficient wireless sensor network(WSN) practically deployed in a large field. The sensor nodes(SNs) are tasked to monitor a large region of interest (ROI) andreport their test statistics to the fusion center (FC) over a wirelessfading channel. To maximize the lifetime of the WSN and enablelong range communication with minimal transmit power, the longrange wide area network (LoRaWAN) communication protocolis adopted. Each of the SN is designed and enabled with severalstate of the art sensors in order to estimate different and diverseparameters of interest (e.g., soil moisture, soil temperature, andsalinity at different soil depth; barometric pressure, ambienthumidity, leaf wetness, and etc.). The core feature of the proposedsolution is that the SNs learn and adopt over the sensing time.This is very important in extending the operational lifetime ofthe WSN. The proposed system is validated through the in-field experiments using few concept devices. Experimental resultsshow that the proposed WSN features an effective large ROImonitoring with minimal number of SNs, a significantly reducedSN transmission power required and thus an extended WSNoperational lifetime.
Index Terms—Wireless sensor network, IoT for agriculture,LoRaWAN, fading, energy efficiency.
I. INTRODUCTION
Defined as one of the most important emerging tech-nologies, wireless sensor networks (WSNs), together withInternet of Things (IoT) [1] will revolutionize the world. Infact, the core component of the IoT paradigm is the WSN.Monitoring a region of interest (ROI) is one of the mostimportant applications of WSNs [2]–[4]. We have witnessedtheir deployment in the last 10 years in several sectors such ashealth-care, building infrastructure, environment monitoring,agriculture and military [5]–[11]. Very recently, WSN havebeen designed to add intelligence to the agriculture sectorand hence enable smart IoT based farming [12]. In such ap-plication, monitoring different environmental parameters suchas temperature, humidity, weather station data, leaf wetness,soil temperature/humidity and many other parameters are ofparticular interest. The monitoring of these parameters not onlyallows time and cost minimization but also enables agricultureproductivity to be maximized. For example, since the mid-1990s, increases in UK wheat yields on-farm have stalled,while oil-seed rape farm yields have fluctuated wildly since the
This work was supported in part by the Biotechnology and BiologicalSciences Research Council through the Industrial Strategy Challenge Fund.
1980s with yields now little different to those of thirty yearsago. This is despite genetic yield gain continuing to deliverprogress at more than 0.5% per year for winter wheat and 2%for oil-seed rape [13]. Management intensity is considered oneavenue to pursue to overcome existing limitations.
Generally, the local sensing process is orientated towardsestimating some different parameters of interest which canthen be optimally combined to arrive at an informed decision.This decision can then be relayed in a pre-specified manneror can be employed for on-field actuation (e.g., in the contextof agriculture this can be irrigation switches control, cropharvesting decision time, actuation of self-autonomous vehicleoperating in-field, and etc.). We note that the unattended,reliable and continued operation of a WSN over many yearsis often desirable. Furthermore, designing intelligent WSNsthat efficiently utilize the on-board limited energy resourcesand cope with the impairments in a wireless communicationchannel is very important.
While there are some theoretical studies and considerationsof WSNs applied to farming [14]–[16] to name but just a few,there is still limited practical work done towards designingand enabling WSNs for agriculture purposes. Reference [17]deals with efficiency of feedback control method in greenhousecrop irrigation and advocates the water saving by this means.Authors in [18] consider developing SNs that can measureparameters which affect crop growth and quality and designa visualization platform to output the data. Some preliminaryinitiatives towards developing practical IoT enabled agriculturesolution can be found in [19].
Now, the existing work either deal with a single SN de-ployment with limited number of equipped and low resolutionsensors or provide some basic data collection algorithmswithout any insight into the problem. Furthermore, none of theprevious work deal with energy − efficiency and the ROIcoverage maximization constraint to a fixed given number ofSNs.
This work contributes in designing a private energy-efficientWSN to be practically deployed in an agriculture field tomonitor a large ROI (see Fig. 2). Being geographically dis-persed to cover large areas, the SNs are constrained in bothbandwidth and power. We design state of the art LoRaWANenabled SNs that feature low power consumption and longrange communication equipped with several state of the art
agriculture sensors (see details later in Section III-B). We pro-pose a learn and adapt algorithm to extend the operationallifetime of the WSN and to deal with the imbalanced loadamong the SNs. The communication links (SNs-to-FC) aretested for communication channels experiencing shadowingand multipath fading. We show that the proposed systemeffectively deals with the energy imbalance in a WSN.
II. DESIGN CHALLENGES IN WSNS
While there are several design issues and challenges inWSNs, here we briefly discuss the three most importantissues that are related to bandwidth/energy-constrained WSNsdeployed across the agriculture sector.
1) Low Power Hardware: Clearly, the biggest designconstraint in WSNs still remains the power consumption.Even-though the SNs are being designed using low-power micro controllers, their power dissipation is stillorders of magnitude too high. For a survey on hardwaresystems for WSNs, we refer the reader to [25] and seereferences therein.
2) Resource Constraints: Because the SNs are batteryoperated devices with limited on-board energy, both thesystem lifetime and communication bandwidth (BW) arerestricted. While designing the algorithms to be used bythe SNs, both the signal processing and communicationshould be carefully designed to consume minimal energyin order to extend the lifetime and improve the overallreliability of the WSN. In this work, we consider severaldistributed estimation parameters with SNs intelligentlyreporting their local observations to the FC when it isnecessary to do so.
3) Network Security: Being geographically dispersedto cover large areas, the SNs are usually unattendedand this makes them vulnerable to different types ofattacks or hardware malfunctioning. The overall sensingand estimation performance strongly depends on thereliability of these SNs in the network. While fusingthe data received by the spatially deployed SNs allowsthe FC to make a reliable decision regarding the soilmoisture mapping, it is possible that one or more SNsmalfunctioning (compromised by an attacker) are sens-ing noisy (deliberately falsify their) local observationsto degrade the overall FC detection performance. Whilethere are many types of security threats, these are out ofthis work scope. For further details on network securitywe refer the reader to [22] and references therein.
For other design issues such as SN localization, medium ac-cess control (MAC) protocols, time synchronization, hardwaredesign and routing protocols in an energy constrained WSN,we refer the reader to [6].
III. SYSTEM MODEL
Consider the problem of monitoring a large agriculture ROIby a WSN consisting of a gateway, a FC, and M spatially dis-tributed SNs all equipped with a single antenna and report tothe FC via a dedicated point-to-point communication link. The
Gateway Cloud Server
Fusion Centre
Agriculture Field
Smart Phone Dashboard
Communication Unit
Micro Controller
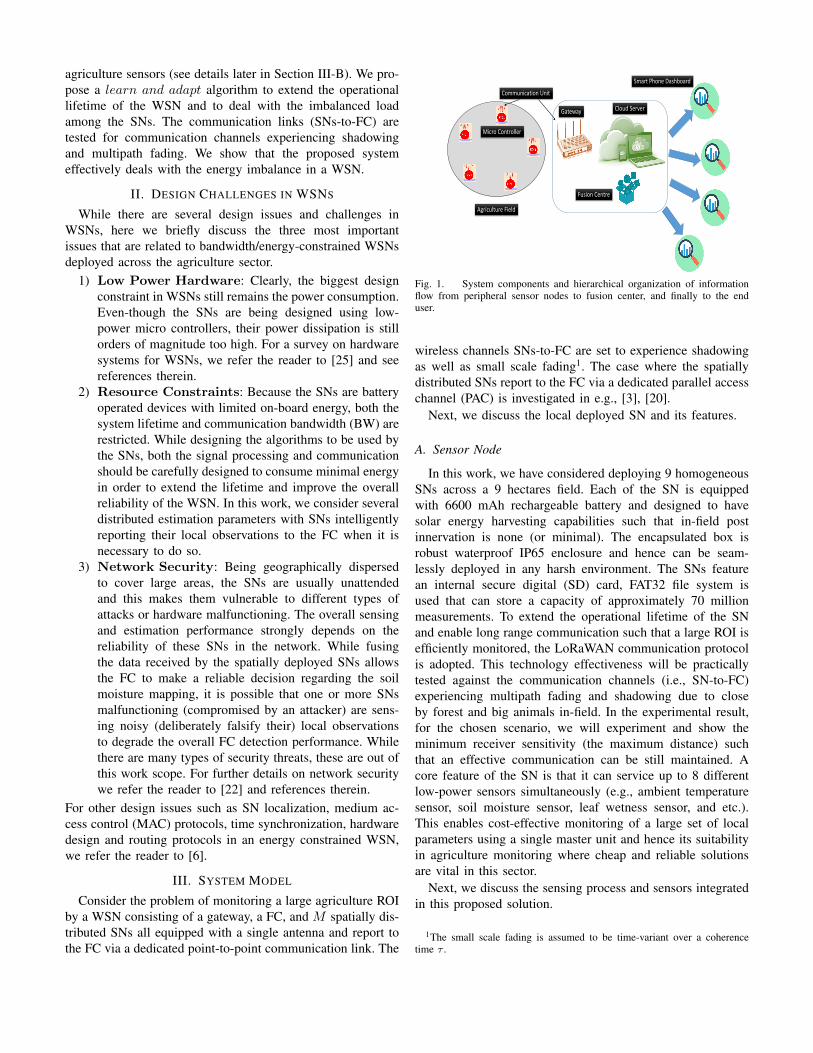
Fig. 1. System components and hierarchical organization of informationflow from peripheral sensor nodes to fusion center, and finally to the enduser.
wireless channels SNs-to-FC are set to experience shadowingas well as small scale fading1. The case where the spatiallydistributed SNs report to the FC via a dedicated parallel accesschannel (PAC) is investigated in e.g., [3], [20].
Next, we discuss the local deployed SN and its features.
A. Sensor Node
In this work, we have considered deploying 9 homogeneousSNs across a 9 hectares field. Each of the SN is equippedwith 6600 mAh rechargeable battery and designed to havesolar energy harvesting capabilities such that in-field postinnervation is none (or minimal). The encapsulated box isrobust waterproof IP65 enclosure and hence can be seam-lessly deployed in any harsh environment. The SNs featurean internal secure digital (SD) card, FAT32 file system isused that can store a capacity of approximately 70 millionmeasurements. To extend the operational lifetime of the SNand enable long range communication such that a large ROI isefficiently monitored, the LoRaWAN communication protocolis adopted. This technology effectiveness will be practicallytested against the communication channels (i.e., SN-to-FC)experiencing multipath fading and shadowing due to closeby forest and big animals in-field. In the experimental result,for the chosen scenario, we will experiment and show theminimum receiver sensitivity (the maximum distance) suchthat an effective communication can be still maintained. Acore feature of the SN is that it can service up to 8 differentlow-power sensors simultaneously (e.g., ambient temperaturesensor, soil moisture sensor, leaf wetness sensor, and etc.).This enables cost-effective monitoring of a large set of localparameters using a single master unit and hence its suitabilityin agriculture monitoring where cheap and reliable solutionsare vital in this sector.
Next, we discuss the sensing process and sensors integratedin this proposed solution.
1The small scale fading is assumed to be time-variant over a coherencetime τ .

1
FUSIONCENTER
SN1
SN2
SN3
SN4 SN5
SN6
SN7
SN8
SN9
SN10
T1
T2
T3
T4
T6
T5 T7
SN3
SN10
SN8
←→−→
active sensor node, working accordingly
non-active sensor node, manipulated by the attacker
non-active sensor node, controlled by the fusion center
target to SN link
SN3
SN10
SN8
−→
active sensor node, working accordingly
non-active sensor node, malfunctioning
non-active sensor node, controlled by the fusion center
SN to FC link
Fig. 2. Schematic communication architecture among peripheral active SNsand FC. The ith active SN generates a test statistic (Ti) and communicatesthis to the FC directly. There are two categories of non-active SNs: a) nonactive due to malfunctioning; b) non-active due to FC control.
B. Local Sensing and Sensors
For this initial feasibility study and proof of concept, wehave chosen a grass field that from our preliminary analysisis estimated to have some soil variations across the field. Wewill be deploying uniformly 9 state of the art (both from theagriculture and electronic perspective) soil moisture probesacross this 9 hectares field to try and establish an accuratesoil moisture map at different depths. This capacitive soilmoisture probe [21] (see Fig. 3), enabling near continuousmeasurements, is 30 cm in length and with sensors (soilmoisture, soil temperature, and salinity) placed at 10 cm apart.Based on the initial results obtained, we then would be ableto re-deploy the units in an informed manner in an attempt tofurther improve the soil moisture mapping.
Now, we would like to make it clear that while the abovesoil measurement probe shown in Fig. 3 yields superior resultsfrom agriculture perspective, it was not IoT enabled (i.e., didnot integrate with the state of the art low power SNs and micro-controllers (e.g., [24])). In this work, we have integrated thissoil moisture probe with the low power hardware [24] suchthat a state of the art IoT solution is obtained. Finally, someof the probe’s parameters can be found in [21] and are alsodepicted here in Table I.
Finally, to enable a minimal post-innervation in practicalWSNs and increase the operational life time of the WSN, theenergy resources have to be constantly monitored. Each localSN monitors its battery level, sense and stores the solar energyharvested such that an energy budget profile can be built. Usingboth the current battery level and this budget profile (builtovertime), each SN decides on how frequently to sample the
Cable to SN
Sensors at 10 cm
Sensors at 20 cm
Sensors at 30 cm
Fig. 3. Actual probe deployment inside the ground for in-field soilmonitoring.
TABLE IDRILL & DROP SOIL MEASUREMENT PROBE SPECIFICATIONS.
Types of Sensors (at each depth) Moisture Temperature SalinityResolution 1:10000 1:6000 0.3oC
Moisture Precision ± 0.03 % vol. x xTemperature Accuracy x ±2oC @ 25oC xOperating Temperature −20oC-60oC −20oC-60oC −20oC-60oC
field (i.e., local sampling rate). This adaptive rating enables aneffective way of resources management and an increase of theWSN operational lifetime. We note again that a continuousand reliable operational WSN is highly desirable in practice.
The SNs, depending on how are deployed and used, canvary from being extremely tiny devices [23] to relativelylarge embedded platforms [24]. In general, a SN consistsof limited signal processing capabilities, sensing device(s), atransceiver, limited memory capacity, and on-board power [6].These devices have wireless communications capability thatmakes them suitable in a variety of applications as describedabove. However, there are a numerous challenging problemsin designing WSNs that we describe next in Section II.
Next, we discuss the communication architecture and datacollection scheme.
C. Communication Architecture and Data Collection
There are different WSNs architectures depending on howthe SNs take decision and exchange information with otherSNs in the network or with the fusion center (FC) [22](see Fig. 2). We briefly mention here three of the differentarchitectures and focus in more details to the one that we willbe using in this work; 1) The Centralized Architecture(we consider this here), where there are mainly spatiallydistributed SNs that report to the FC. There is no inter-sensorscollaboration. 2) The Distributed Architecture, where there

is no FC and the SNs collaborate with each other in achievingthe common goal. 3) The Hybrid Architecture, where thereis a FC and there is also inter-sensor nodes collaboration.
For other design issues such as resource allocations, fusionrules, and network security in an energy constrained WSN, werefer the reader to [22].
In this work, as stated above, we adopt theCentralized Architecture where each of the local SNreport its data to the FC where further processing isperformed. Every SN in the network decides in transmittingthe local data to the FC by performing a two− step decisionalgorithm:(i) FIRST STEP: Every SN in the network comparesthe current data with the previous sensed data. For e.g.,consider the current temperature sensor data obtained at aninstantaneous discrete time n = t
∆s, at each SN (si(n)), is
further corrupted by AWGN (wi(n) ∼ N (0, σi2)):
yi (n) = si (n) + wi (n) (1)
Similarly, at discrete time n+1, the temperature at the ith SNwill be:
yi (n+ 1) = si (n+ 1) + wi (n+ 1) (2)
Now, the ith SN performs the decision at discrete time n basedon the following condition:
if |yi (n)− yi (n+ 1)| ≥ Λf , go to SECOND STEP
if |yi (n)− yi (n+ 1)| < Λf , do not transmit to FC
}(3)
where Λf is the decision threshold and it is a design parameterin general.(ii) SECOND STEP: All the SNs with positive transmissiondecision in (3) and step 1 perform now the local decision onthe battery level at discrete time n as follows:
if βj (n) ≥ τf , transmit to FC
if βj (n) < τf , go to deep sleep
}(4)
where j is the first step positive transmission SN index (i.e.,of those SNs that with decision rule in (3) are set to transmitto FC), βj(n) represents the jth SN’s battery level at discretetime n, and τf is the battery level decision threshold (also adesign parameter).
Clearly, from the above, a SN is set to transmit to the FC ifboth |yi (n)− yi (n+ 1)| ≥ Λf and βj (n) ≥ τf are satisfied.Otherwise, the SN is set to stay in sleeping mode for a definedperiod of time.
Now, the energy − efficient algorithm (with two− stepdecision rule (3) and (4) can be summarized in Algorithm1.
IV. EXPERIMENTAL RESULTS
We evaluate experimentally the performance of our pro-posed energy − efficient low power WSN solution. Weconsider a WSN deployed in a 300 m× 300 m ROI (i.e., thegrass field) with M = 9 SNs and square type SN geometry.The FC is located at a distance of 950 m non line of sight
Algorithm1: Energy Efficient Two-Step TransmissionDecision Algorithm
STEP 1: Choose Λf and evaluate (3), ∀i;
if |yi (n)− yi (n+ 1)| ≥ Λf , go to STEP 2if |yi (n)− yi (n+ 1)| < Λf , go to STEP 3
STEP 2: Choose τf and perform the decision (4), ∀j, to estimate thetransmission mode on/off;
if βj (n) ≥ τf , go to STEP 4if βj (n) < τf , go to STEP 3
STEP 3: Go to a deep sleep mode for 30 minutes and then go toSTEP 1;
STEP 4: Transmit all the data packets to the FC, then go to STEP 3;
(NLOS) from the center of the ROI and the distances betweenthe SNs are chosen large enough such that the machines canservice the field as normally without any intervention (e.g., thegrass cutter machine). This spatial configuration is shown inFig. 4. Because the grass field is frequently visited by biganimals and cattle, each of the SN unit is protected by aphysical fencing system with an area of 1 m2.
0 100 200 300x (m)
0
50
100
150
200
250
300
y (m
)
physical fencing
SN 1
SN 5
SN 3SN 2
SN 4 SN 6
SN 9SN 7 SN 8
Fig. 4. Spatial configuration of the WSN where the SNs are representedwith green and the red dashed circle represent the physical fencing system.
In Fig. 5, we show the data rate for SN 2 against the receivedsignal strength indication (RSSI) recorded for a period of timefrom 23rd of April until 2nd of July. As expected, SN datarate increases with improving RSSI. This adaptive data ratetransmission is very important in not only receiving the datapackets without error but also saving the SN’s energy. Forexample, for the cases where the communication channel isexperiencing deep fading and shadowing, the SN does nottransmit any data to the FC in order to conserve energy.
Now, to further validate our system set up and the SN’sin-field spatial deployment, in Fig. 6 we observe the RSSI

Data
Rate
Signa
l (RSS
I)
DATR-SF RSSI
04/23/2018
04/30/2018
05/07/2018
05/14/2018
05/21/2018
05/28/2018
06/04/2018
06/11/2018
06/18/2018
06/25/2018
07/02/20187.8 bit/s
8 bit/s
8.2 bit/s
8.4 bit/s
8.6 bit/s
8.8 bit/s
9 bit/s
9.2 bit/s
-150 dBm
-120 dBm
-90 dBm
-60 dBm
-30 dBm
0 dBm
30 dBm
60 dBm
Fig. 5. The data rate for SN 2 against the received signal strength indication (RSSI) plotted for a period of time from 23/04/2018 up to 02/07/2018.
Signal
(RSS
I)
SN 4 SN 3 SN 906/
20/201
8
06/22/
2018
06/24/
2018
06/26/
2018
06/28/
2018
06/30/
2018
07/02/
2018
-100 dBm
-120 dBm
-20 dBm
-40 dBm
-60 dBm
-80 dBm
0 dBm
14:42, 07/02/2018 RSSI -103 dBm
09:02, 06/23/2018 RSSI -104 dBm
15:29, 06/19/2018 RSSI -105 dBm
Fig. 6. Received signal strength indication (RSSI) profiles for 3 arbitrarilychosen SNs (specifically SN 3, SN 4, and SN 9).
So
il T
em
pe
ratu
re a
t S
N 3
SoilTemperature07"
10 inch
SoilTemperature03"12:
00 07/
10/201
8
07/11/
2018
12:00
07/11/
2018
07/12/
2018
12:00
07/12/
2018
07/13/
2018
12:00
07/13/
2018
07/14/
2018
12:00
07/14/
2018
18 °C
19 °C
20 °C
21 °C
22 °C
23 °C
24 °C
SoilTemperature10"
3 inch 7 inch
Fig. 7. Soil temperature profile at different depths for SN 3, plotted for aperiod of time from 10/07/2018 up to 15/07/2018.
for three arbitrary chosen SNs. Clearly, all the SNs areexperiencing deep fading and/or path loss at some particulartime instant. For example, SN 9 is experiencing the worstcommunication channel on 19th of June at 15:29, on 23rd ofJune at 09:02, and on 2nd of July at 14:42. However, mostof the time, the signal strength is high such that a reliablecommunication with the FC is maintained. Similar observationcan be seen for SN 3 and SN 4. Few spikes are observe atsome time instant indicating challenging channel conditions.This is as expected since the communication path between theSNs and the FC is affected by the high trees and big animalsin the field. However, note that the receiver sensitivity adaptedin this system is down to -136 dBm.
In Fig. 7, for an arbitrary chosen SN (i.e., SN 3), we plotthe soil temperature at three different depths. As expected,the biggest variation is observed among the soil temperaturemeasured at 3 inch and 10 inch.
Finally, to demonstrate the reliability of the proposed systemon the soil moisture monitoring and mapping, in Fig. 8, forsome arbitrary chosen SNs (i.e., SN 4, SN 7, SN 8, and SN9), we plot the soil moisture profiles at 3 inch depth sampledacross the field. Clearly, a variation between the selected SNs’measurements is observed. For example, the biggest variationis observed for the SNs far apart from each other (e.g., SN 4and SN 9). This is as expected since the soil content at theselocations will be much more different.
V. CONCLUSIONS
In this paper, we propose an energy − efficient WSNfor soil moisture monitoring and mapping. To further extendthe WSN operational lifetime, we have proposed a simple butefficient algorithm such that the SN transmit power can besignificantly reduced. Finally, we have also shown that theproposed WSN results in a reliable and operational systemeven in the worst fading communication channel case. Future

Soil
Tem
pera
ture
SN 4 SN 5 SN 8 SN 9
12:0
0 07
/10/
2018
07/1
1/20
18
12:0
0 07
/11/
2018
07/1
2/20
18
12:0
0 07
/12/
2018
07/1
3/20
18
12: 0
0 07
/13/
2018
07/1
4/20
18
12:0
0 07
/14/
2018
07/1
5/20
18
12:0
0 07
/15/
2018
07/1
6/20
18
12: 0
0 07
/16/
2018
07/1
7/20
1818 °C
20 °C
22 °C
24 °C
26 °C
28 °CSN 9
SN 4
Fig. 8. Soil temperature profile at 3 inch depths for SN 4, SN 5, SN 8, andSN 9 plotted for a period of time from 10/07/2018 up to 17/07/2018.
work will further investigate the analysis of the soil moisturemapping by considering the data at 3 different depths such assoil temperature, salinity, and soil moisture. Future work willalso investigate the minimum SNs number required such thatthe obtained results are within the acceptable accuracy range(a design parameter). This analysis is important from practicalperspective as by reducing the SNs number so does the overallcost of WSN.
REFERENCES
[1] G. Kortuem, F. Kawsar, V. Sundramoorthy, and D. Fitton, “Smartobjects as building blocks for the Internet of things,” in IEEEInternet Computing, vol. 14, no. 1, pp. 44-51, Feb. 2010.
[2] C-Y Chong, SP Kumar, “Sensor networks: evolution, opportu-nities, and challenges,” in Proc. IEEE., vol. 91, no.8, pp. 1247-1256, Aug. 2003.
[3] S. Aldalahmeh, M. Ghogho, D. McLernon, and E. Nurellari,“Optimal fusion rule for distributed detection in clustered wire-less sensor networks”, EURASIP Journal on Advances in SignalProcess., 2016:5, Jan. 2016.
[4] I. Akyildiz, W. Su, Y. Sankarasubramanian, E. Cayirci, “A sur-vey on sensor networks”, in IEEE Communications Magazine,vol. 40, no.8, pp. 102-114, Nov. 2002.
[5] E. Nurellari, D. McLernon, and M. Ghogho, “Distributed Two-Step Quantized Fusion Rules via Consensus Algorithm forDistributed Detection in Wireless Sensor Networks,” in IEEETransactions on Signal and Information Processing over Net-works, vol. 2, no. 3, pp. 321-335, Sept. 2016.
[6] B. Sadler, “Fundamentals of energy-constrained sensor networksystems,” in IEEE Aerospace and Electronic Systems Magazine,vol. 20, no. 8, pp. 17-35, Aug. 2005.
[7] E. Nurellari, D. McLernon, and M. Ghogho, “A Secure OptimumDistributed Detection Scheme in Under-Attack Wireless SensorNetworks,” in IEEE Transactions on Signal and InformationProcessing over Networks, vol. 4, no. 2 , pp. 325-337, Jun. 2018.
[8] I. F. Akyildiz, W. Su, Y. Sankarasubramaniam, and E. Cayirci,“A survey on sensor networks,” in IEEE Communication Mag-azine, pp. 102-114, Aug. 2002.
[9] E. Nurellari, D. McLernon, M. Ghogho, and S. Aldalahmeh,“Distributed Binary Event Detection Under Data-Falsificationand Energy-Bandwidth Limitation,” in IEEE Sensors Journal,vol. 16, no. 16 , pp. 6298-6309, Aug. 2016.
[10] G. J. Pottie and W. J. Kaiser, “Wireless integrated networksensors,” in Communications of the ACM, vol. 43, no. 5, pp.51-58, May 2000.
[11] E. Nurellari, S. Aldalahmeh, M. Ghogho, and D. McLernon,“Quantized Fusion Rules for Energy-Based Distributed Detec-tion in Wireless Sensor Networks,” in Proc. Sensor SignalProcessing for Defence (SSPD), Edinburgh, Scotland, pp. 1-5,8-9 Sept. 2014.
[12] A. Tzounis, N. Katsoulas, T. Bartzanas, C. Kittas, “Internet ofThings in agriculture, recent advances and future challenges”,in Biosystems Engineering, pp. 31-48, 164(2017).
[13] AHDB and HGCA, “Provisional AHDB/HGCA 2012 Ce-real Quality Survey Estimates”, pp. 1-4, 31 Aug. 2012[Online] Available at: https://cereals.ahdb.org.uk/media/5338/CQS First Provisional Estimates12.pdf , Accessed: Jun. 2018.
[14] O. Pandithurai, S. Aishwarya, B. Aparna and K. Kavitha, “Agro-tech: A digital model for monitoring soil and crops using internetof things (IOT),” in 3rd Int. Conf. on Science Tech. Engineering& Management (ICONSTEM), Chennai, pp. 342-346, 2017.
[15] A. Kumar, A. Surendra, H. Mohan, K. M. Valliappan andN. Kirthika, “Internet of things based smart irrigation usingregression algorithm,” in Int. Conf. on Intelligent Computing,Instrumentation and Control Technologies (ICICICT), Kannur,pp. 1652-1657, 2017.
[16] A. J. Rau, J. Sankar, A. R. Mohan, D. Das Krishna andJ. Mathew, “IoT based smart irrigation system and nutrientdetection with disease analysis,” in IEEE Region 10 Symposium(TENSYMP), Cochin, pp. 1-4, 2017.
[17] I. Mat, M. R. Mohd Kassim, A. N. Harun and I. Mat Yusoff,“IoT in Precision Agriculture applications using Wireless Mois-ture Sensor Network,” in IEEE Conference on Open Systems(ICOS), Langkawi, pp. 24-29, 2016.
[18] K. O. Flores, I. M. Butaslac, J. E. M. Gonzales, S. M. G.Dumlao and R. S. J. Reyes, “Precision agriculture monitoringsystem using wireless sensor network and Raspberry Pi localserver,” in IEEE Region 10 Conference (TENCON), Singapore,pp. 3018-3021, 2016.
[19] R. K. Jha, S. Kumar, K. Joshi and R. Pandey, “Field monitoringusing IoT in agriculture,” in Int. Conf. on Intelligent Computing,Instrumentation and Control Technologies (ICICICT), Kannur,pp. 1417-1420, 2017.
[20] J.T. Meng, J.R. Yuan, S.-Z. Feng, Y.J Wei, “An Energy EfficientClustering Scheme for Data Aggregation in Wireless SensorNetworks,” in Journal of Computer Science and Technology,vol. 28, no. 3, pp. 564-573, May 2013.
[21] The Sentek technologies, “Sentek Drill & Drop Encapsu-lated Soil Moisture, Salinity and Temperature Probe”, Avail-able at: http://www.sentek.com.au/downloads/downloads.asp?TypeID=7&FolderID=16 Accessed: 25 Jun. 2018.
[22] E. Nurellari, “Distributed Detection and Estimation in WirelessSensor Networks: Resource Allocation, Fusion Rules, and Net-work Security”, pp. 1-206, University of Leeds, Feb. 2017.
[23] B. Warneke, M. Last, B. Liebowitz, and K. S. J. Pister, “Smartdust: communicating with a cubic millimeter computer,” Com-puter, vol. 34, no. 1, pp. 44-51, Jan. 2001.
[24] The Libelium company, “Wireless Sensor Networkswith Waspmote and Meshlium”, Available at: http://www.libelium.com/v11-files/documentation/mesh extreme/wsn-waspmote and meshlium eng.pdf Accessed: Feb. 2014.
[25] M. Hempstead, M. J. Lyons, D. Brooks, and G-Y Wei, “Surveyof Hardware Systems for Wireless Sensor Networks,” Journalof Low Power Electronics, vol. 4, pp. 1-10, 2008.
[26] S. Barbarossa, S. Sardellitti, and P. Di Lorenzo, “DistributedDetection and Estimation in Wireless Sensor Networks,” InRama Chellappa and Sergios Theodoridis eds., Academic PressLibrary in Signal Processing, vol. 2, Communications and RadarSignal Processing, pp. 329-408, 2014.