A practical guideline for performing a comprehensive ...
35
S Robinson et al. Minimum dataset for transthoracic echo G59–G93 7:4 GUIDELINES AND RECOMMENDATIONS A practical guideline for performing a comprehensive transthoracic echocardiogram in adults: the British Society of Echocardiography minimum dataset Shaun Robinson MSc 1 , Bushra Rana MBBS 2 , David Oxborough PhD 3 , Rick Steeds MBBS 4 , Mark Monaghan PhD 5 , Martin Stout PhD 6 , Keith Pearce 6 , Allan Harkness MSc 7 , Liam Ring MBBS 8 , Maria Paton MSc 9 , Waheed Akhtar MSc 10 , Radwa Bedair MD 11 , Sanjeev Bhattacharyya MD 12 , Katherine Collins MSc 13 , Cheryl Oxley BSc 14 , Julie Sandoval MA 15 , Rebecca Schofield MBChB 1 , Anjana Siva PhD 16 , Karen Parker 17 , James Willis PhD 18 and Daniel X Augustine MD 18 1 North West Anglia NHS Foundation Trust, Peterborough, Cambridgeshire, UK 2 Imperial College Healthcare NHS Trust, London, UK 3 Liverpool John Moores University, Research Institute for Sports and Exercise Science, Liverpool, Merseyside, UK 4 University Hospitals Birmingham NHS Trust and Institute of Cardiovascular Sciences, University of Birmingham, Birmingham, West Midlands, UK 5 Kings College NHS Foundation Trust, London, UK 6 University Hospital South Manchester NHS Foundation Trust, Manchester, UK 7 East Suffolk and North Essex NHS Foundation Trust, Essex, UK 8 West Suffolk Hospital NHS Foundation Trust, Bury St Edmunds, Suffolk, UK 9 University of Leeds, Leeds, UK 10 Lincolnshire Heart Centre, United Lincoln Hospitals NHS Trust, Lincoln, Lincolnshire, UK 11 University Hospitals Bristol and Weston NHS Foundation Trust, Bristol, UK 12 St Bartholomew’s Hospital, London, UK 13 InHealth Group, High Wycombe, Buckinghamshire, UK 14 University Hospitals of the North Midlands, Stoke-on-Trent, Staffordshire, UK 15 Leeds Teaching Hospitals, Leeds, UK 16 Queen Alexandra Hospital, Portsmouth, UK 17 East and North Hertfordshire NHS Trust, Stevenage, Hertfordshire, UK 18 Royal United Hospitals Bath NHS Foundation Trust, Bath, UK Correspondence should be addressed to S Robinson: [email protected] Abstract Since cardiac ultrasound was introduced into medical practice around the middle twentieth century, transthoracic echocardiography has developed to become a highly sophisticated and widely performed cardiac imaging modality in the diagnosis of heart disease. This evolution from an emerging technique with limited application, into a complex modality capable of detailed cardiac assessment has been driven by technological innovations that have both refined ‘standard’ 2D and Doppler imaging and led to the development of new diagnostic techniques. Accordingly, the adult transthoracic echocardiogram has evolved to become a comprehensive assessment of complex cardiac anatomy, function and haemodynamics. This guideline protocol from the British Society of Echocardiography aims to outline the minimum dataset required to confirm normal cardiac structure and function when performing a comprehensive standard adult echocardiogram and is structured according to the recommended sequence of acquisition. It is recommended that this structured approach to image acquisition and measurement protocol forms the basis of every standard adult transthoracic echocardiogram. However, when pathology Key Words f transthoracic echocardiography f echocardiography f minimum dataset https://erp.bioscientifica.com © 2021 The British Society of Echocardiography This work is licensed under a Creative Commons Attribution-NonCommercial-NoDerivatives 4.0 International License. Published by Bioscientifica Ltd https://doi.org/10.1530/ERP-20-0026 Downloaded from Bioscientifica.com at 01/02/2022 06:54:32AM via free access
Transcript of A practical guideline for performing a comprehensive ...

S Robinson et al. Minimum dataset for transthoracic echo
G59–G937:4
GUIDELINES AND RECOMMENDATIONS
A practical guideline for performing a comprehensive transthoracic echocardiogram in adults: the British Society of Echocardiography minimum dataset
Shaun Robinson MSc1, Bushra Rana MBBS2, David Oxborough PhD3, Rick Steeds MBBS4, Mark Monaghan PhD5, Martin Stout PhD6, Keith Pearce6, Allan Harkness MSc7, Liam Ring MBBS8, Maria Paton MSc9, Waheed Akhtar MSc10, Radwa Bedair MD11, Sanjeev Bhattacharyya MD12, Katherine Collins MSc13, Cheryl Oxley BSc14, Julie Sandoval MA15, Rebecca Schofield MBChB1, Anjana Siva PhD16, Karen Parker17, James Willis PhD18 and Daniel X Augustine MD18
1North West Anglia NHS Foundation Trust, Peterborough, Cambridgeshire, UK2Imperial College Healthcare NHS Trust, London, UK3Liverpool John Moores University, Research Institute for Sports and Exercise Science, Liverpool, Merseyside, UK4University Hospitals Birmingham NHS Trust and Institute of Cardiovascular Sciences, University of Birmingham, Birmingham, West Midlands, UK5Kings College NHS Foundation Trust, London, UK6University Hospital South Manchester NHS Foundation Trust, Manchester, UK7East Suffolk and North Essex NHS Foundation Trust, Essex, UK8West Suffolk Hospital NHS Foundation Trust, Bury St Edmunds, Suffolk, UK9University of Leeds, Leeds, UK10Lincolnshire Heart Centre, United Lincoln Hospitals NHS Trust, Lincoln, Lincolnshire, UK11University Hospitals Bristol and Weston NHS Foundation Trust, Bristol, UK12St Bartholomew’s Hospital, London, UK13InHealth Group, High Wycombe, Buckinghamshire, UK14University Hospitals of the North Midlands, Stoke-on-Trent, Staffordshire, UK15Leeds Teaching Hospitals, Leeds, UK16Queen Alexandra Hospital, Portsmouth, UK17East and North Hertfordshire NHS Trust, Stevenage, Hertfordshire, UK18Royal United Hospitals Bath NHS Foundation Trust, Bath, UK
Correspondence should be addressed to S Robinson: [email protected]
Abstract
Since cardiac ultrasound was introduced into medical practice around the middle twentieth century, transthoracic echocardiography has developed to become a highly sophisticated and widely performed cardiac imaging modality in the diagnosis of heart disease. This evolution from an emerging technique with limited application, into a complex modality capable of detailed cardiac assessment has been driven by technological innovations that have both refined ‘standard’ 2D and Doppler imaging and led to the development of new diagnostic techniques. Accordingly, the adult transthoracic echocardiogram has evolved to become a comprehensive assessment of complex cardiac anatomy, function and haemodynamics. This guideline protocol from the British Society of Echocardiography aims to outline the minimum dataset required to confirm normal cardiac structure and function when performing a comprehensive standard adult echocardiogram and is structured according to the recommended sequence of acquisition. It is recommended that this structured approach to image acquisition and measurement protocol forms the basis of every standard adult transthoracic echocardiogram. However, when pathology
-20-0026ID: 20-0026
Key Words
f transthoracic echocardiography
f echocardiography
f minimum dataset
7 4
https://erp.bioscientifica.com� ©�2021�The�British�Society�of�Echocardiography This work is licensed under a Creative Commons Attribution-NonCommercial-NoDerivatives 4.0 International License.
Published by Bioscientifica Ltdhttps://doi.org/10.1530/ERP-20-0026
Downloaded from Bioscientifica.com at 01/02/2022 06:54:32AMvia free access

S Robinson et al. Minimum dataset for transthoracic echo
G607:4
is detected and further analysis becomes necessary, views and measurements in addition to the minimum dataset are required and should be taken with reference to the appropriate British Society of Echocardiography imaging protocol. It is anticipated that the recommendations made within this guideline will help standardise the local, regional and national practice of echocardiography, in addition to minimising the inter and intra-observer variation associated with echocardiographic measurement and interpretation.
Introduction
This guideline outlines a structured approach to image acquisition and standardised measurement protocol for performing a standard transthoracic echocardiogram (TTE); it replaces all previous minimum datasets published by the British Society of Echocardiography (BSE). This current guideline differs from the 2013 dataset in: describing recommendations for the optimisation of TTE equipment settings; standardising measurement protocols with other BSE pathology-based guidelines; providing new evidence-based recommendations for measurements made in atrial fibrillation and by making recommendations for the assessment of cardiac mechanics in cardio-oncology patients to detect early myocardial disease.
As with previous minimum dataset guidelines, minimum requirements are depicted in bold text and identify the views and measurements that are necessary in all subjects to confirm normal heart anatomy and function. Instructions for recommended views are presented in standard font and together with the minimum requirements form the basis of a comprehensive examination. It is advised that wherever possible, a comprehensive study comprising all the minimum requirements and recommended views and measurements should be performed, provided that measurement accuracy and diagnostic quality are maintained.
Whilst this approach is recommended in all patients undergoing standard adult TTE, it is recognised that in some clinical scenarios the acquisition of the entire minimum dataset and recommended views and measures may not be practical or possible. It is understood that in this situation focused cardiac ultrasound or BSE Level 1 echocardiography may be performed to answer a specific clinical question, for example to rule out cardiac tamponade.
It is anticipated that this guideline will form the basis of every standard adult TTE and that the data/information acquired will be sufficient to diagnose normal cardiac anatomy, function and haemodynamics (1, 2).
When pathology is present, additional views are necessary and should be acquired according to the appropriate BSE guideline.
The layout of this document continues in the ‘step-by-step’ and ‘how to’ structure of previous BSE guidelines and is supported by example images. The textual layout is unchanged from previous BSE guidelines and follows the format of: view (modality); measurement; explanatory note and image.
The intended benefits of this document are to:
• Support cardiology teams and echocardiographers to develop local imaging protocols and quality control programmes for adult transthoracic echocardiography by providing a structure against which studies in any department can be audited.
• Promote standardisation and quality by defining a recommended ‘minimum dataset’ of descriptive terms and measurements, in conjunction with a systematic approach to performing and reporting a comprehensive standard adult TTE.
• Minimise inter and intra-observer variability and facilitate the accurate comparison of serial echocardiograms performed in patients at the same or different sites.
The recommendations set out within this guideline reflect the broad international agreement regarding the minimum requirements for a standard adult TTE, and whilst the BSE acknowledge there is limited evidence-base, the recommendations made are consistent with other international societies and represent an expert consensus view on the components of a complete TTE study (3, 4).
With the advent of Focused Echocardiography in Emergency Life support (FEEL) (5), Focused Intensive Care Echocardiography (FICE) (6) and Level 1 BSE accreditation (7), it is recognised that focused cardiac ultrasound may be appropriate in certain clinical scenarios. This may include the investigation of emergency cardiac compromise,
This work is licensed under a Creative Commons Attribution-NonCommercial-NoDerivatives 4.0 International License.
https://doi.org/10.1530/ERP-20-0026https://erp.bioscientifica.com © 2021 The British Society of Echocardiography
Published by Bioscientifica Ltd
Downloaded from Bioscientifica.com at 01/02/2022 06:54:32AMvia free access

S Robinson et al. Minimum dataset for transthoracic echo
G617:4
for example, assessment for pericardial effusion and so on, or for the targeted surveillance of left ventricular function. When such targeted studies are undertaken, it is expected that every patient will undergo a full standard TTE after the emergency assessment has been completed or before monitoring commences. Targeted/Level 1 studies should be clearly identified as being such, including a description of the scan environment (bedside, supine, peri-arrest, etc.) and are not covered by this document.
When limited acoustic windows prevent acquisition of the entire minimum dataset or when accurate measurement cannot be performed (e.g. off-axis measurements, poor image quality), the limitations of the study should be clearly documented in the report summary. All echo reports should therefore include a description of image quality (poor, adequate, good).
Wherever possible, transthoracic echocardiography should be performed in an environment that enables acquisition of the best available image quality. These facilities should ensure patient privacy at all times and should allow the patient to be positioned comfortably in the left lateral decubitus position with their left arm raised or left hand under their head. We recommend that, where available, a bed with a drop-down segment is utilised to provide better access to the left ventricular apex for apical four, two, and three chamber imaging. To avoid musculoskeletal injury to the echocardiographer, the TTE should be performed on a designated imaging couch with appropriate seating and space on both sides of the patient to enable either right- or left-handed scanning (8). It is expected that the in-room clinical facilities, room dimensions and ultrasound equipment meet the standards outlined by the BSE Departmental Accreditation process, details can be found within the BSE Departmental Accreditation document (9). However, when it is necessary that standard TTE is performed at the patient’s bedside, the recommendations of the minimum dataset continue to apply. To ensure that adequate images and measurements are acquired while the patient is within the department, it is recommended that measurements are made during the study.
Identifying information
Although it is not necessary that the images acquired should be clearly labelled with ALL patient identifiers, all acquired images should be stored within a study-file that is identified by:
• Patient name • Hospital number • Date of birth • Echocardiographer ID (initials/name) • Patient details should be confirmed as soon as the
patient enters the echo lab.
Body surface area (height and weight)
The assessment of chamber and vessels size and valve dimensions are important components of every standard TTE and are essential considerations when differentiating normal from abnormal size and function (10). However, age, gender and body dimensions (body surface area (BSA) and/or height) are significant factors that influence absolute measures of chamber/vessel size and valve area and should be considered in every standard TTE; indexed values should be cross-referenced with the appropriate BSE guideline. In obese patients, caution is advised when interpreting indexed values. The metabolic demand of fatty tissue is considerably lower than muscle, and therefore, obesity is less likely to drive changes in chamber size or wall thickness. In essence, indexing for BSA when individuals are very overweight may result in an underestimation of the degree of cardiac remodelling (11).
Blood pressure and heart rate recording
Parameters of cardiac function are heavily influenced by haemodynamic loading conditions and are therefore susceptible to variations in heart rate and blood pressure (12). It is therefore recommended that for the correct interpretation of echo findings and for serial studies to be considered in the appropriate context, the findings of a standard TTE are considered in the setting of blood pressure (BP), heart rhythm (sinus rhythm, atrial flutter/fibrillation, electric pacing) and heart rate (HR) at the time of the examination. When the HR is within a normal range (50–100 bpm) each 2D acquisition should include a minimum of two cardiac cycles, this should increase when the patient is tachycardic. For practical purposes, one cardiac cycle is acceptable when the patient is bradycardic and the HR falls below 40 bpm BP and HR should be taken in the supine position and clearly documented within the echo report; a comment should be made within the report when rhythm, HR and BP are likely to influence parameters of function. Where possible, timing BP measurement to coincide with left heart Doppler recordings will improve the accuracy of the Doppler interpretation.
This work is licensed under a Creative Commons Attribution-NonCommercial-NoDerivatives 4.0 International License.
https://doi.org/10.1530/ERP-20-0026https://erp.bioscientifica.com © 2021 The British Society of Echocardiography
Published by Bioscientifica Ltd
Downloaded from Bioscientifica.com at 01/02/2022 06:54:32AMvia free access

S Robinson et al. Minimum dataset for transthoracic echo
G627:4
Electrocardiogram
The ultrasound machine electrocardiogram (ECG) should be connected to the patient for the duration of the study. Good quality tracings are essential for the acquisition of appropriately timed loops and for the identification of specific time-points within the cardiac cycle.
Image optimisation
Although most modern echo machines include a function for automatic two-dimensional(2D) image optimisation, the automatically ‘optimised’ image often requires additional fine adjustment. It is therefore essential that echocardiographers possess a complete understanding of how to manually optimise 2D images, colour flow Doppler and spectral Doppler displays.
Frequency selection
One of the fundamental principles of medical ultrasound imaging is that higher scanning frequencies provide better image resolution but with limited depth penetration, whereas lower scanning frequencies are able to penetrate deeper into the body but provide lower image resolution (13). Fundamentally, image resolution at higher frequencies is superior in both axial and lateral planes. Because wavelength decreases as frequency increases, the spatial pulse length is shorter at higher frequency and provides greater image resolution in the axial plane (13). Although overall beam width decreases as frequency increases, thus providing improved lateral plane resolution, manual methods of beam focusing have a greater impact on beam width than frequency alone and are described in more detail below. Most modern ultrasound systems allow the operator to adjust transmit frequency in order to optimise image quality. It is, therefore, recommended that to achieve optimal image resolution, a high scan frequency is selected initially and reduced when further signal penetration required.
Focus
Manually adjusted transmit focus
Although some ultrasound systems utilise automatic focus processes, manual adjustment of the focal point
improves lateral resolution of the image by altering the position of the narrowest section of the ultrasound beam (14). This is achieved by introducing timing delays into the excitation of separate elements (determined by the position of the focal point) (13). The resulting ultrasound wave-front is curved and converges in the region defined by the manually positioned focal point. The focus should be continually adjusted during the scan to be positioned over the region of interest within the image (13).
Elevational compounding
Modern matrix array probes enable improved 2D image quality through elevation spatial compounding of returning signals. The process of spatial compounding combines partially decorrelated images in which the speckle pattern has been altered by imaging a structure from different angles (15). Image resolution is improved as the structures that are present in all decorrelated images are enhanced while the artefactual signals that aren’t present in all views are filtered out, thus improving the signal-noise ratio.
Harmonic imaging
Since being discovered by accident during the development of ultrasound contrast micro-bubbles (16), the use of harmonic imaging has become routine during echocardiography. Harmonic frequencies are created by the interaction of sound with the tissue that it travels through, such that multiples of the transmitted (fundamental) frequency are generated and return to the probe; twice the fundamental frequency (second harmonic) being the most commonly utilised harmonic frequency. The major benefit of harmonic imaging is that lower frequencies can be transmitted to aid signal penetration while the returning higher frequency second harmonic provides superior image resolution with improved signal-to-noise ratio. Because harmonic frequency signal strength increases as the sound wave propagates through the body, very few harmonic signals are generated in the near field. Harmonic imaging therefore avoids the problematic artefacts generated by the anterior chest wall associated with fundamental frequency imaging (17). However, because harmonic imaging enhances the signal of specular reflectors, caution should be taken when interpreting the thickness of valve cusps/leaflets as harmonic imaging can lead to false appearance of increased thickness (17).
This work is licensed under a Creative Commons Attribution-NonCommercial-NoDerivatives 4.0 International License.
https://doi.org/10.1530/ERP-20-0026https://erp.bioscientifica.com © 2021 The British Society of Echocardiography
Published by Bioscientifica Ltd
Downloaded from Bioscientifica.com at 01/02/2022 06:54:32AMvia free access

S Robinson et al. Minimum dataset for transthoracic echo
G637:4
Gain
Overall gain
The gain function of an ultrasound machine is a component of the pre-processing system that acts on all returning signals (13). When gain is increased, the amplitude of all returning signals (both useful and artefact) is increased prior to being assigned a shade of grey, thus resulting in a brighter overall image. When gain is lowered, the amplitude of all signals is reduced and results in a darker overall image appearance. Gain settings are optimised to ensure that the blood pool remains dark and that the endocardial border is well defined.
Most comprehensive ultrasound systems now provide the facility for automatic image optimisation by either on-going automatic gain adjustment or through echocardiographer activation (simple button press). Although these processes improve image quality and their use is advocated by the BSE, a comprehensive understanding of ultrasound physics and image optimisation remains essential.
Time-gain compensation
As the ultrasound signal travels deeper into the body, the amplitude of the returning signal is progressively attenuated due to its constant interaction with blood and tissue. Therefore, signals that return from deeper within the body, and are consequently subject to greater attenuation, take longer to return to the probe and are of lower amplitude than signals that are reflected from superficial structures that are closer to the probe. Time gain compensation (TGC) overcomes this depth-related attenuation by allowing the operator to apply greater gain to the signals that travel further and therefore arrive later. Optimisation by TGC enhances the visualisation of structures in the far-field while maintaining appropriate levels of gain at shallower depths (13).
Colour flow Doppler
Colour flow Doppler (CFD) is optimised to accurately demonstrate blood flow within a region of interest (ROI). As the predominant function of CFD is the assessment of valvular regurgitation, the Nyquist limit should initially be set to between 50 and 60 cm/s. Doing this standardises the CFD appearances across all echocardiograms and avoids the inappropriate appearance of low-velocity
blood flow (high Nyquist limit) or turbulent blood-flow (low Nyquist limit) (13). However, adjustment of the Nyquist limit (scale or baseline) is recommended when assessing Proximal Isovelocity Surface Areas (PISA) or low-velocity flow patent foramen ovale (PFO) or atrial septal defects (ASD). To maintain high frame-rate (FR), the ROI is optimised to include the whole area under investigation, but does not extend beyond this region. CFD assessment of two valves simultaneously has a significant negative impact on imaging FR, does not allow for a proper assessment of trans-valvular blood flow of either valve and should not be performed. As with standard 2D gain, CFD gain should be optimised with each patient. To optimise, set a Nyquist limit of between 50 and 60 cm/s and increase gain to the point at which the image is entirely over-gained and the ROI filled with colour ‘speckle’, CFD gain is then reduced until the speckle is no longer visible within the ROI.
Dynamic range/compression
Ultrasound signals returning to the probe are converted into a shade of grey based on their amplitude. The lowest amplitude signals are assigned a very dark grey shade whereas the highest amplitude signals are depicted as white; black in an image indicates that no signal has returned from this region or that the amplitude is extremely low. The Dynamic Range (DR) or Compression setting alters the number of grey shades depicted within the image. When DR/compression is reduced, fewer shades of grey are utilised in image formation. This results in a highly contrasting image with a black/white appearance (13). Conversely, when DR/compression is increased, more shades of grey are utilised in image formation and the appearance becomes ‘softer’. Optimisation of this function strikes a balance between an increased setting with well-defined image texture, and a decreased setting with starkly contrasting acoustic boundaries. When attempting to differentiate between myocardium and other echogenic structures, fine adjustment of the DR settings may help identify intra-cardiac masses such as endocarditis/thrombus.
Timing
Timing of measurements is crucial. However, variations in ECG timings can occur for a number of reasons, including using different ECG leads, electrical conduction
This work is licensed under a Creative Commons Attribution-NonCommercial-NoDerivatives 4.0 International License.
https://doi.org/10.1530/ERP-20-0026https://erp.bioscientifica.com © 2021 The British Society of Echocardiography
Published by Bioscientifica Ltd
Downloaded from Bioscientifica.com at 01/02/2022 06:54:32AMvia free access

S Robinson et al. Minimum dataset for transthoracic echo
G647:4
defects and coronary artery disease (18). The 2015 ASE/EACVI chamber guidelines contain varying definitions (19) for defining periods within the cardiac cycle. The definitions from the EACVI/ASE/Industry Task Force paper on standardising deformation imaging have thus been adopted as follows (20).
Ventricular end systole
The time point of ventricular end-systole is defined as the frame where the aortic valve closes and coincides with a closure click on the Doppler tracing of aortic valve flow. Surrogates are the nadir of the global longitudinal strain curve or volume curve. When obtaining images from the apical 2- or 4-chamber views, end-systole is defined as the frame prior to mitral valve opening (18, 19).
Ventricular end diastole
Ventricular end diastole is defined as the frame before the mitral valve closes. Surrogates for this are the frame with the greatest left ventricle (LV) cavity size (diameter or volume), the start of the ECG QRS complex, the ECG R-wave (a common trigger for analysis software) or the peak of the global longitudinal strain curve (18, 19).
Zoom
Two zoom options are available during routine TTE: pre-processing zoom where the image is enlarged prior to acquisition or freezing, and post-processing zoom where the image is enlarged after acquisition or freezing. The benefit of pre-processing over post-processing zoom is that when a ROI is enlarged the number of pixels within the zoomed image remains the same, each pixel will therefore depict a smaller area of the heart and image resolution is improved. Additionally, because of the smaller ROI, image FR are significantly increased providing improved temporal resolution. However, when performing post-processing zoom on a frozen or already acquired image, the pixels are simply magnified; 2D image resolution is not improved and FR remain the same.
Peak global longitudinal strain
Strain imaging is becoming more widespread and has increasing clinical utility in echocardiographic
practice, speckle-tracking derived strain being the most commonly utilised method. Unfortunately, there remains significant inter-vendor variability, such that a single reference interval would not suffice for all practitioners. Additionally, it is not clear whether different versions of strain software provide comparable results. Individual vendors currently provide reference intervals for specific platforms and software versions (11).
However, strain tools are of value when used sequentially on a single individual in order to help identify whether there have been subclinical changes in LV performance. Such an example would be when monitoring the effect of chemotherapy on LV systolic function (21). Given the current vendor- and even software-version variations in strain, it is important that this is documented in the report and every effort made to provide continuity between assessments. If a vendor’s measurement tools are upgraded, old studies should be re-measured before they are used for comparison (11).
Three-dimensional echocardiography
The 2D echocardiographic assessment of a 3D structure has inherent limitations because of the geometric assumptions required for calculation of chamber volume. In contrast, estimates of chamber volume made by 3D echocardiography are superior to those by the 2D Simpson’s summation of discs method as it allows direct tracing of the whole endocardial border of the cavity (21).
Volumetric datasets create a 3D image of a chamber through the acquisition of several sub-volumes over sequential cardiac cycles, attention to breath-hold and regular R–R interval is therefore essential to avoid respiration related stitching artefact. The greater the number of sub-volumes used, the higher the frame rate and temporal resolution, albeit at greater risk of stitching artefact (21). Stitching of multiple sub-volumes to create a larger 3D dataset is therefore nearly always prevented by atrial fibrillation. Newer technology allows increased volume rates and reduced time for complete cardiac volume acquisition. It should be recognised that there is a trade-off between temporal and spatial resolution – a volume rate of <15/s is insufficient for LVEF calculation due to under-sampling, but a volume rate of >25/s may compromise line density and therefore the ability to accurately trace endocardial borders (21). However, 3D imaging remains sensitive to image quality and it is good practice to record and analyse both 2D and 3D images.
This work is licensed under a Creative Commons Attribution-NonCommercial-NoDerivatives 4.0 International License.
https://doi.org/10.1530/ERP-20-0026https://erp.bioscientifica.com © 2021 The British Society of Echocardiography
Published by Bioscientifica Ltd
Downloaded from Bioscientifica.com at 01/02/2022 06:54:32AMvia free access

S Robinson et al. Minimum dataset for transthoracic echo
G657:4
Multiplane imaging
An additional function of matrix array probes is the ability to simultaneously image in multiple scan planes. Although the default setting is usually for orthogonal imaging, the degrees of separation between the planes can be adjusted by the echocardiographer. The great advantage of simultaneous multiplane imaging is that it allows rapid visualisation and greater understanding of structures and blood-flow in both their major and minor dimensions. Multiple plane imaging is also helpful for unmasking artefacts out of plane.
2D contrast echocardiography
Inadequate LV endocardial border definition can lead to errors in LV volume and LVEF estimation. Accurate LVEF assessment is particularly important where values obtained fall on boundaries that influence treatment decisions. The use of echocardiographic contrast for LV chamber opacification is now widely accepted when two contiguous LV segments from any apical view are not seen on non-contrast images (22). Tracing LV borders more reliably leads to inclusion of LV trabeculation within the LV cavity after contrast. As a result, LV volumes (both in systole and diastole) are commonly greater than those recorded with non-contrast imaging, although LVEFs are usually analogous. It is to be noted that the use of contrast has unpredictable effects on 2D speckle-tracking and is best done after strain acquisition (21).
Atrial fibrillation
The increasing prevalence of atrial fibrillation (AF) and its close association with heart failure (HF) (23) and valve disease (24) has resulted in a growing number of patients in AF undergoing TTE. Because of this association with pathology, a comprehensive and accurate assessment of cardiac structure and function is necessary for all AF patients. However, due to the persistent variation in cardiac cycle length, measures of ventricular systolic and diastolic function may have limited reliability if appropriate measurement guidelines are not followed. Previous versions of the minimum dataset guidelines have recommended that measures are averaged over 5–10 beats when the heart rate is between 60 and 80 bpm (25). However, more recent findings suggest that when preceding and pre-preceding RR intervals are within
60 ms of each other and both exceed 500 ms, measures of systolic function on a single beat are similar to those averaged over 15 cycles of varying durations (26). Although there is very little data available to support the validity of systolic function measures made during AF, these findings suggest that selection of beats with similar RR intervals is more important for reproducibility than the total number of measures made. It is recommended that the same methodology is applied when performing all other measures of cardiac size and function.
Assessment of diastolic function remains an essential consideration for patients in AF with some parameters providing important prognostic value. Please refer to the BSE guideline for the Assessment of Diastolic Function for further guidance of how to investigate this in patients with AF (27).
Study duration
Since the BSE first published a protocol identifying a minimum dataset for performing standard TTE, the complexity and number of measures made during a standard echocardiogram has grown consistently with each iteration. It has been suggested in previous versions of the minimum dataset guideline that the average time required for the performance and reporting a comprehensive transthoracic echocardiogram is considered to be 40–45 min (25). Although it is feasible for the comprehensive minimum dataset to be acquired and reported within 45 min in a subject with normal cardiac anatomy and function, it must be recognised that the vast majority of patients undergoing a standard TTE in clinical practice require further analysis of cardiac pathology. As such, further time may need to be given in assessment of complex and multiple pathologies or when time is needed for advanced post-processing such as 3D volumes or GLS. In these scenarios, the overall time to acquire and report my take an extra 5–10 min. To ensure high-quality TTE studies are performed, while recognising the increasing number and complexity of measurements necessary and the need to balance this against an increasing workload, a variety of echo lab processes can be optimised. These might include workstations within each echo lab to allow immediate echo reporting, or by optimising staffing levels and echo machine utilisation by two echocardiographers (either band 7 and 6 or both 7s) alternating half-hourly appointments with simultaneous scanning and reporting. These practices safeguard adequate time for scanning and enables timely reporting (Table 1).
This work is licensed under a Creative Commons Attribution-NonCommercial-NoDerivatives 4.0 International License.
https://doi.org/10.1530/ERP-20-0026https://erp.bioscientifica.com © 2021 The British Society of Echocardiography
Published by Bioscientifica Ltd
Downloaded from Bioscientifica.com at 01/02/2022 06:54:32AMvia free access

S Robinson et al. Minimum dataset for transthoracic echo
G667:4
Table 1 A structured approach to image acquisition and standardised measurement protocol for performing a standard transthoracic echocardiogram.
View (modality)
Measure
Explanatory note
Image
PLAX (2D) Visual assessment: pleural/pericardial space
Parasternal long axis (PLAX) view is optimised to demonstrate the best image available. Increase scan depth to assess for posterior pericardial effusion and/or left pleural effusion.
PLAX (2D): LV
LV size: LVEDd/LVESd, IVSd, LVPWd (2D)
Scan depth is reduced to maximise the PLAX view with around 1 cm beyond the pericardium remaining within the image.
Left ventricular (LV) wall thickness and internal diameter measures are performed at end-diastole and end-systole (30). Measurements are made at the same level, perpendicular to the long-axis plane of the LV and immediately below the mitral valve leaflet tips.
Care should be taken to ensure that the measurement is of compacted myocardium only and that: trabeculation, mitral valve (MV) apparatus, papillary muscle and right ventricle (RV) moderator band/septomarginal trebeculation are avoided.
(Continued)
This work is licensed under a Creative Commons Attribution-NonCommercial-NoDerivatives 4.0 International License.
https://doi.org/10.1530/ERP-20-0026https://erp.bioscientifica.com © 2021 The British Society of Echocardiography
Published by Bioscientifica Ltd
Downloaded from Bioscientifica.com at 01/02/2022 06:54:32AMvia free access

S Robinson et al. Minimum dataset for transthoracic echo
G677:4
View (modality)
Measure
Explanatory note
Image
Limitation: Two-point measures of 3D structures are limited by the geometric assumptions of symmetry that are necessary to estimate global size and mass (31). Accuracy is reduced in the presence of asymmetrical wall thickness and non-circular LV geometry.
When measuring LV wall thickness, focal basal septal hypertrophy can lead to overestimation of LV mass. When present, measure distal (more apical) to the septal bulge. Due to the tethered plane of M-mode imaging, 2D measures are preferred.
PLAX (2D): LV
Visual assessment: LV wall motion
Qualitative assessment of radial function and motion of the anterior septum and inferior lateral walls.
BAS: Basal antero-septumMAS: Mid antero-septumBIL: Basal infero-lateralMIL: Mid infero-lateralLimitation: Teichholz estimates of LV ejection fraction (LVEF) are limited by: the plane of measurement, the presence of regional wall motion abnormalities, asymmetrical hypertrophy and non-circular LV geometry. For these reasons, LVEF should not be estimated by Teichholz (30).
PLAX – LA (2D) (zoom may be used)
LA anterior–posterior linear measure
Measure the left atrium (LA) diameter perpendicular to the aortic root and at the level of the sinus of Valsalva (SoV). Inner edge to inner edge method is used at end-systole (11).
When linear measures of the LA required, 2D measurements are recommended due to poor axis imaging associated with M-mode.
Limitation: Single dimension measure of a 3D chamber.
Due to off-axis imaging resulting in oblique scanning planes, M-mode measurement of the aortic root is not recommended
Table 1 Continued
(Continued)
This work is licensed under a Creative Commons Attribution-NonCommercial-NoDerivatives 4.0 International License.
https://doi.org/10.1530/ERP-20-0026https://erp.bioscientifica.com © 2021 The British Society of Echocardiography
Published by Bioscientifica Ltd
Downloaded from Bioscientifica.com at 01/02/2022 06:54:32AMvia free access

S Robinson et al. Minimum dataset for transthoracic echo
G687:4
View (modality)
Measure
Explanatory note
Image
PLAX (2D) RVOT PLAX At end-diastole, at a similar level to PSAX right ventricular outflow tract (RVOT) (1) measurement. Adjust depth and focal zone to visualise the RVOT. Ideally should form a perpendicular line from the RVOT wall to the junction between the interventricular septum and aortic valve (32).
PLAX (2D) MV scallops
Visual assessment: MV anatomy
Zoom on the MV
Demonstrate the anatomy and excursion of both mitral leaflets (anterior leaflet leading to the AV, posterior leaflet extending from the base of the infero-lateral wall), the proximal chordae, subvalvular apparatus and annulus anatomy. Imaging in the standard PLAX plane demonstrates MV scallops A2 and P2 (33).
Focussed assessment of mitral anatomy and function.
M-mode can be applied to demonstrate timing and speed of leaflet excursion.
Table 1 Continued
(Continued)
This work is licensed under a Creative Commons Attribution-NonCommercial-NoDerivatives 4.0 International License.
https://doi.org/10.1530/ERP-20-0026https://erp.bioscientifica.com © 2021 The British Society of Echocardiography
Published by Bioscientifica Ltd
Downloaded from Bioscientifica.com at 01/02/2022 06:54:32AMvia free access

S Robinson et al. Minimum dataset for transthoracic echo
G697:4
View (modality)
Measure
Explanatory note
Image
PLAX (2D/CFD) MV scallops: Tilted view
Visual assessment: Complete MV anatomy
Focussing on the MV while tilting the probe towards the RV inflow view demonstrates scallops A3 and P3 and eventually the Postero-medial commissure. Focussing on the MV while tilting the probe towards the RV outflow view will demonstrate scallops A1 and P1 and eventually the antero-lateral commissure. 2D assessment of leaflet anatomy and motion and CFD assessment of mitral regurgitation (MR) can be performed at all levels (33).
PLAX (CFD) MV
Assessment for MR
Zoomed assessment of MR
Optimise colour flow Doppler (CFD) settings. Adjust the lateral CFD region of interest (ROI) to include 1 cm of the LV on the left lateral border and the roof of the LA on the right lateral border. The CFD ROI height should not extend beyond the anterior and posterior LA walls (33). Simultaneous MV and AV CFD assessment should not be performed
MV CFD zoom.
PLAX (2D) AV
Visual assessment: AV
Zoom on the AV to demonstrate valve cusps. From parasternal view, two cusps are seen: the right coronary cusp (RCC) is positioned anteriorly and extends from the ventricular septal aspect of AV annulus. However, the more posterior cusp in view may be either the non-coronary (NCC) or the left-coronary (LCC) cusp depending on the degree of beam tilt.
Table 1 Continued
(Continued)
This work is licensed under a Creative Commons Attribution-NonCommercial-NoDerivatives 4.0 International License.
https://doi.org/10.1530/ERP-20-0026https://erp.bioscientifica.com © 2021 The British Society of Echocardiography
Published by Bioscientifica Ltd
Downloaded from Bioscientifica.com at 01/02/2022 06:54:32AMvia free access

S Robinson et al. Minimum dataset for transthoracic echo
G707:4
View (modality)
Measure
Explanatory note
Image
PLAX AV (CFD)
AV colour flow assessment
Assessment AV CFD. The ROI is optimised to include the jet proximal isovelocity surface area (PISA) within the aorta and includes full jet expansion with the LV.
PLAX (2D) – LVOT/AV Zoom
LVOT diameter The zoomed image of the LVOT/AV is optimised to demonstrate the central plane of the LVOT and the insertion points of the right and non-coronary cusps.
Use the frame providing the largest LVOT diameter (mid-systole), measure the LVOT diameter by inner edge to inner edge method parallel to the aortic valve and as close to the aortic annulus as possible (34).
Limitation: When estimating LV stroke volume, the LVOT cross-section is assumed to be perfectly circular, the equation πr2 is therefore applied to calculate the LVOT area. However, although roughly circular close to the annulus, the LVOT becomes progressively more elliptic further from the AV. Furthermore, as the LVOT becomes more elliptic during late systole, early to mid-systolic measures are therefore preferred.
PLAX (2D) Aorta (Ao) zoom
Aortic root measures
Zoomed view. The BSE recommend the inner-edge to inner-edge method for measuring aortic dimensions. However, it should be clearly documented in the report if an alternative measurement approach has been adopted by the department.
In end-diastole
• Sinus of Valsalva• Sinotubular junction Proximal ascending aorta: 1 cm above sinotubular
junction (11)
Table 1 Continued
(Continued)
This work is licensed under a Creative Commons Attribution-NonCommercial-NoDerivatives 4.0 International License.
https://doi.org/10.1530/ERP-20-0026https://erp.bioscientifica.com © 2021 The British Society of Echocardiography
Published by Bioscientifica Ltd
Downloaded from Bioscientifica.com at 01/02/2022 06:54:32AMvia free access
S Robinson et al. Minimum dataset for transthoracic echo
G717:4
View (modality)
Measure
Explanatory note
Image
In mid-systole• Aortic annulus: insertion points AV RCC and N/LCC
Measurements are indexed to height (mm/m).If there is enlargement above the level of the proximal ascending Ao (white line), the maximal dimension should be measured and stated in report. To ensure accurate comparison of the dimensions during follow up, measure and report the distance from that maximal dimension to the AV annulus.
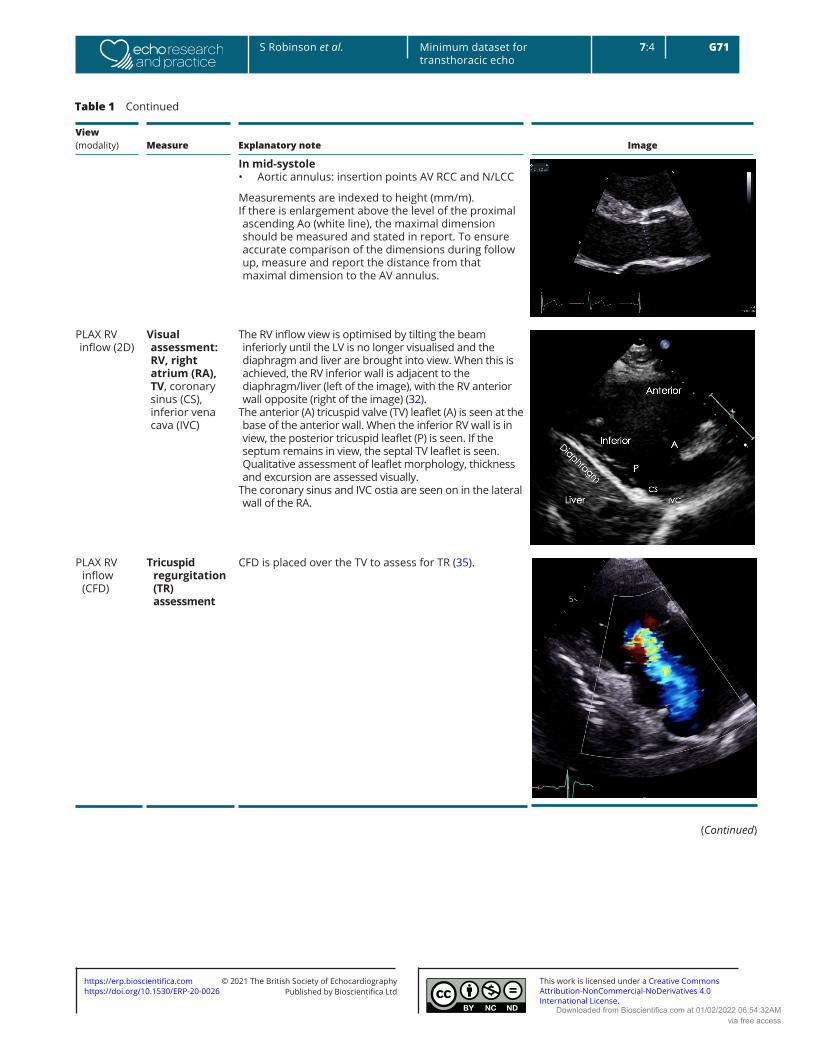
PLAX RV inflow (2D)
Visual assessment: RV, right atrium (RA), TV, coronary sinus (CS), inferior vena cava (IVC)
The RV inflow view is optimised by tilting the beam inferiorly until the LV is no longer visualised and the diaphragm and liver are brought into view. When this is achieved, the RV inferior wall is adjacent to the diaphragm/liver (left of the image), with the RV anterior wall opposite (right of the image) (32).
The anterior (A) tricuspid valve (TV) leaflet (A) is seen at the base of the anterior wall. When the inferior RV wall is in view, the posterior tricuspid leaflet (P) is seen. If the septum remains in view, the septal TV leaflet is seen. Qualitative assessment of leaflet morphology, thickness and excursion are assessed visually.
The coronary sinus and IVC ostia are seen on in the lateral wall of the RA.
PLAX RV inflow (CFD)
Tricuspid regurgitation (TR) assessment
CFD is placed over the TV to assess for TR (35).
Table 1 Continued
(Continued)
This work is licensed under a Creative Commons Attribution-NonCommercial-NoDerivatives 4.0 International License.
https://doi.org/10.1530/ERP-20-0026https://erp.bioscientifica.com © 2021 The British Society of Echocardiography
Published by Bioscientifica Ltd
Downloaded from Bioscientifica.com at 01/02/2022 06:54:32AMvia free access

S Robinson et al. Minimum dataset for transthoracic echo
G727:4
View (modality)
Measure
Explanatory note
Image
PLAX RV inflow Continuous wave Doppler (CWD) TV
TR peak velocity (TRVmax)
Peak TR velocity is measured by CWD across the tricuspid valve.
Ensure the CWD to flow angle is correctly aligned. Eccentric jets can lead to incomplete Doppler envelopes and underestimation of TR velocity. A high sweep speed (100 mm/s) can help to differentiate between true velocities and artefact. Measure from a complete TR envelope. Choose the highest velocity (35).
Limitation: Doppler derived estimates of systolic pulmonary artery pressure (SPAP) are limited by the angle of intercept between ultrasound and blood flow. Accuracy is greatest when ultrasound and blood-flow are parallel (35).
PLAX RV outflow (2D)
Distal RVOT, pulmonary valve (PV), main pulmonary artery (MPA)
The RVOT view is achieved by tilting the ultrasound beam superiorly from the PLAX view and centralising the RVOT and PV in the image (32).
PLAX RV outflow pulsed wave Doppler (PWD)
RVOT (PWD).VmaxVTI
Optional to PSAX. A pulsed wave Doppler measurement is taken after positioning the sample volume just below the pulmonic cusps in the centre of the RVOT. Measurement of PV acceleration time (PAT) is made at end expiration from the onset of flow to peak flow velocity. Heart rates outside of the normal range (<70 or >100 bpm) may reduce accuracy and a correction for HR may be used (RVOT acceleration time (AT) × 75/HR). Low-velocity reject is reduced to demonstrate the on onset of blood-flow within the RVOT. Sweep-speed is set to 100–150 mm/s (35).
Limitation: Pulmonary acceleration time (PAT) varies throughout the RVOT, acceleration times obtained from flow close to the wall differ from those in the centre of the RVOT. As the RVOT is imaged in a single plane, the exact position of the sample-volume relative in relation to the RVOT wall in the orthogonal plane is unknown. Combined with the very short time period being measured, PAT estimates of mean pulmonary artery pressure (MPAP) are of limited validity and reproducibility (36).
Table 1 Continued
(Continued)
This work is licensed under a Creative Commons Attribution-NonCommercial-NoDerivatives 4.0 International License.
https://doi.org/10.1530/ERP-20-0026https://erp.bioscientifica.com © 2021 The British Society of Echocardiography
Published by Bioscientifica Ltd
Downloaded from Bioscientifica.com at 01/02/2022 06:54:32AMvia free access

S Robinson et al. Minimum dataset for transthoracic echo
G737:4
View (modality)
Measure
Explanatory note
Image
PLAX RV outflow (CFD)
RVOT CFD and CW assessment of MPAP
Optional to PSAX. Assess for pulmonary regurgitation (PR) and any abnormal flow (32).
PLAX RV outflow (CWD)
RVOT CWDPR density & contour of signal.
VmaxVmeanPressure half time (PHT)
PRvel
Optional to PSAX. The CW Doppler signal is optimised to demonstrate PV forward flow velocity.
When PR is present, place the CW Doppler cursor through the pulmonary valve in line with the PR jet.
Limitations: Angle of intercept limitations apply to Doppler estimates of PR velocity and pressure.
PSAX outflow (2D)
Visual assessment: AV, LA, RA, inter atrial septum (IAS), RVOT, PV
The PSAX view of the AV is optimised to demonstrate the valve in the centre of the image with a depth set to around 1 cm beyond the LA posterior wall.
The LA is seen immediately posterior to the AV with the ostia of the left atrial appendage (LAA) and left upper pulmonary vein (LUPV) visualised on the left lateral wall (right side of the image). The right atrium (RA) is adjacent and to the left of the LA with the: TV, RV in-flow, RVOT out-flow and PV leading to PA orientated from left to right.
Table 1 Continued
(Continued)
This work is licensed under a Creative Commons Attribution-NonCommercial-NoDerivatives 4.0 International License.
https://doi.org/10.1530/ERP-20-0026https://erp.bioscientifica.com © 2021 The British Society of Echocardiography
Published by Bioscientifica Ltd
Downloaded from Bioscientifica.com at 01/02/2022 06:54:32AMvia free access

S Robinson et al. Minimum dataset for transthoracic echo
G747:4
View (modality)
Measure
Explanatory note
Image
PSAX AV zoom (2D/CFD)
Visual assessment: AV
Qualitative assessment of cusp morphology, thickness and excursion are assessed visually. A zoomed image of the valve is recommended. Fine tilting of the probe at this level can reveal the ostia of the right and left coronary arteries in the respective sinus.
CFD is positioned over the AV to assess for and identify the origin of AR. A zoomed image of the AV with CFD is recommended.
PSAX RVOT (2D)
RVOT1; RVOT2Visual assessment and measure of RVOT/PV/MPA/RPA/LPA
Qualitative assessment of RVOT structure and function. Proximal and distal measurements of RVOT diameter are made in the PSAX plane at the level of the AV. Both measures are made at end-diastole by the inner-edge to inner-edge method.
RVOT1 is measured from the anterior aortic wall directly up to the RVOT free wall (at the level of the aortic valve). The PSAX view is more reproducible than RVOT PLAX (32).
RVOT2 is also measured in diastole, immediately proximal to the PV (32).
Table 1 Continued
(Continued)
This work is licensed under a Creative Commons Attribution-NonCommercial-NoDerivatives 4.0 International License.
https://doi.org/10.1530/ERP-20-0026https://erp.bioscientifica.com © 2021 The British Society of Echocardiography
Published by Bioscientifica Ltd
Downloaded from Bioscientifica.com at 01/02/2022 06:54:32AMvia free access

S Robinson et al. Minimum dataset for transthoracic echo
G757:4
View (modality)
Measure
Explanatory note
Image
The RVOT view is achieved by centralising the RVOT and PV in the image. The main pulmonary artery (MPA) is seen leading to the pulmonary artery (PA) bifurcation (right PA branch seen on the left and left PA seen on the right branch). MPA dimension is measured in end- diastole halfway between the pulmonary valve and bifurcation of main MPA or at 1 cm above the PV (32 ) – refer to the BSE pulmonary hypertension (PHT) guideline for interpretation in the context of PHT (35).
PSAX IAS (2D/CFD)
Visual assessment: IAS appearance and abnormal colour flow
CFD is placed over the IAS to assess for trans-septal flow. A zoomed image is recommended, CFD scale may be reduced to identify patent foramen ovale (PFO) flow.
PSAX inflow/outflow (2D/CFD/CWD/PWD)
Assessment of TV and PV
CFD is placed over the TV to assess for tricuspid regurgitation. The image may be tilted to provide optimal Doppler alignment with the TR jet. PWD of RV inflow velocities may be performed for the assessment of RV diastolic function (32).
Full Doppler assessment of the PV (CFD, CWD, PWD) can also be performed in this view. Assess for pulmonary regurgitation (PR) and any abnormal flow (35).
PSAX LV: MV level (2D/CFD)
Assessment of MV anatomy
The PSAX imaging plane at the level of the MV is optimised to demonstrate the diastolic excursion of the mitral leaflet tips within the circular LV. Off-axis imaging views results in an oblique cross-section imaging plane and an of the LV. The more longitudinal imaging plane results in the LV appearing more elliptic in shape.
The ventricular surface of the MV leaflets is visualised in the PSAX view with scallops three 3 to one 1 seen from left to right. The postero-medial (PM) scallop is adjacent to A3/P3 and the antero-lateral (AL) scallop adjacent to A1/P1. The crescentic RV is seen anterior to the LV.
Qualitative assessment of leaflet morphology, thickness and excursion are assessed visually. CFD is placed over the MV to assess for and identify the origin of regurgitation (33).
Table 1 Continued
(Continued)
This work is licensed under a Creative Commons Attribution-NonCommercial-NoDerivatives 4.0 International License.
https://doi.org/10.1530/ERP-20-0026https://erp.bioscientifica.com © 2021 The British Society of Echocardiography
Published by Bioscientifica Ltd
Downloaded from Bioscientifica.com at 01/02/2022 06:54:32AMvia free access

S Robinson et al. Minimum dataset for transthoracic echo
G767:4
View (modality)
Measure
Explanatory note
Image
PSAX LV: MV level (2D)
Visual assessment: LV regional wall motion
BAS: Basal antero-septumBA: Basal anteriorBAL: Basal antero-lateralBIL: Basal infero-lateralBI: Basal inferiorBIS: Basal infero-septum
PSAX Mid LV: (2D/CFM/MM)
Visual assessment: LV wall motion
The PSAX view of the LV is taken at the level of the mid papillary muscle. The image is optimised to gain an on-axis cross-sectional view of the circular LV with the mid-apical portion of the crescentic RV seen anteriorly and to the left of the image. Both regional and global left ventricular systolic function is assessed visually.
MAS: Mid antero-septumMA: Mid anteriorMAL: Mid antero-lateralMIL: Mid infero-lateralMI: Mid inferiorMIS: Mid infero-septumAssess radial systolic function/regional wall motion abnormality and RV wall thickness (32).
CFD is helpful to assess integrity of ventricular septum.M-mode may be taken of the LV at this level.
PSAX Apical LV: (2D/CFD)
Visual assessment: LV wall motion
Tilt the beam further inferiorly until the RV apex is no longer in view.
A: AnteriorL: LateralI: InferiorS: Septal
Table 1 Continued
(Continued)
This work is licensed under a Creative Commons Attribution-NonCommercial-NoDerivatives 4.0 International License.
https://doi.org/10.1530/ERP-20-0026https://erp.bioscientifica.com © 2021 The British Society of Echocardiography
Published by Bioscientifica Ltd
Downloaded from Bioscientifica.com at 01/02/2022 06:54:32AMvia free access

S Robinson et al. Minimum dataset for transthoracic echo
G777:4
View (modality)
Measure
Explanatory note
Image
PSAX (CFD) Visual assessment: integrity of ventricular septum
Sweep beam from base to apex.
PSAX (CFD) Visual assessment: integrity of ventricular septum
Ventricular septal defect (VSD): congenital/post infarct.
A4C (2D) LV size, wall thickness, longitudinal and radial function, MV/TV appearance, atrial septal mobility
Optimize image so that all four chambers are seen. LV apex is positioned at the top and centre of sector.
Use this view and zoomed views where necessary for assessment.
A4C (2D)
RV/LV basal diameter ratio
RV/LV basal diameter ratio: Measured from the standard A4C without foreshortening at end diastole. Ratio > 1 suggests RV dilatation (32).
Table 1 Continued
(Continued)
This work is licensed under a Creative Commons Attribution-NonCommercial-NoDerivatives 4.0 International License.
https://doi.org/10.1530/ERP-20-0026https://erp.bioscientifica.com © 2021 The British Society of Echocardiography
Published by Bioscientifica Ltd
Downloaded from Bioscientifica.com at 01/02/2022 06:54:32AMvia free access

S Robinson et al. Minimum dataset for transthoracic echo
G787:4
View (modality)
Measure
Explanatory note
Image
A4C LV (2D) Visual assessment: LV wall motion
It is recommended that a template for reporting is based on a 16-segment model. The 17-segment model which includes the LV apex is less commonly applied since the apex is stationary in the true long axis and therefore wall motion is less applicable (37).
BIS: Basal infero-septumMIS: Mid infero-septumAS: Apical septumBAL: Basal antero-lateralMAL: Mid antero-lateralAL: Apical lateral
A4C LV Zoom (2D)
LV volume assessment
LV volumes should be obtained using 2D imaging from A4C and A2C (11).
Trace the endocardial border. LV length is defined as the distance between the midpoint of the mitral valve level line and the most distal point of the LV apex. Take care to ensure the LV is not foreshortened. Papillary muscles and trabeculations are excluded from the volumes and considered part of the chamber.
Measure at end-diastole and end-systole. Measurement is indexed to BSA (30).
Consider LV opacification for improved endocardial definition.
3D assessment of the LV is a highly feasible and reproducible parameter of LV systolic function. Given the superiority over 2D estimates, 3D assessment of LV volumes and LVEF is recommended in all cases where image quality permits accurate measurement.
An estimate of LVEF should be included in all echo reports. A visual estimate should be provided only when image quality is suboptimal for Simpson’s biplane estimate.
Table 1 Continued
(Continued)
This work is licensed under a Creative Commons Attribution-NonCommercial-NoDerivatives 4.0 International License.
https://doi.org/10.1530/ERP-20-0026https://erp.bioscientifica.com © 2021 The British Society of Echocardiography
Published by Bioscientifica Ltd
Downloaded from Bioscientifica.com at 01/02/2022 06:54:32AMvia free access

S Robinson et al. Minimum dataset for transthoracic echo
G797:4
View (modality)
Measure
Explanatory note
Image
A4C (2D GLS)
Measures of GLS. When image quality permits, peak GLS should be performed in all cardio-oncology patients
The average peak global longitudinal strain (GLS) is calculated using the apical long axis (A3C), four chamber A4C and two chamber A2C standard views, respectively. High quality image acquisition, maintaining a frame rate of 40–90 frames/s at a stable heart rate is key. Higher frame rates are required if tracking at faster rates such as during exercise or pharmacological stress tests (38). ECG trigger should be checked. Valve timings should be determined by Doppler to ensure consistency across triplane images. Clear endocardial and epicardial definition (seen throughout the cardiac cycle) is required to ensure adequate segmental tracking during systole and diastole. Markers are placed in each of the respective basal and apical regions, utilising automated tracking where possible to maintain reproducible results. ROI should be manipulated as required to fit the myocardium. Automated tracking should also be combined with a visual assessment of tracking in each view across the whole region of interest including the endocardial and epicardial border (38). If more than two segments in any one view are not adequately tracked, the calculation of GLS should be avoided (38). Furthermore, any segment which is not tracked correctly on visual assessment should be excluded from the final analysis in order not to affect the GLS value.
Limitation: although less load dependent than other conventional measures of systolic function, GLS is effected by alterations in loading conditions.
A4C LA (2D) LA volume Biplane LA volume should be estimated using 2D imaging from the A4C and A2C views. As the long-axis dimensions of the LV and LA lie in different imaging planes, the standard apical views optimised for LV assessment do not demonstrate the maximal LA volume. The A4C and A2C images acquired for LA measurement should be optimised to demonstrate the maximal LA length and volume at end-systole. Measurement is made using Simpson’s biplane method. The A4C and A2C long-axis dimensions should measure within 5 mm of each other. If the difference between measures exceeds 5 mm, the apical views should be reviewed and optimised for LA measurement (11).
Trace the inner aspect of the left atrial wall. At the mitral valve level, the contour is closed by a straight line between leaflet insertion points into the mitral valve annulus. Exclude left atrial appendage and pulmonary veins.
Estimates of LA volume by Area–Length (A–L) method are routinely larger than the same measure made by Simpson’s technique. The A–L method is therefore not interchangeable or comparable with measures made Simpson’s method. As the Simpsons biplane method involves fewer assumptions of LA geometry, it is the recommended method of LA volume measurement (11).
It is recommended that departments review which method of LA volume calculation is programmed into each echo machine/reporting system.
Table 1 Continued
(Continued)
This work is licensed under a Creative Commons Attribution-NonCommercial-NoDerivatives 4.0 International License.
https://doi.org/10.1530/ERP-20-0026https://erp.bioscientifica.com © 2021 The British Society of Echocardiography
Published by Bioscientifica Ltd
Downloaded from Bioscientifica.com at 01/02/2022 06:54:32AMvia free access

S Robinson et al. Minimum dataset for transthoracic echo
G807:4
View (modality)
Measure
Explanatory note
Image
A4/2/3C MV (2D)
MV assessment Assess anatomy and excursion of both mitral leaflets (anterior closer to septum; posterior leaflet closer to lateral wall). Segments usually imaged are viewed would be:
4C view: A3/A2 and P12C view: P3/A2/P13C view: P2/A2 (33)
A4C MV (CFD)
MR assessment
MV CFD inflow. Look for abnormal, turbulent or regurgitant flow.
A4C MV (PWD)
EVmaxAVmaxE/A ratioDT
Place sample volume (1–3 mm) at level of the MV leaflet tips in diastole.
Use of CFD can help to align the centre of trans-mitral flow.
Measure at end expiration.Emax: peak velocity in early diastole.Amax: peak velocity in late diastole (after P wave).DT: Flow deceleration time from peak E wave to end of E wave signal (27).
A4C LV tissue Doppler imaging (TDI):
e′E/e′S′
Place sample volume (5–10 mm) at or within 1cm of the insertion of the mitral valve leaflets. The angle of insonation should be as close to parallel as possible. Measure at end expiration. Optimise scale and sweep speed (100 mm/s).
e′: Peak velocity at the leading edge of the spectral waveform in early diastole (after the T wave). If possible average both septum and lateral wall measurement.
S′: Peak systolic velocity (27).Limitation: this measure assumes that the function of
these two segments represents longitudinal function of the entire ventricle, this is unlikely in conditions that result in regional wall motion abnormalities.
Table 1 Continued
(Continued)
This work is licensed under a Creative Commons Attribution-NonCommercial-NoDerivatives 4.0 International License.
https://doi.org/10.1530/ERP-20-0026https://erp.bioscientifica.com © 2021 The British Society of Echocardiography
Published by Bioscientifica Ltd
Downloaded from Bioscientifica.com at 01/02/2022 06:54:32AMvia free access

S Robinson et al. Minimum dataset for transthoracic echo
G817:4
View (modality)
Measure
Explanatory note
Image
A4C MV (CWD)
Assessment of MR (signal density)
For a qualitative assessment of MR, align CW Doppler through the centre of the regurgitant jet. A faint CW Doppler signal is suggestive of trace-mild MR; CW signal density increases as MR becomes more severe (33).
Limitation: Malalignment with eccentric jets can lead to incomplete spectral Doppler signals or discrepant signal density for the degree of regurgitation.
A4C PulV (CFD)
A4C (CWD)
Pulmonary vein (PulV) identification
PulV flowPulV SPulV D
Pulmonary vein identification.Superior angulation of transducer and use of CFD can help locate the pulmonary veins. The right lower pulmonary vein (RLPV) is most likely adjacent to the atrial septum in the A4C view, with the right upper pulmonary vein likely to be visualised in the A5C view (39).
Place sample volume (1–3 mm) 1–2 cm into the vein.Use fast sweep speed (50–100 mm/s). Measure at end expiration.
PulV S: peak velocity in early systole (after QRS).PulV D: Peak velocity in early diastole (after T wave).
A5C (2D/LVOT CFM)
AV appearanceLVOT CFD
Assess for laminar or turbulent flow in systole and for regurgitant flow during diastole. When utilising CFD to identify the correct position of PW sample for LVOT Doppler, position the CFD ROI over the LVOT and AV with the lateral borders extending just beyond the LVOT walls. When assessing AR, adjust the colour box width and length to display both the whole length of the jet within the LV and LVOT. The CFD ROI size is optimised to demonstrate the whole jet but maintain frame-rates. Sweep the transducer through multiple views to identify the maximum jet size. Scanning outside of the standard imaging planes is necessary to assess eccentric jets.
A5C AV (CWD)
AV CWDAVmax velAVmean velAVmean gradientAVVTI
CWD. Adjust the angle of the image to achieve parallel alignment with LVOT outflow.
Minimise transit time artefact by reducing gain and optimising the reject function. Maximise the Doppler signal to fill the spectral display by adjusting the baseline and velocity scale. The signal should fill the vertical scale.
Measure AV VTi; AV velocity and peak/mean pressure gradients.
Table 1 Continued
(Continued)
This work is licensed under a Creative Commons Attribution-NonCommercial-NoDerivatives 4.0 International License.
https://doi.org/10.1530/ERP-20-0026https://erp.bioscientifica.com © 2021 The British Society of Echocardiography
Published by Bioscientifica Ltd
Downloaded from Bioscientifica.com at 01/02/2022 06:54:32AMvia free access

S Robinson et al. Minimum dataset for transthoracic echo
G827:4
View (modality)
Measure
Explanatory note
Image
A5C LVOT (PWD)
LVOT PW Doppler
VmaxVTI: stroke volume (SV), cardiac output (CO)
PWD – A3C or A5C view.Sample volume positioned on the immediate LV side of valve at the same level as the LVOTd measure (34). Move sample volume into the LVOT if needed to obtain laminar flow curve.
Velocity baseline and scale adjusted to maximise size of velocity curve. Use sweep speed 50–100 mm/s.
Measure LVOT VTI/LVOT velocity and gradient.
Modified A4C RV/RA (2D)
Visual assessment: RV
Obtain RV focussed view. From A4C view slide and/or angulate the tail of the transducer along the horizontal plane to place the RV in the centre of the image (instead of the conventional left heart-centred image) whilst ensuring that the LV outflow tract does not come into view. This allows the RV free wall to be clearly seen. Next, rotate the transducer to obtain the maximum diameter (32).
Modified A4C RV/RA (2D)
RVD1RVD2RVD3RV 3D and strain analysis
As RV size may be underestimated due to the crescentic RV geometry, all RV dimensions should be measured at end-diastole in the focussed RV view. From the A4C view, the RV focussed view is achieved by:
RVD1: Basal RV diameter. Measured at the maximal transverse diameter in the basal one third of the RV.
RVD2: Mid RV diameter measured at the level of the LV papillary muscles.
RVD3: RV length, from the plane of the tricuspid annulus to the RV apex (32).
RV 3D volume and, where available, RV strain can be measured in accordance with the BSE guideline for the assessment of the right heart.
Table 1 Continued
(Continued)
This work is licensed under a Creative Commons Attribution-NonCommercial-NoDerivatives 4.0 International License.
https://doi.org/10.1530/ERP-20-0026https://erp.bioscientifica.com © 2021 The British Society of Echocardiography
Published by Bioscientifica Ltd
Downloaded from Bioscientifica.com at 01/02/2022 06:54:32AMvia free access

S Robinson et al. Minimum dataset for transthoracic echo
G837:4
View (modality)
Measure
Explanatory note
Image
Modified A4C RV/RA (2D)
RA area RA area is measured in the RV focussed view at the end of ventricular systole on the frame just prior to TV opening.
Trace the RA from the plane of the TV annulus along the interatrial septum, superior and lateral walls of RA (40).
Modified A4C (2D/CFD/CWD) TV
TV appearanceTV colour flowTR Vmax
Assessment of TR severity.Qualitative assessment of TR severity. Mild TR has a soft jet density and parabolic contour. Severe TR has a dense CW jet. When acute severe or torrential, TR CW envelope is early peaking or triangular in shape due to rapid equalisation of RV and RA pressure.
TR Vmax is measured by CWD across the tricuspid valve. Multiple views may need to be taken to obtain the optimal window. These include the RV inflow, PSAX, A4C and subcostal views, or a modified view between the PSAX and A4C.
Ensure the CW Doppler flow angle is correctly aligned. Eccentric jets can lead to incomplete Doppler envelopes and underestimation of TR velocity. A high sweep speed (100 mm/s) can help to differentiate between true velocities and artefact (35).
TR velocity can be underestimated in severe/free-flowing TR and should be stated in the report if present (triangular waveform with low-velocity jet).
A4C RV TV (PWD)
TV E wave velocity
TV A wave velocity
TV E/A ratioTV E wave
deceleration time
The view should be optimised in order to align the ultrasound beam with tricuspid inflow. This may require an unconventional/oblique angulation.
Tricuspid inflow velocities vary with respiration, hence averaging should be performed over 5 beats. Measures should be taken at end of quiet expiration. Note also that values are highly sensitive to preload and afterload, and should be interpreted with caution in the presence of moderate or severe TR (35).
Table 1 Continued
(Continued)
This work is licensed under a Creative Commons Attribution-NonCommercial-NoDerivatives 4.0 International License.
https://doi.org/10.1530/ERP-20-0026https://erp.bioscientifica.com © 2021 The British Society of Echocardiography
Published by Bioscientifica Ltd
Downloaded from Bioscientifica.com at 01/02/2022 06:54:32AMvia free access

S Robinson et al. Minimum dataset for transthoracic echo
G847:4
View (modality)
Measure
Explanatory note
Image
A4C RV fractional area change (FAC) (2D)
FAC Manual tracing of the RV endocardial border, from the lateral tricuspid annulus along the lateral wall to the apex, and back along the interventricular septum to the medial tricuspid valve annulus. Repeated at end-diastole and end-systole. A disadvantage of this measure is that it neglects the contribution of the RV outflow tract to overall systolic function (35).
A4C Lat TV/MV annulus (MM)
TAPSEMAPSE
Align the M-mode cursor along the direction of the lateral tricuspid or mitral annulus to maximise longitudinal motion of the annulus. Measurement accuracy is improved by zooming on the TV annulus and selecting a high sweep speed.
Measure total excursion of the tricuspid annulus (35).Limitation: This is an angle dependent measurement and is therefore underestimated when M-mode alignment is not parallel (32). TAPSE is further limited due to the assumption that the longitudinal motion of this single region of the annulus represents the function of the entire RV, this is unlikely in cases of RV regional wall motion abnormalities (32). Furthermore, the magnitude of TAPSE is routinely reduced in those having previously undergone cardio-thoracic surgery. RV impairment should be reported with caution when TAPSE is below the normal reference interval in this setting (41).
A4CRV (TDI)
RV S′
PW tissue Doppler S wave measurement taken at the lateral tricuspid annulus in systole. It is important to ensure the basal RV free wall segment and the lateral tricuspid annulus are aligned with the Doppler cursor to avoid velocity underestimation (13).
As well as Doppler alignment limitations, the accuracy of this measurement is further limited by the assumption that overall function of the RV is reflected by basal RV contraction. Accuracy of this measure is therefore limited by conditions such as RV infarction and prior cardiac surgery (40).
Table 1 Continued
(Continued)
This work is licensed under a Creative Commons Attribution-NonCommercial-NoDerivatives 4.0 International License.
https://doi.org/10.1530/ERP-20-0026https://erp.bioscientifica.com © 2021 The British Society of Echocardiography
Published by Bioscientifica Ltd
Downloaded from Bioscientifica.com at 01/02/2022 06:54:32AMvia free access

S Robinson et al. Minimum dataset for transthoracic echo
G857:4
View (modality)
Measure
Explanatory note
Image
A4C RV fractional area change (FAC) (2D)
FAC Manual tracing of the RV endocardial border, from the lateral tricuspid annulus along the lateral wall to the apex, and back along the interventricular septum to the medial tricuspid valve annulus. Repeated at end-diastole and end-systole. A disadvantage of this measure is that it neglects the contribution of the RV outflow tract to overall systolic function (35).
A4C Lat TV/MV annulus (MM)
TAPSEMAPSE
Align the M-mode cursor along the direction of the lateral tricuspid or mitral annulus to maximise longitudinal motion of the annulus. Measurement accuracy is improved by zooming on the TV annulus and selecting a high sweep speed.
Measure total excursion of the tricuspid annulus (35).Limitation: This is an angle dependent measurement and is therefore underestimated when M-mode alignment is not parallel (32). TAPSE is further limited due to the assumption that the longitudinal motion of this single region of the annulus represents the function of the entire RV, this is unlikely in cases of RV regional wall motion abnormalities (32). Furthermore, the magnitude of TAPSE is routinely reduced in those having previously undergone cardio-thoracic surgery. RV impairment should be reported with caution when TAPSE is below the normal reference interval in this setting (41).
A4CRV (TDI)
RV S′
PW tissue Doppler S wave measurement taken at the lateral tricuspid annulus in systole. It is important to ensure the basal RV free wall segment and the lateral tricuspid annulus are aligned with the Doppler cursor to avoid velocity underestimation (13).
As well as Doppler alignment limitations, the accuracy of this measurement is further limited by the assumption that overall function of the RV is reflected by basal RV contraction. Accuracy of this measure is therefore limited by conditions such as RV infarction and prior cardiac surgery (40).
View (modality)
Measure
Explanatory note
Image
A2C (2D) Visual assessment: LV wall motion
BI: Basal inferiorMI: Mid inferiorAI: Apical inferiorBA: Basal anteriorMA: Mid anteriorAA: Apical anterior
A2C (2D/CFD/PWD/CWD)
LV volumeLA volumeE, A, DT if not reliable from A4C
MV Vmax, Vmean if not reliable from A4C
LV volumes/LA volume as for A4C viewCFD MV/LV inflow. Look for abnormal colour flowMeasure at LV inflow (MV tips)
Table 1 Continued
(Continued)
This work is licensed under a Creative Commons Attribution-NonCommercial-NoDerivatives 4.0 International License.
https://doi.org/10.1530/ERP-20-0026https://erp.bioscientifica.com © 2021 The British Society of Echocardiography
Published by Bioscientifica Ltd
Downloaded from Bioscientifica.com at 01/02/2022 06:54:32AMvia free access

S Robinson et al. Minimum dataset for transthoracic echo
G867:4
View (modality)
Measure
Explanatory note
Image
A2C (2D GLS)
A2C GLS GLS measurement. See A4C (2D GLS)
A3C (2D) Visual assessment: LV wall motion
BIL: Basal infero-lateralMIL: Mid infero-lateralAL: Apical lateraAS: Apical septumMAS: Mid antero-septumBAS: Basal antero-septum
A3C (CFD/CWD/PWD)
If suboptimal from A5C:
AV CW DopplerAVmax velAVmax gradientAVmean velAVmean gradientAVVTILVOT PW Doppler
VmaxVTI (SV, CO)
Visual assessment of LVOT, LV inflow, MV, look for abnormal colour flow. and AV. Zoom on MV if anatomy is abnormal
LVOT/AV Doppler velocity and gradient if suboptimal from A5C.
CFD assessment of AR and MR. Zoom for greater assessment.
Table 1 Continued
(Continued)
This work is licensed under a Creative Commons Attribution-NonCommercial-NoDerivatives 4.0 International License.
https://doi.org/10.1530/ERP-20-0026https://erp.bioscientifica.com © 2021 The British Society of Echocardiography
Published by Bioscientifica Ltd
Downloaded from Bioscientifica.com at 01/02/2022 06:54:32AMvia free access

S Robinson et al. Minimum dataset for transthoracic echo
G877:4
View (modality)
Measure
Explanatory note
Image
A3C (2D GLS)
A3C GLS GLS measurement. See A4C (2D GLS)GLS Bulls-eye
SC4C (2D)
Visual assessment: Subcostal view
Four chamber structures, atrial septum
SC4C (CFD)
Visual assessment: atrial septum integrity
Atrial septumConsider reducing Nyquist limit to detect low
velocity flow
Table 1 Continued
(Continued)
This work is licensed under a Creative Commons Attribution-NonCommercial-NoDerivatives 4.0 International License.
https://doi.org/10.1530/ERP-20-0026https://erp.bioscientifica.com © 2021 The British Society of Echocardiography
Published by Bioscientifica Ltd
Downloaded from Bioscientifica.com at 01/02/2022 06:54:32AMvia free access

S Robinson et al. Minimum dataset for transthoracic echo
G887:4
View (modality)
Measure
Explanatory note
Image
SC (2D) IVC 2D assessment
IVC diameter is measured perpendicular to the IVC long axis, 1–2 cm from the RA junction at end-expiration.
SC (MM) IVC size and inspiratory collapse
IVC diameter > 21 mm with decreased inspiratory collapse (<50% with a sniff, or <20% with quiet respiration) is considered abnormal and suggestive of raised RAP (35).
Measured on 2D imaging of the IVC during inspiration of sharp sniff. May be measured by M-mode (see image) if the IVC lies perpendicular to the beam line. Overestimation of IVC collapse may occur when the whole vessel moves out of the M-mode imaging plane upon inspiration.
SCSAX (2D) SAX structuresAV, IAS, TV, RVOT, PV, PA, LVPR is often very well aligned with the angle of CW Doppler in the subcostal window. Estimate of MPAP and DPAP can also be made in this view.
SC (2D)
Abdominal aorta (modified view)Anti-clockwise rotation from IVC view
Table 1 Continued
(Continued)
This work is licensed under a Creative Commons Attribution-NonCommercial-NoDerivatives 4.0 International License.
https://doi.org/10.1530/ERP-20-0026https://erp.bioscientifica.com © 2021 The British Society of Echocardiography
Published by Bioscientifica Ltd
Downloaded from Bioscientifica.com at 01/02/2022 06:54:32AMvia free access

S Robinson et al. Minimum dataset for transthoracic echo
G897:4
View (modality)
Measure
Explanatory note
Image
SSN (2D) Visual assessment: Aortic arch
Ascending aorta, transverse aortic arch, descending aorta, RPA. Look for abnormal colour flow
Head and neck vessels from left to right of image:BCA/IA: brachiocephalic/innominate arteryLCCA: left common carotid arteryLSA: left subclavian artery
SSN (CFD) Descending aorta CFD
Ascending aorta, transverse aortic arch, descending aorta, right pulmonary artery (RPA). Look for abnormal colour flow.
SSN (CWD)
Vmax
Descending aorta peak flow velocity
Table 1 Continued
This work is licensed under a Creative Commons Attribution-NonCommercial-NoDerivatives 4.0 International License.
https://doi.org/10.1530/ERP-20-0026https://erp.bioscientifica.com © 2021 The British Society of Echocardiography
Published by Bioscientifica Ltd
Downloaded from Bioscientifica.com at 01/02/2022 06:54:32AMvia free access

S Robinson et al. Minimum dataset for transthoracic echo
G907:4
Report
The report for a standard TTE should include height, weight, BSA, HR and BP. It should provide a comprehensive description of all echo findings in a structured and comprehensible format (28). Each report should include a textual description of the study findings and a tabular presentation of all measurements made. Every report should include a conclusion of four or five bullet-points in descending order of clinical importance (28). An estimate of LV ejection fraction should be reported in all studies. Where available and image quality permits, this should be performed by 3D. If 3D imaging is not available, LVEF should be measured by Simpson’s biplane method. A visual estimate of LVEF should only be provided when suboptimal image quality precludes accurate measurement. In cases where structural findings are complex and difficult to report (i.e. geometry and position of intra-cardiac masses), the inclusion of still images is recommended. When pathology is present and previous studies have been performed, a comparison with the previous findings should always be made within the conclusion.
Chaperones
Although a standard TTE is not considered an intimate examination, every echocardiographer should gain verbal consent from the patient that they agree to having the echo performed. All patients should be provided with a gown to wear during the study. A chaperone should be available at the patient’s request. It is strongly recommended that patients are informed by letter of the semi-intimate nature of echocardiography and that the local policy for offering and providing chaperones is followed. Information describing how to request a chaperone should also be clearly displayed within the department and a chaperone should always be available upon request (29).
1. Views to be obtained: PLAX Parasternal long axis PLAX Tilted RV inflow PLAX Tilted RV outflow PSAX Parasternal short axis: AV, MV, LV:
base, mid, apex PSAX RV inflow PSAX RV outflow A4C Apical four chamber A5C Apical five chamber A4C Modified A4C for RV A4C Optimised for LA volume measure A2C Apical two chamber A2C Optimised for LA volume measure A3C Apical three chamber SC Subcostal Subcostal cardiac chambers and IAS Subcostal IVC, heptic vein and abdominal Ao SSN Suprasternal2. Recorded and measured where appropriate: LVID d/s Left ventricular internal dimension in
diastole and systole IVSd Interventricular septal width in
diastole LVPWd Left ventricular posterior wall width
in diastole LV Mass Left ventricular mass LA Left atrial dimension in PLAX LVOTd Left ventricular outflow tract
diameter Ao sinus Sinus of Valsalva Ao STJ Sinotubular junction Prox Asc Ao Proximal ascending aorta TR Vmax Tricuspid regurgitation maximal
velocity LVEDvol d/s Left ventricular end-diastolic and
systolic volume (biplane/3D) LVEF Left ventricular ejection fraction LA volume Left atrial volume at end-ventricular
systole (area-length/biplane) TAPSE Tricuspid annular plane systolic
excursion Mitral E/A Mitral valve maximal velocity early
and atrial filling ratio e′ Lateral and/or septal early
myocardial relaxation velocity AV Doppler trace Maximal aortic velocity, peak/mean
pressure gradient and VTI on CW LVOT Doppler trace LVOT VTI RV Right ventricular linear dimensions
in diastole IVC dimensions Estimation of RA pressure
Appendix 1 Minimum dataset measurements.
This work is licensed under a Creative Commons Attribution-NonCommercial-NoDerivatives 4.0 International License.
https://doi.org/10.1530/ERP-20-0026https://erp.bioscientifica.com © 2021 The British Society of Echocardiography
Published by Bioscientifica Ltd
Downloaded from Bioscientifica.com at 01/02/2022 06:54:32AMvia free access

S Robinson et al. Minimum dataset for transthoracic echo
G917:4
Appendix 2 Abbreviations.
2D Two-dimensional 3D Three-dimensional A-L Area length A2C Apical two chamber view A3C Apical three chamber view A4C Apical four chamber view A5C Apical five chamber AA Apical anterior AC Apical cap AF Atrial fibrillation AI Apical inferior AL Apical lateral A Mitral valve pulse waved Doppler – peak late
diastolic wave velocity Ao Aorta AR Aortic regurgitation AS Apical septum AT Acceleration time AV Aortic valve BA Basal anterior BAL Basal anterolateral BAS Basal anteroseptum BI Basal inferior BIL Basal inferolateral BIS Basal inferoseptum BP Blood pressure BPM Beats per minute BSA Body surface area BSE British Society of Echocardiography CFD Colour flow Doppler cm Centimetre cm/s Centimetres per second CO Cardiac output CS Coronary sinus CWD Continuous wave Doppler DR Dynamic range DT Deceleration time E Mitral valve pulse waved Doppler – peak early
diastolic wave velocity e′ Mitral valve tissue Doppler – peak early diastolic
wave velocity ECG Electrocardiogram Emax Peak velocity in early diastole f/s or FPS Frames per second FAC Fractional area change FEEL Focused Echocardiography in Emergency Life
support FICE Focused Intensive Care Echocardiography FR Frame-rate GLS Global longitudinal strain HF Heart failure HR Heart rate HV Hepatic vein IAS Inter atrial septum IVC Inferior vena cava IVSd Interventricular septum diameter end diastole LA Left atrium LAA Left atrial appendage LUPV Left upper pulmonary vein LV Left ventricle LVEDd Left ventricular end diastolic diameter LVEF Left ventricular ejection fraction
LVESd Left ventricular end-systolic diameter LVOT Left ventricular outflow tract LVPWd Left ventricular posterior wall diameter end diastole MA Mid anterior MAPSE Mitral annular plane systolic excursion MAS Mid anteroseptum MI Mid inferior MIL Mid inferolateral MM M-mode MPAP Mean pulmonary artery pressure MR Mitral regurgitation ms Milliseconds MS Mitral stenosis MV Mitral valve NCC Non coronary cusp PA Pulmonary artery PAT Pulmonary acceleration time PFO Patent foramen ovale PHT Pressure half time PLAX Parasternal long axis PR Pulmonary regurgitation PSAX Parasternal short axis PulV Pulmonary vein PulV Ar dur
Duration of flow reversal within the pulmonary vein during atrial systole (ms)
PulV Ar-A dur
Duration of transmitral A wave substracted from Pulv Ar duration (ms)
PulV D Peak pulmonary vein velocity in early LV diastole (after T wave)
PulV S Peak pulmonary vein velocity in early LV systole (after QRS)
PV Pulmonary valve PWD Pulsed wave Doppler RA Right atrium RAA Right atrial area RCC Right coronary cusp ROI Region of interest RPA Right pulmonary artery RUPV Right upper pulmonary vein RV Right ventricle RVD1 Basal RV diameter RVD2 Mid RV diameter RVD3 RV length RVOT Right ventricular outflow tract RVOT1 Proximal right ventricular outflow tract RWM Regional wall motion S′ Tissue Doppler peak systolic velocity STJ Sinotubular junction SoV Sinus of Valsalva SV Stroke volume TAPSE Tricuspid annular plane systolic excursion TDI Tissue Doppler imaging TGC Time-Gain compensation TRVmax Tricuspid regurgitation peak velocity TTE Transthoracic echocardiogram TV Tricuspid valve Vmax Peak velocity Vmean Mean velocity VP Propagation velocity VSD Ventricular septal defect VTI Velocity time integral
Appendix 2
This work is licensed under a Creative Commons Attribution-NonCommercial-NoDerivatives 4.0 International License.
https://doi.org/10.1530/ERP-20-0026https://erp.bioscientifica.com © 2021 The British Society of Echocardiography
Published by Bioscientifica Ltd
Downloaded from Bioscientifica.com at 01/02/2022 06:54:32AMvia free access

S Robinson et al. Minimum dataset for transthoracic echo
G927:4
Declaration of interestThe authors declare that there is no conflict of interest that could be perceived as prejudicing the impartiality of this guideline.
FundingThis work did not receive any specific grant from any funding agency in the public, commercial or not-for-profit sector.
AcknowledgementsAndrew Martin BSc, Laura Money BSc and Kerry Ladds BSc (North West Anglia NHS Foundation Trust) are recognised for their contributions in the development of this guideline and for providing images used within.
References 1 Dave JK, McDonald ME, Mehrotra P, Kohut AR, Eisenbrey JR &
Forsberg F. Recent technological advances in cardiac ultrasound imaging. Ultrasonics 2018 84 329–340. (https://doi.org/10.1016/j.ultras.2017.11.013)
2 Weigers SE, Ryan T, Arrighi JA, Brown SM, Canaday B, Damp JB, Diaz-Gomez JL, Figueredo VM, Garcia MJ, Gillam LD, et al. ACC/AHA/ASE advanced training statement on echocardiography (revision of the 2003 ACC/AHA Clinic Competence Statement on Echocardiography). Journal of the American College of Cardiology 2019 74 377–402. (https://doi.org/10.1016/j.jacc.2019.02.003)
3 Mitchell C, Rahko PS, Blauwet LA, Canaday B, Finstuen JA, Foster MC, Horton K, Ognyankin KO, Palma RA & Velazquez EJ. Guidelines for performing a comprehensive transthoracic echocardiographic examination in adults: recommendations from the American Society of Echocardiography. Journal of the American Society of Echocardiography 2019 32 1–64. (https://doi.org/10.1016/j.echo.2018.06.004)
4 Galderisi M, Cosyns B, Edvardsen T, Cardim N, Delgado V, Di Salvo G, Donal E, Elif Sade L, Ernande L, Garbi M, et al. Standardization of adult transthoracic echocardiography reporting agreement with recent chamber quantification, diastolic function, and heart valve disease recommendations: expert consensus document of the European Association of Cardiovascular Imaging. European Heart Journal: Cardiovascular Imaging 2017 18 1301–1310.
5 Price S, Uddin S & Quinn T. Echocardiography in cardiac arrest. Current Opinion in Critical Care 2010 16 211–215. (https://doi.org/10.1097/MCC.0b013e3283399d4c)
6 Intensive Care Society. Focused intensive care echo. (available at: http://www.ics.ac.uk/ICS/fice.aspx). Accessed on 28th January 2020.
7 British Society of Echocardiography. Level 1 accreditation. (available at: https://www.bsecho.org/Public/Accreditation/Personal-accreditation/Level-1/Public/Accreditation/Accreditation-subpages/Personal-accreditation-subpages/Level-1-accreditation.aspx?hkey=6099b4b8-5cb9-4425-a201-1874aadcb73f). Accessed on 28th January 2020.
8 Pallotta OJ & Roberts A. Musculoskeletal Pain and Injury in sonographers, causes and solutions. Sonography 2017 4 5–12. (https://doi.org/10.1002/sono.12093)
9 British Society of Echocardiography. Departmental accreditation. (available at: https://www.bsecho.org/Public/Accreditation/Departmental-accreditation/Public/Accreditation/Accreditation-subpages/Departmental-accreditation.aspx?hkey=a61c9cf9-c639-49cd-abcd-cee2185f1246). Accessed on 28th January 2020.
10 Kou S, Caballero L, Dulgheru R, Voilliot D, De Sousa C, Kacharava G, Athanassopoulos GD, Barone D, Baroni M, Cardim, et al. Echocardiographic reference ranges for normal cardiac chamber size: results from the NORRE study. European Heart Journal: Cardiovascular Imaging 2014 15 680–690. (https://doi.org/10.1093/ehjci/jet284)
11 Harkness A, Ring L, Augustine D, Oxborough D, Robinson S, Sharma V & Stout M. Normal reference intervals for cardiac dimensions and function for use in echocardiographic practice: a guideline from the British Society of Echocardiography. Echo Research and Practice 2020 7 G1–G18.
12 Ricci DR, Orlick AE, Alderman EL, Ingels NB, Daughters GT & Stinson EB. Influence of heart rate on left ventricular ejection fraction in human beings. American Journal of Cardiology 1979 44 447–451. (https://doi.org/10.1016/0002-9149(79)90395-3)
13 Zagzebski JA. Essentials of Ultrasound Physics. St Louis, Missouri: Mosby, Inc., 1996.
14 Denault AY, Couture P, Vegas A, Buithieu J & Tardif JC. Transoesophageal Echocardiography: Multimedia Manual – A Perioperative Transdisciplinary Approach, 2nd ed. London: Informa Healthcare, 2011.
15 Perperidis A, McDicken N, McGillivray T & Anderson T. Elevational spatial compounding for enhancing image quality in echocardiography. Ultrasound 2016 24 74–85. (https://doi.org/10.1177/1742271X16632283)
16 Uppal T. Tissue harmonic imaging. Australasian Journal of Ultrasound in Medicine 2010 13 29–31. (https://doi.org/10.1002/j.2205-0140.2010.tb00155.x)
17 Feigenbaum H, Armstrong WF & Ryan T. Feigenbaum’s Echocardiography, 6th ed. Philadelphia: Lipincott Williams and Wilkins, 2005.
18 Mada RO, Lysyansky P, Daraban AM, Duchenne J & Voigt JU. How to define end-diastole and end-systole? Impact of timing on strain measurements. JACC: Cardiovascular Imaging 2015 8 148–157. (https://doi.org/10.1016/j.jcmg.2014.10.010)
19 Lang RM, Badano LP, Mor-Avi V, Afilalo J, Armstrong A, Ernande L, Flachskampf FA, Foster E, Goldstein SA, Kuznetsova T, et al. Recommendations for cardiac chamber quantification by echocardiography in adults: an update from the American Society of Echocardiography and the European Association of Cardiovascular Imaging. European Heart Journal: Cardiovascular Imaging 2015 16 233–270. (https://doi.org/10.1093/ehjci/jev014)
20 Voigt JU, Pedrizzetti G, Lysyansky P, Marwick TH, Houle H, Baumann R, Pedri S, Ito Y, Abe Y, Metz S, et al. Definitions for a common standard for 2D speckle tracking echocardiography: consensus document of the EACVI/ASE/Industry Task Force to standardize deformation imaging. European Heart Journal: Cardiovascular Imaging 2015 16 1–11. (https://doi.org/10.1093/ehjci/jeu184)
21 Lyon AR, Dent S, Stanway S, Earl H, Brezden-Masley C, Cohen-Solal A, Tocchetti CG, Moslehi JJ, Groarke JD, Bergler-Klein J, et al. Baseline cardiovascular risk assessment in cancer patients scheduled to receive cardiotoxic cancer therapies: a position statement and new risk assessment tools from the Cardio-Oncology Study Group of the Heart Failure Association of the European society of Cardiology in collaboration with the International Cardio-Oncology Society. European Journal of Heart Failure/Early View 2020 21 1945–1960. (https://doi.org/10.1002/ejhf.1920)
22 Plana JC, Galderisi M, Barac A, Ewer MS, Ky B, Scherrer-Crosbie M, Ganame J, Sebag IA, Agler DA, Badano LP, et al. Expert consensus for multimodality imaging evaluation of adult patients during and after cancer therapy: a report from the American Society of Echocardiography and the European Association of Cardiovascular Imaging. European Heart Journal Cardiovascular Imaging 2014 15 1063–1093. (https://doi.org/10.1093/ehjci/jeu192)
23 Kotecha D & Piccini JP. Atrial fibrillation in heart failure: what should we do? European Heart Journal 2015 36 3250–3257. (https://doi.org/10.1093/eurheartj/ehv513)
This work is licensed under a Creative Commons Attribution-NonCommercial-NoDerivatives 4.0 International License.
https://doi.org/10.1530/ERP-20-0026https://erp.bioscientifica.com © 2021 The British Society of Echocardiography
Published by Bioscientifica Ltd
Downloaded from Bioscientifica.com at 01/02/2022 06:54:32AMvia free access

S Robinson et al. Minimum dataset for transthoracic echo
G937:4
24 Baumgartner H, Falk V, Bax JJ, De Bonis M, Hamm C, Holm PJ, Iung B, Lancellotti P, Lansac E, Rodriguez Munoz D, et al. 2017 SC/EACTS Guidelines for the management of valvular heart disease: the Task Force for the Management of Valvular Heart Disease of the European Society of Cardiology (ESC) and the European Association for Cardio-Thoracic Surgery (EACTS). European Heart Journal 2017 38 2739–2791. (https://doi.org/10.1093/eurheartj/ehx391)
25 Wharton G, Steed R, Allen J, Phillips H, Jones R, Kanagala P, Lloyd G, Masani N, Mathew T, Oxborough D, et al. A minimum dataset for a standard adult transthoracic echocardiogram: a guideline protocol from the British Society of Echocardiography. Echo Research and Practice 2015 2 G9–G24. (https://doi.org/10.1530/ERP-14-0079)
26 Kotecha D, Mohamed M, Shantsila E, Popescu BA & Steeds RP. Is echocardiography valid and reproducible in patients with atrial fibrillation? A systematic review. Europace 2017 19 1427–1438. (https://doi.org/10.1093/europace/eux027)
27 Mathew T, Steeds R, Jones R, Kanagala P, Lloyd G, Knight D, O’Gallagher K, Oxborough D, Rana B, Ring L, et al. A guideline protocol for the echocardiographic assessment of diastolic dysfunction. (available at: https://www.bsecho.org/common/Uploaded%20files/Education/Protocols%20and%20guidelines/Diastolic%20dysfunction.pdf). Accessed on 01 September 2020.
28 Galderisi M, Cosyns B, Edvardsen T, Cardim N, Delgado V, Di Salvo G, Donal E, Elif Sade LE, Ernande L, Garbi M, et al. Standardization of adult transthoracic echocardiography reporting in agreement with recent chamber quantification, diastolic function, and heart valve disease recommendations: an expert consensus document of the European Association of Cardiovascular Imaging. European Heart Journal: Cardiovascular Imaging 2017 18 1301–1310. (https://doi.org/10.1093/ehjci/jex244)
29 British Society of Echocardiography chaperone policy. (available at: https://www.bsecho.org/common/Uploaded%20files/Education/Protocols%20and%20guidelines/Chaperones%20and%20echocardiography.pdf). Accessed on 23rd June 2020.
30 Marwick TH. Techniques for comprehensive two dimensional echocardiographic assessment of left ventricular systolic function. Heart 2003 89 (Supplement 3) iii2–iii8. (https://doi.org/10.1136/heart.89.suppl_3.iii2)
31 Marwick TH. Ejection fraction pros and cons: JACC state-of-the-art review. Journal of the American College of Cardiology 2018 72 2360–2379. (https://doi.org/10.1016/j.jacc.2018.08.2162)
32 Zaidi A, Knight DS, Augustine DX, Harkness A, Oxborough D, Pearce K, Ring L, Robinson S, Stout M, Willis J, et al. Echocardiographic assessment of the right heart in adults: a guideline protocol from the British Society of Echocardiography. Echo Research and Practice 2020 7 G19–G41. (https://doi.org/10.1530/ERP-19-0051)
33 Rana B & Robinson S. ‘Transthoracic anatomy and pathology: valves’in Leeson. In Oxford Specialist Handbooks in Cardiology:
Echcardiography, 3rd ed. Eds P Monteiro, C Augustin, D Becher. Oxford University Press, 2020.
34 Baumgartner H, Hung J, Bermejo J, Chambers JB, Edvardsen T, Goldstein S, Lancellotti P, LeFevre M, Miller F & Otto CM. Recommendations on the echocardiographic assessment of aortic valve stenosis: a focused update from the European Association of Cardiovascular Imaging and the American Society of Echocardiography. Journal of the American Society of Echocardiography 2017 30 372–392. (https://doi.org/10.1016/j.echo.2017.02.009)
35 Augustine DX, Coates-Bradshaw LD, Willis J, Harkness A, Ring L, Grapsa J, Coghlan G, Kaye N, Oxborough D, Robinson S, et al. Echocardiographic assessment of pulmonary hypertension: a guideline protocol from the British Society of Echocardiography. Echo Research and Practice 2018 5 G11–G24. (https://doi.org/10.1530/ERP-17-0071)
36 Otto C. The Practice of Clinical Echocardiography, 4th ed. Philadelphia: Elsevier Saunders, 2012.
37 Steed RP, Wheeler R, Bhattacharyya S, Reiken J, Nihoyannopoulos P, Senior R, Monaghan MJ & Sharma V. Stress echocardiography in coronary artery disease: a practical guideline Rom the British Society of Echocardiography. Echo Research and Practice 2019 6 G17–G33. (https://doi.org/10.1530/ERP-18-0068)
38 Voigt J-U, Pedrizzetti G, Lysyansky P, Marwick TH, Houle H, Baumann R, Pedri S, Ito Y, Abe Y, Metz S, et al. Definitions for a common standard for 2D speckle tracking echocardiography: consensus document of the EACVI/ASE/Industry Task Force to standardise deformation imaging. European Heart Journal: Cardiovascular Imaging 2015 16 1–11. (https://doi.org/10.1093/ehjci/jeu184)
39 Huang X, Huang Y, Huang T, Huang W & Huang Z. Individual pulmonary vein imaging by transthoracic echocardiography: an inadequate traditional interpretation. European Journal of Echocardiography 2008 9 655–660. (https://doi.org/10.1093/ejechocard/jen032)
40 Rudski LG, Lai WW, Afilalo J, Hua L, Handschumacher MD, Chandrasekaran K, Solomon SD, Louie EK & Schiller NB. Guidelines for the echocardiographic assessment of the right heart in adults: a report from the American Society of Echocardiography endorsed by the European Association of Echocardiography, a registered branch of the European Society of Cardiology, and the Canadian Society of Echocardiography. Journal of the American Society of Echocardiography 2010 23 685–713; quiz 86–88.
41 Tamborini G, Muratori M, Brusoni D, Celeste F, Maffessanti F, Caiani EG, Alamanni F & Pepi M. Is right ventricular systolic function reduced after cardiac surgery? A two- and three-dimensional echocardiographic study. European Journal of Echocardiography 2009 10 630–634. (https://doi.org/10.1093/ejechocard/jep015)
Received in final form 4 September 2020Accepted 20 October 2020Accepted Manuscript published online 20 October 2020
This work is licensed under a Creative Commons Attribution-NonCommercial-NoDerivatives 4.0 International License.
https://doi.org/10.1530/ERP-20-0026https://erp.bioscientifica.com © 2021 The British Society of Echocardiography
Published by Bioscientifica Ltd
Downloaded from Bioscientifica.com at 01/02/2022 06:54:32AMvia free access