
A Practical Guide to High Performance Liquid Chromatography
76
A Practical Guide to High Performance Liquid Chromatography The life science business of Merck operates as MilliporeSigma in the U.S. and Canada.
Transcript of A Practical Guide to High Performance Liquid Chromatography

A Practical Guide to
High Performance Liquid Chromatography
The life science business of Merck operates as MilliporeSigma in the U.S. and Canada.

Table of Contents
1. THEORY OF LIQUID CHROMATOGRAPHY 1
Quantification experiments in analytical HPLC 4
2. SYSTEM SETUP AND SETTINGS 6
Dwell volume and dead volume 6
Detector response time 7
Sample injection, mass, and volume overload 8
Thermostatting 10
System care and maintenance 11
3. METHOD DEVELOPMENT & OPTIMIZATION 13
Selection of the HPLC method and system 13
Method goals 13Common mistakes in analytical method development 13Getting started 13
Sample Preparation 14
Overview of Techniques 14
Selection of initial conditions 23
Mode of separation 23
Choose the right HPLC column 24
The column backbone 24Stationary phase selection 28Choosing the right column format 30
Mobile phase selection 32
Isocratic elution 32Gradient elution 32Gradient method development 32
Mobile phase preparation 33
Filtration tools for preparing HPLC/UHPLC buffers and mobile phases 33Solvent and additive purity 34Chemical compatibility 34
Mobile phase composition and temperature 35Mobile phase properties 35Mobile phase pH 36
Detector choice 37
Ultraviolet/Visible Absorbance (UV/Vis) 37Refractive index (RI) 37Fluorescence (FL) 37Evaporative light scattering (ELS) 38Electrochemical (EC) 38Mass spectrometer (MS) 38
General recommendations 40
Column hardware 40Installation of columns with PEEK end fittings 40Equilibrating the Column 41Column coupling 41Column lifetime, cleaning and regeneration 42Use with mass spectrometers—procedure to maintain low column bleeding 42Storage 43
System optimization 43
Method validation 44
Accuracy 44Precision 44Specificity 44Limits of detection and quantitation 44Linearity 44Robustness 44Analytical solution stability 45
Scaling of HPLC methods 45
Scaling from HPLC to UHPLC 45Adjusting the column length 45Scaling the flow rate 45Scaling the injection volume 45Adjusting gradient time 45
Scaling an HPLC method 46
Speeding up a scaled method 47
Ramipril and Related Substances—from HPLC to UHPLC 48Ramipril and Related Substances—from HPLC to UHPLC 49

4. CHROMATOGRAPHIC SEPARATION OF LARGE MOLECULES 50
Introduction 50
Size Exclusion Chromatography 50
Ion Exchange Chromatography 52
Hydrophilic Interaction Liquid Chromatography 53
Affinity Chromatography 53
Reversed-Phase Chromatography 54
References 55
5. TROUBLESHOOTING COMMON HPLC ISSUES 56
Introduction 56
Issue No. 1: No Peaks/Very Small Peaks 56Issue No. 2: No Flow 56Issue No. 3: No Pressure/Pressure Lower Than Usual 57Issue No. 4: Pressure Higher Than Usual 57Issue No. 5: Variable Retention Times 57Issue No. 6: Loss of Resolution 58Issue No. 7: Split Peaks 58Issue No. 8: Peaks Tail on Initial and Later Injections 59Issue No. 9: Tailing Peaks 59Issue No. 10: Fronting Peaks 60Issue No. 11: Rounded Peaks 60Issue No. 12: Baseline Drift 61Issue No. 13: Baseline Noise (regular) 61Issue No. 14: Baseline Noise (irregular) 61Issue No. 15: Broad Peaks 62Issue No. 16: Change in Peak Height (one or more peaks) 63Issue No. 17: Change in Selectivity 63Issue No. 18: Negative Peak(s) 64Issue No. 19: Ghost Peak 64
Common Column Restoration Procedures 65
Part 1: Bare Silica Columns 65Part 2a: Silica-Based Reversed Phase Columns Analyzing Water-Soluble Compounds 65Part 2b: Silica-Based Reversed Phase Columns Analyzing Water-Insoluble Compounds 65Part 3: Polar-Bonded Reversed Phase Columns (Amino, Cyano, Diol, Chiral) 65Part 4: Silica-Based Ion Exchange Columns 65
6. REFERENCE MATERIALS IN LC-MS/MS APPLICATIONS: CHALLENGES & SELECTION CONSIDERATIONS 66
Choosing the correct reference material quality grade for your needs 66
Who uses reference materials? 66Metrological traceability and SI Units of your reference materials 66ISO 17034 and quality grades of standards, reference materials, and certified reference materials 66What is measured in each grade of reference material? 67Understanding your reference material Certificate of Analysis 68Reference material formats: do you need a neat, solution, or matrix material? 69Choosing the correct reference material for your testing purpose 69Which quality grade is the best fit for purpose? 70
Best Practice for Preparation of Calibration Curves in Matrix 70
APPENDIX 71
Abbreviations 71
Links and Literature for Download 71

1
1. Theory of liquid chromatographyHigh performance liquid chromatography (HPLC) is a technique for separating analytes dissolved in a liquid, mobile phase by using their specific interaction with a stationary phase (chromatography column).
Depending on the type of interaction of the sample molecules with both mobile and stationary phases, different types of interactions can be possible in HPLC (in some cases borders are fluid):
• Adsorption chromatography: retention of analytes by reversible binding on a stationary phase (e.g., normal phase; for example allows for the separation of isomers by specific adsorption).
• Partition chromatography: retention by reversible dissolution in a stationary (quasi-) liquid 3-dimensional layer; different solubility or different partition coeffi-cients of samples in liquid stationary and liquid mobile phase, e.g., in reversed phase (RP) LC, hydrophilic interaction liquid chromatography (HILIC).
• Ion exchange chromatography: retention by electrostatic interaction with the stationary phase.
• Affinity chromatography: retention comparable to adsorption chromatography; interaction of tailor-made stationary phases with biomolecules (lock and key principle).
• Size exclusion chromatography: retention by permeation into the pores of a stationary phase and steric exclusion of analytes (e.g., gel permeation chromatography, gel chromatography, gel filtration).
The following information is generated during a chro-matographic run (Figure 1):
• Back pressure p (bar or psi) is determined during the analysis for the HPLC utilized and is a combination of pressures generated by the column and the system.
• Dead time or hold-up time t0 (s) of a compound not being retained under the given chromatographic conditions (i.e. a compound that is not interacting with the stationary phase). Often also referred to as tm. t0 can also be calculated from the volume vempty of a column, the porosity ε of the stationary phase and the volumetric flow rate F (mL/min, see also description below): t0 = vempty ε/F For totally porous particles, ε is typically in the range of 0.7–0.8. In turn, the (unknown) porosity of a chromatographic column can be calculated by multiplying F and t0.
The volume of connecting tubing has to be taken into account as well, especially if the volume of the analytical column used is comparably small (e.g., capillary columns with a typical i.d. of 50 to 200 µm).
• Retention time tR (s) of an analyte is the time elapsed between the injection and detection of an analyte.
The column length L (mm) is predefined by the user; together with the three parameters described above, the following information can be calculated:
• The correlation between column back pressure and the particle size of a particulate column can be calculated from:
Δp = η F L
K0 π r2 dp2
Δp change in pressure (bar)
η eluent viscosity (units?)
F flow rate (mL/min)
K0 column permeability (units?)
r column radius (mm)
dp particle diameter (µm)
• Linear velocity or linear flow rate u (mm/s): u = L/t0 In contrast to the linear velocity u, the unit of flow rate F is “mL/min”. The flow rate set for the HPLC instrument can be converted to u with the following equation:
u = 4 F
dC2 π εT
dC column diameter (mm)
εT total porosity
tR1
t0
tR2tR3
t’R1
t’R2
t’R3time
inte
nsity
Figure 1. Schematic drawing of a chromatogram displaying the isocratic separation of three analytes.

2
• Net retention time or reduced retention time t’R: t’R = tr – t0
• Capacity factor or retention factor k is calculated for every analyte utilizing the respective retention time and the dead time of the separation: k = (tR – t0)/t0
• Selectivity coefficient or separation factor α describes the quality of a separation of two compounds A and B: α = kB/kA The selectivity of a chromatographic column is dictated by the physical properties of the eluent and the sta- tionary phase (modified or unmodified).
• Plate count N is calculated from: N = 16 (tR/w)2 (US Pharmacopoeia—USP—figure 2) and describes the performance of a column in isocratic mode. It is given as an absolute value (with respect to a specific column dimension) or per meter of a column (unit: m-1). Alternatively N can be calculated from: N = 5.54 (tR/w1/2)2 (Figure 2) The base line width w, and the peak width at half height w1/2 are determined by the software utilized. The plate count depends on column length, geometric properties of the stationary phase (particle size dis- tribution or monolithic skeleton diameter distribution), column packing parameters, eluent flow rate and proper setup of the system used (avoidance of dead volume, see also chapter 2). As a rule of thumb, the plate count for a particle packed column is roughly equal to L/2dp (dp: particle diameter). This means that the plate count can be increased by increasing the length of a column, or decreasing the particle diameter.
• Plate height H (μm) corresponds to the quotient of L (in µm) and N (L is the length of the column utilized for the determination of N).
• Chromatographic resolution R can be calculated from: R = 2 [(tB – tA)/(WA + WB)] It is a measure of the quality of a separation of two analytes A and B (baseline separation has been achieved when R ≥ 1.4). Classical HPLC columns (particle diameter 5 μm) are normally used at rather high flow rates and above the minimum of their van Deemter plot (see details below). As a result of this, the resolution of such a setup can be improved by a decreased flow rate (increase of tr). By contrast, UHPLC (Ultra High Performance Liquid Chromatography) columns (particle diameter less than 2 μm) are operated at comparably low flow rates, and at the minimum of of their van Deemter plot. In this case, an increase of flow rate will improve resolution.
• Peak symmetry is described by the symmetry factor or tailing factor AS (or Tusp) and is utilized by USP (USP chapter 621, see Figure 3): As = (A + B)/2A or As = 0.5 (1 + B/A) A and B are determined at 5% of the peak height. Alternatively the peak shape can be described by the asymmetry factor calculated from the ratio of B and A. In this case B and A are determined at 10% of the peak height. For symmetrical peaks, the symmetry or asymmetry factor is equal to 1. Peak tailing is observed when the factor is >1, whereas peak fronting will be visible when the factor is <1.
baseline
tR
h
w
w1/2
tangent line
Figure 2. Schematic drawing of data acquired for the calculation of plate count N.
Figure 3. Schematic drawing of data acquired for the calculation of peak symmetry AS. A and B are determined at 5% of the peak height h.
baselinetR
h
BA0.05 h

3
The shape of a chromatographic peak is ideally narrow and symmetric, but in a real system, peak broadening (and peak asymmetry) can be caused by the column, or from the tubing and connectors. The following phenomena are responsible for this type of peak deterioration (Figure 4):
• Eddy diffusion (A term): Mixing of the sample with surrounding mobile phase; peak broadening by different analyte flow paths/path lengths through the column bed. Eddy diffusion is nearly independent from the flow rate and is influenced by particle size and size distribution, as well as by the homogeneity of the column packing.
• Longitudinal (axial) diffusion (B term) along both column axis and sample concentration gradient. This effect is rather weak and only strong at low (and therefore impractical) flow rates of the mobile phase.
• Mass transfer (C term) between stationary and mobile phase caused by repeated interaction of sample mole-cules with the stationary phase. The strength of this effect is proportional to the flow rate of the mobile phase.
Eddy diffusion is determined by the particle size distri-bution (PSD) or monolithic skeleton and the domain size for monolithic materials (sum of pore size and particle or skeleton diameter). The smaller the particle/skeleton and domain size and the more homogenous the particle/skeleton size distribution in a homogenous column bed, the smaller the resulting effect of the A term on peak broadening.
The contribution of axial diffusion to peak broadening is influenced by the viscosity of the mobile phase and the time of analysis.
Peak broadening caused by mass transfer increases with increasing flow rate, larger particle size (larger depth of pores) and increased viscosity of the mobile phase (decreased velocity of diffusion).
The correlation between flow rate, plate height and the three terms A, B, and C is described by the van Deemter plot (Figure 5) and the following equation:
H = A + B/u + C*u
H Height equivalent to theoretical plate (column length/efficiency)
A Eddy diffusion
B Longitudinal diffusion
C Resistance to Mass Transfer
u Mobile phase linear velocity
Ideally, the van Deemter plot displays a rather flat course at overall low plate heights H—corresponding to a large plate count over a wide range of flow rates. Each chromatographic column possesses its own characteristic plot, with the minimum of the plot (highest plate count N or lowest plate height H at a characteristic flow rate) describing the optimum performance of the column (Figure 6). Please note, that for a given column, the van Deemter plot becomes flatter with increasing capacity factor k of an analyte. Due to this, the comparison of van Deemter plots of different HPLC columns only makes sense when prepared utilizing samples with comparable capacity factors.
Figure 4. Influence of mass transfer (top) and eddy diffusion (bottom) on peak broadening when utilizing fully porous particles.
van Deemter plot
plat
e he
ight
H
mass transfer
eddy diffusion
axial diffusion
linear flow rate u
Figure 5. Schematic drawing of a van Deemter plot resulting from the contributions of eddy diffusion, axial/longitudinal diffusion and mass transfer to column-related peak broadening.
25
20
15
10
5
00 1 2
Linear flow rate u (mm/s)
Pla
te h
eight
H (
µm
)
3 4 5 6
Figure 6. Van Deemter plots for Purospher™ STAR RP-18 endcapped 10 cm x 2.1 mm I.D. columns (top: 3 μm particle size, bottom: 2 μm) using anthracene as an analyte. Chromatographic conditions: Detection: UV (254 nm); mobile phase: acetonitrile/water 75/25 (v/v); sample: anthracene. The capacity factor is 4.1 (3 μm particle size) and 4.5 (2 μm particle size), respectively.

4
Figure 7: Influence of Flow rate on resolution.
1 23
4
5
1.0 2.0 3.0 4.0 5.0 6.0 7.0
1
2
1.0 2.0 3.0 4.0 5.0 6.0 7.0
1.0 2.0 3.0 4.0 5.0 6.0 7.0
2 mL/min
3 mL/min
4 mL/min
1 mL/min
Columns:
Mobile Phase:
Det.:
Discovery™ C18, 5.0 cm x 4.6 mm, 5 µm particlesCH3OH:H2O (45:55)Temp.: 25 °CUV, 214 nm
1. Barbital2. Phenobarbital3. Butabarbital4. Mephobarbital5. Pentabarbital6. Secobarbital
Time (min)
In practice, a high flow rate speeds up separations signifi-cantly, but can result in loss of resolution as demonstrated with a 5 µm particulate column in Figure 7.
In Figure 8, the detailed view shows a significant loss of resolution at a flow rate of 4 mL/min in comparison to a flow rate of 1 mL/min using the same HPLC column (Discovery® C18 5 µm, 50 x 4.6 mm)
Smaller particles show a very flat Van Deemter plot, which makes them better suitable for fast separations using UHPLC.
In addition to column-related peak broadening, wider peaks can also be caused by effects attributed to the LC system used. These effects can be due to axial diffusion within the instrument, hydrodynamic flow profiles being inconsistent across the tubing cross section, or turbulences or mixing at corners, edges or in dead volumes.
Quantification experiments in analytical HPLCThe task of analytical HPLC is the chromatographic sepa-ration of analytes within a sample and their subsequent identification. Next to these qualification experiments, the quantification of compounds, for example in trace analysis, can be an additional challenge.
The aim of setting up a proper chromatographic system used in quantification experiments has to be a maximi- zation of the intensity of a target analyte peak and a minimization of background noise. The combination of both optimizes the sensitivity of a separation and hence increases the signal to noise ratio (S/N). The former can best be achieved by utilizing short columns with the smallest possible internal diameter (I.D.) (Table 1) in combination with high injection volumes and high flow rates in gradient mode. Of course, packing quality has to be maintained as consistently high and independent from column I.D.. At the same time, minimization of background noise can be ensured by using the purest solvents and reagents and using proper sample prepa-ration and handling. Table 1. Column I.D., typical flow rate and calculated relative sensitivity.
Column I.D. (mm)
Typical flow rate (µL/min)
Relative sensitivity
4.6 1000–6000 1
2.0 200–800 5.3
0.2 0.5–20 530
0.1 0.4–3 2100
0.05 0.1–0.8 8500
In qualitative analysis, the intensity of the smallest detectable analyte signal should be three times higher than the noise signal, while in quantitative analyses, the ratio should be approximately 10:1. In this context, the limit of quantification (LOQ) is referred to as the lowest amount of analyte allowing for a quantitative analysis with predefined accuracy (low deviation between “true” and detected value), and repeatability (repeated analysis on the same instrument, with the same settings and with a low standard deviation). See also the chapter on method development. The limit of detection (LOD) is calculated at 30% of LOQ. As an example, Figure 9 combines the chromatogram and the calibration curves from the separation of seven pesticides on a monolithic silica capillary column. LODs were obtained from a serial dilution of the analyte mixture.
Figure 8. Loss of Resolution Under Non-Optimal Flow Rate
1.0 2.0 3.0 4.0 5.0 6.0 7.0
1.04 mL/min
1 mL/min
Time (min)

5
4.9E+07
3.9E+07
2.9E+07
1.9E+07
9.0E+06
-1.0E+060 1 2 3 4 5 6 7 8 9
MS inte
nsi
ty
Retention time (minutes)
5.0E+06
4.0E+06
3.0E+06
2.0E+06
1.0E+06
0.0E+000 1
R2 = 0.9991
Peak
are
a (M
S)
Injected mass (pg)2 3 4 5 6 7
5.0E+06
4.0E+06
3.0E+06
2.0E+06
1.0E+06
0.0E+000 1
R2 = 0.9990
Peak
are
a (M
S)
Injected mass (pg)2 3 4 5 6 7
Figure 9. LC-MS base peak chromatogram displaying the separation of a stock solution of seven pesticides on a monolithic silica capillary column (top). Bottom: Calibration curves for both metamitron (peak 1, open circles, left) and metolachlor (peak 7, closed triangles, right). The insets show the complete concentration range covered (including the non-linear region typical for ion trap overload) while the large diagrams display the linear regions of the curves. The limits of detection for the setup utilized are 0.24 pg (0.16 ng/μL) for metamitron and 0.59 pg (0.40 ng/μL) for metolachlor.Chromatographic conditions: Chromolith® CapRod® RP-18 endcapped 15 cm x 0.1 mm I.D. monolithic silica capillary column. Base peak chromatogram (m/z 200–290). Mobile phase A: water + 0.1% formic acid, mobile phase B: acetonitrile + 0.1% formic acid; gradient: 20% B to 80% B in 10 minutes.

6
2. System setup and settingsEvery single HPLC system has its own characteristics, and these can change over time—either due to wear of instrument parts, or by a variation of the setup by the operator. The following chapter describes important system parameters and their influence on chromatographic results and gives recommendations for system optimization.
Dwell volume and dead volumeThe dwell volume of an HPLC instrument is the combined volume of all system parts from the solvent mixer to the head of the column. Aside from the capillary connecting the outlet of the injector to the inlet of the column, this volume is usually typical for a given instrument. The pump unit of an HPLC system can be either a low or a high pressure gradient system. In case of the former, dosing is controlled by a valve, and the mixing of up to four solvents takes place on the low pressure side of one single pump. Due to this construction, the dwell volume of such a pump system is relatively large. In contrast, high-pressure gradient systems are composed out of two (or three) pumps and each pump is dedicated to one single solvent. Mixing is performed on the high-pressure side of the pump system and dosing of the solvents is controlled by the relative flow rates of each of the pumps. The dwell volume of high-pressure gradients is small, but due to the construction, these systems are comparably expensive. Modern UHPLC instruments (low or high-pressure gradient systems) display very small dwell volumes, a prerequisite when working at low flow rates.
Depending on the prerequisites of a separation, the design and length of the connecting tubing may change, e.g. when working at temperatures below or above room temperature, or when analyzing biomolecules. Under these conditions, the use of inert polyetheretherketone (PEEK) rather than of stainless steel tubing is recommended.
In gradient separations, large dwell volumes are undesir-able as they smooth and delay a gradient and cause increased equilibration times, but as a consequence, isocratic separations are not negatively affected by the size of the dwell volume. Under very specific conditions such as a large contribution of all system parts from the injector to the column head to the dwell volume, in com- bination with low flow rates, peak broadening might be observed. For this reason, the dwell volume of modern UHPLC systems for operation at low flow rates is particu- larly low. The dwell volume of low-pressure gradient systems is larger in comparison to high pressure gradient systems. For the determination of the dwell volume or dwell time of an HPLC system, the chromatographic column is replaced by a capillary with low I.D. providing sufficient and realistic back pressure. Water and water/acetone 99.5/0.5 (v/v) are used as mobile phases A and B and a steep gradient is run using UV detection (254 nm). The dwell time can be directly read out as the delay between the time of gradient start and the time of half-maximum signal intensity 1/2 hmax (Figure 10). The dwell volume can be calculated from the dwell time and flow rate.
In contrast to the dwell volume, all volumes from injector to the detector cell—except for the column itself—are called dead volume. This includes the volumes of all capillary connections between the injector, column and detector cell, as well as of the cell itself and fittings. The dead volume of a setup has to be kept as small as possible in order to avoid peak broadening, peak tailing and a decreased separation performance (see also definition of dead time in chapter 1). Both isocratic, and gradient separations are negatively affected by large dead volumes. Connectors and detector cells with low volume should therefore be used; in addition, short tubing with low I.D. is mandatory. When transferring methods from one HPLC system to another, both the dwell and dead volumes have to be taken into account. Figure 11 shows the influence of column installation on the chromatographic result. A gradient run was applied in a separation of a tryptic digest of cytochrome C. Due to setup restraints in the laboratory, a capillary with a length of approximately 0.8 m and an i.d. of 50 μm was utilized to connect the HPLC injector with the MS source. The chromatography column was connected either to the outlet of the injector, or to the inlet of the mass spectrometer to demonstrate the difference.
Figure 10. Determination of the dwell time or dwell volume of an HPLC system.
dwell time
Inte
nsity
Change from solvent A to B
1/2 hmax
retention time
0 1 2 3 4 5Retention time (minutes)
6 7 8 9 10 11 12
Figure 11. Influence of column installation on chromatographic performance. The monolithic silica capillary column was connected either to the outlet of the injector (top), or to the inlet of the mass spectrometer (bottom). For connection, a 50 μm i.d. silica capillary was utilized.Chromatographic conditions: Chromolith® CapRod® RP-18 endcapped 15 cm x 0.1 mm I.D. HPLC column; injection 1 µL; detection nano-ESI-spray pos. (m/z 300–750); flow rate 3.5 µL/min; mobile phase (v/v): A: water + 0.1 % formic acid, B: acetonitrile + 0.1 % formic acid; gradient: 5% to 25% B in 7 min, 25% to 70% in 3 min; temperature 25 °C; sample: lyophilized cytochrome C digest resuspended in acetonitrile/water 5/95.

7
The internal diameter of the connecting tubing that can be used in a chromatographic setup depends on column properties (e.g. back pressure issues), chromatographic conditions applied (eluent viscosity, flow rate, temper- ature), as well as the desired performance and resolution. It also must be bigger when matrix rich samples are injected (at least between injector and column). In general, the smallest possible tubing i.d. should be used in order to gain the highest column efficiency. For nano and capillary-LC (column i.d. 50–500 μm) a tubing i.d. of 0.064 mm should be chosen, whereas in micro, narrow-bore, and conventional analytical LC (column I.D. 1–4.6 mm) a tubing i.d. of 0.13 mm is recommended. In addition, a detector with a micro flow cell is suggested (check pressure tolerance of the detector cell). Larger detector cells can be used, but peak widths will be wider (or the intensity will be lower; see Figure 12 and Table 2). In the given examples, a change from an analytical to a micro detector cell leads to an increase in performance of 20–25%.
Detector response timeMost HPLC detectors have a variable response time or time constant. If the response time is too slow (the time constant is then too long, e.g., 2 seconds), peaks may appear broad and show tailing. For narrow peak widths, good integration of the peak area, and good optical presentation of the chromatogram, the data system settings must enable approximately 20 data points to be acquired during the peak width time. Therefore columns require a fast detector time constant, such as 0.01 seconds (100 Hz, i.e. 100 data points per second, which means 1 data measurement in 10 milliseconds). As a rule of thumb, the time constant should be set to 1/10 of the peak width. Always choose the lowest response time possible. By reducing the time constant from 2 to 0.1 seconds, the plate count can be improved significantly (Figure 13). Keep in mind that a decreased time constant improves peak shape and column performance, but that at the same time the baseline noise is increased (because of less signal averaging). This plays a role when performing quantitative analyses, and when high sensitivity is important. Under these prerequisites, there will be a tradeoff between high peak intensity and low baseline noise,and the settings have to be adapted accordingly.
Figure 12. Influence of UV detector cell volume and column type on the peak intensity and peak width. 1.4 μL UV micro cell (green line), 11 μL UV analytical cell (yellow line). Top: Purospher™ STAR RP-18 endcapped (3 µm) Hibar® HR 5 cm x 2.1 mm I.D., bottom: Purospher™ STAR RP-18 endcapped (3 µm) LiChroCART® HR 5.5 cm x 2.0 mm I.D.. Chromatographic conditions: Mobile phase: acetonitrile/water 70/30 (v/v), flow rate: 0.21 mL/min, detection 254 nm, injection 0.2 µL, sample (in order of elution): uracil 12 mg/L, ethylbenzene 839 mg/L, propylbenzene 922 mg/L, butylbenzene 1006 mg/L.
0
50
40
30
20
10
01 2 3 4 5 6
Inte
nsi
ty (
mA
U)
Retention time (minutes)
0
50
40
30
20
10
01 2 3 4 5 6
Inte
nsi
ty (
mA
U)
Retention time (minutes)
Table 2. Change of chromatographic parameters when switching from an 11 μL to a 1.4 μL UV cell (example: butylbenzene peak).
ColumnCell volume/μL Tusp
Plate count/m
Plate count/%
Purospher™ STAR RP-18e (3 µm) Hibar® HR 5 cm x 2.1 mm I.D.
1.4 1.15 43.000 119
11 1.29 36.000 100
Purospher™ STAR RP-18e (3 µm) LiChroCART® HR 5.5 cm x 2.0 mm I.D.
1.4 1.24 44.000 126
11 1.31 35.000 100
Figure 13. Setting the proper detector response time (top: 2 s, bottom: 0.1 s) in fast separations.Chromatographic conditions: Chromolith Performance RP-18 endcapped 10 cm x 4.6 mm I.D. HPLC column, mobile phase: acetonitrile/water 40/60 (v/v), flow rate: 5.0 mL/min, injection volume 10 μL, detection 254 nm, cell: 11 μL, back pressure 55 bar, sample (in order of elution): uracil, pyridine, aniline, 4-ethylaniline, benzene.
50
40
30
20
10
0
0.0 0.4 0.8Retention time (min)
Inte
nsi
ty (
mV
)
1.2 1.6 2.0
300
250
200
150
100
50
0
0.0 0.4 0.8
Retention time (min)
Inte
nsi
ty (
mV
)
1.2 1.6 2.0

8
Sample injection, mass and volume overloadQuantitative analyses need a careful system setup, as an improper combination of injection needle and sample vial, as well as a high sample viscosity can cause false sample drawing. For example, a combination of a high draw speed and a highly viscous sample can cause sample underdosing, because filling of the injector needle with the sample solution can be somewhat slower in comparison to the draw speed of the dosing syringe. In this situation, the draw speed has to be decreased in order to enable proper sampling. A similar error can occur when the septum of the sample vial is completely airtight and large sample volumes (e.g., pharma samples) need to be taken. The use of split septa, specially designed needles or puncture offset tuning via the system software can be of help in this case.
Make sure that the autosampler syringe is free of any air bubbles in order to avoid any negative effects on the drawn sample volume. In order to avoid air bubbles, flush the syringe manually and always degas washing solution prior to use.
The stability of, e.g., a UV detector signal varies and is influenced by both temperature (temperature drift) and ageing of the UV lamp applied. Make sure the lamp is thermally equilibrated (stable baseline signal) prior to an analysis, and that standards are run directly before quantification experiments (in order of increasing concentration).
An increase of the volume or mass of a sample injected onto a column—or a decrease of column i.d. while main- taining the injection volume constant—has a positive influence on the sensitivity of an analysis. However, this approach is limited, as at a certain point both mass and/or volume overload can be observed in a chromatographic separation. Under these prerequisites, retention capacities and peak widths as well as resolution are no longer inde- pendent from the amount of sample injected. As a rule of thumb, when the injection volume does not exceed 1% of the total column volume the maximum separation effi- ciency of a column can be preserved. Table 3 combines typical flow rates and sample mass and volume amounts for the loading capacities of various column formats. Table 3. Guidelines for typical flow rates and sample mass and volume amounts for the loading capacities of analytical and semi-preparative columns.
Column Dimension (length x i.d. in mm)
Typical Flow Rates (mL/min)
Sample Amount(mg)
Sample Volume (μL)
150 x 1 0.06 ≈ 0.05 0.05–1
250 x 2 0.25 ≈ 0.2 0.2–10
250 x 3 0.6 ≈ 1 1–20
250 x 4 1 ≈ 5 5–80
250 x 10 6 ≈ 30 30–500
250 x 25 39 ≈ 200 200–3000
Mass overload effects depend on the sample complexity, solubility, and retentivity and are commonly observed when trace compounds are analyzed in complex mixtures. In this situation, a desirable increase in sensitivity is achieved by simply increasing the injection volume. Con- sequently, a mass overload with the main component is most likely. As long as the peak shape of trace compounds is not negatively affected and no overlap of the trace and main component peaks is observed, this phenomenon can be tolerated. A visible phenomenon of mass overload is the detection of triangular shaped peaks displaying tailing or fronting. In fact, the effect of mass overload on peak shape is influenced by the interaction between analyte, mobile phase, and stationary phase and is a direct result of the adsorption isotherm of a chromatographic system (analyte/mobile phase/stationary phase). The dependency of the sample concentration in the mobile phase on the sample concentration in the stationary phase is described by a Langmuir or anti-Langmuir isotherm, where peak tail- ing (Langmuir behavior) or peak fronting (anti-Langmuir) can be observed. Depending on the characteristics of the detector, mass overload can lead to a detector overload, resulting in flat-topped peaks. This can compromise the determination of plate count or resolution, for example. In such a situation the linear range of the detector can be increased (and an overload can be avoided) when the detection is not performed at the absorption maximum of an analyte.
Figure 14 displays a simulated, and rather weak, mass and volume overload experiment conducted by injecting identical volumes of caffeine at different concentrations onto a particle packed column.
tR tRFigure 14. Mass (left) and volume overload (right) effect, injection of caffeine samples. Injected mass of caffeine and volume of caffeine increasing from bottom to top chromatogram. For better comparability of peak shapes, the peak intensity was not normalized. Chromatographic conditions: Purospher™ STAR RP-18 endcapped (3 μm) Hibar® HR 10 cm x 4.6 mm I.D.; mobile phase: acetonitrile/water 90/10 (v/v); detection 300 nm; flow rate 1.0 mL/min; temperature: 25 °C mass overload: injection volume 5 μL (sample concentrations 0.2, 0.5, 1, 2, 5, 10, 20, and 50 μg/μL caffeine); volume overload: concentration 50 μg/μL caffeine (injection volume: 0.2, 0.5, 1, 2, 5, 10, 20, and 50 μL).

9
In contrast to mass overload, volume overload is observed when the sample concentration is kept constant but the injected sample volume is increased. Volume overload results in band broadening, flat-topped peaks, or peak splitting, and negatively affects resolution as well as plate count (see Figures 15 and 16). A second effect of volume overload is a decrease in separation efficiency. An additional visible phenomenon can be the so-called detector overload correlated to the detector properties. In Figure 15, such a detector overload can be observed for seven out of eight analytes (cropped peak tips).
One distinct difference between mass and volume overload is evident: In a mass overload experiment, plate count drops by one order of magnitude when increasing mass load by one order of magnitude, whereas in a volume overload experiment plate count drops by two orders of magnitude when increasing volume load by one order of magnitude. For this reason, it is recommended to work with concentrated sample solutions rather than with large volumes of a diluted sample. If injection of large sample volumes is necessary, it has to be made sure that the sample is dissolved in a weak solvent in order to achieve peak focusing on a chromatographic column.
The detection of traces of a previous sample injection in a chromatogram is referred to as sample carry-over. Carry-over can negatively affect quantitative and qualitative analyses, hence chromatographic columns should display a low carry-over tendency. When calibration curves are prepared running dilution series, lowest concentrated samples need to be analyzed first. System consumables (seals, needle) as well as system parts such as connecting capillaries, sample loops and especially the injection valve (stator and rotor seal) can be a source of sample carry-over. Although less likely, the chromatographic column itself can also be the cause of carry over. If carry-over persists after replacement of these components, check for the compatibility of both the autosampler wash solution composition and the sample properties. Other options to overcome a carry-over effect can be a change of column (selectivity), an adaption of the chromatographic method, the application of washing steps between chromatographic runs or a needle wash procedure. Biological samples (e.g., proteins, peptides) should be analyzed in biocompatible HPLC systems, in which all metal parts are replaced by inert polymeric components (e.g., made out of PEEK). Combining biological samples with standard HPLC systems will most likely cause sample carry-over. Figure 17 displays the sample carry-over in an analysis of UV filters in sun lotions on a particulate type HPLC column. After one UV filter analysis run, three blank runs were performed. A washing step is necessary in order to remove residual Tinosorb S (chromatogram peak 4) from the particle packed column after an overloading experiment. The sample carry over observed in the first blank run is caused by system parts between injector and column including stainless steel frits of the column itself.
Figure 15. Effect of volume overload on peak shape. From bottom to top: 10, 25, 50, and 100 μL injection volume. Chromatographic conditions: Purospher™ Star RP-18 endcapped (5 µm) Hibar® HR 15 cm x 4.6 mm I.D.; detection: 247 nm; temperature: 40 °C; flow rate: 1.3 mL/min; mobile phase A: water, mobile phase B: acetonitrile; gradient conditions: 0 min 45% B, 2.5 min 95% B; sample (in order of elution): acetanilide, acetophenone, propiophenone, butyrophenone, benzophenone, valerophenone, hexanophenone, heptanophenone.
Figure 16. Decrease in separation efficiency with increasing injection volume shown on a 50–4.6 mm HPLC column and an analyte with k = 1.6. Note that if 10% of the total column volume is injected, only about 20% of the column efficiency remains.Chromatographic conditions: SeQuant® ZIC®-HILIC (5 µm, 200 Å) PEEK 5 cm x 4.6 mm I.D.; detection: 254 nm; flow rate: 0.5 mL/min; mobile phase: Acetonitrile/ammonium acetate 5 mM 80/20 (v/v); sample: cytosine.
0 2 4 6 148 10 12Retention time (min)
0 50 100 150 200
100,000
80,000
60,000
40,000
20,000
0
Injection volume (µL)
10% of column volume1% of column volume
Effi
cien
cy (
N)
900
600
300
0
0 5 10 15 20 24
Retention time (minutes)
UV
inte
nsi
ty (
mV
)
Figure 17. Sample carry-over experiment as observed in a comparative analysis of UV filters in sun lotions on particle packed HPLC column. After a UV filter overload injection (top chromatogram, in green) three blank runs were completed (chromatograms two to four, from top to bottom).Chromatographic conditions: Purospher™ STAR RP-18 endcapped (3 μm) Hibar® HR 10 cm x 4.6 mm I.D.; mobile phase A: acetonitrile, B: water + 0.1% phosphoric acid; gradient: 0–9.6 min 67% A, 17.6 min 100% A, 20 min 100% A; detection: UV 312 nm; flow rate: 1.0 mL/min; temper- ature: ambient; injection volume: 100 μL; sample: 1 Eusolex OCR 144 µg/mL, 2 Eusolex 2292 127 µg/mL, 3 Eusolex 9020 160 µg/mL, 4 Tinosorb S 92 µg/mL.

10
ThermostattingThe influence of temperature on a chromatographic sepa- ration cannot be generalized and an increase of tempera- ture can, but does not necessarily lead to, an improve- ment of column performance, or a change of selectivity. Higher temperatures decrease the viscosity of the mobile phase, which can improve mass transfer and separation performance, but on the other hand, a loss in performance or undesired changes in selectivity are possible. Working at elevated temperatures also reduces analysis time, because an increased diffusion coefficient facilitates higher flow rates of the mobile phase. When working with highly viscous eluents, an increase in temperature might allow for a chromatographic run that is not possible under ambient room temperature conditions, as in the case of elevated back pressures, for example. Low flow rates, a reproducible and sufficient heat transfer from column oven to column, as well as a pre-column eluent heater are necessary for the successful implementation of temperature in chromatographic analysis.
Thermostatting HPLC column compartments can be either performed by an air bath (still or circulated air), or a block heater unit, the latter providing better and faster heat transfer. When combining columns with a block heater, the columns walls display a quasi-isothermal behavior, which means that the column wall temperature remains constant independent from the mobile phase temperature. In contrast, in still air thermostats, almost no heat exchange between air and column wall is observed; consequently, such a setup is referred to as quasi-adiabatic. In circulated air-water baths, heat exchange between column wall and air is possible, making this system a somewhat isothermal setup. Chromatography at elevated temperatures aims at maximizing separation efficiency. Due to this desire, the combination of an adiabatic approach with an eluent preheater is mandatory in order to avoid the formation of a radial temperature gradient inside the chromatographic column. In UHPLC experiments, friction of the mobile phase leads to the generation of heat inside a column. The application of isothermal conditions then results in a radial temperature gradient that compromises chromatographic results. In contrast, under adiabatic conditions, an axial temperature gradient is generated that does not negatively affect performance.
However, it is worth mentioning that the temperature of a separation should be adjusted to the properties of the column housing, as well as to the specific characteristics of the column packing material. A polymeric column backbone can be operated at higher temperatures without column deterioration, whereas the solubility of silica-based stationary phases increases rapidly under such conditions. Of course, in addition to the temperature, the pH of an eluent has to also be taken into account. For details, see section on mobile phase composition.
Whatever system is used, it is important to work under equilibrated conditions. The heat conductivity of a stain-less steel column housing is high, therefore stationary phase temperature most likely matches column oven temperature. On the other hand, the heat conduction coefficient of columns utilizing PEEK housing is lower as compared to steel. If the difference between oven and
mobile phase temperature becomes large, a temperature gradient may appear inside columns with PEEK housing that negatively affects peak shape and separation effi-ciency. Figure 18 shows the influence of temperature on the plate height achievable with an RP-18 endcapped 50–2 monolithic silica column. As a reason of this it is recommended to install a metal capillary with 1/16‘‘ outer diameter and 0.2 mm inner diameter (length 30 cm) in front of columns with PEEK housing. The higher the flow rate of the mobile phase, the more important a pre-heated mobile phase is. Another option for thermostatting of elu-ents is the combined use of metal capillaries and a water bath and a column oven. Depending on the HPLC system, mobile phase pre-heating modules can be a general alter-native to the use of metal capillaries (and a water bath).
Figure 19 displays the separation of doping drugs at an oven temperature of 45 °C. Depending on the eluent tubing material and internal diameter used, obvious changes in the chromatographic results are visible.
Figure 18. Correlation between column thermostatting setup and plate height achievable with a Chromolith® RP-18 endcapped 5 cm x 2.0 mm I.D. column.
40 °C w/o capillary40 °C with capillary
25 °C w/o capillary25 °C with capillary
0.5
30
25
20
15
10
5
01.5 2.5 3.5 4.5 5.5
Pla
te h
eight
(µm
)
Flow rate (mL/min)
Figure 19. Analysis of a doping drug mixture on a monolithic silica column at an oven temperature of 45 °C. Capillary utilized in front of the column, from top to bottom: No capillary; metal capillary with 1 mm i.d.; metal capillary with 0.2 mm i.d.; red PEEK capillary with 0.17 mm i.d. The length of all capillaries used was identical (30 cm).Chromatographic conditions: Chromolith® HighResolution RP-18 endcapped 10 cm x 4.6 mm I.D.; mobile phase A: acetonitrile, mobile phase B: water; gradient: 35% A to 100% A in 1 min, 3.5 min at 100% A; flow rate 2 mL/ min; temperature 45 °C; detection: UV 240 nm; injection: 5 µL; sample: fluoxymesterone, boldenone, methandrostenolone, testosterone, methyltestosterone, boldenone acetate, testosterone acetate, nandrolone propionate, testosterone propionate, nandrolone phenylpropionate, testosterone isocaproate.
0 1 2 3
0 1 2 3
0 1 2 3
0 1 2 3
0 1 2 3
Retention time (min)0 1 2 3

11
System care and maintenanceA system suitability test (SST) should be performed with any HPLC system and needs to be independent of its use. The SST delivers information about the suitability of a combination of a chromatographic column and an HPLC system in terms of selectivity or other predefined criteria for a specific type of sample under the given chromatographic and instrumental conditions. In a pharmaceutical environment, such an SST is mandatory and has to be conducted regularly (every workday morning), or prior to a new analysis sequence. The chromatographic properties of the sample utilized in such a test have to be similar to the real samples analyzed in subsequent runs.
Knowledge about the system back pressure under specific conditions allows for a calculation of net column back pressures and a good comparability of different chromatographic columns under identical chromatographic conditions. Changes in system back pressure can help to identify system wear. The system back pressure can be determined by performing an HPLC run without installed chromatographic column.
The HPLC instrument has to be flushed with organic solvent regularly to prevent microbial contamination and its negative effects, mainly on highly sensitive mass spectrometric detection. Use alcohols such as methanol or isopropanol for this means. To a certain degree, acetonitrile can be contaminated with amines, these adsorb on the sapphire seats and balls of check valves, subsequently polymerize and can block inlet valves. Ceramic check valves do not seem to be affected in a similar manner. The frequency of flushing depends on the utilized eluents and buffer concentration, and should be between two to four weeks. If possible, at least 5% of organic solvent should be added to the aqueous mobile phase. An inversion of eluent channels can also help to avoid microbial contamination. If a buffer was used prior to instrument flushing, make sure the salt is soluble in the organic solvent or that water is used for flushing before switching to an organic solvent. If an HPLC is not used for prolonged periods of time, flush the entire instrument with alcohol.
Pump debris is collected in the pump inlet filter. These compounds might not be visible using UV detection, but it is likely that they can be detected via MS. The filter should therefore be replaced every 1–2 months, or after changing from acetonitrile to methanol (or vice versa) in order to obtain lower baseline noise and to generally protect the system including column and detector.
HPLC systems are equipped with a solvent mixture bottle dedicated to autosampler washing. This mixture normally contains water and approximately 5–10% of an organic solvent such as isopropanol for better wettability. It is common practice in many laboratories to keep the compo-sition of this mixture constant and utilize it independent of the type of method (isocratic or gradient) as well as stationary phase (reversed or normal phase as well as HILIC). After an autosampler needle-washing step, part of the washing solution is transferred to the chromatographic system. As long as chromatography is done in reversed phase mode (the organic solvent is the strong solvent), low amounts of organic solvent will hardly affect the result of an isocratic or gradient run. By contrast, water is the strong eluent under HILIC conditions. If the autosampler washing solution composition is not adapted, the effect will be comparable to the injection of a sample dissolved in a highly aqueous solvent mixture. This can cause peak shape issues such as peak splitting or broadening, as well as decreased retention. Therefore, the amount of strong solvent in the autosampler washing solution (as well as in the sample solvent itself) has to be kept lower than the content in the mobile phase starting composition.
When preparing a sample for reversed phase analysis, the sample has to be dissolved completely; ideally in the mobile phase (gradient runs: initial composition). Solubility of the sample in the eluent has to be tested prior to injection. If the sample cannot be dissolved in the eluent, a solution in less than 50% acetonitrile is the best choice. The second choice is 100% water (used up to 500 µL) and avoid (close to) 100% acetonitrile.
Under HILIC conditions, the sample has to be dissolved in 60–100% organic solvent or the initial mobile phase composition. The sample should not be diluted in water! Again, always test sample solubility in the mobile phase prior to injection. When performing a gradient run, the steepness should not exceed 2–5% eluent composition change per minute in order to keep the system in equilibrium.

12
Figure 20 illustrates the effect of improper sample solvent composition in the separation of the antiviral drug oseltamivir and oseltamivir carboxylate on a zwitterionic HILIC column. As water is the strong solvent in this chromatography mode, water content of the sample solution should be kept as low as possible. In the example shown in the left column different
amounts of sample dissolved in the mobile phase (acetonitrile/ammonium acetate 10 mM 90/10 v/v) were injected with no negative effect to the chromatographic results. By contrast, injection of samples dissolved in acetonitrile/ammonium acetate 10 mM 50/50 (v/v) as a solvent under otherwise identical conditions, led to the elution of broad and even splitting peaks.
1.5e5
1.0e5
0.5e5
0.0e50 1 2 3 4
1.5e5
1.0e5
0.5e5
0.0e50 1 2 3 4
Retention time (minutes) Retention time (minutes)
MS inte
nsi
ty(c
ounts
)
MS inte
nsi
ty(c
ounts
)
1.5e5
1.0e5
0.5e5
0.0e50 1 2 3 4
1.5e5
1.0e5
0.5e5
0.0e50 1 2 3 4
Retention time (minutes) Retention time (minutes)
1.5e5
1.0e5
0.5e5
0.0e50 1 2 3 4
1.5e5
1.0e5
0.5e5
0.0e50 1 2 3 4
Retention time (minutes) Retention time (minutes)
MS inte
nsi
ty(c
ounts
)
MS inte
nsi
ty(c
ounts
)
MS inte
nsi
ty(c
ounts
)
MS inte
nsi
ty(c
ounts
)
Figure 20. Multiple reaction monitoring mode analysis of oseltamivir and oseltamivir carboxylate on a zwitterionic HILIC column. Sample diluent: Acetonitrile/Ammonium acetate 90/10 (v/v) (left), acetonitrile/NH4OAc 50/50 (v/v) (right). Injection volumes: 2.5 μL (top), 5.0 μL (middle), 7.5 μL (bottom).Chromatographic conditions: SeQuant® ZIC®-HILIC (5 μm, 200Å) PEEK 5 cm x 2.1 mm I.D.; detection: MS (multiple reaction monitoring mode, extracted ion chromatogram overlay of m/z 313.3 and 225.2); mobile phase: acetonitrile/Ammonium acetate 10 mM 90/10 (v/v); flow rate 500 µL/min; sample: oseltamivir, oseltamivir carboxylate.

13
3. Method development & optimizationThe overall process is influenced by the nature of the analytes and generally follows the following steps:
1. Selection of the HPLC method and system2. Sample preparation3. Selection of the detector4. Selection of initial conditions5. Choose the right HPLC Column 6. Mobile phase selection7. Mobile phase preparation8. Selectivity optimization9. System optimization10. Method validation11. Scaling of HPLC methods
Selection of the HPLC method and systemMethod development is not difficult when a literature reference can be found for the same or similar needs. Methods are published in pharmacopeia, in column manufacturer application databases, and as published scientific studies. These sources can provide good guidance for the planned work, but what happens when references to the compounds of interest do not exist?
Different approaches are possible, and trial and error is the least successful way forward. A chromatographer normally has access to a wide variety of equipment, columns, mobile phase compositions and operational parameters which make high performance liquid chromatography method development seem complex. In this chapter, direction will be given to make method development intuitive and successful, with emphasis on column selection.
Method goalsMethod development in this context means to define needs, set goals, and make experimental plans, then to carry out the practical work, and finally validate and put the new method into routine work. For these reasons, method development should be started at the desk, and not in the laboratory. A number of questions should first be addressed and answered:
• Is the primary goal quantitative or qualitative analysis?• If quantitative analysis is required, what levels of
accuracy and precision are needed?• Are reference standards available?• How many analytes need to be detected?• Is it necessary to resolve all sample components?• How many different sample matrices is the method
designed for?• How many samples will be analyzed at one time?• If qualitative analysis is requested, it is important to
define whether the method will be used for character-ization of unknown sample components or isolation/purification of analytes.
These initial questions will direct the chromatographers to define the method goal, and to find out requirements of the new method. Is high resolution (in separation and detection), short analysis time, maximum sensitivity, long column lifetime, and/or a column with wide pH stability a need, or will the method be used at neutral pH and under non-aggressive conditions? True optimization of a method is a balance between selectivity, speed, and efficiency in order to produce results that are the purpose of the application. Ideally, the development should result in a robust method that gives the laboratory a low, overall, price-per-injection and ultimately a cost-efficient assay.
Common mistakes in analytical method development• Inadequate formulation of method goals
• Insufficient knowledge of chemistry
• Use of whatever reversed phase HPLC column is available in the lab
• Use of wrong instrument set-up
• Trial and error with different columns and mobile phases
These mistakes often result in laborious, time-consuming projects that lead to methods that fail to meet the needs of the laboratory.
Getting startedAfter defining the goal of the method development, specific information of the sample and the analytes should be sought. Different sources are available: e.g. scientific journals, chemical databases such as www.pubmed.org (small molecules), ExPASy Proteomics Server http://expasy.org (large biomolecules), and reference books. Listed below are some of the most common parameters.
• Nature of the sample
• Number of compounds/analytes present
• Chemical structure (functionality)
• Molecular weight of the compounds
• pKa values
• log P and/or log D values (hydrophilicity/hydrophobicity)
• Concentration
• Sample matrix
• Sample solubility
Depending on the method requirements, some steps will not be necessary. For example, if a satisfactory separation is found initially, steps 7 and 8 may be omitted. The extent to which method validation (step 9) is investigated and pursued will depend on the final use of the analysis; for example, a method required for quality control will require more validation than one developed for a one-off analysis.

14
Sample PreparationAt a glance, sample preparation enables the following advantages:
• Removal of undissolved particulates that could lead to instrument down-time
• Decrease all/most of impurities that would interfere with the analyte during analysis
• Increase the sensitivity or enrichment of the desired analyte(s)
Sample preparation is generally the most time-consuming and tedious portion in the analysis for small molecules. But it is one of the most, if not the most, important considerations in the process. The ideal sample prep-aration prior to analysis increases the compatibility of the analyte with the detection technique and removes interfering impurities from the matrix. Addressing these factors allow for cleaner spectra which enables greater sensitivity. Further, certain analysis techniques require the analyzed sample be particle-free meanwhile the prepared sample needs to be miscible with the resultant technique.
An important note about the matrix of the analyte sample.
The matrix tolerance of chromatographic columns and detectors differs depending on the type and properties of the carrier material (monolithic or particulate), and on the type of detector used (UV, MS etc.). Especially when utilizing highly sensitive mass spectrometric detection and quantification, the sample preparation process has to be performed thoroughly, as matrix components can cause signal suppression and/or adduct formation with target molecules and therefore decrease sensitivity (signal-to-noise ratio) and/or increase complexity of the mass spectrum. Due to this, the chromatographic analysis of samples with high matrix load can make several different selective and specific sample pretreatment steps necessary.
During the sample preparation procedure, undesirable compounds such as particles, lipids or dissolved matter should be removed. Extraction and purification steps as well as preconcentration procedures of low abundance analytes can be part of the clean-up procedure. Depending on the physical state of the sample, various sample preparation techniques are available:
Liquid samples:• Filtration• Liquid-liquid extraction (LLE)• Solid phase extraction (SPE)• Solid phase microextraction (SPME)• Restricted access materials (RAMs)
Solid samples:• Soxhlet extraction, batch extraction• Matrix solid phase extraction
After extraction of the analytes, the sample may be concentrated by evaporation of the solvent. This allows the sample to be resuspended in a desired solvent, i.e. the initial mobile phase for liquid chromatography.
Overview of Techniques
FiltrationFiltration is a rather simple but essential component of high-quality separation and purification processes for the removal of undissolved matter and particles from samples prior to HPLC or UHPLC analysis. Therefore, a filtration step has to be part of every sample preparation procedure and depending on the throughput of a laboratory syringe filters, complete filtration systems or filter plates are available. The type of filtration membrane (pore diameter 0.20 or 0.45 μm) should be chosen according to specific sample properties:
• LCR (hydrophilic PTFE): Aqueous or mild organic solutions; low binding and extractables, filtration of protein-containing solutions.
• Durapore® (PVDF): Aqueous or mild organic solutions; low binding and extractables, clarifying protein-containing solutions.
• Nylon: Aqueous or organic solutions
• Express™ (polyethersulfone—PES): Fast flow and low protein binding
• Fluoropore® (hydrophobic PTFE): biologically inert with broad compatibility. Compatible with acids, bases, and solvents
• Mixed Cellulose esters (MCE): clarification of water, buffers, or aqueous solutions
Syringe filters with high-density polyethylene or polypropylene housing are suitable for the fast filtration of a rather limited number of samples (1–10 per day). Their chemical compatibility is broad and low holdup volumes make them ideal candidates for the preparation of low sample volumes. In addition, e.g. greater than 90% drug recovery in the first mL of filtrate is possible when utilizing filters with PTFE membrane, indicating low drug binding to PTFE, making this membrane type an ideal candidate for sample preparation prior to quantitative analyses. Syringe filters are also available for robotic systems or workstations. In that case, filters are used in combination with an automated filter changing system, and for applications such as dissolution testing (evaluation of the dissolution rate of solid dosage forms in the digestive tract) or HPLC sample preparation. Next to the above-mentioned membranes, a glass fiber membrane for the clarification of aqueous or organic solutions with high particulate levels is available.
For hard-to-filter samples (samples containing particulate materials as well as samples that are viscous), syringe filtration of food and beverage samples such as, e.g., juices, honey, soups or salad dressing can be difficult and the particle load can easily clog the syringe filter. Other hard-to-filter samples include many pharmaceutical suspensions, shampoos, conditioners, creams and other household products. Under these circumstances, vacuum- driven filtration of samples for liquid chromatography with specifically designed filtration systems and filters can be an option. Same as for the syringe filters, low hold-up volumes of such devices deliver high analyte recoveries.

15
In contrast to syringe filtration, many samples can be treated at the same time, making filtration systems a good solution for non-automated, medium throughput (10–100 samples per day). Recommended fields of use are, for example, drug dissolution testing, food safety (unknown and known toxin), cosmetics (ingredients and formulations) and pharmacokinetics/pharmacodynamics (PK/PD, drug interaction with the human body).
Sorption-based sample preparationSample filtration is normally followed by a second sample preparation step depending upon the analytes. After adsorption, the analytes are desorbed utilizing small volumes of a suitable solvent which are collected and analyzed. The sample preparation procedures in the following section are technically mature and belong to the most widely used processes in laboratories worldwide. Improvements in these procedures are aimed at increasing degree of automation and/or sensitivity.
Liquid-liquid extractionClassical liquid-liquid extraction (LLE) is a common choice when it comes to the treatment of liquid samples. It is one of the first sample preparation procedures established and is still used in its original form for the analysis of biological samples. LLE “in bulk” is based on the transfer of an analyte from an aqueous solution to a water insoluble solvent using a separation funnel. Disadvantages of this time-consuming approach include the formation of emulsions, poor phase separation and a comparably high solvent consumption.
Another LLE approach—that is in first sight similar to solid phase extraction (SPE) procedures (see section below)—uses a solid support, in most cases natural diatomaceous earth, as a matrix for the adsorption of the aqueous sample. The sample distributes itself in the form of a thin film over the chemically inert matrix and thus acts as a stationary phase. In a subsequent step, all lipophilic analytes are eluted with an organic solvent that is not miscible with water (e.g., diethyl ether, ethyl acetate, halogenated hydrocarbons), then further cleaned up and analyzed. Figure 21 illustrates this process. The advan- tages of this type of LLE (also known as SLE or supported liquid extraction) are:
• Easy handling
• No formation of emulsions
• High recovery rate and cleaner eluates in comparison to “bulk” LLE
• Lower solvent consumption
• High batch-to-batch purity and reproducibility
Solid Phase Extraction (SPE)SPE is the most widely used technique for sample clean up or preconcentration of analytes from aqueous or liquid samples. It can be utilized for analytes covering the complete range of polarities and chemical structures and combines a high recovery rate and effective concentration without the formation of emulsions. In addition, solvent consumption of this easy-to-use and automatable method is very low.
The goal of SPE is the selective extraction of the analyte(s) from a complex sample for cleaner and more reliable results by a further analytic technique (e.g. HPLC or LC-MS). Overall, SPE works on the principle of liquid chromatography where analyte(s) are retained by reversable interactions between the analyte(s) and the sorbent surface. These interactions include, but are not limited to, van-der-Waals forces, hydrogen bonding, dipole- dipole forces, and electrostatic interactions. The different sorbents used for SPE contain one or more of these intermolecular forces and will be highlighted in more detail below.
When starting SPE, the more information known about the analyte(s) makes selection of the sorbent easier. Useful properties include information about the structure, solubility, polarity, lipophilicity, log P’s (hydrophilicity/hydrophobicity), concentrations, and pKa’s. Other factors relating to the conditions of the solution that the analyte are in are also important. These include the polarity (aqueous versus organic), ionic strength, matrix interference (lipids, salts, fats), and pH to name a few. Table 4 shows one approach to narrowing down what type of sorbent to use for SPE. Table 5 lists the different types of sorbents that are available along with their description and general applications.
1. Extrelut® 2. Apply aqueous sample 3. Apply organic solvent (not miscible with water)
Distribution of the aqueous phase on Extrelut®
Lipophilic substance extracted from the sample
4. Elution
Figure 21. Working principle of Supported-liquid extraction. The sorbent applied is a naturally occurring, pure, wide pore kieselgur (diatomaceous earth).

16
Table 4. Flowchart to help decide which sorbents are best for analyte(s) separation.
Sample Matrix Aqueous (polar, buffer, water) Organic (slightly polar to non-polar)
Retention Mechanism Reverse Phase Ion Exchange Normal Phase
Analyte Property Slightly polar to non-polarStrong Ions Weak Ions
Polar to moderately polar compoundCation Anions Cations Anions
Sorbent Phase C18, C8, C4, Ph, CN, DPA-6S, HLB SCX SAX, NH2 WCX NH2, PSA Si, CN, Diol, NH2, PSA, Florisil, Alumina
Table 5. Outlining the different sorbents with potential applications.
Sorbents Available Description Applications
Rev
erse
Phas
e
C18 Octadecyl bonded, end capped silica Extractions of nonpolar to moderately polar compounds including antibotics, barbiturates, essential oils, steroids, surfactants
C8 Octyl bonded, end capped silica Similar to the C18 but slightly less hydrophobic.
C4 Butyldimethyl bonded, end capped silica Less hydrophobic than C8 and C18, extraction of peptides and proteins
DPA-6S Polymeric hexamide bonded Used to adsorb polar compounds (hydroxyl and phenolic compunds) from aqueous and methanolic solutions through strong hydrogen bonding.
Ph Phenyl bonded silica Less retention than C8 or C18, slightly more specific for aromatic compounds
CN Cyanopropyl bonded For very hydrophobic analytes that may be irreversibly retained on more hydrophobic sorbents such as C18
HLB Hydrophobic surface enclaved by hydrophilic network For wide range of polar to non-polar analytes.
Nor
mal
Phas
e
Diol Polymer bonded 2,3-dihydroxypropoxypropyl
Used to extract polar analytes through hydrogen bonding from organic solvents, oils, and lipids
Si Silica gel Used to extract polar analytes or analytes with hydroxyl, amines, or heteroatoms.
NH2 Aminopropyl bonded silica Used to extract moderately polar to polar compounds
PSAPolymeric bonded ethylenediamine— N- propyl (primary and secondary amine) bonded silica
Similar to amine phase, but higher capacity due to presence of secondary amine
CN Cyanopropyl bonded Less retentive than Si or Diol and allows for rapid release of very polar analytes that may irreversibly be retained on very polar sorbents.
Alumina No bonded phase, available at neutral pH (6.5) adsorbent
Extraction of polar compounds such as vitamins, antibiotics, essential oils, glycosides
Florisil Magnesium silicate available as adsorbent
Medium polar extraction of analytes including alcohols, aldehydes, amines, ketones, organic acids, and phenols
Ion E
xchan
ge
SAX Quaternary amine bonded silica with Cl- counterion (pKa >14)
For extractions of anions, organic acids, nucleic acids, nucleotides and surfactants. Elution solution must have a pH < pKa +2 of the analyte and/or ionic strength > 0.1 mol/L. Not intended for recovery of strong anions (use an NH2 if intention is recovery)
NH2 Aminopropyl bonded silica (pKa ~ 9.8) For extractions of cations when acting as a weak anion exchange, loading of analyte must have a pH <7.8. Elution solution must have a pH >11.8
PSAPolymeric bonded ethylenediamine— N- propyl (primary and secondary amine) bonded silica (pKa 10.1 and 10.9
For extractions of cations when acting as a weak anion exchange, loading of analyte must have a pH <8. Elution solution must have a pH >13
SCX Aliphatic sulfonic acid bonded silica with Na+ counterion (pKa < 1)
For extraction of cations, antibiotics, drugs, organic bases, amino acids, catecholamines, nucleic bases, nucleosides, and surfactants.
For elution, solution must have a pH ≥ pKa + 2 of the analyte. Not intended for recovery of strong cations (use a WCX if intention is recovery).
WCX Carboxylic acid bonded silica with Na+ counterion (pKa ~ 4.8)
For extrations of cations, amines, antiobiotics, drugs, amino acids, catecholamines, nucleic acid bases, and nucleosides. Elution solution must have a pH <2.8 and/or ionic strength ≥0.1 mol/L
Oth
er
Carbon-Based Packing
Nonporous with variety of surface area available Adsorbent
For adsorption of polar and non-polar compounds, depends more on structure/size of analyte than intermolecular forces.
Chrom P Styrene/divinylbenzene Adsorbent
For extraction of hydrophobic compounds which contain some hydrophilic functionality (e.g. aromatics). Elution usually performed with mid- to non-polar solvent
QuEChERS Dispersive SPE (dSPE) available with different salts and/or buffering agents
Extraction of multi-residue pesticide analysis, samples are first extracted with aqueous solvents in the presence of high amounts of salts and/or buffering agents followed by SPE clean up.
Molecular Imprinted Polymers
MIPs Specialized sorbents whose surfaces has been designed to mimic specific analytes.
These included sorbents for NSAIDS, nitroimidazoles, fluoroquinolones, Beta-agonist, riboflavin, aminoglyconsides, and bisphenol A.
Chiral Ag-IonDesigned for the resolution of cis/trans isomers. The cis isomer is better retained on the sorbent compared to the trans isomer. One application is the fractionation of fatty acids methyl esters (FAMEs)

17
As seen in Table 4, there are three major types of retention methods: reverse phase (RP), normal phase (NP), and ion exchange (IE). We will discuss these methods in greater detail. Listed in Table 6 are solvents commonly used for SPE in order from most non-polar to polar in nature as well as the type of separation they are preferred for.
Reverse Phase (RP): RP separations involve a polar matrix/solution (usually aqueous but can also be biological samples such as plasma or urine) and non-polar or mildly polar analyte(s). The analyte(s) are retained on the appropriate non-polar sorbent primarily due to Van der Waals forces or dispersion forces. Recovery of the analyte is achieved by using a non-polar solvent that the analyte is miscible in. Common solvents for elution range from hexane, tetrahydrofuran, ethyl acetate, or acetonitrile depending on the analyte(s). When working with RP bonded silicas, some polar secondary interactions with the residual silanols may occur if the elution with the nonpolar solvent does not efficiently elute the analyte. The addition of a more polar solvent (methanol) may aid in disrupting these secondary interactions. Further considerations could include using an organic modifier to either increase or decrease the pH. The silanol (Si-OH) will deprotonate above pH ~4. Under these circumstances, the column may have slight cation exchange properties. This can be overcome by using a mixture of acidic methanol or basic methanol or by mixing these with a more nonpolar, methanol-miscible solvent. A good suggestion is to keep the organic modifier to less than 2% by volume. If the sample recovered is going to be used for analysis by mass spectrometry, consider using a modifier that is compatible (e.g. ammonium formate for acids, ammonium hydroxide for bases).
Normal Phase (NP): NP procedures involve polar ana-lyte(s) in a mid-to non-polar matrix/solution (acetone, chlorinated solvents, hexanes). In this case, the sorbents are usually silica or modified silica (CN, NH2, or Diols) that enable either hydrogen bonding, dipole-dipole, or dipole-dipole-induced interactions with the polar (more hydrophilic) analyte(s). Recovery of the analyte(s) is
achieved by use of a polar solvent that disrupts these interactions. Solvents that are commonly used include acetic acid, water, and methanol. Similar to RP, secondary interactions involving silanols and its deprotonated state may exist and similar strategies may need to be explored if recovery is lower than expected.
Ion Exchange (IE)Ion exchange sorbents are used for analytes that are charged in solution (usually aqueous, but sometimes polar organic). Depending on the charge of the analyte in solution this will dictate which type of sorbent is required. If the analyte in solution is an anion (negatively charge) then a strong anion exchange (SAX) or amine (NH2 or PSA sometimes referred to a WAX) sorbent is required. If the analyte instead is positively charge (cation) than the sorbent to use is either a strong cation exchange (SCX) or weak cation exchange (WCX). Retention for all four of these sorbents is primarily electrostatic interactions where the analyte is attracted to the opposite charge on the sorbent. The pH of the analyte solution and the sorbent is a critically important criteria when performing IE. Table 7 provides an approximation of the pH’s to use while performing IE. At the same time, the ionic strength of the sample and loading solution are important. If the ionic strength is too high, then poor retention of the analyte(s) to the sorbent will occur.
In general, strong ion exchange sorbents (SAX or SCX), should only be used with strong anions/cations when recovery and elution is not important. If recovery of these species are important, than a weak ion exchange sorbent is recommended. Strong ion exchange sorbents are good for working with analytes that can have the charge changed depending on pH. This is highlighted in Table 7. The strong ion exchange sorbents have a loading capacity ~0.2 milliequivalence/gram of sorbent. Equivalence is defined as the concentration multipled by the charge of the ion. For example, a solution of 0.2 mM sodium ions and 0.2 mM magnesium ions would have equivalence of 0.2 meq (0.2 mM x [+1]) and 0.4 meq (0.2 x [+2])
Table 6. Characteristics of Solvents Commonly Used in SPE for RP or NP.
Solvent Miscible in Water?
Non-Polar Strong RP Weak NP Hexane No
Isooctane No
Carbon tetrachloride No
Chloroform No
Methylene chloride DCM (dichloromethane) No
THF (tetrahydrofuran) Yes
Diethyl ether No
Ethyl acetate Poorly
Acetone Yes
Acetonitrile Yes
Isopropanol Yes
Methanol Yes
Polar Weak RP Strong NPWater Yes
Acetic Acid Yes

18
Conversely, the use of weak ion exchange columns are generally better for strong ions (whose charge is mildly effected by pH) as retention and release of the analyte(s) is controlled by charge manipulation of the sorbent. This is not to say that weak ion exchange sorbents cannot be used for weak ions. Consideration of the sorbent’s and analyte’s charge state with the elution solution’s pH are important. Alternative, the appropriate ionic strength may also be used to displace the analyte. These ion exchange capacities should be determined for each individual application.
Solid Phase Extraction MethodologyIn general, there are four steps when performing SPE. These 1. Conditioning/Priming, 2. Loading 3. Washing, and 4. Elution.
1. Conditioning and priming the sorbent. Conditioning is vitally important when working with silica-based sorbents and is encouraged when desired recoveries or separations are not being achieved. Conditioning “wets” or solvates the sorbent and equilibrates the sorbent with similar solvent strength and/or pH to optimize retention. During this time, it is important to not completely dry the sorbent out, otherwise it will defeat the purpose. As general rule, conditioning should be performed between 1 and 2 volumes if using a cartridge (ex. Using a 10 mg/1 mL cartridge would suggest 1 to 2 mL of conditioning).
2. Loading the sorbent. Depending on the sample, it may be loaded directly on the column. The flow rate is important. The ideal flow rate is one drop per second when time is not a factor and should not exceed 2 mL/min in most cases. As a general rule, the loading capacity of the analyte should not exceed 5% of the bed weight of the sorbent (this does not apply for ion exchange sorbents as it depends on the meq/g of sorbent, see earlier discussion). As an example, if the bed weight is 100 mg of sorbent, this implies no more than 5 mg of analyte is recommended to be loaded on the sorbent. If the sample is rather viscous or the pH is not amenable to the column, presample preparation should be considered. This may involve diluting the sample to reduce the viscosity or adjusting the pH to the appropriate range (especially important for ion exchange). To avoid clogging frits or disks if
applicable, centrifuge and/or prefilter samples prior to loading. Additional details about pretreatment of samples will be discussed later.
3. Washing. This step helps eliminate impurities that would impact the results of the desired analyte(s). It is important to have an idea of what the impurities might be and how their properties differ from the desired analyte(s). Example, if using a RP mechanism, the impurities may be less retained than the desired analyte(s). This is can be exploited by using a slightly more polar solvent to wash off the impurity, leaving behind the desired analyte. Another example involves exploiting differences in pKa’s. If the sorbent is washed with a slightly acidic/basic solution, it could be used to change the charged state on the impurity and also the affinity for the sorbent, leaving behind the desired analyte(s). Table 6, lists some common solvents and their applicational use for SPE.
4. Elution. Two smaller aliquots compared to one larger aliquot generally elutes the desired analyte(s) more efficiently. Flow rate, once again, is an important factor. The longer the elution solution/solvent is in contact with the sorbent, the better the expected recovery of the desired analyte(s) will be. Another consideration is whether or not the analyte is less retained than the impurities. If this is the case, it is important to choose an eluent that will be selective for the analyte(s) and leave the impurities on the column. The elution process also provides an opportunity to increase the concentration of the analyte. This is achieved if a smaller volume if feasible is used than the volume of sample used during the loading step.
With an overview of the different steps that are common, there are three different schemes that are most often implored. These are selective extraction, selective washing, and selective elution as seen in Figure 22.
In selective extraction (Figure 22, left), the desired sorbent will bind the selected components of the sample, which can be the analyte(s) of interest or the impurities. The selected component will be retained on the sorbent while the effluent will contain the rest of the solution. If the desired analyte is retained, then the effluent is discarded, and the analyte is collected separately in a new collection vessel when released from the sorbent. However, if the impurities are retained and the analyte is in the effluent, this is called the pass-through method.
Table 7. Methodology of using Ion Exchange sorbents and relative pH’s to use.
Analyte Weak acid (-) pKa ~5 Strong anions Weak bases (+) pKa ~10 Strong cations
Sorbent Approx. pkA charge state
SAX pKa ~1 always +
NH2/PSA/WAX pKa ~10 + at pH < 8
SCX pKa ~14 always –
WCX pKa ~ 5 – at pH >7
Absorption condition
Loading Soln pH >7 pH <8 pH <8 pH >7
Analyte (charge) Neg (–) Neg (–) Pos (+) Pos (+)
Sorbent (charge) Pos (+) Pos (+) Neg (–) Neg (–)
Desorption condition
Loading Soln pH < 3 pH > 12 pH > 12 pH < 3
Analyte (charge) Neutral (0) Neg (–) Neutral (0) Pos (+)
Sorbent (charge) Pos (+) Neutral (0) Neg (–) Neutral (0)
Summary Analyte(s) changes charge Sorbent changes charge Analyte(s) changes charge Sorbent changes charge

19
In selective washing (Figure 22, middle), the sorbent will bind both the analyte(s) of interest and impurities when loaded. During the wash step, an appropriate solution is added where the impurities are selectively removed, and the analyte(s) is retained. The effluent is then discarded, and the analyte is collected separately when released from the sorbent.
In selective elution (Figure 22, right), the sorbent will bond the analyte(s) of interest and the impurities once again. Washing steps are selected to remove unwanted matrix, while leaving the impurities and analyte(s) of interest on the sorbent. The effluent up to this point is discarded. At this time, a solution/solvent is selective for the analyte(s) while leaving the impurities on the sorbent. Once this is completed, further post-elute treatment may perform at this time. This may include concentration or drying the sample or diluting/resuspending the sample in starting mobile phase.
Format of sorbentThere are several different formats in which the sorbent is available, including free sorbent, columns/cartridges, disks, 96-well plates, and online/inline cartridges. In addition to the format, the sorbents are also available in different bed weights that allow for different sample volume capacities.
Impurity Analyte Sorbent
Loading Loading Wash Wash Elution
Figure 22. Visualization of Selective Extraction (left), Selective Washing (Middle) and Selective Elution (Right). The legend of the symbols is located below the image.
available such as glass. Glass is recommended when there is concern about trace amounts of leachables from polypropylene.
Well Plates. Similarly to cartridges, these are available in a variety of sorbents and bed weights. These are recommended for processing many samples at a time and are amenable to high throughput automation liquid handling systems. These are tailored for smaller volumes (less than 2 mL).
Disks. Available in a variety of sorbents embedded in glass fiber membranes. Enables faster flow rates and less clogging than PTFE disks while extracting organic analytes/contaminants from larger aqueous samples.
Online/Inline. An alternative to manual SPE. These are designed for direct injection of untreated samples for analysis by LC-MS. These are available in different sorbents, including one designed to remove phospholipids from biological samples. This is an automated SPE which leads to high reproducibility and consistent results by removing the human factor. Initial configuration of the LC is required.
Bulk Sorbent. This is available in different sorbents for those either interested in packing their own cartridges or performing dispersive solid phase extraction (dSPE) or QuEChERs method.
Columns/cartridges. These come in a variety of sizes with different amounts of sorbents loaded in the cartridge. Bed weights typically range between 30 mg up to 10 g (see Table 8). The smaller the bed weight, the smaller amount of elution volumes required. This is beneficial for sensitive analyses where concentration of analytes may be quite small. SPE is achieved through manual processing. Variations are available where either positive or negative (vacuum) pressure can be applied to aid in extraction. Cartridges are primarily made of polypropylene, however, other mediums are

20
Restricted Access MaterialsThis method is another version of on-line sample prepa-ration. These are biocompatible and allow for the direct injection of untreated biological samples (haemolyzed blood, plasma, serum, milk, saliva, fermentation broth, …) into a chromatography system. They were designed as a time-saving, integrated solution. The working principle is based on fractionation of a sample based on the molecular weight of both protein fraction and target analytes. Macromolecules and protein matrix compounds only interact with the exterior, hydrophilic surface of sorbent (diol modification) and are not adsorbed. In contrast, small and low molecular weight analytes are enriched on the interior hydrophobic surface (C18, C8, or C4) of the column packing material. These materials operate on a dual method of size exclusion and reverse-phase/ion-pair chromatography. The access to the interior is restricted dependent upon the pore diameter (physical barrier) or chemical (diffusion) barrier (e.g. semipermeable surface, protein network formation). The silica gel particles are 25 mm in size with pore sizes of 6 nm (60 angstroms) and have a working pH stability between 2 and 7.5.
Dispersive Solid Phase Extraction (dSPE)Dispersive solid phase extraction is also to referred to as the “QuEChERS” (quick, easy, cheap, effective, rugged, and safe) method. In this method, samples are first extracted with aqueous miscible solvents (e.g. acetonitrile) usually in the presence of high amounts of salts and/or buffering agents. Unlike traditional SPE, the sorbent is present as a loose powder in pre-weighed quantities. The presence of salts aid in inducing liquid phase separ-ation. Upon shaking the sample with the sorbent, the mixture is centrifuged, and the organic supernatant is removed. Depending on the nature of the sample, the supernatant can be either analyzed directly or processed further. Acceptance of this methodology is recognized in the area of pesticide analysis in the formalized methods EN15662:2008 and AOAC 2007.01.
Sample PretreatmentIn this section, we will discuss pretreatment of some common matrices. Please understand, these conditions may require additional optimization depending on the application or the analyte(s) to be monitored.
Figure 23. Dispersive Solid Phase Extraction (dSPE) Formats. Shown on the left are traditional Quechers tubes whose typical method is outlined above. On the right, a newer format shown is dispersive SPE tips that is comprised of loose sorbent within a micropipette tip, allowing the extraction to be performed entirely within the tip in a method that entails simple pipetting steps.
Table 8. SPE Configuration Guide for Cartridge Selection
Bed Weight Tube Volume Minimum Elution Volume Bed Capacity*
30–100 mg 1 mL 100–200 mL 1.5–5 mg
500 mg 3 mL 1–3 mL 25 mg
0.5–1 g 6 mL 2–6 mL 25–50 mg
2 g 12 mL 10–20 mL 0.10 g
5 g 20 mL 20–40 mL 0.25 g
10 g 60 mL 40–100 mL 0.50 g
* Bed capacity depends on the type of sorbent and analytes being used. Five percent of the bed weight is a general rule and represents the values in the table.

21
Serum, Plasma, and Whole Blood
Most often analytes may be protein bound and these interactions will decreased recoveries. There are several methods to disrupt these including:
1. Shift the pH of the sample to an extreme (pH <3 or >9). By shifting the pH, this can cause proteins to precipitate and/or change the charge of the protein and/or analyte. If a precipitation occurs, continue working with the supernatant.
2. Precipitate the proteins. The most common way to precipitate proteins is to add three equivalents of a polar solvent, usually acetonitrile. After mixing, the sample is centrifuge to remove the protein pellet and the supernatant is used for further analysis.
3. Sonication. This is achieved by sonicating the biological fluid for 15 minutes, followed by diluting with either water or buffer and finally centrifugation.
Urine
This may not require pretreatment, however, it is common to dilute at least 1:1 with water or buffer adjusted to the appropriate pH. A strong acid (ex. 12 M HCl) or base (10 M KOH) is added and heated for 15–20 minutes when interested in acid or base hydrolysis. After the solution is cooled it is diluted in an appropriate solution. Alternatively, enzyme hydrolysis to free bound compounds may be used.
Cell Culture Media It is common practice to dilute the media with water or buffer at the appropriate pH. If the sample is particulate-laden, it will either need to be filtered or vortexed and centrifuged prior to extraction.
Milk Milk is often diluted with water or a mixture of water and a polar solvent (such as methanol). Proteins can be precipitated by treating with an acid. If precipation occurs, the sample will require centrifugation.
Water SamplesUsually extraction can occur without prior treatment. One exception if it is laden with solid particulates and it clogs the cartridge. In this case filtration may be required. Note, that filtration may reduce recoveries if the analytes are bound to the particulates.
Wine, Beer and Aqueous Beverages
These may be able to be extracted without pretreatment usually. One consideration is if the beverage contains alcohol. If RP is being used, dilution of the sample so the alcohol percent is below 10% may be required. If particulates are present, filtering or centrifugation may be required.
Fruit JuicesUsually processed without pretreatment. An exception is if the juice has high amounts of pulp, which will need centrifuged or filtered. A second exception is if the sample is viscous, in which case the sample should be diluted. Finally, fruit juices are acidic and may need to have the pH adjusted depending upon the analyte(s) of interest.
Liquid Pharmaceutical Since these are typically aqueous solutions, they are usually processed by RP or IE. If the sample is viscous, the sample will need to be diluted. Organic extracts of the preparation may be processed by NP.
Oils Hydrocarbons or fatty oils are generally processed by NP. They cannot be diluted with water (immiscible) and if dilution is required, a mid- to non-polar solvent is used.
Soil and SedimentThese matrices are typically extracted with mid- to non-polar solvents via a Soxhlet extraction or sonication. Resulting extracts are normally processed by NP to remove interferences. At this time, the sample may be dried and resuspended in an appropriate solvent/solution for choice of SPE methodology.
Plant tissue, fruit, vegetables, and grains
For analytes that can be extracted by RP or IE, the material is homogenized in water and/or a polar organic solvent. After centrifugation or filtration, the pH of the sample may be adjusted. If the analyte(s) are not as miscible with polar solvents, the sample can be extracted by NP by homogenizing in a less polar solvent.
Meat, Fish, and Animal Tissue
These can be processed similar to the plant, fruit, and vegetables. In addition, hydrolysis or digestion of meat or tissue can be achieved with strong acids (HCl), bases (NaOH, KOH), or enzymatic.
Tablets and Other Solid Pharmaceutical Preparations
These solids should be crushed into a fine powder and extracted with the appropriate solvent/solution depending upon the SPE method being used.

22
Figure 24. Depiction of BioSPME Extraction showing analyte adsorption vs extraction time. Small analytes are extracted as macromolecules and protein bound analytes are excluded from extraction by the coated pin.
Figure 25. Supel™ BioSPME 96-Pin Devices. Available to extract from 96-well plates, these are designed to perform multiple extractions at the same time using a series of well-plates, whether through manual or automated process.
BioSPMEBioSPME, or bioanalytical solid phase microextraction devices are comprised of particles embedded in an inert binder and immobilized onto a durable base, such as a polypropylene 96-pin device.
The BioSPME extraction does not require pretreatment of the sample. The coated portion of the BioSPME pin is preconditioned and quickly rinsed with water prior to immersion directly into the sample for extraction. While immersed, the binder selectively allows small analytes of interest to bind to the adsorbent particles, while larger macromolecules are excluded. The adsorption mechanism for BioSPME is based on partitioning of analytes between the solution (sample) and the pin coating. The rate of this partitioning is dependent upon the affinity of the analyte for the phase coating compared to the affinity for the sample matrix. BioSPME is not an exhaustive technique, rather, after a given amount of time, equilibrium is achieved between the concentration of analytes in the sample matrix and the pin coating.
This allows for a robust and selective non-exhaustive extraction of free analyte that can be employed in both qualitative and quantitative applications. The 96-pin configuration allows for direct sampling from 96 well plates and is compatible with robotic liquid handling systems providing a fully automated high-throughput methodology.
Macromolecules Proteins bound to small analytesSmall analytes of interest
BioSPME Pin
Anal
yte
Ads
orpt
ion
Extraction Time
Supporting Core
Sample Well
Functionalized ParticlesEmbedded in an Inert Binder
Sample (whole blood, plasma, serum, urine, saliva, etc.)
Selection of initial conditions
Mode of separationWhen selecting the most suitable mode of separation, it is dependent on sample solubility and how the analytes of interest differ from other compounds or matrix in the sample. The type of surface modification used influences the selectivity of a stationary phase. There are several different modes of separation to be distinguished:
Reversed phase In reversed phase mode, the mobile phase is polar and the stationary phase is less polar. The major distinction between analytes is their hydrophobicity where samples should be soluble in water or a polar organic solvent.
The retention mechanism is based on partition of the analytes between quasi-liquid stationary phase layer and mobile phase. As a modification of the packing material for example n-octadecyl (RP-18), n-octyl (RP-8), n-butyl (RP-4), or phenyl are applied—a combination with or without an endcapping step is possible. Amino-, cyano- and diol-modified, Pentafluorophenyl (PFP or F5) and RP-Amide stationary phases can also be operated under reversed phase conditions. Furthermore, a so-called PAH material is available, designed for the selective separation of polycyclic aromatic hydrocarbons.
Reversed phase mode is mainly applied for the separation of non-polar to medium polar analytes (highly polar and ionic compounds should be combined with ion-pair reagents), hydrocarbons, alcohols, phenols, amines, carboxylic acids and derivatives with hydrophobic molecule parts as well as compounds with hetero-atoms.
Typical solvents utilized in reversed phase chromatography are organic solvents miscible with mixtures of water and aqueous buffer solutions. In order of decreasing miscibility, these are: methanol, acetonitrile, ethanol, isopropanol, dimethyl formamide, n-propanol, dioxane and tetrahydrofuran. In general, all stationary phases can be utilized under highly aqueous conditions. Depending on the water content in the mobile phase, and the specific characteristics of the stationary phase (surface coverage), phase dewetting and a subsequent drop of capacity can occur after prolonged flushing with pure water. In order to avoid such a phenomenon, it is recommended to keep 5% organic solvent in the mobile phase. In case of column dewetting, indicated by a strong decrease of capacity factors, phase properties can be recovered by flushing with an organic solvent.
Phenyl stationary phases can be used for the separation of aromatic compounds. Analyte retention is performed via several different mechanisms, including π-π inter-actions and partitioning between the mobile phase and the hydrophobic aryl-alkyl phase. Phenyl stationary phases are in most cases combined with methanol as an or-ganic solvent in order to promote aforementioned π-π interactions with analyte molecules.

23
Normal phase (polar) and medium polar phase In normal phase, the mobile phase is non-polar while the stationary phase is more polar. This is the same for hydrophilic interaction liquid chromatography. In normal phase, the major distinction between analytes is NOT their hydrophobicity, and where the samples should be soluble in a hydrophobic solvent like hexane and the mobile phase is a weak to moderate solvent for the sample.
An interaction of the active sites of the polar stationary phase surface with polar parts of the sample molecules leads to retention in normal phase chromatography.
Polar substances such as unmodified SiO2 (ideally suited for the separation of fat-soluble vitamins, small organic molecules or pharmaceuticals) or Al2O3 act as a stationary phase. In addition, a modification yielding medium polar phases is possible:
• NH2: The (silica) surface is derivatized with an aminopropyl silane. The resulting phase can be applied in the separation of carbohydrates or oligosaccharides in normal or reversed phase mode.
• CN: Derivatization with polar cyano entities. For the separation of charged, unpolar to semipolar substances: Tetracycline antibiotics, steroids, organic acids, peptides, proteins.
• Diol: Diol modified surface with specific selectivity for compounds with double bonds (azo dyes), peptides, proteins and malto-oligosaccharides.
Medium polar phases (“polar bonded phases”) can generally be utilized both in normal phase and reversed phase mode (HILIC) when the eluent properties are adjusted accordingly. They possess both polar properties from their functional groups and non-polar (hydrophobic) properties by -(CH2)n-spacers. A cyano modified packing material can act as a normal phase system when combined with an non-polar mobile phase, while the addition of water (or buffer) to the eluent increases its polarity and allows for separations in reversed phase mode. The main application for the diol phase is normal phase chromatography, and reversed phase chromatography for the amino bonded phase. In normal phase chromatography, the polar bonded phases have the advantage of a shorter conditioning time than silica phases.
Typical analytes in normal phase chromatography are non-ionic unpolar to medium-polar compounds such as hydrocarbons, ethers, esters, alcohols, amines or carboxylic acids and derivatives.
Normal phase chromatography works best with isopro-panol, ethyl acetate, tetrahydrofuran, t-butylmethyl ether, dichloromethane or hexane. These solvents need to be mixed according to the characteristics of both analytes and stationary phase characteristics in order to provide a suitable elution strength.
Depending on the mode in which they are used, medium polar phases can be combined with any of the aforementioned reversed and normal phase eluents and solvents.
Chiral separations In chiral separations, the chromatographic result is determined by the three dimensional structure of a solute. Chiral selectors bonded to a base particle display a broad enantioselectivity and can be used for the chiral separation of enantiomers of numerous different substance classes (hydrocarbons, steroids, phenol esters and derivatives, aromatic amines, heterocycles with 5 to 7-membered rings) using typical RP or NP eluents (depending on the type of selector).
One widespread chiral selector is β-cyclodextrin covalently linked to a base particle. Cyclodextrins are cyclic oligosac- charides consisting of α-1,4-glycosidically linked D-glucose units. β-cyclodextrin consists of 7 glucose units, respec-tively. Geometrically seen, cyclodextrins can be described as truncated cones, where all secondary hydroxyl groups are directed towards the larger opening, whereas primary hydroxyl groups form the smaller opening at the other end. The result is a hydrophobic inner cavity, in contrast with the two hydrophilic openings. Since cyclodextrins are made up of chiral D-glucose units, the structure may be regarded as a chiral selector. The enantiomers of a racemic substance mixture, due to their opposite configurations, can now be associated—to different degrees—with the cyclodextrin molecule. Consequently, diastereomeric “inclusion complexes” are formed based on hydrophobic interaction (between cavity and guest molecule) and stereoselective hydrogen bonds (between the C2 and C3 hydrogen groups of glucose molecules and the guest molecule).
Other available selectors are (macrocyclic) glycoproteins, (3,5-dimethylphenylcarbamate)-derivatized cellulose, copper ligands, polycyclic amine polymers or cyclofructans.
Glycoprotein Chiral Phases (CHIROBIOTIC®)CHIROBIOTIC® phases are based on covalently bonding macrocyclic glycoproteins to a high purity 5 micron silica gel in such a way as to establish it’s stability while retaining essential components for chiral recognition. CHIROBIOTIC® V and V2 are based on bonding Vancomycin, which contains 18 chiral centers surrounding three pockets or cavities. Five aromatic ring structures bridge these strategic cavities. Hydrogen donor acceptor sites are readily available close to the ring structures. CHIROBIOTIC® V has demonstrated selectivity similar to glycoprotein phases except it is stable from 0–100% organic modifier and exhibits high sample capacity.
For CHIROBIOTIC® V2, changes to the linkage chemistry and silica offer improvements for preparative LC and for more demanding chiral separations. CHIROBIOTIC® T, T2, and TAG are based on bonding the amphoteric glycopeptide, Teicoplanin, which contains 23 chiral centers surrounding four pockets or cavities. For CHIROBIOTIC® T2, changes to the linkage chemistry and silica offer improvements for preparative LC and for more demanding chiral separations. CHIROBIOTIC® TAG has the sugars removed from the macrocyclic glycopeptide to produce an aglycone structure as a variant of CHIROBIOTIC® T. CHIROBIOTIC® R is based on bonding Ristocetin A to high purity 5 micron silica.

24
Cellulose DMP Chiral ColumnsCellulose DMP is a chiral stationary phase (CSP) comprising spherical, high-purity porous silica coated with DMPC (3,5-dimethylphenyl carbamate)-derivatized cellulose, and packed in analytical to preparative size HPLC columns. It separates a wide range of chiral compounds under normal phase, polar organic, and SFC conditions, with high efficiency, high loading capacity, and excellent column lifetime. Performance is comparable to other DMPC-derivatized cellulose CSPs.
Key Features and Application Areas:
• Classic DMPC-cellulose chiral selectivity
• Efficient, rugged, reproducible, and scalable
• Low backpressure
• Ideal for chiral analysis in the pharmaceutical industry and for small analytes in chemical and environmental areas
• Routine chiral column method development screening protocols
• Approximately one-half the cost of most DMPC-cellulose columns
Copper Ligand Exchange (CLC) Chiral ColumnsThe CLC phases are based on coupling an enantiomeric form of an amine to a proprietary derivative to create an appropriate distance for copper coupling. Using the copper ligand concept, this phase resolves hydroxy acids like lactic, malic, tartaric and mandelic. This phase can also resolve amino acids and other amines by the same mechanism. It has been reported that, in addition to amino acids, other bifunctional racemates like amino alcohols can be resolved. In theory, any analyte that can complete the coordination with the copper ion can be resolved. For the CLC-D column,the L enantiomer generally elutes before D with the exception of tartaric acid where the D elutes first. The CLC-L column has the opposite elution order and the D enantiomer elutes before L.
Protein-Based Chiral ColumnsHermansson described the use of natural proteins immobilized onto a silica support for chiral separations in 1983. Proteins contain a large number of chiral centers of one configuration, and many other sites that contribute to the general retention process. We offer three CSPs with proteins as the chiral selectors, CHIRALPAK AGP (a1-acid glycoprotein), CHIRALPAK CBH (cellobiohydrolase) and CHIRALPAK HSA (human serum albumin). They are typically used in reversed-phase mode, and perform a wide variety of chiral separations. CHIRALPAK HSA is also used for drug-binding studies. Solutes are retained by three types of interactions: ionic (for charged solutes), hydrophobic and hydrogen bonding. The relative contribution of the different forces to solute retention depends on the nature of the analyte.
Choose the right HPLC columnChromatographic resolution is mainly affected by the selectivity (α), as can be seen in Figure 26 in the stationary phase selection section of this guide. Changing the mobile phase composition or the stationary phase is the most powerful way of optimizing selectivity, whereas the particle size, pore size, length of the column, temperature, mobile phase strength have much less effect. Therefore, if satisfactory results are not met, or no retention is achieved, it is better to change to another selectivity using a different column type and/or a different mobile phase.
The column backboneThe column backbone of a chromatography column can consist of either a particle packing, or a monolithic structure. Independent from the chemical characteristics of the silica or polymeric backbone, the chromatographic properties of a column are strongly influenced by the resulting particle packed or monolithic structure.
Monolithic HPLC columnsMonolithic HPLC columns consist of a single piece of high-purity and metal free monolithic silica gel (see scanning electron microscopic image in Figure 26). The mesopores within the silica skeleton form the
Figure 26. Scanning electron microscopic image of the cross section of a monolithic silica column. The total porosity of the monolith is > 90%. Left image: Mesoporous silica skeleton, right image: Macroporous transport pore.

25
fine porous structure and create the large uniform surface area on which adsorption takes place, thereby enabling high performance chromatographic separation. Macroporous transport pores enable rapid flow of the mobile phase and low back pressure analyses. The diameter of both types of pores, as well as the diameter of the skeleton can be independently fine-tuned. For this reason, monolithic silica columns can be tailor-made for a large variety of applications such as small molecule analysis, as well as separation of large biomolecules (see summarized pore size data of monolithic silica analytical HPLC columns in Table 9).
Currently, silica monolithic and organic polymer monolithic columns are available, the latter can often lack sufficient capacity and mechanical stability. In this respect, silica monoliths are advantageous, as they do not swell or shrink in organic solvents. They show much higher capacities due to their high surface area and do not exhibit micropores that can lead to peak tailing. In contrast, a strongly basic eluent pH can be an issue when working with silica based monoliths. Make sure that mobile phase pH matches the characteristics of your column backbone.
Table 9. Pore size data of selected monolithic silica analytical HPLC columns.
ProductDiameter (mm) Modification
Macropore size (µm)
Mesopore size (Å)
Chromolith® CapRod®
0.05 0.2
RP-18e 2 130
Chromolith® CapRod®
0.1 RP-8e RP-18e
2 130
Chromolith® CapRod® HighResolution
0.1 0.2
RP-18e 1 130
Chromolith® 2 RP-18e 1.5 130
Chromolith® 3 4.6
RP-8e RP-18e
2 130
Chromolith® 4.6 Phenyl CN DIOL Si NH2
2 130
Chromolith® HighResolution
2 4.6
RP-18 RP-8e RP-18e Protein A Epoxy
1.15 150
Chromolith® 10 25
Si 2 130
Chromolith® 10 25
RP-18e 2 130
Chromolith WP 2 4.6
RP-18 RP-4 Protein A Epoxy
2 µm 300 Å
The use of HPLC columns containing 2 or 3 μm small silica particles often results in high back pressure. This high back pressure can damage both the column and HPLC system; therefore, traditional HPLC columns have a limited length and a limited number of theoretical plates. Attempts have been made to increase the plate count by decreasing the particle size (see also chapter below). Resulting UHPLC columns display high back pressures
and make the use of dedicated HPLC systems necessary. This needs to be taken into account when considering the application of 2 μm or sub-2 μm particles.
Note that UHPLC equipment and columns are not necessarily required in order to perform ultra-high performance separations—it is more a matter of time required to achieve a specific separation efficiency. As long as a column, such as a monolithic silica column, allows for high flow rates at a tolerable back pressure, such separations can also be performed on robust and economically priced standard HPLC equipment. In addition, low-pressure gradients can typically be run with up to four eluents without extra costs. In UHPLC separations, and under high-pressure gradient conditions, additional pumps would be necessary to perform the same experiment.
If the plan is to speed up the separation processes and accelerate analyses in general, then increasing the flow rate of an existing chromatographic method utilizing a particle packed column can quickly exceed both column and system pressure limits. Monolithic (silica) columns can be an option to overcome those limitations of particulate columns and to make the method quicker, as their back pressure is generally lower. Figure 27 shows an example of speeding up a method using a monolithic column.
Compared to a 5 μm particulate column, you can expect an increase in analysis speed by a factor of four, while the separation efficiency will be on the same level as the theoretical efficiency of 4.5 μm particulate columns (data for Chromolith® Performance; the theoretical efficiency of Chromolith® HighResolution columns is equivalent to the theoretical efficiency of 2.4 μm particulate columns). In addition, you can run flow rates of up to approximately 9 mL/min under suitable conditions (mobile phase composition, column dimension) without reaching HPLC system pressure limits. Alternatively, coupling of multiple columns can be a means of achieving high efficiencies at normal pressures. In addition, a low column back pressure puts you into the position to replace acetonitrile by more viscous solvents such as isopropanol in MS experiments—an option that can help to improve the sensitivity of a separation.
Figure 27. Higher throughput on a monolithic silica HPLC column. Chromatographic conditions: Chromolith® HighResolution RP-18 endcapped 10 cm x 4.6 mm I.D.; mobile phase: acetonitrile/water 40/60 (v/v); flow rate 1–5 mL/min; detection 254 nm; temperature: ambient; injection volume 5 µL, sample: 1 thiourea, 2 biphenyl-4-4’-ol, 3 biphenyl-2,2’-ol, 4 biphenyl-4-ol, 5 biphenyl-2-ol.
1 mL/min, 39 bar
2 mL/min, 76 bar
3 mL/min, 115 bar
4 mL/min, 152 bar
2 4Retention time (min)
6 85 mL/min, 193 bar
0

26
As can be seen from van Deemter plots of monolithic silica columns in Figure 28, the influence of an increased flow rate does not significantly decrease separation efficiency. This fact means that one can work flexibly and in a wide range of flow rates with minimal loss of peak resolution.
If gradients from highly aqueous to highly organic conditions are run, subsequent reequilibration will be more time consuming as compared to working in a narrow eluent composition range. Monolithic columns will perform this step of the analysis faster than particle packed columns of similar dimensions.
When working in a high-throughput environment, the properties of a monolithic column might also be beneficial. For in-house pharmaceutical R&D, small molecule analysis (e.g., analysis of yield and/or byproduct formation) is performed on a monolithic silica column. The performance of the setup needs to be checked for consistency by the injection of a standard mixture of theophylline, caffeine and 2-amino-5-chlorobenzophenone every workday morning. Figure 29 displays the results of several of those randomly picked test runs (number of injections given as the combined numbers of standard and test runs).
Analytical monolithic silica columns are available in a range of diameters from 0.05 to 25 mm. Depending on your specific needs, you might pick a small I.D. (e.g., 2 mm) for fast and solvent saving gradient runs in low dead volume HPLC systems combined with MS detection. Column length (ranging from 25 to 150 mm) then mainly depends on the complexity of a sample and the speed of analysis needed. For an ultra-fast separation of simple mixtures, a Chromolith® Flash column (25 mm length) should be chosen, whereas for the separation of more complex mixtures columns of 100 or 150 mm length are more suitable. For details on the specific properties of the different bonded stationary phases, please see subchapter above.
For the analysis of small sample amounts and/or when increased sensitivity is needed, large bore analytical columns are not suitable. Instead, (monolithic) capillary columns for nano-LC are recommended. They are available with internal diameters of 50 to 200 μm and different bonded phases (RP-8e: C8, RP-18e: C18). Column length (15 or 30 cm) should be chosen in accordance with sample complexity and they are not available as one but few columns should be connected using coupling unit. Such columns can be operated at rather high flow rates (1–3 μL/min compared to 200–400 nL/min for conventional media on a particle packed 100 μm I.D. LC capillary column). Capillary columns can be combined with online (ESI, nano spray) or offline (MALDI) MS detection. Major application areas are the separation and analysis of biomolecules (peptides, proteins, etc.) and the trace analysis of contaminants in food and environmental samples.
For further details about the proper choice of column format, see subchapter below.
Figure 28. van Deemter plots of selected monolithic silica HPLC columns.
Chromolith® HR—4.6 mm
Chromolith® 100—4.6 mm
Chromolith® 100—3 mm
Chromolith® 100—2 mm
35
30
25
20
15
10
5
00 1 2 3 4
Linear velocity (mm/s)
H (
µm
)
Figure 29. R&D small molecule analysis. Results of everyday standard runs testing the performance of a monolithic silica column. The total number of injections is the combined numbers of test and standard runs.Chromatographic conditions: Chromolith® Performance RP-18 endcapped 10 cm x 3.0 mm I.D.; mobile phase: A: water + 0.05% formic acid, B: acetonitrile + 0.04% formic acid; gradient: 0 min 99% A, 1.8 min 0% A, 2.5 min 0% A; flow rate 0.4 mL/min (MS; HPLC flow 2 mL/min, post-column split); injection volume 1 µL; detection pos. API-MS, m/z range 85–800; sample: 1 theophylline, 2 caffeine, 3 2-amino-5-chlorobenzophenone (1 mMol each) dissolved in methanol/water 50:50 (v:v).
Cl
O
N N
NN
N 1 2
3N
HN
NCH3
CH3H3CH3C
CH3
OO
O O NH2
Retntion time (min)0.00 0.50 1.00 1.50 2.50
10059
9405
8644
7836
7022
6049
5186
4371
3533
2739
1760
902
8
total number of injections
2.00
MS I
nte
nsi
ty

27
Particulate HPLC columnsParticle packed columns are well known and established in laboratories worldwide. Particles used for column packing can either be spherically or irregularly shaped with the former being available as fully or superficially porous material. An inherent property of particle-packed columns is the mutual dependence of particle diameter and back pressure. In other words, a decrease of particle diameter is desirable in order to increase column efficiency, but there is always a tradeoff with back pressure, especially when it comes to high speed separations. Currently, a lot of effort is put into the development of sub-2 μm particle packed columns to be used in combination with special UHPLC equipment. Particle size reduction leads to a decreased diffusion path length as well as a minimized C term (mass transfer, see chapter 1). As a consequence, the gain in plate count is substantial, while the increase in back pressure is increasing by a factor of four when reducing the particle size by half (Figure 30).
In contrast to particles, monolithic columns show a very low column backpressure. They owe their rapid separation speed to their unique bimodal pore structure of macro and mesopores. The macropores reduce column back pressure and allow the use of faster flow rates, thereby considerably reducing analysis time.
(see also Figure 31: p/u curves for different particulate columns in comparison with a monolithic column).
Regardless of particle diameter, two types of spherical particles are available: fully porous particles and superficially porous particles (FPPs and SPPs, respectively). FPPs (or “fully porous particles”) are well known and established in the chromatographic community, whereas SPPs (“fused core particles”) are a relatively new devel-opment. SPPs are prepared by depositing a mesoporous shell onto a solid and nonporous core. The particle size distribution of the core shell particles is narrow, and eddy diffusion (A term) is reduced. Due to the short diffusion path, axial dispersion of solutes is reduced and peak broadening is minimized (see Figure 32).
SPPs combine the advantages of high efficiency and low back pressure. On the other hand, FPPs provide higher capacities.
Figure 30. Effect of Particle Size on Efficiency and Pressure
Figure 31. p/u curves for Purospher™ STAR (2 μm) RP-18 endcapped 5 cm x 2.1 mm I.D. (top), Purospher™ STAR (3 μm) RP-18 endcapped 5 cm x 2.1 mm I.D (middle) and Chromolith® FastGradient RP-18 endcapped 5 cm x 2.0 mm I.D. (bottom) utilizing acetonitrile/water 60/40 (v/v) as a mobile phase and thiourea as a dead time marker.
Solid Core
Solid Core
2.7 µm
2.7 µm 5 µm
3.3 µm~5 µm
0.6 µm
1.7 µm
0.5 µm
Fused-Core Particles Traditional Porous Particles
Fused-Core Particles Traditional Porous Particles
Figure 32. Structure of SPPs (top) and its influence on peak shape: Minimized peak broadening by short diffusion path (reduced axial dispersion of solutes, middle) and narrow particle size distribution (reduced eddy diffusion, bottom).
Fused-Core Particles Traditional Porous Particles
Solid Core
Solid Core
2.7 µm
2.7 µm 5 µm
3.3 µm~5 µm
0.6 µm
1.7 µm
0.5 µm
Doubling the efficiency by halving the particle size results in a pressure increase by a factor of four.
Particle (µm) psi bar N1.8 5889 406 27,5002.5 3089 213 20,0003 2118 146 16,5005 769 53 10,00010 189 13 5,00015 87 6 3,75020 44 3 2,500
Column length: 10 cm, 3 mm/s linear velocity
30,000
25,000
20,000
15,000
10,000
5,000
00 5 10 15 20
Effi
cien
cy (
N) N 1
dP
400350300250200150100500
Pre
ssure
(bar
)
P 1dP
2
0 5 10 15 20
dp (µm)
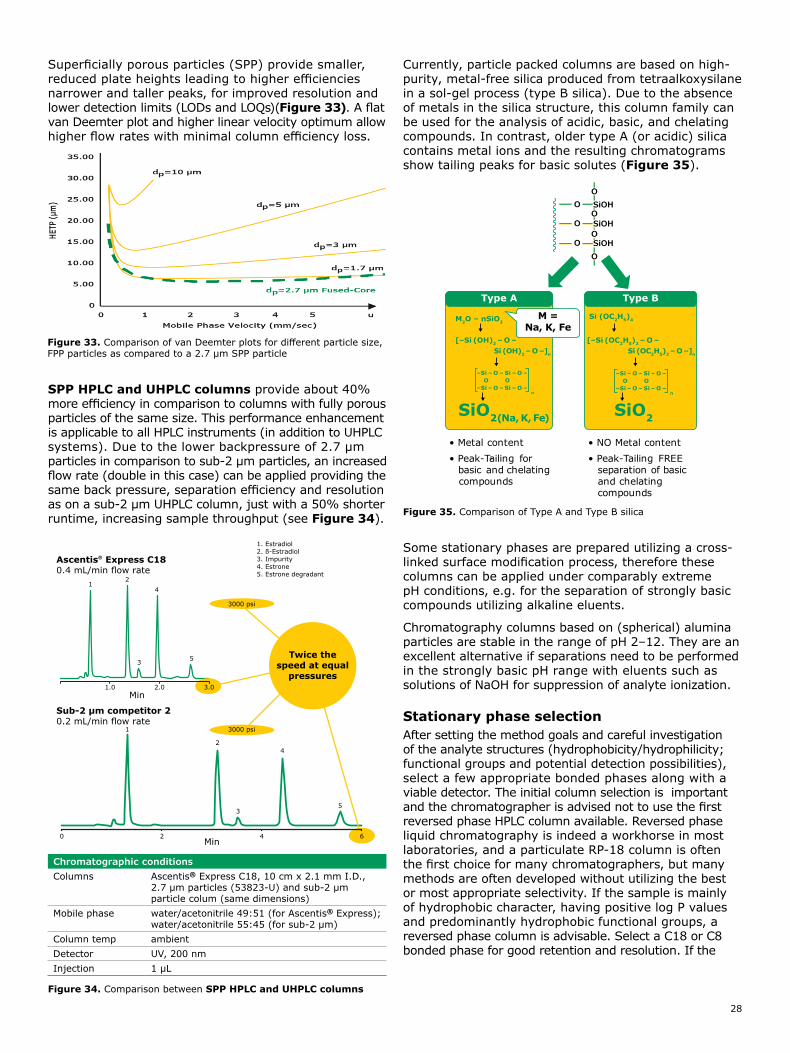
28
Superficially porous particles (SPP) provide smaller, reduced plate heights leading to higher efficiencies narrower and taller peaks, for improved resolution and lower detection limits (LODs and LOQs)(Figure 33). A flat van Deemter plot and higher linear velocity optimum allow higher flow rates with minimal column efficiency loss.
SPP HPLC and UHPLC columns provide about 40% more efficiency in comparison to columns with fully porous particles of the same size. This performance enhancement is applicable to all HPLC instruments (in addition to UHPLC systems). Due to the lower backpressure of 2.7 µm particles in comparison to sub-2 µm particles, an increased flow rate (double in this case) can be applied providing the same back pressure, separation efficiency and resolution as on a sub-2 μm UHPLC column, just with a 50% shorter runtime, increasing sample throughput (see Figure 34).
Currently, particle packed columns are based on high-purity, metal-free silica produced from tetraalkoxysilane in a sol-gel process (type B silica). Due to the absence of metals in the silica structure, this column family can be used for the analysis of acidic, basic, and chelating compounds. In contrast, older type A (or acidic) silica contains metal ions and the resulting chromatograms show tailing peaks for basic solutes (Figure 35).
Some stationary phases are prepared utilizing a cross-linked surface modification process, therefore these columns can be applied under comparably extreme pH conditions, e.g. for the separation of strongly basic compounds utilizing alkaline eluents.
Chromatography columns based on (spherical) alumina particles are stable in the range of pH 2–12. They are an excellent alternative if separations need to be performed in the strongly basic pH range with eluents such as solutions of NaOH for suppression of analyte ionization.
Stationary phase selectionAfter setting the method goals and careful investigation of the analyte structures (hydrophobicity/hydrophilicity; functional groups and potential detection possibilities), select a few appropriate bonded phases along with a viable detector. The initial column selection is important and the chromatographer is advised not to use the first reversed phase HPLC column available. Reversed phase liquid chromatography is indeed a workhorse in most laboratories, and a particulate RP-18 column is often the first choice for many chromatographers, but many methods are often developed without utilizing the best or most appropriate selectivity. If the sample is mainly of hydrophobic character, having positive log P values and predominantly hydrophobic functional groups, a reversed phase column is advisable. Select a C18 or C8 bonded phase for good retention and resolution. If the
Figure 33. Comparison of van Deemter plots for different particle size, FPP particles as compared to a 2.7 µm SPP particle
Figure 34. Comparison between SPP HPLC and UHPLC columns
Figure 35. Comparison of Type A and Type B silica
Chromatographic conditionsColumns Ascentis® Express C18, 10 cm x 2.1 mm I.D.,
2.7 µm particles (53823-U) and sub-2 µm particle colum (same dimensions)
Mobile phase water/acetonitrile 49:51 (for Ascentis® Express); water/acetonitrile 55:45 (for sub-2 µm)
Column temp ambientDetector UV, 200 nmInjection 1 µL
O
O
O
SiOH
SiOH
SiOH
O
O
O
O
Type A
M2O – nSiO2
[–Si (OH)2 – O –
SiO2(Na, K, Fe) SiO2
Si (OH)2 – O –]n
Si (OC2H5)4
[–Si (OC2H5)2 – O –Si (OC2H5)2 – O –]n
n
–Si – O – Si – O –
–Si – O – Si – O –O O
Type B
n
–Si – O – Si – O –
–Si – O – Si – O –O O
M = Na, K, Fe
• Metal content
• Peak-Tailing for basic and chelating compounds
-
• NO Metal content
• Peak-Tailing FREE separation of basic and chelating compounds
0 2
1.0
1
3 5
42
1
2
3
4
5
2.0 3.0
3000 psi
3000 psi
4Min
Min
Twice the speed at equal
pressures
Sub-2 µm competitor 20.2 mL/min flow rate
Ascentis® Express C180.4 mL/min flow rate
1. Estradiol2. ß-Estradiol3. Impurity4. Estrone5. Estrone degradant
6

29
sample molecules have aromatic backbones and C18 or C8 columns are unable to resolve all components, then a change to a phenyl column where, in addition to hydrophobicity, π-π interactions between the stationary phase and sample molecules provide a different selectivity. As previously mentioned it is, however, important to use alcohols as the mobile phase organic modifier while working with phenyl columns. Acetonitrile, or any solvent with double or triple bonds (π-π bonds) in the backbone, will diminish the interaction and make the phenyl column interact only with hydrophobicity.
Resolution is mainly controlled by selectivityResolution, R, can be expressed in terms of three parameters (k, α, and N) which are directly related to experimental conditions. The parameters k and α, are determined by the experimental conditions (composition of the mobile phase; stationary phase chemistry and temperature; see also chapter 1), and where N is affected by column length L, particle size and pore size. Figure 36.
The column selectivity has the highest influence on resolution in chromatography. Therefore, the selection of the best suitable column chemistry for the target analytes is an important selection parameter. C18 column chemistries are typically the first choice. Nevertheless, when a C18 doesn't give the desired separation or the sample contains compounds that are known to be difficult to retain or resolve on a C18, consider other stationary phase chemistries.
If the method is intended for bioanalysis, analysis of matrix-rich samples in general, or where proper sample preparation is unwanted or not possible, a monolithic reversed phase column (e.g. Chromolith®) is a supe-rior choice over a particulate column. For example, Chromolith® RP-18 endcapped is a better choice over Purospher™ STAR RP-18e or any other particulate HPLC Column for such purposes as it has good matrix tolerability and long column lifetime.
If samples are clean and/or good sample preparation will be included in the final method, and high peak capacity is needed, a particulate column with small particles and small pores may be more useful. Choose columns which are known to have long lifetime at the operating mobile phase pH. Choose bonded phases based on high-purity, low-acidity silica for best peak shape. If the sample consists of polar and hydrophilic analytes, an orthogonal selectivity to reversed phase should be selected. If chiral resolution is defined in the method goal, then a suitable chiral column should be chosen. Use analyte specific structure information (chemical structure, log P values etc.) to choose a proper stationary phase (Figure 37 and Table 10). If acidic or basic analytes are present in the sample; reversed phase ion suppression (for weak acids or bases), reversed phase ion-pairing (for strong acids or bases) or HILIC should be used. For low/medium polarity analytes, normal phase HPLC or HILIC are viable techniques.Figure 36. Key parameters that control resolution and their overall
contribution to changes in resolution
Figure 37.
C30
USP L62
C18
USP L1
C8
USP L7
Phenyl
USP L11
Amide
USP L68
ZIC
USP L114
F5 (PFP)
USP L43
RP-Amide
USP L60
Cyano
USP L10
OH 5
USP L95
Si
USP L3
Diol
USP L20
Amino
USP L8
AQ C18
USP L1
Reversed phase HILIC
Polar compounds with high water
content
Pi-Pi Interactions
Closely related compounds HILIC
Retention too short or inadequate Separation on RP-18Poor Peak
Shape (Basic Compounds)
Too much retention on C18
Aromatic compoundsIsomers
Hydrophobic Hydrophilic
8 0 -8
Log P
3
2.5
2
1.5
1
0.5
0
[R5]
1 1.05 1.1 1.15 1.2 1.25
α
N
k
0 5000 10000 15000 20000 250000 5 10 15 20 25

30
Choosing the right column formatUse the column selection guide below (Table 11) to find the best column configuration for minimum analysis time with high efficiency and resolution, and match up method goals to make sure that the chosen format has the ability to produce resolution for the purpose of the application, e.g. choose the right column length, column inner diameter, particle size and pore size.
Selection by column dimension Depending on the scale of a separation and/or a needed separation efficiency of a separation, a column dimension specified by column inner diameter (i.d.) and column length has to be chosen.
Table 10. Polarity scale of analyte functional groups.
Polarity Functional Group Hybridization Intermolecular Forces
Low Methylene s London
Phenyl s/p London
Halide s London, dipole-dipole
Ether s London, dipole-dipole, H bonding
Nitro s/p London, dipole-dipole, H bonding
Ester s/p London, dipole-dipole, H bonding
Aldehyde s/p London, dipole-dipole, H bonding
Ketone s/p London, dipole-dipole, H bonding
Amino s/p London, dipole-dipole, H bonding, Acid-base chemistry
Hydroxyl s London, dipole-dipole, H bonding
High Carboxylic acid s/p London, dipole-dipole, H bonding, Acid-base chemistry
Table 11.
Column dimension (length x i.d. in mm) Application Reason
4 x 4 5 x 2/3/4.6 10 x 4.6/10/25
Guard-column Protection from mechanical contamination Sample contaminated to low extent
25 x 4 Precolumn High capacity precolumn
30 x 2/2.1/3/4 55 x 2/2.1/3/4 75 x 4
Method development Rapid HPLC and UHPLC (if pressure stable)
Short retention time Rapid equilibration Low solvent consumption (small i.d.) Low pressure drop
100 x 2.1 125 x 2/3 150 x 2.1/3
High detection sensitivity (mass selectivity)
Semi-micro column for low injection volumes and low peak dispersion Low solvent consumption
100 x 4.6 125 x 4/4.6 150 x 4.6
Standard column Adequate performance for most applications (average performance 8000–10000 N/columns)
250 x 2/2.1/3 High detection sensitivity High performance separation
Semi-micro column for low injection volumes and low peak dispersion Low solvent consumption For complex samples
250 x 4/4.6 High performance separation For very complex samples
250 x 10 Semi-preparative For mg quantities of pure substance on lab scale
250 x 25 Preparative For g quantities of pure substance
Guidelines for typical flow rate and orientation values for the loading capacities of analytical and semi-preparative columns
Column dimension (length x i.d. in mm) Typical flow ratea Sample amount Sample volume
150 x 1 0.06 mL/min ~0.05 mg 0.05–1 µL
250 x 2 0.25 mL/min ~0.2 mg 0.2–5 µL
250 x 3 0.6 mL/min ~1 mg 1–20 µL
250 x 4 1 mL/min ~5 mg 5–80 µL
250 x 10 6 mL/min ~30 mg 30–500 µL
250 x 25 39 mL/min ~200 mg 200–3000 µL

31
If high mass loadability is needed, or if the sample is complex, a larger column (in both length and diameter) is recommended, as it can accommodate more mass. If working with traditional detectors like UV, RI, FL etc. then 4.6 or 3.0 mm I.D. columns are suitable. Depending on the specific needs, a small i.d. for fast and solvent-saving gradient runs in low dead volume HPLC systems combined with MS detection may be selected; for MS, a 2 mm or smaller I.D. column is generally recommended. If sufficient resolution is achieved, it is also possible to speed up the separation by increasing the flow rate or shortening the column length (e.g., a column of 25 mm length for an ultra-fast separation). For the separation of more complex mixtures, columns of 100 or 150 mm length are more suitable. When it comes to the analysis of small sample volumes, and/or when increased sensitivity is needed, large bore analytical columns are not suitable. Instead, capillary columns with internal diameters of 50 to 200 μm for nano-LC are recommended. Column length should be chosen according to the sample complexity.
Silica-based materials are physically strong and will not shrink or swell, being compatible with a broad range of polar and non-polar solvents, and are therefore often the initial choice. Most silica based columns are stable from pH 2–7.5, and, historically, polymeric packing materials provided better column stability under pH extremes. A polymer-based packing material, like ZIC®-pHILIC, is compressible and may shrink or swell with certain solvents. Care must therefore be taken if a polymeric column is used, and the upper back pressure limit is lower than corresponding silica based stationary phases.
Newer, type B high-purity silica-based phases, like Purospher™ STAR, are stable at pH 1.5–10.5, with the surface functional groups bound to the base silica particle at multiple attachment points via polymeric modification.
Particle sizeSmaller particle sizes provide higher separation efficiency and higher chromatographic resolution than larger particle sizes. However, larger particle sizes offer faster flow rates at lower column back pressure, and are less prone to clogging, and for these reasons are more tolerant to matrix effects. Typical particle sizes range from 3–10 μm, but 2 μm particle sizes are also available to maximize resolution A 5 μm particle size represents the best compromise between efficiency and back pressure for most non-high throughput applications (Figure 38).
Fast and ultra-fast separations on 2 μm and 3 μm particulate silica have become particularly important due to the need for high sample throughput and higher productivity in daily lab work. With the use of UHPLC methods with short columns, narrow inner diameters, and small particles sizes, it is possible to speed up analyses up to ten-fold, while decreasing solvent consumption by up to 90% and increasing sensitivity. Clogging and high back pressure can be an issue, therefore 3 μm particulate material is recommended for use with complex samples.
Pore sizeChoose a pore large enough to enclose the target molecule completely. If the molecule is larger than the pore, size exclusion effects will be seen, and it will be difficult or impossible to retain. For this reason, reversed phase wide-pore materials for the separation of peptides and low molecular weight proteins are available.
In general, packing materials with a smaller pore size have higher surface areas and higher capacities than packing materials with larger pore sizes. A larger surface area typically indicates a greater number of pores, and therefore a higher overall capacity. Smaller surface areas equilibrate faster, which is important for gradient elution analyses. Larger pores are better for interaction with large compounds, such as proteins.
Carbon loadFor silica-based, reversed-phase packing materials, carbon load indicates the amount of functional bonded phase attached to the base material. Phases with lower carbon loads are more weakly hydrophobic, which may significantly reduce retention times over phases with higher carbon loads. However, a higher carbon load will give higher capacity and often greater resolution, especially for compounds of similar hydrophobicity. Carbon load is not a relevant parameter for columns used in normal phase or HILIC mode.
EndcappingSilica-based, reversed-phase packing materials have free silanol groups that will interact with polar compounds. Endcapping the bonded phase minimizes these secondary interactions. Choose endcapped phases if secondary interactions with polar compounds are not wanted. Choose non-endcapped phases if enhanced polar selectivity is desired, for stronger retention of polar organic compounds.
2.0 3.02.0 3.02.0 3.0
50
40
30
20
10
0
50
40
30
20
10
0
50
40
30
20
10
0
Particle size: 10 µmN = 5,700Peak H = 23.35Rs = 1.42P = 58 bar
Chromatographic conditionsColumn: Ascentis® C18, 150 mm x 4.6 mmFlow: 1.8 mL/minMobile Phase: 70/30 ACN/WaterDetection: 254 nmTemp: 30 °CInjection Vol: 5 mLAnalytes: 1. o-Xylene (0.04mg/mL) 2. p-Xylene (0.01mg/mL)
Particle size: 5 µmN = 15,199Peak H = 36.38Rs = 2.32P = 115 bar
Particle size: 3 µmN = 23,411Peak H = 45.26Rs = 2.84P = 153 bar
Figure 38. Effect of Particle Size on Chromatographic Efficiency

32
Mobile phase selectionIn previous sections, insight has been given to mobile phase recommendations, solvent properties, and buffer components. A summary of starting conditions is presented in this section, along with a discussion about the difference between isocratic and gradient elution. The mobile phase solvent strength is a measure of its ability to elute analytes off the column. Solvent strength is generally controlled by the concentration of the solvent with the highest strength; for example, in reverse phase HPLC with aqueous mobile phases, the strong solvent would be the organic modifier but in normal phase and HILIC, the strong solvent would be the most polar. It is worth pointing out that cyano-bonded phases are easier to work with than plain silica for normal phase separations. The aim is to find the correct concentration of the strong solvent. With many samples, there will be a range of solvent strengths that can be used within the aforesaid capacity limits. Other factors (such as pH) may also affect the overall retention of analytes.
Isocratic elutionIn partition chromatography, the mobile phase should be a moderate to weak solvent for the samples to achieve peak focusing and not to compromise the actual separation. A good rule of thumb is to achieve a capacity factor (retention factor, k) of 2 to 5 for an isocratic method. In both RP and HILIC mode, the preferred organic solvent is acetonitrile for several reasons: favorable UV transmittance, low viscosity, and being easy to volatilize (important for MS, ELS and corona discharge, CA, detectors). Methanol is a reasonable alternative, hence it may be worth changing the organic solvent if resolution is not achieved, and adjust the percentage organic solvent in the mobile phase to accomplish maximum resolution and retention. Methanol and other alcohols are also the preferred choice as the mobile phase organic modifier while working with phenyl columns. Acetonitrile or any solvent with double or triple bonds in the backbone will diminish the π-π interaction and make the phenyl column interact only with hydrophobicity.
In reversed phase mode, the initial mobile phase pH should be selected with two considerations. Low pH that protonates column silanol groups and reduces their chromatographic activity is generally preferred, especially with non-endcapped columns. Mobile phases having pH 1 to 3 with 20–50 mM buffer (potassium dihydrogen phosphate, TFA or formic acid in water) is advisable depending on detection mode, and to increase temperature to reduce analysis time.
Mobile phase solvents should be water miscible, have low viscosity, low UV cut-off, be non-reactive, and for these reasons, acetonitrile, methanol and THF are used with RP columns. Not all RP methods are suitable under acidic conditions, and other pH intervals may provide different selectivity. Around neutral pH, dipotassium hydrogen phosphate or ammonium acetate (not a
true buffer, but rather a pH adjustable salt) are viable alternatives depending on detection mode. At high pH, dipotassium hydrogen phosphate and ammonium carbonate can be used as buffers to maintain pH above 8. Keep in mind that when working at high pH, only columns with wider pH tolerability should be used, and for this purpose Purospher™ STAR is an excellent choice. Inorganic buffers are not recommended with MS, ELS and CA detectors. These buffers are not volatile and may precipitate, and this is also the case when high percentages of organic solvent are used in the mobile phase (>70%).
Gradient elutionOften it is not possible to elute all analytes with a single mobile phase (isocratic) in the desired k’ (2–5) range. It is therefore advisable to use gradient elution where the mobile phase strength, and sometimes also pH and ionic strength, will change over time. Effectively, this means that early in the gradient the mobile phase elution strength is low, and where the elution strength is increasing with time according to a defined program that maximizes the number of peaks that can be resolved with a given resolution. This method results in the constant peak width observed in gradient elution, compared to isocratic elution where the peak width increases in proportion to retention time. Gradient elution is used to solve the general elution problem for samples containing mixtures of analytes with a wide range of polarities. Gradient elution will also give greater sensitivity, particularly for analytes with longer retention times, because of the more constant peak width (for a given peak area, peak height is inversely proportional to peak width). Common practice in method development is to run a scouting gradient first to decide whether to use isocratic or gradient elution.
If Δt/tG ≥0.25 use gradient elution If Δt/tG ≤0.25 use isocratic elution
Where Δt is difference in the retention time between the first peak and last peak in the chromatogram, tG is the gradient time; the time over which the solvent composition is changed. For most samples (unless they are extremely complex), short columns (10–15 cm) are recommended to reduce method development time. Such columns afford shorter retention and equilibration times. A flow rate of 1–1.5 mL/min should be used initially.
The direct disadvantages with gradient elution are the need of a more complex HPLC system, and the column requires re-equilibration after every analysis, which makes injection-to-injection lengthier than for an isocratic method. Gradient mode is not compatible with all detectors (i.e. RI and EC) and more variables need to be controlled to ensure method reproducibility. System dwell volume (gradient delay volume) becomes important especially in scaling a separation or whenever transferring a method between instruments and/or laboratories. Be aware that delay volumes will vary from instrument to instrument.

33
Gradient method developmentGood laboratory practice does not allow gradients from 100% aqueous to 100% organic. For method robustness (for better mixing, to prevent precipitation of salt, avoid column dewetting, and to provide more robust gradient profiles), it is advisable to keep minimum 5% of each component in all mobile phase bottles. In practice for a reversed phase method, this means mobile phase A contains 5% organic solvent and 95% aqueous, while mobile phase B contains 95% organic solvent and 5% aqueous.
Initially, run a wide scouting gradient (5-95 % B) over 40–60 minutes. From this run, decide whether isocratic or gradient elution is best for the application. If gradient mode is a more appropriate alternative, eliminate sections of the gradient and try to compress the analyte peaks in space as much as possible prior to the first and last eluting peak. To further improve the gradient profile and shorten overall cycle times (including re-equilibration), try to reduce the gradient and total run time. Keep in mind that a segmented gradient can be an effective tool to improve the separation. If there is a need to improve the separation of two closely eluting peaks; change the solvent strength by varying the fraction of each solvent (gradient shape and steepness); change column temperature; change the mobile phase pH (in small units); use different mobile phase solvents and/or buffer components; and/or use a different selectivity by changing the stationary phase.
Mobile phase preparationSolvents and buffers have to be miscible over the entire range of a chromatographic run and no buffer precipitation must occur. Degassing helps to prevent bubble formation and spikes in chromatographic runs; today, the pump module of many modern LC systems offers online degassing.
All eluent bottles have to be labeled properly and a shelf life has to be added. For aqueous buffers, the shelf life typically is not higher than one week. Exceeding this time span will, for example, cause microbial growth. Microbial growth can be prevented by adding 5% or more of organic solvent to the aqueous mobile phase. The shelf life of organic mobile phases is comparable to the manufacturer’s data printed on the original packaging.
Make sure that all mobile phase solvents and additives used in a chromatographic separation are completely miscible (solvent miscibilities) in order to avoid precipitation of additives in the HPLC system and in order to perform reproducible analyses. Solvents being completely miscible with all other solvents listed in table x are: Ethanol, isopropanol, dioxane, tetrahydrofuran, acetone and glacial acetic acid.
When performing a separation under isocratic conditions, a premixed mobile phase has to be utilized. Shifts in retention times caused by irreproducible mixing of a mobile phase by the HPLC pump unit are avoided. Premixed eluents have to be prepared by separately measuring the appropriate volumes of each solvent in order to avoid any volume contraction effects during mixing.
Under gradient conditions, the mixer of the pump unit of the HPLC system is responsible for a proper mixing of the mobile phase. Either static or dynamic mixing chambers exist; make sure that the mixer is switched on when working with a dynamic mixing chamber. The shift in retention time in a separation of alkyl phenones with a dynamic mixer switched on and switched off can be seen in Figure 39.
Filtration tools for preparing HPLC/UHPLC buffers and mobile phasesMobile phase solvents and buffers have to be of high-quality HPLC grade, and prepared freshly, filtered (0.45 μm) and degassed before use. Membrane filtration removes contaminating particles from solvents and mobile phases, increasing column life, minimizing back pressure, and preventing system failure. That’s why most HPLC/UHPLC instrument manufacturers recommend filtration of mobile phases using either 0.45 or 0.20 μm filters. Membranes that display the highest particle retention tend to be the most effective at minimizing back pressure.
200
150
100
50
00.0 0.5 1.0
Retention time (min)
UV
Inte
nsi
ty (
mV
)
1.5 2.0 2.5 3.0
Figure 39. Shift in retention time in a separation of alkyl phenones with a dynamic mixer switched on and switched off (green and yellow chromatogram, respectively). Chromatographic conditions Column: Purospher™ Star RP-18 endcapped (2 µm) Hibar® HR 5 cm x 2.1 mm I.D.; detection: UV (247 nm); temperature: 40 °C; flow rate: 0.54 mL/min; mobile phase A: water, mobile Phase B: acetonitrile; gradient conditions: 0 min 45% B, 2.5 min 95% B; sample: 1 Urea, 2 Acetanilide, 3 Acetophenone, 4 Propiophenone, 5 Butyrophenone, 6 Benzophenone, 7 Valerophenone, 8 Hexanophenone, 9 Heptanophenone.

34
Polypropylene membranes exhibit poor particle retention, and therefore filtering UHPLC mobile phases through polypropylene is the least effective for reducing back pressure buildup. In contrast, filtering the eluent through polytetrafluoroethylene (PTFE) or PVDF membrane filters (e.g., Omnipore® and Durapore®), enables the UHPLC system to run without significant back pressure buildup.
In addition to the filtration of solvents prior to mobile phase preparation, various manufacturers provide filter frits which can be attached to the eluent tubing of mobile phase bottles. These filters additionally protect the LC system from particulate matter. Stainless steel or PTFE filter frits should be used rather than glass frits: Cleaning of the latter is time consuming, as buffer residue is hard to remove. In addition, silica and alkali are dissolved from the glass filter and form adducts with analyte molecules when working with MS detection.
Solvent and additive purityThe quality of the solvents as well as of the additives (buffers, salts, acids, bases) utilized in an HPLC experiment has to be adapted to the specific sensitivity of the detector and the type of elution protocol applied. In isocratic separations combined with UV detection, isocratic grade solvents will be the matter of choice. In contrast, gradient elution protocols and UV detection require gradient grade solvent quality in order to avoid elution of solvent contaminations (“ghost peaks”) during chromatographic runs.
Mass spectrometry as the most sensitive detection technique requires specific MS grade quality solvents of highest purity. These solvents maximize the sensitivity of an analysis by minimizing signal suppression, adduct formation, and baseline noise. In general, the purest solvent and reagent quality available has to be used, and their contamination has to be avoided by careful handling.
Contamination in solvents and additives such as acids, bases or buffers can accumulate on the stationary phase—depending on the chromatographic conditions applied for a specific separation and on the equilibration time prior to a run. Figure 40 shows the accumulation of plasticizers dissolved in aqueous eluent A on a reversed phase column after equilibration for 0, 15, and 60 minutes. While these compounds would be eluted as very broad peaks under isocratic conditions (and cause an increased background noise), they elute as distinct, intensive peaks under gradient conditions and can interfere with analyte signals. To avoid such ghost peaks use pure solvents and additives and avoid excessive column equilibration (column flushing with approximately 10 column volumes is sufficient, alternatively one blank gradient run including subsequent equilibration is an option).
Chemical compatibility The composition as well as the pH of the mobile phase has to be chosen in accordance with column housing material, as well as stationary phase characteristics. Damage to the column hardware, modification or column bed can be avoided by following this recommendation.
PEEK generally shows chemical resistance to a wide range of organic solvents commonly used in RP and NP applications. Therefore, columns with PEEK hardware can be used with the following organic solvents without limitations: Alcohols, acetonitrile, alkanes, dioxane, esters, and ethers. Restrictions are imposed with respect to the following solvents (as swelling of PEEK may occur after prolonged exposure): The mobile phase should not contain more than 50% tetrahydrofuran (THF), 5% chlorinated solvent (e.g. dichloromethane), or 5% dimethyl sulfoxide (DMSO). However, all these solvents can be used as a component of the sample solution.
Do not exceed the pH stability range of the column, this avoids damage to the column modification or column bed. For example, when using a silica based stationary phase, a pH in the range of 2–7.5 is recommended. Higher pH values will dissolve the silica, creating voids in the column and leads to peak shape deterioration and peak fronting. Lower pH values can eventually hydrolyze the bonded phase. These defects will cause a decrease of retention times and loss of resolution and might lead to peak tailing for basic compounds. A cross-linked surface modification or a polymeric backbone of a column can increase the pH operating range (e.g., to 1.5–10). HPLC columns based on alumina can typically be run at a pH of 2–12. Carbon-based HPLC columns (like Supel™ Carbon LC, based on porous graphitic carbon technology) can operate at pH 1–14 with no decline in efficiency or lifetime.
Do not use strong acids (e.g. hydrochloric, nitric, and sulfuric acids) in the column and limit the use of strong bases (e.g. sodium, potassium, ammonium hydroxide) to amounts needed to adjust the pH of the mobile phase.
When measuring the pH of mobile phases, the measurement should be carried out in the aqueous medium before mixing with organic solvents. Although this will not give the actual pH in the mixed aqueous-organic eluent, it will give more consistent results than a mixed mobile phase.
1.2E+07
1.0E+07
8.0E+06
6.0E+06
4.0E+06
2.0E+06
0.0E+060.0 1 2
Retention time (min)
UV
Inte
nsi
ty (
mV
)
3 54 6 7
Figure 40. Effect of equilibration time on the accumulation of plasticizers on a reversed phase column prior to a gradient run. Equilibration times with mobile phase A: 0 (blue chromatogram), 15 (red), and 60 (green) minutes.Chromatographic conditions: Mobile phase A: water/acetonitrile 95/5 (v/v) + 0.1% formic acid, B: acetonitrile + 0.1% formic acid; gradient: 0 min 100% A, 3 min 5% A, 5 min 5% A; flow rate 0.4 mL/min; detection pos. ESI-MS (TICs); temperature: 25 °C; sample: plasticizers (*) were added by the immersion of plastic tubing in aqueous eluent A.

35
Mobile phase composition and temperatureVerify that solvents are miscible when changing mobile phases, and that no buffer precipitation will occur.
In reversed phase chromatography, water-miscible organic solvents such as acetonitrile, methanol, isopropanol and water, or an aqueous buffer serve as eluents, and additives such as tetrahydrofuran or dioxane can be used. Buffers such as phosphate, borate, acetate, carbonate, organic modifiers and ion pair reagents present no problems as long as the appropriate pH stability range of the stationary phase and packing material is not exceeded. Ion pair reagents are often difficult to flush completely from the column. Therefore, columns used with these reagents should be dedicated to the particular analysis involved.
Normal phase and medium polar phase columns are generally used with unpolar to semipolar solvents or mixtures of n-heptane, hexane, cyclohexane, dioxane, ethyl acetate, methanol, chloroform or dichloromethane. n-heptane and dioxane are typical solvents for adsorption chromatography.
Sometimes, it can be helpful to change the temperature of a chromatographic method, an approach that alters the selectivity of a given system of stationary phase/mobile phase/analyte and decreases method run times. Mutual interactions are numerous; therefore, an empirical process is necessary for selectivity optimization via fine-tuning of temperature. An additional effect of a temperature increase above room temperature is a desired increase in separation performance caused by accelerated diffusion processes.
When adjusting temperature, one has to keep in mind that the chemistry of most chromatographic columns is based on silica, and one negative aspect of this chemistry in an aqueous environment is that raising temperature dramatically increases silica solubility. Due to this specific temperature, limits exist for the operation of different stationary phases (for details see respective columns instructions). Keep in mind that exceeding these limits will cause a loss of capacity, column performance or even a breakdown of the column bed. As a rule of thumb, the operating temperature for silica based HPLC columns should not exceed 60 °C. Depending on the surface chemistry of each type of column this value can be lower or higher. For detailed information, please always refer to the column manual.
An appropriate method for increasing the lifetime of analytical columns is the use of guard columns or guard cartridges. This principle is based on the saturation of the mobile phase with silica before entering the analytical column and is especially recommended when working with amino bonded phases. In addition, guard columns protect the analytical columns from solid matter and prevent clogging. An alternative can be columns with a polymeric column bed; such columns can tolerate higher temperatures.
For proper thermostatting of columns, not only at elevated temperature, please also see the specific section in chapter 2.
Mobile phase propertiesChromatography on normal phase columns is based on the interaction of polar functional groups of analytes with the polar stationary phase surface. In addition, the physical properties of the solvents/eluents play a role, as these compete with the analyte molecules during the retention process. Depending on the strength of dipole-dipole and hydrogen bonding interactions of solvents with a normal phase stationary phase, their elution strength can be considered as weak or strong. An eluent showing weak interaction with the stationary phase is only capable of eluting weakly bonded analytes from the column, whereas a strong interaction causes elution of strongly bonded sample molecules. The elution or solvent strength of various solvents depends on the type of stationary phase used. Table 12 summarizes the solvent strength ε0 of various solvents commonly used in normal phase chromatography mode on silica gel. On alumina the obtained values for ε0 are somewhat higher, but show the same trend. In order to fine-tune the elution strength of a mobile phase, different solvents can be mixed, either static in isocratic separations or dynamic in gradient runs.
Table 12 Solvent strength of selected solvents in normal phase chromatography on silica gel.
Solvent Solvent strength ε0
n-Pentane 0
n-Hexane 0
Isooctane 0.01
Cyclohexane 0.03
p-Xylene 0.20
Diisopropyl ether 0.22
Toluene 0.22
Diethyl ether 0.29
Methylene chloride 0.30
Methyl ethyl ketone
Acetone 0.43
Dioxane 0.43
Methyl acetate 0.46
Tetrahydrofuran 0.48
tert-Butylmethyl ether 0.48
Ethyl acetate 0.48
Dimethyl sulfoxide 0.48
Diethyl amine
Nitromethane 0.49
Acetonitrile 0.50
Isopropanol 0.60
Ethanol 0.68
Methanol 0.73
Ref: [table reproduced from V.R. Meyer, Praxis der Hochleistungs-Flüssigchromatographie]
Next to the elution strength, the viscosity and UV ab-sorbance of mobile phase solvents and additives play an important role in terms of their suitability for use in HPLC analyses.

36
The viscosity of an eluent is directly correlated to the back pressure of a given HPLC column and system combination. The flow rate range under which a separation can be performed—and in turn, the speed of an analysis—is enlarged when using low-viscosity. Another benefit of low solvent viscosity is enhanced mass transfer also attributing to the speed of analysis. Separation at increased temperature can balance the negative effects of high mobile phase viscosity. The viscosity of various aqueous mixtures of important organic solvents is displayed in Figure 41. In general, low viscosity eluents are favorable for the reasons given above. However, in mass spectrometry detection, it can be helpful to substitute 20–30% of a low viscous solvent such as acetonitrile by isopropanol in order to improve the sensitivity of an analysis. Under these prerequisites, back pressure issues can be avoided by utilizing monolithic type columns.
The UV transmittance or absorbance is another key issue when working with organic solvents. The transmittance is influenced by the inherent properties of a solvent, but also by any contamination which can significantly decrease sensitivity. While the absorbance is negligible in the visible range of light, the difference is rather large in the UV wavelength range from 190 to 300 nm (Figure 42). Acetonitrile displays the lowest UV absorbance and can be used down to a wavelength of 200 nm, while the application of other organic solvents such as methanol, ethanol, is restricted to UV wave-lengths of approximately ≥ 220 nm isopropanol > 230 nm, THF > 250 nm. In addition, buffers or additives can also affect mobile phase transmittance in a negative manner.
Mobile phase pHThe result of a chromatographic separation of ionizable analytes is pH dependent, the exact adherence to a specific, predefined pH is therefore often necessary. Figure 43 displays the pH dependent chromatographic analysis of the antibiotic Cefaclor. While the effect of pH on this analysis is rather small, shifts in retention time can be up to several minutes when changing pH from, e.g., acidic to neutral.
Buffers or buffer systems are generally used to set a pH ionizing or deionizing analytes. The ionic strength (depending on both buffer concentration and ion charge) should not be set below 20 mM in order to achieve a sufficient buffer capacity. In contrast, ionic strengths above 100 mM can cause buffer precipitation in organic solvents. Verify buffer solubility over the complete range of 0 to 100% organic. Buffers—especially for MS use—should always be freshly prepared and utilizing the purest salt and acid/base quality available. Table 13 summarizes various buffer systems including their pH range. Note that the counter ion and its degree of hydration can have an influence on the pH of the final mobile phase.
acetonitrilemethanolethanol
isopropanolTHF
0
3.5
3.0
2.5
2.0
1.5
1.0
.5
020 40 60 80 100
Vis
cosi
ty (
cP)
Percent organic (v/v)Figure 41. Viscosity of aqueous mixtures of acetonitrile, methanol, ethanol, isopropanol and tetrahydrofuran.
Figure 42. UV absorbance of acetonitrile, methanol, ethanol, isopropanol and tetrahydrofuran.
acetonitrilemethanolethanolisopropanolTHF
190
1.0
0.8
0.6
0.4
0.2
0.0210 230 250 270 290 310
Vis
cosi
ty (
cP)
Percent organic (v/v)
Figure 43. pH dependent chromatographic analysis of a Cefaclor formulation.Chromatographic conditions: Purospher™ STAR RP-18 endcapped (2 µm) Hibar® HR 5 cm x 2.1 mm I.D.; mobile phase A: 10 mM sodium phosphate buffer pH 3.5 or water + 0.1% TFA pH <2 or 10 mM sodium phosphate buffer pH 7, mobile phase B: acetonitrile; gradient: 0 min 95% A, 1 min 95% A, 6 min 5% A; flow rate 267 µL/min; detection UV 254 nm; injection volume: 0.11 µL; temperature: 30 °C; sample: one Cefaclor capsule (500 mg) was suspended in 100 mL water, sonicated for 20 minutes and filtered through a 0.2 μm Millex® filter.
pH 7.0
pH 3.5
pH <2
-
300
200
100
0
1 2 3 4 5 6
UV
inte
nsi
ty (
mA
U)
Retention time (min)

37
Table 13. Buffer ranges of selected buffer systems
Buffer
TFA
Sulfonic acid/NaHSO3
Glycine/HCI
H3PO4/KH2PO4
Formic acid
Citric acid/Na citrate
Acetic acid/Na acetate
Pyridin/formic acid
Formic acid/Na formate
Pyridin/acetic acid
KH2PO4/Na2HPO4
BIS-TRIS
NaHSO3/Na2SO3
TRIS/HCI
Trimethylamine/HCI
Na borate/HCI
Trimethylamine/CO2
NH4HCO3
(NH4)2CO3/NH3
NH3/acetic acid
Ethanolamine/HCI
Na2CO3/NaHCO3
Na borate/NaOH
Triethylamine/HCI
Pyrollidine
Na2HPO4/Na3PO4
pH 0 1 2 3 4 5 6 7 8 9 10 11 12 13
Detector choiceThe choice of the detection is critical in HPLC as only compounds can be analyses if they are detected. Using a not suitable detector for the compounds of interest the chromatographic information to this compound will get lost. To select the most appropriate detection mode, four important parameters should be taken into consideration; chemical nature of the analytes, potential interferences, LOD and LOQ required, linearity range, availability and/or cost of detector. Below are some of the most common detection techniques for liquid chromatography presented. Fluorescence, electrochemical or mass detectors should be used for trace analysis. For preparative HPLC, refractive index is preferred because it can handle high concentrations without overloading the detector.
Ultraviolet/Visible Absorbance (UV/Vis)UV detectors are most commonly used in HPLC. This detector is a robust, inexpensive and versatile detection technique since most compounds absorb light, especially at low UV wavelengths. It is possible to use a diode array detector (DAD) and allow monitoring at
multiple wavelengths simultaneously. The downside is that a UV detector is not analyte specific and requires that the analyte absorb more light than sample matrix at the set wavelength. Choose a detection wavelength that maximizes sensitivity and specificity, but keep in mind that the mobile phase solvents and buffer components may cause slight shifts in UVmax from reference values. Therefore, it is advisable to check the analyte absorbance in the mobile phase. Mobile phase solvents and buffer components also have UV cut-off; therefore, make sure to work well above these levels. Otherwise, there are likely to be problems with reduced sensitivity and increased system noise (unstable and drifting baseline noise). UV wavelengths below 200 nm should be avoided because detector noise increases in this region. Higher wavelengths give greater selectivity.
Refractive index (RI)Refractive index is also a common detection technique, and measures the difference in the refractive index of a sample cell versus a reference cell. This detector is also a non-selective detection technique, being concentration dependent. The sensitivity is typically 100–1000 times lower than a UV/Vis detector. The benefit over a UV detector is the possibility to quantify analytes with no chromophores in the molecular backbone. The drawback is the sensitivity and the fact that RI detectors are typilcally used in isocratic mode only.
Fluorescence (FL)Fluorescence detection is specific and measures only compounds that fluoresce; hence, a requirement of this technique. The operation is similar to a UV/Vis detector but where the detector flow cell is used as the sensor through which excitation light passes axially. A photocell is located at the side of the cell to receive radially emitted light. The cell wall is made of special glass to prevent the excitation light or other stray light from reaching the photocell. When a solute that fluoresces in the excitation light flows through the cell, the molecule excites and fluorescent light passes through the walls of the cell onto the photocell. The excitation light may be light of any wavelength selected from the light source using a monochrometer. Another monochrometer may also be used to selectively analyze the fluorescent light and thus, a fluorescent spectrum can be produced for excitation light of any specific wavelength and an excitation spectrum produced for fluorescent light of any specific wavelength. To improve specificity of an LC analysis, a fluorescent derivatization reagent can be added (either pre-column or post-column) to form a fluorescent derivative of the substance of interest. This derivative may then be selectively detected from other solutes, which, (if they do not fluoresce) need not be resolved from each other by the separation column. Fluorescence detection is up to 1000 times more sensitive than UV/Vis, and is also concentration sensitive.

38
Evaporative light scattering (ELS)ELS is also a non-selective detection technique, but where the ELS detector (ELSD) is mass sensitive and not concentration dependent. It is an ideal technique for high molecular weight compounds, sugars, and less volatile acids. The detector measures the light scattering and where the amount of scattering is related to the molecular mass of the analyte, i.e. the more mass the more scattering will be seen measured. In the detector, there are three processes; nebulization of the mobile phase (1), evaporation of the mobile phase (2) and light scattering by analyte particles. In contrast to RI, it works well in gradient mode. Keep in mind that mobile phase solvents should be volatile for best performance.
Electrochemical (EC)An electrochemical detector requires that the analytes can be oxidized or reduced by an electrical current. The detector output is an electron flow generated by a reaction that takes place at the surface of electrodes. If this reaction is complete (exhausting all the analyte), the current becomes zero and the generated total charge is proportional to total mass of material that has been reacted. This process is called coulometric detection. If the mobile phase is continuously flowing past the electrodes, the reacting analyte is continuously replaced in the detector. As long as the analyte is present between the electrodes, a current will be maintained, albeit varying in magnitude, and is called amperometric detection. An electrochemical detector requires three electrodes, the working electrode (where oxidation or reduction takes place), the auxiliary electrode and the reference electrode (compensates for changes in the background conductivity of the mobile phase). Electrochemical detection is more sensitive than fluorescence detection, but commonly not as selective as fluorescence and generally not compatible with gradient elution.
Mass spectrometer (MS)Mass spectrometry is regarded as an established, routine, detection technique. MS detectors can be coupled to various separation techniques such as liquid chromatography (LC), thin layer chromatography (TLC), or gas chromatography (GC), where the hyphenation with LC is by far the most frequent setup. In contrast to more simple detectors, i.e. UV, RI, FL etc., MS generates data about molecular masses and detailed structural parameters and thereby offers the possibility to discriminate between co-eluting peaks in selected ion monitoring mode. The latter reduces the requirement for chromatographic retention and resolution before detection, yet it is always better to have retained and completely resolved peaks to prevent ion suppression or ion enhancement effects. Mass analyzers can be quadrupole, magnetic sector, time-of-flight, ion trap, or ion cyclotron resonance type. A quadrupole mass analyzer consists of four parallel rods that have fixed direct current (DC)
and alternating radio frequency (RF) potentials applied to them. The HPLC system handles dissolved analytes under ambient pressure (760 Torr) and delivers the sample to the MS, where the detection of the gaseous, ionized samples is performed under high vacuum conditions (10-5-10-6 Torr). The transfer of the analyte solution from the LC to the MS is accomplished via an interface. The interface converts the sample stepwise to an aerosol, ionizes it, and removes the solvent. Ions are then focused and passed along the middle of the quadrupoles. Their movement will depend on the electric fields so that only ions of a particular mass to charge ratio (m/z) will have a stable path to the detector. The RF is varied to bring ions of different m/z into focus on the detector and thus build up a mass spectrum. Depending on the physical properties and the molecular mass of the molecules, different types of interfaces are used, which vary among each other by how they ionize the molecules and the pressure applied during this process. At present, all the common ionization techniques operate under ambient pressure; i.e. electrospray ionization (ESI), atmospheric pressure chemical ionization (APCI), matrix assisted laser desorption/ionization (MALDI), and atmospheric pressure photo ionization (APPI). ESI and APCI are by far the most widely used in LC-MS hyphenation. The more esoteric techniques, electron ionization (EI) and chemical ionization (CI) work under high vacuum conditions with the advantage of being suitable for GC-MS hyphenation. Quadrupole mass spectrometers commonly have two configurations when used with liquid-chromatography, either as a simple single quadrupole system or placed in tandem. The latter principle, the triple quadrupole mass spectrometer, enables ion fragmentation studies (tandem mass spectrometry or MS/MS) to be performed.
Electrospray Ionization (ESI)In ESI mode, liquid solutions of charged or polar substances, delivered with an HPLC system, are sprayed utilizing a metal capillary (“spray needle”) and a nebulizer gas (nitrogen) in the MS. Resulting droplets are dried (desolvatization) and volatilized, isolated, analyte ions are transferred to the detector. Thermal stress is low so the analyte molecules do not decompose. ESI is almost unlimited regarding molecule size and suitable for medium to strong polar molecules, e.g., amines, carboxylic acids, heteroaromatics, and sulfonic acids. ESI is applied when fragmentations are unwanted and molecular masses of biomolecules have to be determined. ESI-MS is well suited for hyphenation with LC, and as long as flow rates do not exceed maximum 1–2 mL/min (depending on instrumentation), attainable sensitivity is very high; however, flow rates of between 1–500 μL/min are more common. In liquid solution, molecules are either already ionized, or will become protonated or deprotonated by additives in the sample solution and the mobile phase. To achieve best sensitivity, the mobile phases used should be set at a pH where analytes are ionized, and a rule of thumb

39
is to use neutral to basic pH (7–9) for acids, whereas more acidic pH (3–4) is advisable for basic compounds. If the analytes of interest have multiple pKa values and may change their ionization state, other pH values may be more beneficial both in terms of ionization of the analyte and behavior in the column. Thus, depending on the choice of solvent and additives, either positive and/or negative ESI mode can be used. Typically, positive mode is applied in combination with more basic molecules, while acid compounds are analyzed in negative mode. 0.1% formic acid is commonly added to the mobile phase in positive ESI mode to provide a low pH (≈3) and to protonate the analyte(s). Acidic analytes will be neutralized under such conditions, accordingly negative ESI mode is preferred and higher mobile phase pH is recommended. Volatile buffers like ammonium acetate or ammonium formate are used in the pH range 4.5–7 to deprotonate the analyte(s), and for high pH, it is possible to use either ammonium carbonate or ammonium hydroxide (aqueous ammonia). For both negative and positive ESI, it is a prerequisite that all mobile phase solvents and additives are volatile in order to avoid contamination of the mass spectrometer, and that the total mobile phase ionic strength is adequate (generally 2–25 mM) to prevent unnecessary down-time for cleaning of the detector. Strong acids like hydrochloric acid or nitric acid are unsuitable for two reasons: they form ion pairs with analyte molecules (analyte signal suppression) and display strong oxidizing properties.
Trifluoroacetic acid (TFA) is a special case: It is widely used as an ion-pairing reagent to improve the liquid chromatographic separation of peptides or proteins. On the other hand, TFA can cause strong ion suppression in mass spectrometry (mainly in negative ESI mode) and contaminates the LC-MS system. ’A good compromise here would be through the use of difluoroacetic acid (DFA). DFA provides the same excellent increase in efficiency as TFA but without as much ion suppression nor does it contaminate the MS system as readily as TFA. Unfortunately, both a quantitative estimation of these effects as well as general recommendations is not possible as their strength strongly depends on the MS system used. Triethylamine as an alternative additive behaves in a similar manner. If the use of TFA is unavoidable, a weak acid such as propanoic acid, or isopropanol can be added to the mobile phase in order to decrease a signal suppression effect.
Buffers do not only adjust the pH of the eluent and lead to ionization of a target molecule, they can also form adducts with the analyte. Adducts [M + buffer], e.g. with ammonium, alkali, halogens, formate or acetate, will lead to the detection of an additional peak in the MS spectrum; even a complete suppression of the analyte signal is possible when the vapor pressure of the resulting adduct (mainly alkali) is decreased significantly. Due to this, and in order to keep the ESI source clean, volatile buffers are recommended. Non-volatile salts like phosphates, borates, sulfates or citrates will precipitate in the MS source, block it, and cause tedious cleaning procedures.
Atmospheric pressure chemical ionization (APCI)This technique is complementary to ESI and also useful for LC-MS hyphenation. It does not require a mobile phase with conducting properties where acetone or acetic acid esters can be used as solvents and thus allows for a coupling of APCI with normal phase chromatography. In APCI mode, the analyte solution is vaporized prior to the ionization. Subsequently solvent molecules (aqueous-organic, e.g. methanol, propanol, acetonitrile, acetone etc., combined with 2–20 mM of a volatile organic buffer such as formic or acetic acid, ammonium acetate, ammonium formate or triethylamine) become ionized with a corona needle where their charge is then transferred to the analyte molecules via proton transfer or abstraction. APCI is suitable for the analysis of less polar, weakly ionizable substances with small or medium molecular weight (analytes without acidic or basic functional groups, e.g. hydrocarbons, alcohols, aldehydes, ketones, esters) and is therefore complementary to ESI, as long as the sample is thermally stable and vaporizable. Fragmentations are generally observed with APCI. Highest sensitivity is achieved using acetonitrile, methanol or water as solvents, and where the degree of analyte ionization can be optimized via mobile phase pH. As for ESI, flow rates up to maximum 1–2 mL/min can be tolerated. There are other less commonly used detection techniques possible to combine with liquid chromatography, such as chemiluminescence nitrogen (CLND), radio detectors, charged aerosol (CA, inductive coupled plasma (ICP), nuclear magnetic resonance (NMR), but these are not dealt with here.

40
General recommendations
Column hardwareHPLC and UHPLC columns come in a variety of different column hardware formats and materials for different applications (Table 14). Depending on the material (stainless steel, PEEK) the pressure stability can vary significantly.
All Supelco® columns have 10–32 UNF female end fittings that connect to 1/16” capillary tubing. Pre-installed end fittings of any type of chromatographic column should not be removed from HPLC columns, because the column bed might be damaged and the performance reduced. For further handling instructions see also the section on column installation.
The column hardware of Chromolith® monolithic silica columns consists of a mechanically stable and chemically robust polymer (PEEK), with the end fittings made from the same material. SeQuant® particulte columns are packed in a PEEK lined stainless-steel column hardware.
Particulate silica for reversed phase and normal phase HPLC is delivered in stainless steel column hardware with stainless steel frits to keep the stationary phase particles in place. The different columns hardwares provide dif-ferent pressure stabilities (Table 14). Hibar® columns as well as Chromolith®, SeQuant®, Ascentis® Express, Discovery® and Supelcosil™ columns require a separate pre-column holder for the use of precolumns. LiChroCART® cartridges allow the direct integration of 4-4 guard-columns in the cartridge holder “manuCART” which can be mounted without tools (finger tight).
Installation of columns with PEEK end fittings Most HPLC columns are connected to all standard HPLC and UHPLC systems with standard 1/16’’ fittings. Short capillary tubing is recommended to minimize extra-column volumes.
Both metal and polymeric fittings, tubing, and ferules are available for a proper column installation. Depending on the application and the setup, an operator can use either material. The depth of the drill hole of Supelco®-branded HPLC column end fittings is 2 mm [Parker standard format, used by most column manufactures] (as is the visible length of tubing after unmounting of a fitting/tubing unit, see Figure 44), while for few other column manufacturers it is 3 mm. In order to avoid the creation of large dead volumes or improper column installation, this fact makes careful handling necessary when working with columns from different manufacturers. In addition, the end fittings of some HPLC columns (e.g., Chromolith® columns) consist of PEEK, while others are made out of stainless steel. Mounting metal capillaries with 1/16‘‘ outer diameter and a metal cutting ring fixed to a 3 mm drill hole length can damage the PEEK hardware (both column housing and end fitting) and the silica bed of the aforementioned columns. To avoid any damage, use either flexible metal capillaries (0.25 mm outer diameter) with a polyvinylidene fluoride (PVDF) cone or PEEK capillaries with PEEK screws and adjustable plastic ferrules.
Table 15
Trademark Hardware Trademark Sorbent Column Use Precolumn Material
Pressure stability
LiChoCART®
Purospher™ STAR
HPLC Cartridge
Requires manuCART® to use
direct integration of precolumn— no separate holder needed Stainless Steel 250 bar
LiChrospher®
Superspher®
LiChrosorb®
Aluspher®
Hibar® RT
Purospher™ STAR
HPLC column ready to use column separate precolumn holder required Stainless Steel 400 barLiChrospher®
Superspher®
LiChrosorb®
Hibar® HR Purospher™ STAR UHPLC Colum ready to use column No precolumns available Stainless Steel 1000 bar
SeQuant® U/HPLC Colum ready to use column separate precolumn holder required PEEK lined Stainless Steel 200–550 bar
Chromolith® U/HPLC Colum ready to use column separate precolumn holder required PEEK 200 bar
Discovery®
HPLC Colum ready to use column separate precolumn holder required Stainless Steel 400 bar
Ascentis®
Supelcosil™
[LiChrospher®]
[LiChorsorb®]
Ascentis® ExpressHPLC Colum ready to use column separate precolumn holder required Stainless Steel 600 bar
BIOshell™
Ascentis® Express (2 µm)
UHPLC Colum ready to use column separate precolumn holder required Stainless Steel 1000 barBIOshell™ (2 µm)
Titan™
UNF thread 10/32”Cone
Drillhole
Figure 44. Schematic drawing of a Chromolith® end fitting.

41
Equilibrating the ColumnIn order to conduct reproducible results, every chromatographic column has to be flushed with eluent under the starting conditions of a chromatographic run. Isocratic separations require flushing with 5–20 column volumes of mobile phase, depending on whether a purged system is used and whether the column is new or has been used before, plus instrument dead volume. Under gradient conditions flushing with 5–10 column volumes of the mobile phase will be sufficient for reproducible runs. Without equilibration, low reproducibility, a shift in retention times, and peak overlap can be observed (Figure 45). Note that Table 15 summarizes gross column volumes. Depending on the stationary phase, the net column volume will be in the range of approximately 60–80% of the listed value. The flow rate utilized for column equilibration is limited by the back pressure generated by the packing material. Due to this, columns with a monolithic silica backbone creating a low back pressure can be equilibrated significantly faster (and at much higher flow rates) compared to particle packed columns with particle sizes of 5 μm or less.
Table 15. Gross column volumes of various column formats (length: 100 mm).
Column I.D. (mm) Gross column volume (µL)
4.6 1,662
3 707
2 314
0.3 7.1
0.2 3.1
0.1 0.79
0.075 0.44
Reversed phase columns are shipped in acetonitrile/water (e.g., 60/40 v/v). As the columns can dry out during stocking and shipping (this is of special importance with cartridges, because the columns are closed but not tight enough and can dry out easily), the column packing has to be wetting thoroughly by flushing with 10–20 column volumes of pure organic solvent (e.g., acetonitrile or methanol). Then conditioning of the column with mobile phase has to be continued until the baseline has stabilized. Of course, the miscibility of mobile phases is a prerequisite for successful equilibration.
Normal phase columns (Si, NH2, CN, Diol) are typically shipped with n-heptane/dioxane (99/1 or 95/5 v/v). It is recommended to perform equilibration with dioxane, followed by the mobile phase. If columns are going to be used with aqueous eluents, flush the column with ethanol or 2-propanol before equilibration with the mobile phase. Monolithic silica NH2 columns are shipped in acetonitrile/water (90/10, v/v). The shipment solvent is described in the Column Care & Use sheet, it is recommended to start the equilibration of the column in this solvent mixture, followed by the mobile phase.
Column couplingThe separation efficiency of HPLC columns is mostly reported as relative separation efficiency in plates per meter (N/m). For complex separations it can often be necessary to use long columns in order to provide the separation efficiency required for the resolution of all compounds of interest. With respect to column coupling, the use of particle packed columns is restricted due to back pressure issues.
The typical relative separation efficiency of most monolithic silica HPLC columns (Chromolith® Performance) is similar to 5 µm particles—about 100,000 N/m. Due to the low back pressure of the monolithic column bed, these columns can be connected in series up to a length of 1 m, resulting in more than 80,000 plates (absolute, although somewhat less than in theory due to the influence of the column couplers used) at relatively low back pressure. Figure 46 displays the separation of alkyl benzenes on ten coupled monolithic silica columns.
0.0
500
400
300
200
100
00.5 1.0 1.5 2.0 2.5 3.0
Inte
nsi
ty (
mA
U)
Retention time (min)Figure 45. Separation of alkyl phenones without and after proper column equilibration (blue and black chromatogram, respectively). Chromatographic conditions: Purospher™ STAR RP-18 endcapped (2 µm) Hibar® HR 5 cm x 2.1 mm I.D.; mobile phase A: water, mobile phase B: acetonitrile; gradient conditions: 0 min 45% B, 2.5 min 95% B; injection volume 2.1 μL; detection: UV (247 nm); temperature: 40 °C; flow rate: 0.54 mL/min; sample: 1 urea, 2 acetanilide, 3 acetophenone, 4 propiophenone, 5 butyrophenone, 6 benzophenone, 7 valerophenone, 8 hexanophenone, 9 heptanophenone. Figure 46. Isocratic separation of alkyl benzenes on ten coupled
monolithic silica columns yielding an absolute efficiency of 83,000 plates at a back pressure of 70 bars. Columns were connected utilizing specific column connectors.Chromatographic conditions: Ten pieces Chromolith® Performance RP-18e 10 cm x 4.6 mm I.D. mm plus specific column couplers; mobile phase: acetonitrile/water 80/20 (v/v); flow rate 2 mL/min; detection UV 210 nm; sample: 1 uracil, 2 toluene, 3 ethyl benzene, 4 propyl benzene, 5 butyl benzene, 6 pentyl benzene, 7 hexyl benzene.
1
2
34
56 7
0 5 10 15 20
UV
inte
nsi
ty (
mA
U)
Retention time (min)

42
Column lifetime, cleaning and regenerationColumn lifetime is highly dependent on the sample properties (particle load, impurities) and the HPLC method used (eluent pH, temperature), and cannot be generalized.
In certain situations 50,000 injections on one column are possible and in other cases only a few (less than 10). This fact depends on the sample properties, method criteria, and the method and system suitability criteria defined:
• plate numbers (efficiency/sensitivity)
• selectivity (how well separated peaks are)
• tailing factor (how symmetric peaks you expect)
Column back pressure (how stable the method is and how little matrix accumulates on the column with time) can also be a critical issue here.
Many injections on one column can be expected if one or more of the following criteria are fulfilled:
• big gap in retention time between peaks (high resolution)
• low concentration and volumes of sample are injected onto the column, solvents are of high quality and filtered (if buffers are added)
• peak shape changes are not too relevant
• software can still integrate peak area adequately
If many peaks elute within a short time and with big differences in peak amplitude, and sharp symmetrical peaks with no co-elution are expected, a column might need to be changed more regularly. Therefore, if a method is set up, and it is planned to run the method over a long period, it is highly recommended to define limits of the criteria listed. This fact makes it easy to decide when to change the column.
For samples with large quantities of contaminants, it is recommended to apply one or more sample preparation methods prior to separation (e.g. solid phase extraction, filtration, centrifugation; see also chapter 5). An alternative or additional option is to apply guard columns. It is generally good practice to protect the analytical column with such a pre-column in order to ensure maximum column lifetime. Use of a pre-column might result in a slight shift of the chromatographic parameters.
Make sure that the samples and the mobile phases are clean and particulate free by using HPLC grade solvents and reagents. If buffers or other salts are used, a final filtration of the mobile phase should be carried out with a membrane filter.
To extend the lifetime of the column, “wash” the column after use and before storage to remove traces of samples and buffers from the column. For cleaning of non-polar phases (RP-18, RP-8, Diol, CN, NH2 if used in RP mode), connect the column in the reverse flow direction. The simplest procedure is to pump 100% methanol or acetonitrile for 5 min at middle optimal flow rate. If buffers have been used, first pump 100% water and then methanol. Note: Ion pairing reagents are not completely removable from a stationary phase.
Exposure of a column to samples or solvents containing highly adsorptive components (CRUD; Chromatograph-ically Retained Undesired Debris) or even particulate matter will result in increased back pressure, a change in selectivity, and a drop of separation efficiency. In detail, possible reasons are microbiological impurities in the mobile phase, mechanical abrasion from components of the HPLC system, matrix components from biological samples, or particles in the mobile phase. Reverse the flow periodically to prevent particles and non-eluting sample components from accumulating on the column. This is only allowed for columns which have the same frits on the top and the bottom. The column can often be restored to original performance by using suitable wash protocols (see above). When performing solvent rinse regeneration, the column should be transferred from the analytical HPLC system to a simple, inexpensive pump. Alternatively, disconnect the column from the detector and rinse directly to waste. Rinse with a minimum of 20, preferably 30, column volumes of each solvent. Every column has insert sheet with washing recommendations, and users must follow insert sheet guidelines.
If a reversed phase column (RP-18, RP-8, Diol, CN, NH2 if used in RP mode) is strongly contaminated, then pump the following solvents one after the other through the column for 5 minutes at the upper limit of the corresponding column optimal flow-rate range: water, acetonitrile, 2-propanol, n-heptane, 2-propanol, acetonitrile, water, mobile phase.
For cleaning and regeneration of polar phases (Si, Diol, CN, NH2) connect the column in the reverse flow direction, then pump the following solvents one after the other through the column under the same conditions as described above: n-heptane, chloroform, ethanol or 2-propanol, chloroform, heptane, mobile phase. For normal phase columns use n-heptane, n-heptane/dioxane 50/50, dioxane, n-heptane/dioxane 50/50 as solvents/solvent mixtures. Every column has insert sheet with washing recommendations, and users must follow insert sheet guidelines.
When re-reversing the flow, flush the column before connecting it to the detector.
A documentation of HPLC column history makes sense in order to trace any issues possibly affecting column lifetime in a negative manner. This makes sense especially when a column is run under very different conditions (sample load, contaminated sample, extreme pH).
Use with mass spectrometers—procedure to maintain low column bleedingUnless an LC run is performed utilizing a normal phase column, the stationary phase of every HPLC column contains covalently bound organic entities altering its physical properties. Depending on the quality of both phase modification and a subsequent washing step these entities (e.g. octadecyl, cyano, phenyl) can be washed off the column during a chromatographic run and cause weak to severe interfering signals. This unwanted phenomenon is referred to as “column bleeding” and leads to decreased sensitivity in MS.
A minimization of column bleed is possible by flushing of an RP-18 or RP-8 column prior to connection to an LC/MS

43
instrument using a mixture of isopropanol and 0.1% formic at half optimum flow rate for approximately 30 minutes. This process cleans any trace organic material out of the column and hence increases sensitivity by decreasing background noise. Plain Si columns should be washed with dioxane at middle optimal flow rate for the same period of time. As an alternative, 2–3 gradient runs from strongly aqueous to strongly organic conditions can also be utilized to wash a column prior to connecting it to the MS detector.
Column bleed will generally be low when the maximum solvent strength of the mobile phase used is equivalent to methanol or acetonitrile. If stronger solvents are used in the mobile phase, e.g. tetrahydrofuran or DMSO, then it is recommended first to pump approximately 10 mL of this stronger mobile phase plus 0.1% formic acid through the column before connecting to the detector.
Storage Reversed phase columns should be stored in pure acetonitrile or a mixture of organic solvent (e.g. acetonitrile or methanol) and water (e.g. 50/50 v/v). Polar phase columns are best stored in heptane/dioxane (80/20).
Storing the column in buffers or at unsuitable pH for a prolonged time will shorten the lifetime of the column. Before extended storage (i.e. over the weekend or long term storage), the columns should be thoroughly rinsed-out from buffer salts, or ion-pair reagents which can cause bacterial growth or precipitate in the stationary phase or the HPLC system. The following procedure is recommended, first flush the column with 10–20 column volumes of mobile phase minus buffer, then with 10–20 column volumes of the shipping solvent mixture (acetonitrile/water, 75/25).
Alternatively, follow this protocol if the mobile phase contains a buffer: Flush with 5–10 column volumes water, then with 20–50 column volumes organic solvent/water (e.g. acetonitrile/water, 1/1). After flushing with 20 column volumes of the storage solvent (e.g. preferably acetonitrile), the column can be easily stored. By rinsing with acetonitrile, aprotic impurities can also be removed from the column. It's recommended to users to follow insert sheet recommendations.
System optimizationTo find the desired balance between resolution and analysis time after satisfactory selectivity has been achieved, parameters such as column dimension, particle size, and flow rate should be optimized. With a truly scalable stationary phase, these parameters may be changed without affecting capacity factors or selectivity. With the introduction of smaller particle sizes and narrower column inner diameters, optimization of the complete HPLC instrumentation is also needed, and sometimes it is necessary to replace the whole system. An example of a successful complete system optimization is shown for Pantoprazole sodium (Pantoloc, Protium, Pantecta and Protonix; a proton pump inhibitor drug that inhibits gastric acid secretion; for chemical structure see Figure 47.
The original method was developed on a Purospher™ STAR RP-18 endcapped 15 cm x 4.6 mm I.D. column with 5 μm particles with a total cycle time of 50 minutes (Figure 48). By changing to a Purospher™ STAR RP-18 endcapped 5 cm x 2.1 mm I.D. column with 2 μm particles, lowering the flow-rate, and altering the gradient profile, it was possible to reduce the total analysis time from 50 to 5 minutes, maintaining sample peak profile (with improved resolution), at low back pressure and high separation efficiency (Figure 49).
F N–
Na+
N
N
S
O O
O
F O
Figure 47. Chemical structure of pantoprazole sodium.
8.08
8/Im
p C
10.7
91/I
mp
A
13.7
99/I
mp
F14
.407
/Im
p D
14.8
61/I
mp
E
15.8
48/I
Unk
now
n16
.514
/IU
nkno
wn
18.4
20/I
Unk
now
n18
.025
/Im
pB
11.9
14/P
anto
prao
le N
a
50
40
30
20
10
0
0 252015105 30Retention time (min)
1.23
6 1.91
1
2.36
9
2.86
0
3.09
6
3.34
4
3.47
73.
611
4.04
7
4.48
2
100,000
75,000
50,000
25,000
0
0 4.0 4.53.52.5 3.01.5 2.00.5 1.0 5.0Retention time (min)
Figure 48. Chromatogram showing the purity profile of pantoprazole sodium on a Purospher™ STAR RP-18 endcapped 15 cm x 4.6 mm I.D. column with 5 μm particles.Chromatographic conditions: Purospher™ STAR RP-18 endcapped (5 μm) 15 cm x 4.6 mm I.D.; mobile phase A: 1.74 g dipotassium hydrogen phosphate in 1000 mL water, adjusted to pH 7.0 with dilute phosphoric acid (330 g/L), mobile phase B: acetonitrile; gradient: 80% A to 20% A in 40 min, 10 min reequilibration at 80% A; flow rate 1.0 mL/min; temper-ature 40 °C; injection: 20 μL; detection: UV 290 nm; sample: 460 ppm of pantoprazole sodium in 1:1 mixture of ACN and 0.001 N NaOH.
Figure 49. Chromatogram showing the purity profile of pantoprazole sodium on a Purospher™ STAR RP-18 endcapped 5 cm x 2.1 mm I.D. column with 2 μm particles.Chromatographic conditions: Purospher™ STAR RP-18 endcapped (2 μm) 5 cm x 2.1 mm I.D.; mobile phase A: 1.74 g dipotassium hydrogen phosphate in 1000 mL water, adjusted to pH 7.0 with dilute phosphoric acid (330 g/L), mobile phase B: acetonitrile; gradient: 80% A to 72% A in 1.5 min, 72% aA to 60% A in 2.5 min, 1 min reequilibration at 80% A; flow rate 0.6 mL/min; temperature 40 °C; injection: 7 μL; detection: UV 290 nm; sample: 460 ppm of pantoprazole sodium in 1:1 mixture of ACN and 0.001 N NaOH.

44
Method validationProper validation of an analytical method is important to ensure that it will provide similar results, today, tomorrow, next week, next year, i.e. over a long period of time, in different laboratories and independent of the analyst. Not only because of requirements from regulatory authorities, but rather to ensure good manufacturing practice (GMP) and good laboratory practice (GLP). It is especially important for pharmaceutical analysis when assurance of the continuing efficacy and safety of each manufactured batch relies solely on the determination of quality. Guidelines for the validation of analytical methods can be found at the International Council on Harmonization (ICH). The US Food and Drug Administration (FDA) and USP both refer to ICH guidelines.
Keep in mind that analytical method validation should be isolated from the initial selection and development, which actually are only the first steps in establishing a routine analytical method. Validation means testing of the method to find out allowed variability for each method parameter. Routine quality control methods should guarantee that the analytical results of raw materials, excipients, intermediates, bulk products or finished products are viable.
In this section the most widely applied validation char- acteristics are explained; accuracy, precision (repeat-ability and reproducibility/intermediate precision), specificity, limit of detection, limit of quantitation, linearity, robustness and stability of analytical solutions.
AccuracyAn analytical method is accurate if it gives the right numerical value for the analyte (either mass or concentration) and can be described as the degree of closeness of measurements of a quantity to its actual value. A method almost never gives the exact same results for replicate analyses, which means that the result is presented as the mean or average. A pragmatic way to express accuracy is to present it in terms of the standard error, which is the difference between the observed and the expected concentrations of the analyte. To determine accuracy, a common practice is to analyze a known amount of standard material under different conditions in a formulation, bulk material or intermediate product to ensure that nothing interferes with the method.
Precision Precision is the ability of repeatedly performing an analysis with a low standard deviation. A differentiation is made between repeatability and reproducibility. Repeatability is the measure of how easy it is for an analyst in a given laboratory to attain the same result for the same batch of samples (normally by injecting the same samples repeatedly at different concentration levels) using the same method and using the same equipment and reagents. Reproducibility or intermediate precision measures the variations within or between days, analysts and equipment. Highly reproducible quantitative results should be expected,
but depending if it is a pharmaceutical assay or a bio-analytical method, different acceptance criteria govern. In pharmaceutical quality control there are much more stringent method requirements and less variation amongst samples compared to analysis of patient plasma or serum samples. For any assay, the relative standard deviation (RSD) or coefficient of variation (CV) is used as indication of the imprecision of the method. From a practical perspective, six to ten replicate injections will give you a good idea of the precision of the method. An analytical method can be accurate but not precise, precise but not accurate, neither, or both.
SpecificitySpecificity is an important parameter to test in a validation program as it verifies the ability of the method to accurately measure the analyte response in the presence of all potential sample components. The analyte response from a solution containing only the analyte is compared with test samples containing the analyte and all potential sample components (placebo, synthesis intermediates, excipients, degradation products and impurities). For pharmaceuticals, stress conditions such as heat, light, acid, base and oxidant are typical. For formulated products, heat, light and humidity are commonly used to stress the samples. The analyte peak is evaluated in all test samples for peak purity and resolution from the nearest eluting peak.
Limits of detection and quantitationThe LOD is defined as the least amount of an analyte in a sample that can be detected, and commonly expressed as the concentration level that is able to provide a signal-to-noise ratio of three (S/N=3). LOQ is defined as the lowest analyte concentration level that can be quantified with good precision and accuracy, and providing a signal-to-noise ratio of ten (S/N=10). LOD and LOQ can also be determined based on the standard deviation of the response and the slope of the calibration curve.
LinearityThe linearity of an analytical method is the capability to generate results that are directly proportional to the concentration of analyte in the sample. It is commonly illustrated as the interval between the upper and lower analyte concentration levels that may be determined with precision and accuracy. Linearity data is often calcu- lated using the calibration curve correlation coefficient and the y-intercept. The RSD, intercept and slope of the calibration curve should also be calculated.
RobustnessThe method robustness is a measure on how well an analytical method remains unaffected by small variations in the experimental conditions, but also how reliable the method is during normal use. Important parameters to monitor are changes in the mobile phase composition, mobile phase pH, changes in the gradient profile, changes in the buffer concentration, column temperature and injection volume.

45
Analytical solution stabilityAnalytical solution stability can be divided into different sections; recovery, dilution, internal standard addition etc. If an extraction process is used (either liquid-liquid or solid phase extraction), it must provide proper analyte recovery. A method with low analyte recovery and/or where the analyte is degraded during the sample preparation is not tolerable for routine quality control. Internal or external standards (reference materials) should be prepared in such a way that they maintain their potency, and produce same response over time. Samples and standards should be tested for stability to verify stability over a normal analysis cycle. A rule of thumb is that the sample solutions, standard solutions and HPLC mobile phases should be stable for minimum 24 hours under defined storage conditions.
Scaling of HPLC methods
Scaling from HPLC to UHPLCA transfer of HPLC methods to UHPLC requires scaling down from columns with larger inner diameter (e.g. 4.6 mm i.d.), to columns with a smaller inner diameter (e.g. ~2.1 mm i.d.), and from long columns (e.g. 150 mm length), to short columns (e.g. 50 mm length), in addition to the reduction of particle sizes (e.g. from 5 μm to 2 μm).
To ensure equivalent chromatographic separation, it is also necessary to scale the flow rate, injection volume and the gradient parameters.
Adjusting the column lengthThe first step is to determine the appropriate column length in order to maintain the same separation. Keeping the same column length while decreasing the particle size will increase the number of theoretical plates as well as back pressures. Therefore, when decreasing particle size, column length can be shortened without losing resolution.
Column length L2 = L1 x dp2/dp1
L1 = HPLC column length L2 = UHPLC column lengthdp1 = HPLC particle sizedp2 = UHPLC particle size
Scaling the flow rateDecreasing the internal diameter of the column (e.g. from 4.6 mm to 2.1 mm) requires recalculation of column flow rate in order to maintain linear velocity. Linear velocity is defined as the distance which mobile phase travels over time (cm/min), whereas flow rate is the volume of mobile phase that travels over time (mL/min). To maintain the same linear velocity through a column with a smaller internal diameter, the flow rate must be decreased proportionally to the column internal diameter according to the equation below.
Flow rate f2 = f1 x d22/d1
2
f1 = HPLC flow rate (mL/min)f2 = UHPLC flow rated1 = HPLC column i.d. (mm)d2 = UHPLC column i.d.
Scaling the injection volumeDecreasing the column internal diameter and length, decreases the overall column volume and sample capacity. Therefore, the injection volume must be altered. Note that since overall column volume has decreased, it is more important to match the sample solvent to the starting mobile phase composition. Mismatched sample solvents can cause irreproducible retention times, efficiencies, and even changes in selectivity. If using a larger injection volume than calculated, check for peak abnormalities and irreproducibility that could result from phase overload.
Injection volume V2 = V1 x (d22/d1
2) x (L2/L1)
V1 = HPLC injection volumeV2 = UHPLC injection volume L1 = HPLC column length (mm)L2 = UHPLC column length
Adjusting gradient timeWhen an analytical method is scaled down, the time program of the gradient also needs to be scaled down to keep the gradient volume the same.
Time t2 = t1 x (f1/f2) x (d22/d1
2) x (L2/L1)
t1 = HPLC time (min)t2 = UHPLC time
Make sure the dwell volume (gradient delay volume) of the system has been determined, and take it into account when scaling a separation or transferring methods from one HPLC system to another.

46
Figure 50. Alkylphenone standards utilized for HPLC method scaling and speeding up HPLC method
Scaling an HPLC method
from Purospher™ STAR 5 μm column dimension 15 cm x 4.6 mm I.D.
to Purospher™ STAR 2 μm column dimension 5 cm x 2.1 mm I.D.
Separation of a mixture of nine alkylphenones (Figure 50) was scaled from HPLC to UHPLC conditions (Figure 51). All calculations were following the equations on the previous page.
Flow rate f2 = 1.3 x 2.12/4.62 = 0.27 mL/min
Time t2 = 15 x (0.5/0.105) x (2.12/4.62) x (50/150) = 5 min
Injection volume V2 = 10 x (2.12/4.62) x (50/150) = 0.7 μL
0
CH2N NH2
1. Urea
0
NH
H2C
2. Acetanilide
0
3. Acetophenone
0
4. Propiophenone
0
5. Buthyrophenone
0
6. Benzophenone
0
7. Valerophenone
0
CH3
8. Hexanophenone
0
9. Heptanophenone
Figure 51. Scaling a method from a HPLC column to a UHPLC column
2,000
1,000
0–200
0 1210862 4 25Retention time (min)
2,000
1,500
1,000
500
0
0 6.05.55.04.54.03.53.02.51.00.5 2.01.5 7.57.06.5Retention time (min)
Purospher™ STAR RP-18 endcapped, 5 µm Purospher™ STAR RP-18 endcapped, 2 µm
Column Purospher™ STAR RP-18e (5 µm) LiChroCART® 150 x 4.6 mm
Mobile phase A: Milli-Q® Ultrapure Water B: Acetonitrile
Gradient Time (min) 0.0 15.0
% A 55 55
% B 45 45
Flow rate 1.3
Detection UV 247 nm
Temperature 40 °C
Equilitration 7.5 min
Injection volume
10 µL
Sample Alkylphenone standard
1. Urea
2. Acetanilide
3. Acetophenone
4. Propiophenone
5. Butyrophenone
6. Benzophenone
7. Valerophenone
8. Hexanophenone
9. Heptanophenone
Column Purospher™ STAR RP-18e (2 µm) Hibar® HR 50 x 2.1 mm
Mobile phase A: Milli-Q® Ultrapure Water B: Acetonitrile
Gradient Time (min) 0.0 5.0
% A 55 55
% B 45 45
Flow rate 0.27
Detection UV 247 nm
Temperature 40 °C
Equilitration 2.5 min
Injection volume
0.7 µL
Sample Alkylphenone standard
1. Urea
2. Acetanilide
3. Acetophenone
4. Propiophenone
5. Butyrophenone
6. Benzophenone
7. Valerophenone
8. Hexanophenone
9. Heptanophenone

47
Speeding up a scaled methodAfter the method is scaled to a smaller column dimension, the next step is to increase speed by flow rate. The gradient was adjusted according to the equation:
Time t2 = t1 x f1/f2Time t2 = 5 x (0.27/1.08) = 1.25 min
Scaling from HPLC to UHPLC can speed up the separation up to 10 times and save solvent by up to 90% at the same time. The separation of 9 alkyl phenones shown in the example was achieved in 22.5 minutes using a 150–4.6 mm Purospher™ STAR 5 μm column at 1.3 mL/min flow rate (29.5 mL per run). The method was scaled to a column dimension of 50–2.1 mm using a 2 μm material of the same sorbent. The new UHPLC method total run time is 2.15 minutes including re-equilibration of the gradient at a flow rate of 1.08 mL/min (2.03 mL per run) (Figure 52).
Figure 52. Scaling a method to a higher flow rate
Purospher™ STAR RP-18 endcapped, 2 µm Purospher™ STAR RP-18 endcapped, 2 µm2,000
1,500
1,000
500
0
0 6.05.55.04.54.03.53.02.51.00.5 2.01.5 7.57.06.5Retention time (min)
1,500
1,000
500
0
0 1.21.00.80.60.2 0.4 1.61.4Retention time (min)
Column Purospher™ STAR RP-18e (2 µm) Hibar® HR 50 x 2.1 mm
Mobile phase A: Milli-Q® Ultrapure Water B: Acetonitrile
Gradient Time (min) 0.0 5.0
% A 55 55
% B 45 45
Flow rate 0.27
Detection UV 247 nm
Temperature 40 °C
Equilitration 2.5 min
Injection volume
0.7 µL
Sample Alkylphenone standard
Column Purospher™ STAR RP-18e (2 µm) Hibar® HR 50 x 2.1 mm
Mobile phase A: Milli-Q® Ultrapure Water B: Acetonitrile
Gradient Time (min) 0.0 1.25
% A 55 55
% B 45 45
Flow rate 1.08
Detection UV 247 nm
Temperature 40 °C
Equilitration 0.625 min
Injection volume
0.7 µL
Sample Alkylphenone standard

48
Ramipril and Related Substances— from HPLC to UHPLCThe benefit of scaling from HPLC to UHPLC is illustrated with the USP 36–NF 31 monograph method for Ramipril related compounds, where the liquid chromatograph should be equipped with a 210 nm detector and a 250–4.0 mm column that contains 3 μm packing L1 (RP-18) and is maintained at a temperature of 65 °C.
Within the scope of allowed monograph method changes, and only to perform partial revalidation, this method can be changed by:
• Reduction of particle size to maximum 1.5 μm (50%)
• Shortening the column to a length of 75 mm (70%)
• Reduction of inner diameter if linear velocity is kept constant
• Reduction of injection volume as long as limit of detection (LOD) and linearity is OK.
Using the same mobile phases and gradient program as per monograph, this method was first finalized on a 250–4.6 mm Purospher™ STAR RP-18 endcapped column with 5 μm packing, page 20, and thereafter scaled to a 100–2.1 Purospher™ STAR RP-18 endcapped column with 2 μm packing. The UHPLC application is
an allowed monograph modification per USP guidelines but the application using the larger HPLC column is not allowed. It is possible to reduce particle size by a maximum of 50%, but no increase is allowed (Figure 53).
Performance criteriaChromatograph the Resolution solution, and record the peak responses as directed for Procedure: the resolution, R, between ramipril related compound A and ramipril is not less than 3.0. Similarly chromatograph the Test solution, and record the peak responses as directed for procedure: the retention time for ramipril is between 16 and 19 minutes; and the tailing factor for the ramipril peak is between 0.8 and 2.0. Chromatograph the Standard solution, and record the peak responses as directed for Procedure: the relative standard deviation for replicate injections is not more than 5.0 %. [The relative retention times are about 0.8 for ramipril related compound A, 1.0 for ramipril, 1.3 for ramipril related compound B, 1.5 for ramipril related compound C, and 1.6 for ramipril related compound D.]
NOTE: No Ramipril related compound C and D were available at time of developing this application. It is therefore not marked as an USP method, despite following the monograph experimental conditions.
Figure 53. Scaling USP method for Ramipril from HPLC conditions to UHPLC conditions
Impu
rity
A
Impu
rity
B
240
180
120
60
00 302520155 10 451.435
Retention time (min)
Inte
nsity
(mV)
O
HN
HO
NOO
O
=H
H=
Ramipril and Related Substances—Purospher™ STAR RP-18 endcapped (HPLC)
Column Purospher™ STAR RP-18e (5 µm) Hibar® RT 250 x 4.6 mm
Mobile phase A: Dissolve 2.0 g of sodium perchlorate in a mixture of 800 mL of Milli-Q® Ultrapure Water and 0.5 mL of triethylamine. Adjust pH to 3.6 with phosphoric acid. Add 200 mL acetonitrile and mix.
B: Dissolve 2.0 g of sodium perchlorate in a mixture of 300 mL of Milli-Q® Ultrapure Water and 0.5 mL of triethylamine. Adjust pH to 2.6 with phosphoric acid. Add 700 mL acetonitrile and mix.
Gradient Time (min) 0.0 6.0 7.0 20.0 30.0 40.0 45.0 55.0
% A 90 90 75 65 25 25 90 90
% B 10 10 25 35 75 75 10 10
Flow rate 1.0 mL/min
Detection UV 210 nm
Cell 10 µL
Temperature 65 °C
Diluent Solution A
Injection volume 10 µL
Pressure drop 61 to 74 Bar (884 to 1073 psi)
Sample Dissolve 25 mg of sample in diluent and dilute to 25 mL with same solvent.
Chromatographic Data
Compound RT (min) RRT Asymmetry
1. Ramipril RS A
2. Ramipril
3. Ramipril RS B
18.2
22.2
30.9
0.82
1.00
1.39
1.0
1.0
1.0

49
Impu
rity
A
Impu
rity
B
240
180
120
60
00 8642 1210
Retention time (min)
Inte
nsity
(mV)
O
HN
HO
NOO
O
=H
H=
Column Purospher™ STAR RP-18e (2 µm) Hibar® RT 100 x 2.1 mm
Mobile phase A: Dissolve 2.0 g of sodium perchlorate in a mixture of 800 mL of Milli-Q® Ultrapure Water and 0.5 mL of triethylamine. Adjust pH to 3.6 with phosphoric acid. Add 200 mL acetonitrile and mix.
B: Dissolve 2.0 g of sodium perchlorate in a mixture of 300 mL of Milli-Q® Ultrapure Water and 0.5 mL of triethylamine. Adjust pH to 2.6 with phosphoric acid. Add 700 mL acetonitrile and mix.
Gradient Time (min) 0.0 1.66 1.93 5.54 8.31 11.08 12.46 15.23
% A 90 90 75 65 25 25 90 90
% B 10 10 25 35 75 75 10 10
Flow rate 0.3 mL/min
Detection UV 210 nm
Cell 2.5 µL (use 0.1 mm tubing)
Temperature 65 °C
Diluent Solution A
Injection volume 2 µL
Pressure drop 196 to 164 Bar (2827 to 2378 psi)
Sample Dissolve 25 mg of sample in diluent and dilute to 25 mL with same solvent.
Chromatographic Data
Compound RT (min) RRT Asymmetry
1. Ramipril RS A
2. Ramipril
3. Ramipril RS B
5.6
6.9
9.5
0.81
1.00
1.38
1.1
1.1
1.1
Figure 53. Scaling USP method for Ramipril from HPLC conditions to UHPLC conditions
Ramipril and Related Substances—Purospher™ STAR RP-18 endcapped (HPLC)
Ramipril and Related Substances— from HPLC to UHPLCAs can be seen on the left page, both columns meet the performance criteria in terms of:
• The resolution, R, between ramipril related compound A and ramipril (not less than 3.0)
• The relative retention time between ramipril related compound A (ramipril RS A), ramipril, and ramipril related compound B (ramipril RS B)
• The tailing factor for the ramipril peak (between 0.8 and 2.0).
• The application using HPLC conditions also meet the retention time requirement for ramipril
The UHPLC column, Purospher™ STAR RP-18 endcapped (2 μm) 100 x 2.1 mm, thus seems to comply with the monograph method and leads to the following benefits:
1. Faster method (Time-saving: 40 minutes per sample or 360%) (yes... the column length is 60% shorter and this provides 60% time saving but the real gain is to scale the method to a column with smaller particle size and not having to keep same linear velocity).
2. Higher chromatographic resolution and efficiency
… but this is not true. The retention time requirement for ramipril is NOT between 16 and 19 minutes. In addition, the flow rate has not been scaled to maintain same linear velocity.
The monograph method is documented at 1.0 mL/min on 4.6 mm column, and thus the flow rate should be reduced by a factor or 4.8 for the 2.1 mm i.d. UHPLC column (for calculations, see page 18). A flow rate of 0.2 mL/min should have been used instead of 0.3 mL/min. With the current experimental conditions, this would give comments from an auditor and very likely a request for method change.
The larger Purospher™ STAR RP-18 endcapped (5 μm) 250 x 4.6 mm column can definitely not be used. The particle size is larger than monograph method and would require complete revalidation and discussion with auditor and authorities. Most likely it would not be an accepted method.

50
4. Chromatographic Separation of Large Molecules
IntroductionBiomacromolecules (in particular monoclonal antibodies;mAbs) have seen a renewed interest in the pharmaceutical and biotechnology industry. The reason for this high level of interest resides in the number of benefits these biological molecules have for patients including, but not limited to, high efficacy in treating an illness, high specificity for a target receptor or antigen, wide therapeutic range, and limited undesirable side effects.1 However, due to the fact that these molecules are complex and are often produced in host cell lines, bacteria, or fermentation reactors, these potential therapeutics have significant heterogeneity which needs to be evaluated and characterized using analytical techniques.2
The complexity of such biomacromolecules can be easily illustrated by examining the structure of a typical mAb as depicted in Figure 54.
mAbs are large, tetrameric immunoglobulin G (IgG) molecules with a molecular weight of approximately 150 kDa (150,000 g/mol). These molecules form a Y-shape composed of four peptide chains: two identical light (L) chains with a molecular weight of approximately 25 kDa each, and two identical heavy (H) chains with a molecular weight of approximately 50 kDa each. To form the Y-shape, these four polypeptide chains associate with each other through the creation of inter- and intra-chain disulfide bonds. From a structural biology perspective, a mAb can be broken down into two domains: the fragment crystallizable (Fc) domain,
which is responsible for the effector function, and the antigen binding domain (Fab), which, as the name implies, is solely dedicated to binding the antigen to the antibody. mAbs are glycoproteins that have two conserved N-glycosylation sites in the Fc domain. A variety of other chemical and enzymatic modifications can further modify a mAb including methylation, phosphorylation, deamidation, oxidation, and conjugation to cytotoxic, small molecule drugs (thus resulting in an antibody-drug conjugate; ADC), among many others.3 Therefore, there are thousands of potential variant combinations in a single mAb formulation, and some of these may elicit a lethal response in a patient. In addition to the above-mentioned modifications to the primary structure of the mAb, modifications to the higher-order structure of the mAb may occur, such as aggregation or clipping, which can also affect the safety and efficacy of the therapeutic.4
Due to the above-mentioned, inherent danger associated with the possible heterogeneity of these biologics, the Food and Drug Administration (FDA) and the European Medicines Agency (EMA) now require all biopharmaceutical manufacturing companies to submit a comprehensive report detailing the complete characterization of their submitted drug formulation. Due to this stringent requirement, the need for effective, sensitive, and robust analytical techniques to fully characterize these biomacromolecules is a key factor for the “biopharma” market to continue to thrive. This chapter will outline several analytical chromatographic strategies that the biopharmaceutical scientist can employ to fully characterize novel biopharmaceuticals.
Size Exclusion ChromatographySize exclusion chromatography (SEC) is a mode of chromatography that separates molecules by their size (i.e. hydrodynamic radius). This mode of chromatography does not rely on the interaction of the analytes with a stationary phase ligand; it is an entropic process meaning that it relies on the random flow of the analytes through the stationary phase particles. For most practical purposes, this can be envisioned as analytes with a higher molecular weight will elute earlier in the run, since these analytes are fully or partially excluded from the pores of the stationary phase particles, while lower molecular weight analytes will elute later in the run, since these analytes will spend more time navigating the torturous path through the particles.5
The driving force in SEC is the exclusion effect based on molecular weight and size. This exclusion effect is dictated by the pore diameter and geometry of the stationary phase particle. Therefore, when selecting an SEC column (or any column) for a separation
IgG1Light Chain
Variable Region
(VL)
Constant
Region (CL)
(VH)
Variable Region
(CH1)
Constant Region
Heavy Chain
Fab
Light
Cha
in
Cons
tant
Region
(CL)
Varia
ble
Region
(VL)
(CH1)
Cons
tant
Reg
ion
(VH)
Varia
ble
Region
Heavy
Cha
in
Fab
Hinge Region
N-Linked GlycanN-Linked Glycan
Heavy C
hainC
onstan
t Reg
ions
Con
stant R
egion
s
Heavy C
hain
(CH3) (CH3)
(CH2)
Fc
(CH2)
Figure 54. Graphic depiction of an IgG1 antibody. Note the structural complexity of the different domains of the mAb.

51
experiment, one needs to be cognizant of the particle pore size. If the pore size is too small, the analyte(s) of interest will not enter the particle and will elute in the void volume. For SEC of smaller proteins and peptides, particles with a pore diameter of 150 Å will provide a good linear separation range when creating a molecular weight calibration curve, shown in Figure 55. Table 16 details the molecular weights of the analytes used in this study. As seen in Figure 55, proteins with molecular weights larger than approximately 50 kDa (analytes 1–3) begin to be excluded from the pores of the column, resulting in premature elution, whereas analytes with molecular weights less than 5 kDa (analytes 8–11) interact more with the stationary phase and elute later in the run. To achieve the best chromatographic results with this column, one should operate in the linear region of the curve (analytes 5–7; molecular weights 17 kDa–6 kDa).6
Table 16. Analytes Used in Molecular Weight Calibration Curve
Analyte MW (Da)
1. thyroglobulin 667000
2. IgG 150000
3. BSA 66400
4. ovalbumin 45000
5. myoglobin 17000
6. thioredoxin 11700
7. insulin 5733
8. neurotensin 1700
9. vitamin B12 1350
10. angiotensin II 1000
11. uracil 112
There have been some developments in the manu-facturing and application of small particle size SEC columns for biomolecule separations. These new columns exist as 2.0 μm and sub-2 μm silica particles, enabling the biochromatographer to perform high efficiency separations in half the time compared to 3.0 and 4.0 μm particles. Recent studies (7) have shown the advantages of using small particle SEC column technology.
In addition to recent advances in column technology, the mobile phase is also important to consider when performing SEC of biomolecules. One area of focus where the composition of the mobile phase will dictate success or failure in an SEC experiment is in characterizing ADCs by SEC. ADCs tend to exhibit secondary interactions with the stationary phase due to the added cytotoxic drug payload. These interactions will result in broad peak tailing and lower sensitivity of higher-order aggregates. One way to minimize these interactions is to add an organic alcohol (i.e. isopropanol, 1-butanol, 1-propanol, etc.) to the mobile phase. The addition of an alcohol modifier is thought to either mask surface silanols on the stationary phase or stabilize a particular fold of the protein, thereby reducing the heterogeneity of the analyte and allowing for the analyte to elute with a lower peak volume.8,9
Another important aspect of SEC is the effect of salt and salt type in SEC. Salt is typically used in SEC to minimize electrostatic interactions between the analyte and charged sites on the silica stationary phase. Typically, most SEC methods will use sodium or potassium phosphate (100–200 mM, pH 7.0–7.4) to perform the separation, though recent research has revealed that potassium salts may elicit better resolution of dimeric species.10 One problem with this salt, however, is that it is not compatible with mass spectrometric (MS) detection. Volatile salts, like ammonium formate, have been used to perform online SEC/MS for characterizing biotherapeutics. Figure 56 shows the deconvoluted MS spectral results of such a study, showing that SEC/MS could be employed in drug-to-antibody (DAR) characterization of an ADC.11
Insulin at 6 kD is partially excluded
Adsorption dominates
Size dominates
1
2
34
5 67
89
10
11
1000000
100000
10000
1000
10086 10 12 14 16 18
Mol
ecula
r w
eight
Retention time (min)
Figure 55. Molecular weight calibration curve for a series of proteins separated by SEC. Column: Zenix® SEC-150, 30 cm x 4.6 mm I.D., 3 μm; Mobile Phase: 0.2 M sodium phosphate dibasic, pH 7.0 with phosphoric acid; Flow Rate: 0.25 mL/min; Column temperature: 25 °C; Detector: UV, 215 nm; Injection: 0.5 μL; Sample: Mixture of proteins from Table x, 1 mg/mL, 0.2 M sodium phosphate dibasic, pH 7.0 with phosphoric acid. Adapted from reference 6.
Figure 56. Native SEC/MS spectrum of the SigmaMAb ADC mimic. Difference in molecular weight between each main peak is 1336 Da, corresponding to the molecular weight of two payloads. Conditions: Column: TSKgel® SuperSW 3000, 30 cm x 2 mm I.D., 4 µm; Mobile phase: 100 mM Ammonium acetate, pH 7.0 (isocratic); Flow rate: 0.07 mL/min; Column temperature: 35 °C; Detector: ESI-MS, 1000–8000 m/z; Injection: 1.0 µL; Sample: ADC mimic, 100 µg/mL, 100 mM Ammonium acetate, pH 7.0. Adapted from reference 11.
143799
145135
146474
147812
149147
0
26
4
8
100
0143000 148000 149000145000 146000 147000144000
Mass
Average DAR 3.9

52
Hydrophobic Interaction ChromatographyHydrophobic interaction chromatography (HIC) is a mode of chromatography that separates analytes based on the degree of interaction between hydrophobic moieties on the analyte and hydrophobic ligands on the stationary phase. Under conditions of high concentrations of salt, the hydration layer around a protein may be disrupted enough that it becomes entropically favorable for hydrophobic regions of the protein’s surface to interface with the non-polar stationary phase. This phenomenon is similar to the classical biochemical technique of protein salting out, but in HIC’s case, the interactions are between protein-stationary phase ligand rather than between different protein molecules. Due to the lower molecular weight and lower propensity for folding, HIC is not often used for separating peptides. Salt selection in HIC is dictated by the Hofmeister series, which classifies cations and anions in terms of their ability to disrupt the hydration layer around a protein (chaotropic) or promote the formation of a hydration layer (kosmotropic). Typical salts in HIC are ammonium sulfate, potassium sulfate, and sodium sulfate.
The biggest application area currently under investigation for HIC is in determining the DAR profile of an ADC. The DAR profile is one critical quality attribute (CQA) that a biopharmaceutical company needs to determine for approval by the FDA or EMA. An overly conjugated ADC can kill both healthy and carcinogenic cells, whereas an under-conjugated ADC may not be effiective in killing carcinogenic cells. In cysteine-linked ADCs, where the linker and cytotoxic payload is conjugated through the sulfhydryl moiety of a cysteine amino acid, separation by HIC leads to a profile of peaks corresponding to 0, 2, 4, 6, and 8 drugs attached to the antibody (Figure 57). The keen reader will note the presence of a peak between peaks 2 and 3; this corresponds to a DAR 3 species. It is possible that not being able to detect and quantify these odd-numbered DAR species could result in an underestimation of the average DAR for an ADC by as much as 3%.12
Figure 4 also shows the use of isopropyl alcohol in both mobile phases, essentially setting up an alcohol gradient. The reason for this inclusion is the same as was discussed with SEC: some analytes tend to interact too strongly with the stationary phase and need the extra, organic component to promote elution from the column. It should be noted here, though, that both SEC and HIC are considered native techniques, meaning that the structure and activity of the protein is preserved. However, employing alcohols in the mobile phases increase the risk of these analytes being denatured. One should always check the stability of their analytes in dilute, organic solutions prior to incorporation in a chromatographic method (by using a technique like sodium dodecyl sulfate polyacrylamide gel electrophoresis; SDS-PAGE). Most proteins will be stable in solutions up to 35% organic solvent.13
Ion Exchange ChromatographyIon exchange chromatography (IEX) is a mode of chromatography that separates analytes by charge. Proteins and peptides are amphoteric, meaning that they have both acidic and basic functionalities. The acidic portions of a protein include aspartic acid, glutamic acid, cysteine, tyrosine, and the α-carboxylate on the C-terminus. The basic portions of a protein include arginine, histidine, lysine, and the α-amine on the N-terminus. Charge variants of a biotherapeutic, another CQA that regulatory bodies require manufacturers to monitor, can be detected and resolved by IEX. These charge variants can arise from mistranslation of messenger RNA (mRNA) transcripts and/or post-translational modifications such as deamidation, oxidation, or glycosylation, among others.14
When choosing a column for an IEX experiment, one needs to be aware of the isoelectric point (pI) of the native state of the protein. For example, most mAbs have a pI of ~7.4. If the pH of the mobile phase is lower than 7.4, the mAb will be positively charged and bind to a cation exchange column. If the pH of the mobile phase is above 7.4, the mAb will be negatively charged and bind to an anion exchange column. In addition to cation versus anion exchangers, these can be broken down into weak and strong exchangers based on the pKa for the exchanger.
There are two methods for eluting analytes off of an IEX column: using a salt gradient and using a pH gradient. The salt gradient approach employs a linear gradient of a salt (i.e. sodium chloride, potassium chloride, etc.) to essentially compete with the analyte binding to the column. Figure 58 shows a separation of different mAb charge variants, from a series of proprietary mAbs, by IEX using a salt gradient.15Figure 57. HIC/UV analysis of native SigmaMAb ADC mimic. Conditions:
Column: TSKgel® Butyl-NPR, 10 cm x 4.6 mm I.D., 2.5 µm; Mobile phase: [A] 50 mM Potassium phosphate, 1.5 M Ammonium sulfate, pH 7.0 plus 5% (v/v) Isopropyl alcohol, [B] 50 mM Potassium phosphate, pH 7.0 plus 20% (v/v) Isopropyl alcohol; Gradient: 0% B to 100% B in 50 min; Flow rate: 1.0 mL/min; Column temp.: 35 °C; Detector: UV, 215 nm; Injection: 5.0 µL; Sample: ADC mimic, 100 µg/mL, 50 mM Potassium phosphate, pH 7.0. Adapted from Reference 12.
Elution Order:1. DAR 0 (nativ mAb)2. DAR 23. DAR 44. DAR 65. DAR 8
0 10 20 30min
40 50
2
3
4
5

53
The pH gradient approach employs a complex buffer system that gradually changes the pH of the mobile phase resulting in concomitant changes to the ionic state of the analytes and stationary phase ligands, which leads to elution of the analytes. There are negatives to each of these techniques: the salt gradient is not as effective at resolving similarly charged variants than a pH gradient method whereas a pH gradient requires a complex buffer system that may cause issues with method reproducibility. However, some vendors have made available off–the-shelf buffer solutions for pH gradient methods for resolving protein charge variants.
Hydrophilic Interaction Liquid ChromatographyHydrophilic interaction liquid chromatography (HILIC) is a mode of normal phase chromatography in which the mobile phase is relatively non-polar and the stationary phase is relatively polar. In HILIC, the strong solvent is water (or a low concentration buffer) and the analytes partition between an aqueous-enriched layer adsorbed on the stationary phase and the bulk mobile phase. Retention of analytes is mostly due to the amount of water adsorbed to the particle and the ionic strength of the buffer used in the mobile phase. Analytes are eluted off the column by gradually increasing the amount of water (buffer) in the mobile phase.
The key application area in the biopharmaceutical industry for HILIC is in glycan analysis, though recently there have been some publications focusing on the use of new, wide pore HILIC columns for glycoprotein separations.16,17 The pattern of glycosylation is another CQA that biopharmaceutical manufacturers need to determine according to regulatory agencies. Glycosylation can affect a protein’s folding ability as well as its stability. More importantly, the pattern of glycosylation can affect the antibody’s ability to bind antigens and promote antibody-dependent cellular cytotoxicity (ADCC) and complement dependent cytotoxicity (CDC).
To determine the pattern of glycosylation on a potential biotherapeutic, generally one first releases the glycans from the protein using an enzyme such as PNGase F. Afterwards, the released glycans are labeled with a fluorescent tag like 2-aminobenzamide or procainamide. The sample is then subjected to chromatographic analysis with either fluorescence detection or MS detection. Figure 59 shows chromatographic results of separating a mixture of N-linked glycans released from human IgG. Baseline resolutions for all of the individual glycans were observed, except for the positional isomers G1F and G1F’. The identities of these different glycans were confirmed by LC/MS.
Affinity ChromatographyAffinity chromatography is a mode of chromatography that relies on a specific interaction between the analyte of interest and the stationary phase ligand. Ideally, no other component of the sample would interact with the ligand, thus only the analyte of interest interfaces with the stationary phase. Afterwards, a second solution is passed through the column that breaks this interaction, eluting the analyte.
Protein A chromatography is the most common form of affinity chromatography employed in the biopharmaceutical industry. Protein A is a 42 kDa surface protein found in the cell wall of Staphylococcus aureus. This protein binds specifically to the heavy chain in the Fc region of IgGs, making this an ideal mechanism to separate IgGs from other components of a sample. Most Protein A columns are manufactured by immobilizing the protein on a porous, organic particle. However, monolithic format for Protein A chromatography has been produced, allowing for high sample throughput, at various flow rates, without sacrificing efficiency. Figure 60 shows the purification of IgG, at different flow rates, using a Protein A monolith.
Figure 58. Analysis of mAb charge variants by weak cation exchange chromatography. Conditions: Column: TSKgel® CM-STAT, 10 cm x 4.6 mm I.D., 7 μm; Mobile Phase: [A] 20 mM 2-(N-morpholino)ethanesulfonic acid (MES) buffer, pH 6.0; [B] 20 mM MES buffer, pH 6.0 + 0.5 M sodium chloride; Gradient: 0% B to 30% B in 15 min; 30% B to 100% B in 2 min; Flow Rate: 1.0 mL/min; Detector: UV, 280 nm; Column Temperature: 25 °C; Injection: 20 μL; Sample: mAbs A–E, 1 g/L, 20 mM MES buffer, pH 6.0. Adapted from reference 15.
Figure 59. Analysis of N-linked glycans released from human IgG. Conditions: Column: BIOshell™ Glycan, 15 cm x 2.1 mm I.D., 2.7 μm; Mobile Phase: [A] 100 mM ammonium formate, pH 4.5; [B] Acetonitrile; Gradient: 74% B to 71% B in 15 min; 71% B to 55% B in 10 min; 55% B to 45% B in 1 min; Flow Rate: 0.4 mL/min; Column Temperature: 50 °C; Detector: FLR, 260 nm excitation, 430 nm emission; Injection: 3.0 μL; Sample: Released, 2-AB labeled glycans from human IgG, 100 μg/mL, 30:70 100 mM ammonium formate, pH 4.5: acetonitrile
1
2
3
4
5
6
7
8
Peak Peak9
10
11
12
13
14
15
16
G0
G0F
G0FB
G1F
G1F’
G1FB
G2
G2F
Glycan Structure Glycan StructureG2FB
G1FSI
A1
A1F
A1FB
A2
A2F
A2FB
Min10 200
2-AB labeling agent
2
1
3
4
5
6
7
8
910
12
13 1415
1611
40
30
20
10
0
0 302010 40Retention time (min)
Inte
nsity
(mV)

54
Reversed-Phase ChromatographyReversed-phase chromatography (RPC) is a mode of chromatography that separates analytes based primarily on hydrophobicity. Unlike HIC, RPC employs a water/organic mixture for the mobile phase. There are several parameters that can be tuned in an RPC experiment to get satisfactory peak shape and resolution; these have been reviewed in several recent publications.18,19
Several wide pore RPC columns have been launched by column vendors over the past decade. These columns tend to fall into one of two categories: fully porous particle (FPP) packed columns and superficially porous particle (SPP) packed columns. SPP packed columns tend to provide more efficient separations due to better packing efficiencies of SPP columns as well as reduced longitudinal diffusion due to the presence of a solid silica core within the particle. Figure 61 showcases the advantages of using SPP packed columns over FPP packed columns in performing“middle up/down” analysis of Infliximab, a therapeutic mAb. Note the improved resolution and peak shape with the 1000 Å SPP column.
Another key aspect in RPC of biomacromolecules is the use of an ion pair reagent in the mobile phase. Generally, trifluoroacetic acid (TFA) has been used as a good ion pair reagent as it masks interactions between the analytes and free, active silanols on the stationary phase. However, this ion pair reagent can cause severe ion suppression when coupled to MS detection. Therefore, alternatives, like difluoroacetic acid (DFA) and ammonium formate, should be used for MS analyses as they tend to provide good ion pairing capacity while minimizing ion suppression. Figure 62 shows a comparative study of these two ion pairing reagents in separating a series of insulin variants. Note the ~2.7-fold increase in sensitivity using ammonium formate.20
Figure 60. Purification of IgG using a Protein A monolith at different flow rates. Conditions: Column: Chromolith® Protein A, 25 cm x 4.6 mm I.D., Mobile Phase: [A] 100 mM sodium phosphate, pH 7.4; [B] 100 mM sodium phosphate, pH 2.5; Gradient (for 2 mL/min flow rate): 0% B for 0.25 min; increase to 100% B in 0.1 min; hold at 100% B for 1 min, Flow Rate: 2 mL/min; Column Temperature: 25 °C, Detector: UV, 280 nm, Injection: 10 μL, Sample: IgG, 1 g/L, 100 mM sodium phosphate, pH 7.4. Figure courtesy of Dr. Egidijus Machtejevas.
10 2 3 41.50.5 2.5 3.5
Abs
orba
nce
at 2
80 n
m
Time (min)
5 mL/min
4 mL/min
3 mL/min
2 mL/min1 mL/min
Green = SPP, 1000 Å C4Yellow = SPP, 400 Å C4Purple = FPP, 300 Å C4
9070503010
-100 2 4
Retention time (min)
UV,
215 n
m (
mA
U)
6 128 10 14
Figure 61. Middle up/down analysis of Infliximab. L and H represent light and heavy chain, respectively. Conditions: Column: As indicated, 10 cm x 2.1 mm I.D., 1.7 µm (FPP), 3.4 µm (SPP, 400 Å), 2.7 µm (SPP, 1000 Å); Mobile Phase: [A] 70:30 water (0.1% (v/v) TFA): acetonitrile (0.1% (v/v) TFA); [B] 50:50 water (0.1% (v/v) TFA): acetonitrile (0.1% (v/v) TFA); Gradient: 20% B to 50% B in 10 min; 50% B to 100% B in 5 min; Flow Rate: 0.2 mL/min; Column Temperature: 75 °C; Detector: UV, 215 nm; Injection: 5.0 µL; Sample: Reduced infliximab, 100 µg/mL, water (0.05% TFA)
Figure 62. Separation of insulin variants by LC/MS using different mobile phase modifiers. Conditions: Column: BIOshell™ A160 Peptide C18, 15 cm x 2.1 mm I.D., 2.7 µm; Mobile Phase: [A] 75:25 10 mM ammonium formate, pH 2.6 with formic acid or water (0.1% (v/v) DFA): acetonitrile; [B] 50:50 10 mM ammonium formate, pH 2.6 with formic acid or water (0.1% (v/v) DFA): acetonitrile (77:23 A:B); Flow Rate: 0.2 mL/min; Column Temperature: 75 °C; Detector: MSD, ESI-(+), TIC 100–3000 m/z; Injection: 0.5 µL; Sample: Mixture of six insulin variants, 100 µg/mL, 10 mM ammonium formate, pH 2.6 with formic acid. Adapted from Reference 20.
160000000
140000000
120000000
100000000
80000000
60000000
40000000
20000000
03 3.5 4
Retention time (min)
UV
Inte
nsi
ty (
mV
)
Ammonium Formate Method
4.5 65 5.5 6.5 7
1
2
3
4
5
1. Insulin-Glargine2. Insulin-Bovine3. Insulin-Asp4. Insulin-LisPro5. Insulin-Human6. Insulin-Porcine
60000000
50000000
40000000
30000000
20000000
10000000
03 3.5 4
Retention time (min)
UV
Inte
nsi
ty (
mV
)DFA Method
4.5 65 5.5 6.5 7

55
References1. A. J. Chirino, A. Mire-Sluis, Nat. Biotechnol 22,
1383 – 1391 (2004).
2. K. Sandra, I. Vandenheede, P. Sandra, J. Chromatogr. A 1335, 81 – 103 (2014).
3. H. Liu, G. Ponniah, H. M. Zhang, C. Nowak, A. Neill, N. Gonzalez-Lopez, R. Patel, G. Cheng, A. Z. Kita, B. Andrien, mAbs 6, 1145 – 1154 (2014).
4. A. Beck, E. Wagner-Rousset, D. Ayoub, A. Van Dorsselaer, S. Sanglier-Cianferani, Anal. Chem. 85, 715 – 736 (2013).
5. J. H. Knox, High Performance Liquid Chromatography, Edinburgh University Press, 1978.
6. R. A. Henry, S. Schuster, “Impact of Pore Exclusion on Reversed-Phase HPLC Column Performance,” presented at the Eastern Analytical Symposium (EAS 2016), Somerset, New Jersey, 2016.
7. H. K. Brandes, S. Shollenberger, C. E. Muraco, Reporter 34.3, 33 – 34 (2016).
8. X. M. Lu, K. Benedek, B. L. Karger, J. Chromatogr. A 359, 19 – 29 (1986).
9. S. Fekete, S. Rudaz, J. Veuthey, D. Guillarme, J. Sep. Sci. 35, 3113 – 3123 (2012).
10. A. Goyon, A. Beck, J. Veuthey, D. Guillarme, S. Fekete, J. Pharm. Biomed. Anal. 144, 242 – 251 (2017).
11. C. E. Muraco, K. Ray, G. Oden, D. S. Bell, “Using All the Tools in the Toolbox: Characterization of A Novel Antibody-Drug Conjugate Mimic by Several Modes of Chromatography,” presented at the International Symposium on the Separation of Proteins, Peptides, and Polynucleotides (ISPPP 2017), Philadelphia, Pennsylvania, 2017.
12. B. Bobaly, G. M. Randazzo, S. Rudaz, D. Guillarme, S. Fekete, J. Chromatogr. A 1481, 82 – 91, (2017).
13. C. N. Pace, S. Trevino, E. Prabhakaran, J. M. Scholtz, Phil. Trans. R. Soc. Lond. B 359, 1225 – 1235 (2004).
14. E. Wagner-Rousset, S. Fekete, L. Morel-Chevillet, O. Colas, N. Corvaia, S. Cianferani, D. Guillarme, A. Beck, J. Chromatogr. A 1498, 147 – 154 (2017).
15. R. Romling, Reporter, 29.3, 20 – 21 (2011).
16. V. D’Atri, S. Fekete, A. Beck, M. Lauber, D. Guillarme, Anal. Chem. 89, 2086 – 2092 (2017).
17. A. Periat, S. Fekete, A. Cusumano, J. Veuthey, A. Beck, M. Lauber, D. Guillarme, J. Chromatogr. A 1448, 81 – 92 (2016).
18. A. Beck, S. Cianferani, A. Van Dorsselaer, Anal. Chem. 84, 4637 – 4646 (2012).
19. A. Beck, G. Terral, F. Debaene, E. Wagner-Rousset, J. Marcoux, M. C. Janin-Bussat, O. Colas, A. Van Dorsselaer, S. Cianferani, Expert Rev. Proteomics 13, 1 – 26 (2016).
20. C. E. Muraco, S. Shollenberger, H. K. Brandes, “Reversed-Phase HPLC Analysis of Insulin Variants and Analogs by UV and Mass Spectral Detection,” presented at the American Association of Pharmaceutical Scientists National Biotechnology Conference (AAPS NBC 2016), Boston, Massachusetts, 2016.

56
5. Troubleshooting Common HPLC IssuesIntroductionAlthough HPLC method development has been improved by advances in column technology and instrumentation, problems still arise. In this chapter, a systematic means of isolating, identifying, and correcting many typical problems encountered in the practice of HPLC will be given. The important segments of an HPLC system are the same, whether using a modular system or “cutting-edge” UHPLC instruments. Problems affecting overall system performance can arise in each component. Some common problems are discussed here.
Problem No. 1: No Peaks/Very Small Peaks
Probable Causes:1. Detector off or not sufficiently “warmed up”.2. Poor/no connection between instrument and computer.3. No mobile phase flow.4. No sample/deteriorated sample/wrong sample.5. Settings incorrect on detector.
Possible Solutions:1. Turn detector on or allow sufficient time for detector
to “warm up”.2. Check connectivity between instrument and computer.3. See “No Flow” (Problem No. 2).4. Be sure autosampler vials have sufficient liquid
and no air bubbles in the sample. Evaluate system performance with fresh standard to confirm sample as source of problem.
5. Check detector status/settings. Auto-zero if necessary.
Problem No. 2: No Flow
Probable Causes:1. Pump off.
2. Flow interrupted/obstructed.
3. Leak in the flow path.
4. Air trapped in pump head (revealed by pressure fluctuations).
Possible Solutions:1. Start pump.
2. Check mobile phase level in reservoir(s). Check flow throughout system. Examine sample loop for obstruction or air lock. Make sure mobile phase components are miscible and mobile phase is properly degassed.
3. Check system for loose fittings. Check pump for leaks, salt buildup, or unusual noises. Change pump seals if necessary.
4. Disconnect tubing at guard column (if present) or analytical column inlet. Check for flow. Purge pump at high flow rate (e.g., 5–10 mL/min), prime system if necessary (prime each pump head separately). If system has check valve, loosen valve to allow air to escape. If problem persists, flush system with 100% methanol or isopropanol. If problem still persists, contact system manufacturer.
Det
ecto
r R
espon
ceD
etec
tor
Res
pon
ceD
etec
tor
Res
pon
ce
Time
Time
Time
Normal
Problem
Problem
Det
ecto
r R
espon
ceD
etec
tor
Res
pon
ce
Time
Time
Normal
Problem

57
Problem No. 3: No Pressure/Pressure Lower Than UsualProbable Causes:1. Leak.
2. Mobile phase flow interrupted/obstructed.
3. Air trapped in pump head (revealed by pressure fluctuations).
4. Leak at column inlet end fitting.
5. Air trapped elsewhere in system.
6. Worn pump seal causing leaks around pump head.
7. Faulty check valve.
8. Faulty pump seals
Possible Solutions:1. Check system for loose fittings. Check pump for
leaks, salt buildup, or unusual noises. Change pump seals if necessary.
2. Check mobile phase level in reservoir(s). Check flow throughout system. Examine sample loop for obstruction or air lock. Make sure mobile phase components are miscible and mobile phase is properly degassed.
3. Disconnect tubing at guard column (if present) or analytical column inlet. Check for flow. Purge pump at high flow rate (e.g., 10 mL/min), prime system if necessary (prime each pump head separately). If system has check valve, loosen valve to allow air to escape.
4. Reconnect column and pump solvent at double the flow rate. If pressure is still low, check for leaks at inlet fitting or column end fitting.
5. Disconnect guard and analytical column and purge system. Reconnect column(s). If problem persists, flush system with 100% methanol or isopropanol.
6. Replace seal. If problem persists, replace piston and seal.
7. Rebuild or replace valve.
8. Replace seals.
Problem No. 4: Pressure Higher Than UsualProbable Causes:1. Problem in pump, injector, in-line filter, or tubing.
2. Obstructed guard column or analytical column.
Possible Solutions:1. Remove guard column and analytical column from
system. Replace with unions and 0.010'' I.D. or larger tubing to reconnect injector to detector. Run pump at 2–5 mL/min. If pressure is minimal, see Solution 2. If not, isolate cause by systematically
eliminating system components, starting with detector, then in-line filter, and working back to pump. Replace filter in pump if present.
2. Remove guard column (if present) and check pressure. Replace guard column if necessary. If analytical column is obstructed, reverse and flush the column, while disconnected from the detector. If problem persists, column may be clogged with strongly retained contaminants. Use appropriate restoration procedure (Appendix). If problem still persists, replace column.
Problem No. 5: Variable Retention Times
Probable Causes:1. Leak.
2. Change in mobile phase composition (small changes can lead to large changes in retention times).
3. Air trapped in pump. (Retention times increase and decrease at random times.)
4. Column temperature fluctuations (especially evident in ion exchange chromatography).
5. Column overloading. (Retention times usually decrease as mass of solute injected on column exceeds column capacity.)
6. Sample solvent incompatible with mobile phase.
7. Column problem. (Not a common cause of erratic retention. As a column ages, retention times gradually decrease.)
Det
ecto
r R
espon
ceD
etec
tor
Res
pon
ceD
etec
tor
Res
pon
ce
Time
Time
Time
Normal
Problem
Problem

58
Possible Solutions:1. Check system for loose fittings. Check pump for
leaks, salt buildup, or unusual noises. Change pump seals if necessary.
2. Check make-up of mobile phase. If mobile phase is machine mixed using proportioning values, hand mix and supply from one reservoir.
3. Purge air from pump head or check valves. Change pump seals if necessary. Be sure mobile phase is degassed.
4. Use a reliable column oven. Note that higher column temperatures increase column efficiency. For optimum results, heat eluant before introducing it onto column.
5. Inject smaller volume (e.g., 1.0 μL vs. 10.0 μL) or inject the same volume after 1:10 or 1:100 dilutions of sample.
6. Adjust solvent. Whenever possible, inject samples in starting mobile phase.
7. Substitute new column of same type to confirm column as cause. Discard old column if restoration procedures fail.
Problem No. 6: Loss of Resolution
Probable Causes:1. Mobile phase contaminated/evaporated (causing
retention times and/or selectivity to change).
2. Obstructed guard or analytical column.
Possible Solutions:1. Prepare fresh mobile phase.
2. Remove guard column (if present) and attempt analysis. Replace guard column if necessary. If analytical column is obstructed, reverse and flush. If problem persists, column may be clogged with strongly retained contaminants. Use appropriate restoration procedure (Appendix). If problem still persists, replace column.
Problem No. 7: Split Peaks
Probable Causes:1. Contamination on guard or analytical column inlet.
2. Partially blocked frit.
3. Small (uneven) void at column inlet.
4. Sample solvent incompatible with mobile phase
Possible Solutions:1. Remove guard column (if present) and attempt
analysis. Replace guard column if necessary. If analytical column is obstructed, reverse and flush. If problem persists, column may be clogged with strongly retained contaminants. Use appropriate restoration procedure (Appendix). If problem still persists, replace column.
2. Adjust solvent. Whenever possible, inject samples in starting mobile phase.
Det
ecto
r R
espon
ceD
etec
tor
Res
pon
ce
Time
Time
Normal
Problem
Det
ecto
r R
espon
ceD
etec
tor
Res
pon
ce
Time
Time
Normal
Problem

59
Problem No. 8: Peaks Tail on Initial and Later Injections
Probable Causes:1. Sample reacting with active sites.
2. Wrong mobile phase pH.
3. Wrong column type.
4. Small (uneven) void at column inlet.
5. Wrong injection solvent.
Possible Solutions:1. First check column performance with standard
column test mix. If results for test mix are good, add ion pairing reagent or competing base or acid modifier.
2. Adjust pH. For basic compounds, lower pH usually provides more symmetric peaks.
3. Try another column type.
4. See Split Peaks (Problem 7).
5. Peaks can tail when sample is injected in stronger solvent than mobile phase. Dissolve sample in mobile phase.
Problem No. 9: Tailing Peaks
Probable Causes:1. Guard or analytical column contaminated/worn out.
2. Mobile phase contaminated/evaporated.
3. Interfering components in sample.
Possible Solutions:1. Remove guard column (if present) and attempt
analysis. Replace guard column if necessary. If analytical column is source of problem, use appropriate restoration procedure (Appendix). If problem persists, replace column.
2. Check make-up of mobile phase.
3. Check column performance with a column test mix.
Det
ecto
r R
espon
ceD
etec
tor
Res
pon
ce
Time
Time
Normal
Problem
Det
ecto
r R
espon
ceD
etec
tor
Res
pon
ce
Time
Time
Normal
Problem

60
Problem No. 10: Fronting Peaks
Probable Causes:1. Column overloaded.
2. Sample solvent incompatible with mobile phase.
3. Shoulder or gradual baseline rise before a main peak may be another sample component.
Possible Solutions:1. Inject smaller volume (e.g., 1.0 μL vs. 10.0 μL).
Dilute the sample 1:10 or 1:100 fold in case of mass overload.
2. Adjust solvent. Whenever possible, inject samples in mobile phase. Flush polar bonded phase column with 50 column volumes HPLC grade ethyl acetate at 2–3 times the standard flow rate, then with intermediate polarity solvent prior to analysis.
3. Increase efficiency or change selectivity of system to improve resolution. Try another column type if necessary (e.g., switch from nonpolar C18 to polar cyano phase).
Problem No. 11: Rounded Peaks
Probable Causes:1. Detector operating outside linear dynamic range.
2. Column overloaded.
3. Sample-column interaction.
4. Detector time constants are set too high.
Possible Solutions:1. Reduce sample volume and/or concentration.
2. Inject smaller volume (e.g., 1.0 μL vs. 10.0 μL) or 1:10 or 1:100 dilution of sample.
3. Change buffer strength, pH, or mobile phase composition. If necessary, raise column temperature or change column type. (Analysis of solute structure may help predict interaction.)
4. Reduce settings to lowest values or values at which no further improvements are seen.
Det
ecto
r R
espon
ceD
etec
tor
Res
pon
ce
Time
Time
Normal
Problem
Det
ecto
r R
espon
ceD
etec
tor
Res
pon
ce
Time
Time
Normal
Problem

61
Problem No. 12: Baseline Drift
Probable Causes:1. Column temperature fluctuation. Even small changes
can cause cyclic baseline rise and fall. Most often affects refractive index and conductivity detectors, UV detectors at high sensitivity or in indirect photometric mode.
2. Nonhomogeneous mobile phase. Drift is usually to higher absorbance, rather than cyclic pattern from temperature fluctuation.
3. Contaminant or air buildup in detector cell.4. Plugged outlet line after detector. High pressure
cracks cell window, producing noisy baseline.5. Mobile phase mixing problem or change in flow rate.6. Slow column equilibration, especially when
changing mobile phase.7. Mobile phase contaminated, deteriorated, or not
prepared from high quality chemicals.8. Strongly retained materials in sample (high
retention factor (k)) can elute as very broad peaks and appear to be a rising baseline. Gradient analyses can aggravate problem.
9. Detector (UV) not set at absorbance maximum but at slope of curve.
Possible Solutions:1. Control column and mobile phase temperature; use
post-column cooler before detector.2. Use HPLC grade solvents, high purity salts, and
additives. Degas mobile phase before use if instrument is not equipped with automatic degasser.
3. Flush cell with methanol or other strong solvent. If necessary, clean cell with 1 N nitric acid (never with hydrochloric acid, and never use nitric acid with PEEK tubing or fittings).
4. Unplug or replace line. Refer to detector manual to replace window.
5. Correct composition/flow rate. To avoid problem, routinely monitor composition and flow rate.
6. Flush column with intermediate strength solvent, run 10–20 column volumes of new mobile phase through column before analysis.
7. Check make-up of mobile phase.8. Use guard column. If necessary, flush column with
strong solvent between injections or periodically during analysis.
9. Change wavelength to UV absorbance maximum.
Problem No. 13: Baseline Noise (regular)
Probable Causes:1. Air in mobile phase, detector cell, or pump.
2. Pump pulsations.
3. Incomplete mobile phase mixing.
4. Temperature effect (column at high temperature, detector unheated).
5. Leak.
Possible Solutions:1. Degas mobile phase. Flush system to remove air
from detector cell or pump.
2. Incorporate pulse damper into system.
3. Mix mobile phase by hand or use less viscous solvent.
4. Reduce differential or add post-column cooler.
5. Check system for loose fittings. Check pump for leaks, salt buildup, or unusual noises. Change pump seals if necessary.
Problem No. 14: Baseline Noise (irregular)
Probable Causes:1. Leak.
2. Mobile phase contaminated, deteriorated, or prepared from low quality materials.
Det
ecto
r R
espon
ceD
etec
tor
Res
pon
ceTime
Time
Normal
Problem
Det
ecto
r R
espon
ceD
etec
tor
Res
pon
ce
Time
Time
Normal
Problem
Det
ecto
r R
espon
ceD
etec
tor
Res
pon
ce
Time
Time
Normal
Problem
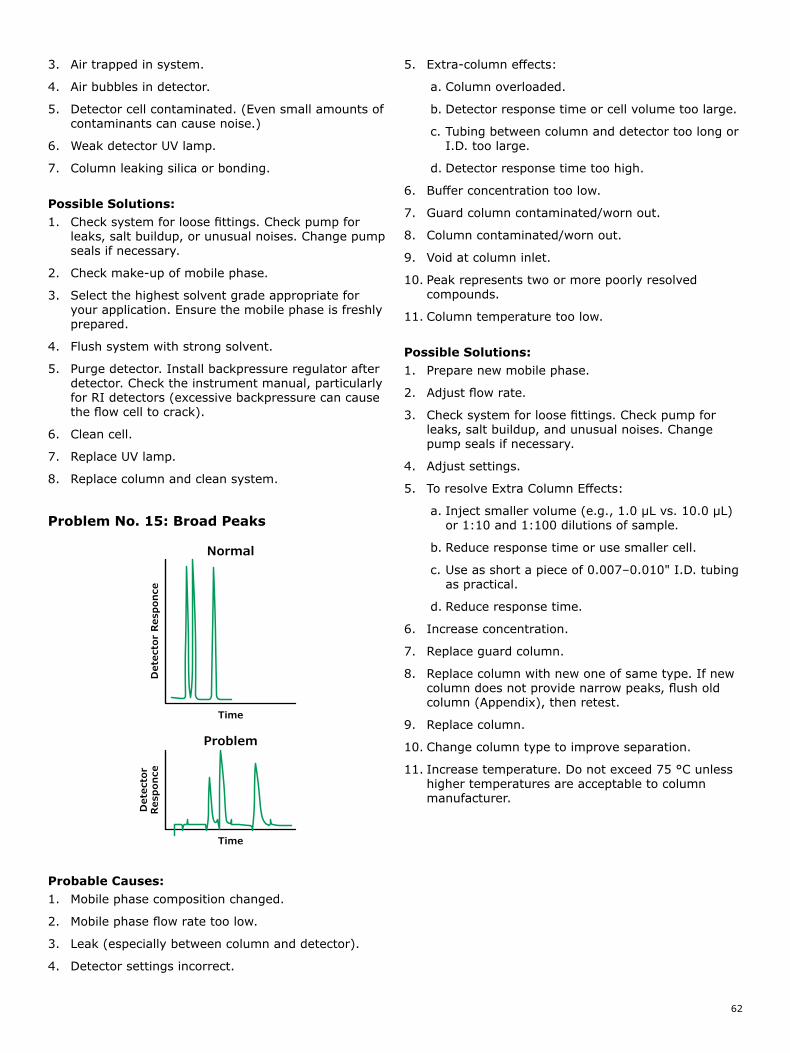
62
Problem No. 15: Broad Peaks
Probable Causes:1. Mobile phase composition changed.
2. Mobile phase flow rate too low.
3. Leak (especially between column and detector).
4. Detector settings incorrect.
3. Air trapped in system.
4. Air bubbles in detector.
5. Detector cell contaminated. (Even small amounts of contaminants can cause noise.)
6. Weak detector UV lamp.
7. Column leaking silica or bonding.
Possible Solutions:1. Check system for loose fittings. Check pump for
leaks, salt buildup, or unusual noises. Change pump seals if necessary.
2. Check make-up of mobile phase.
3. Select the highest solvent grade appropriate for your application. Ensure the mobile phase is freshly prepared.
4. Flush system with strong solvent.
5. Purge detector. Install backpressure regulator after detector. Check the instrument manual, particularly for RI detectors (excessive backpressure can cause the flow cell to crack).
6. Clean cell.
7. Replace UV lamp.
8. Replace column and clean system.
5. Extra-column effects:
a. Column overloaded.
b. Detector response time or cell volume too large.
c. Tubing between column and detector too long or I.D. too large.
d. Detector response time too high.
6. Buffer concentration too low.
7. Guard column contaminated/worn out.
8. Column contaminated/worn out.
9. Void at column inlet.
10. Peak represents two or more poorly resolved compounds.
11. Column temperature too low.
Possible Solutions:1. Prepare new mobile phase.
2. Adjust flow rate.
3. Check system for loose fittings. Check pump for leaks, salt buildup, and unusual noises. Change pump seals if necessary.
4. Adjust settings.
5. To resolve Extra Column Effects:
a. Inject smaller volume (e.g., 1.0 μL vs. 10.0 μL) or 1:10 and 1:100 dilutions of sample.
b. Reduce response time or use smaller cell.
c. Use as short a piece of 0.007–0.010" I.D. tubing as practical.
d. Reduce response time.
6. Increase concentration.
7. Replace guard column.
8. Replace column with new one of same type. If new column does not provide narrow peaks, flush old column (Appendix), then retest.
9. Replace column.
10. Change column type to improve separation.
11. Increase temperature. Do not exceed 75 °C unless higher temperatures are acceptable to column manufacturer.
Det
ecto
r R
espon
ceD
etec
tor
Res
pon
ce
Time
Time
Normal
Problem

63
Problem No. 16: Change in Peak Height (one or more peaks)
Probable Causes:1. One or more sample components deteriorated or
column activity changed.
2. Leak, especially between injection port and column inlet (retention would also change).
3. Inconsistent sample volume.
4. Detector setting changed.
5. Weak detector UV lamp.
6. Contamination in detector cell.
Possible Solutions:1. Use fresh sample or standard to confirm sample
as source of problem. If some or all peaks are still smaller than expected, replace column. If new column improves analysis, try to restore the old column, following appropriate procedure (Appendix). If performance does not improve, discard old column.
2. Check system for loose fittings. Check pump for leaks, salt buildup, or unusual noises. Change pump seals if necessary.
3. Be sure samples are consistent. For fixed volume sample loop, use 2–3 times loop volume to ensure loop is completely filled. Be sure autosampler vials contain sufficient sample and no air bubbles. Check syringe-type injectors for air. In systems with wash or flushing steps, be sure wash solution does not precipitate sample components.
4. Check settings.
5. Replace lamp.
6. Clean cell.
Problem No. 17: Change in Selectivity
Probable Causes:1. Increase or decrease solvent ionic strength, pH,
or additive concentration (especially affects ionic solutes).
2. Column changed, new column has different selectivity than old column.
3. Sample injected in incorrect solvent or excessive amount (10.0–20.0 μL) of strong solvent.
4. Column temperature change.
Possible Solutions:1. Check make-up of mobile phase.
2. Confirm identity of column packing. For reproducible analyses, use same column type. Establish whether change took place gradually. If so, bonded phase may have been stripped. Column activity may have changed, or column may be contaminated.
3. Adjust solvent. Whenever possible, inject sample in mobile phase.
4. Adjust temperature. Use column oven to maintain constant temperature.
Det
ecto
r R
espon
ce
Time
Det
ecto
r R
espon
ce
Time
Normal
Problem
Det
ecto
r R
espon
ce
Time
Det
ecto
r R
espon
ce
Time
Normal
Problem

64
Problem No. 18: Negative Peak(s)
Probable Causes:1. Refractive index of solute less than that of mobile
phase (RI detector).
2. Sample solvent and mobile phase differ greatly in composition (vacancy peaks).
3. Mobile phase more absorptive than sample components to UV wavelength.
Possible Solutions:1. Use mobile phase with lower refractive index.
2. Adjust or change sample solvent. Dilute sample in mobile phase whenever possible.
3. Change UV wavelength or use mobile phase that does not adsorb at chosen wavelength.
Problem No. 19: Ghost Peak
Probable Causes:1. Contamination in injector or column.
2. Late eluting peak (usually broad) present in sample.
Possible Solutions:1. Flush injector between analyses (a good routine
practice). If necessary, run strong solvent through column to remove late eluting compounds. Include final wash step in gradient analyses, to remove strongly retained compounds.
2. a. Check sample preparation. b. Include (step) gradient to quickly elute component.
Det
ecto
r R
espon
ce
Time
Det
ecto
r R
espon
ce
Time
Normal
Problem
Det
ecto
r R
espon
ceD
etec
tor
Res
pon
ceD
etec
tor
Res
pon
ce
Time
Time
Time
Previous Sample
Normal
Problem
(solvent injected after sample)
(solvent injected after sample)

65
Common Column Restoration Procedures*Note: The below volumes are based on optimized procedures for columns that are 4.6 mm I.D. For different I.D. columns, please convert volumes by taking the ratio of the square of the new I.D. to (4.6 mm I.D.)2 and multiplying this conversion factor to the volume. Please check the column Care and Use Guide to ensure compatibility with these solvents prior to employing these strategies to restore the column.
Part 1: Bare Silica ColumnsTo restore a bare silica column, the following procedure should be used:
1. 50 mL hexane
2. 50 mL methylene chloride
3. 50 mL 2-propanol
4. 50 mL methanol
5. 25 mL methylene chloride
6. 25 mL mobile phase
Part 2a: Silica-Based Reversed Phase Columns Analyzing Water-Soluble CompoundsTo restore a reversed-phase column that was used in analyzing water-soluble compounds, the following procedure should be employed:
1. Flush with warm (60 °C) ultrapure water
2. 50 mL methanol
3. 50 mL acetonitrile
4. 25 mL methanol
5. 25 mL mobile phase
Part 2b: Silica-Based Reversed Phase Columns Analyzing Water-Insoluble CompoundsTo restore a reversed-phase column that was used in analyzing water-insoluble compounds, the following procedure should be employed:
1. 50 mL 2-propanol
2. 50 mL methylene chloride
3. 50 mL hexane
4. 25 mL isopropanol
5. 25 mL mobile phase
Part 3: Polar-Bonded Reversed Phase Columns (Amino, Cyano, Diol, Chiral)To restore these types of columns, the following procedure should be employed:
1. For a column used in the reversed phase mode (e.g., organic solvent/aqueous buffer mobile phase), follow the same cleanup procedure as for silica-based reversed phase columns. For a column used with nonaqueous mobile phases, use the following scheme:
2. Flush with the following:
a. 50 mL chloroform
b. 50 mL methanol
c. 50 mL acetonitrile
d. 25 mL methylene chloride
e. 25 mL methanol
f. 25 mL mobile phase
Part 4: Silica-Based Ion Exchange ColumnsTo restore these ion exchange columns, the following procedure should be employed:
1. 50 mL hot (40–60 °C) distilled water
2. 50 mL methanol
3. 50 mL acetonitrile
4. 25 mL methylene chloride
5. 25 mL methanol
6. 25 mL mobile phase

66
6. Reference Materials in LC-MS/MS Applications: Quality Grades & Selection Considerations
Choosing the correct reference material quality grade for your needs
Who uses reference materials? Reference materials are a critical component of the analytical testing workflow. Through calibration of measurement systems, validation of methods, and quality control programs, reference materials ensure accuracy in testing. From certified reference materials (CRMs) and other quality grades of reference materials, to certificates of analysis, metrological traceability, and other concepts, the world of reference materials is vast, and can be confusing.
This chapter presents critical reference material topics, offering information on metrological traceability, the hierarchy of reference materials, certificates of analysis, reference material formats and uses, as well as fit-for-purpose selection considerations. Proper selection of the right reference material for a laboratory’s testing application is important because results are only as accurate as your reference.
Metrological traceability and SI Units of your reference materials Metrological traceability is an important concept in the world of reference materials. A fundamental term in metrological traceability is the International System of Units (SI) unit of measurement. The SI defines the seven units of measure as the basic set from which all other SI units can be derived. The two most common SI units of measure for traceability of reference materials are the kilogram and mole.
Metrological traceability means measurements can be meaningfully compared across difference places, at different times, by different people, using different equipment. The measurement result must be related to a reference through a documented and unbroken chain of calibrations, tracing back to the SI unit of measurement.
ISO 17034 and quality grades of standards, reference materials, and certified reference materialsThe reference material hierarchy includes five major quality grades from national metrology and other primary standards, to CRMs, reference materials (RMs), analytical standards, and research grade or research chemicals. Higher levels of certification and traceability are required with increasing levels of quality grade. While national governments give standardization to the top level, specific ISO guidelines provide standardization for CRMs and RMs. These ISO requirements include ISO 17034, ISO/IEC 17025, and ISO Guide 31.
Reference material producers must meet these ISO requirements to manufacture CRMs or RMs. For both of these quality grades, Certificates of Analysis must be provided and the information contained within is defined by the aforementioned ISO guidelines. The quality specifications for the last two levels are defined by each individual producer rather than by a national government or ISO accreditations specific to CRMs and RMs.
Mass— Kilogram
Length— Metre/Meter
Time— Second
Electric Current—Ampere
Temperature—Kelvin
Amount of Substance—
Mole
Luminous Intensity—
Candela m
kg
cd
K A
s
mol
Figure 63. Metrological Traceability—SI Unit of Measurement

67
Figure 64. The Hierarchy of Reference Materials—What are the Different Types?
Table 17. The Hierarchy of Reference Materials—What’s the Difference?
What is measured in each grade of reference material?Purity and identity of the material are typically included in the Certificate of Analysis for each of the five quality grades. Content and stability are required for primary standards or ISO-defined CRMs and RMs.
Analytical standards and research chemicals may or may not include these two parameters as their inclusion is dependent on the producer. Analytical standards can also in some cases be quality control materials compliant with ISO Guide 80.
Homogeneity is required for the primary standards, CRMs, and RMs, but this parameter will not be found with the lower quality grades. Uncertainty and traceability information are limited to only primary standards and CRMs. In the pharmaceutical world, secondary standards can be CRMs or RMs, but here, there are two different types of traceability: to the SI unit of measurement for ISO-defined CRMs, and traceability to the primary compendial standard, which is a requirement specific to pharmaceutical secondary standards.
Leve
l of C
ertifi
catio
n an
d Tr
acab
ility
National Metrology Standard (e.g. NIST, JRC, NMI Australia)Compendial Standard (e.g. USP, EP, BP, JP, IP)• Issued by an authorized body• Considered to provide the highest level of accuracy &
traceability
Certified Reference Material (CRM) (ISO 17034, 17025)• Considered to provide the highest level of accuracy,
uncertainty, and traceability to an SI unit of measurement• Manufactured by an accredited Reference Material Producer
Reference Material (RM) (ISO 17034)• Fulfilling ISO requirements which are less demanding than
for CRMs• Manufactured by an accredited Reference Material Producer
Analytical Standard (ISO 9001)• Certificate of Analysis available• Level of certification varies
Reagent Grade/Research Chemical• May come with a Certificate of Analysis• Are not characterised for use as reference materials
Parameter NMI StandardCompendial
Standard CRM RMAnalytical Standard
Research Chemical
Purity 4 4 4 4 4 4
Identity 4 4 4 4 4 4
Content 4 4 4 4 maybe
Stability 4 4 4 4 4
Homogeneity 4 4 4 4
Uncertainty 4 4
Traceability 4 4 4
Type Primary Measurement Standard or
Primary Standard (Pharma)
Primary or Secondary Standard (Pharma)
Secondary Standard (Pharma)

68
Understanding your reference material Certificate of AnalysisWith the CRM or RM grade comes a Certificate of Analysis (CoA). Within the CoA, there are several quality parameters which are critical to understand: accuracy, consistency, homogeneity, purity, and stability. Also, which property is being certified is important to understand, whether it be concentration, potency, or content.
Be sure to examine the CoA for the producer’s quality systems, the reference material’s certification process, and supporting information on traceability for a CRM. The CoA is important since it can give the laboratory information which ensures the reference material’s certification is fit for purpose within the testing method or application.
Figure 65. The components of a CoA.
AccuracyComparison to a primary source or certified second source—curve/calibration standard. Comparison of multiple independent preparations.
ConsistencyLot-to-lot consistency verified by comparing to the previous lot.
StabilityExpiration date established though real-time stability studies.
HomogeneityAcross the batch of ampoules/vials.
PurityConsistent with the neat material. No contamination or degradation.
Sigma-Aldrich Production GmbH, Industriestrasse 25, 9471 Buchs, Switzerland; Tel +41-81-755-2511; Fax +41-81-756-5449; www.sigmaaldrich.com Sigma-Aldrich Production GmbH is a subsidiary of Merck KGaA, Darmstadt, Germany. Certificate Page 1 of 4 Certificate version 01
Certificate of Analysis – Certified Reference Material
Gold standard for ICP
Product no.: 38168
Lot no.: Sample
Description of CRM: Gold metal (high-purity quality) in 5% HCl (prepared with HCl suitable for trace analysis and high-purity water, 18.2 MΩ.cm, 0.22 µm filtered).
Expiry date: NOV 2020
Storage: 5-30°C
Density (certified) at 20°C: 1024.2 kg m-3 ± 0.5 kg m-3
Constituent Certified values at 20°C and expanded uncertainties, U = k .u (k = 2) [1][2]
Gold 976 mg kg-1 ± 2 mg kg-1 1’000 mg L-1 ± 2 mg L-1
Metrological traceability: Certified values are traceable to the International System of units (SI) through a metrologically valid weighing process. Details see “Details on metrological traceability”. [3]
Measurement method: The certified value is determined by high-precision weighing of thoroughly characterized starting materials and verified by measurement against NIST SRMs or similar CRMs
Intended use: Calibration of ICP, AAS, spectrophotometry or any other analytical technique.
Instructions for handling and correct use:
This reference material shall be stored in the original closed bag between 5°C and 30°C. Before every use of the material the bottle must be shaken well and its temperature has to be 20°C. If storage of a partially used bottle is necessary, the cap should be tightly sealed and the bottle should be stored at reduced temperature (e.g. refrigerator) to minimize transpiration rate. We highly recommend using this reference material no longer than 15 months after the aluminum bag was opened.
Health and safety information:
Please refer to the Safety Data Sheet for detailed information about the nature of any hazard and appropriate precautions to be taken.
Accreditation: Sigma-Aldrich Production GmbH is accredited by the Swiss accreditation authority SAS as registered reference material producer SRMS 0001 in accordance with ISO 17034 and registered testing laboratory STS 0490 according to ISO/IEC 17025.[4][5]
Certificate issue date: 04 APR 2019
Packaging: 100 mL HDPE bottle sealed with an aluminized bag
ISO 17034 SRMS 0001
ISO/IEC 17025STS 0490
ISO 9001 005356 QM08
S. Matt – CRM Operations Dr. P. Zell – Approving Officer
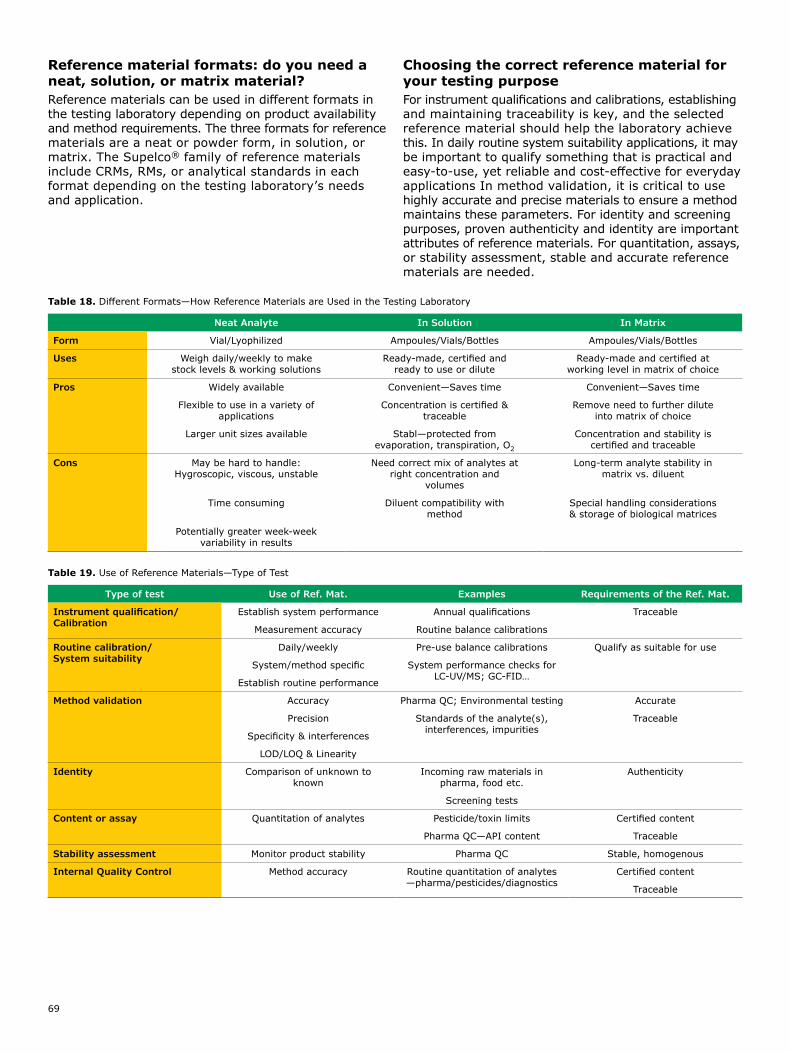
69
Table 18. Different Formats—How Reference Materials are Used in the Testing Laboratory
Neat Analyte In Solution In Matrix
Form Vial/Lyophilized Ampoules/Vials/Bottles Ampoules/Vials/Bottles
Uses Weigh daily/weekly to make stock levels & working solutions
Ready-made, certified and ready to use or dilute
Ready-made and certified at working level in matrix of choice
Pros Widely available Convenient—Saves time Convenient—Saves time
Flexible to use in a variety of applications
Concentration is certified & traceable
Remove need to further dilute into matrix of choice
Larger unit sizes available Stabl—protected from evaporation, transpiration, O2
Concentration and stability is certified and traceable
Cons May be hard to handle: Hygroscopic, viscous, unstable
Need correct mix of analytes at right concentration and
volumes
Long-term analyte stability in matrix vs. diluent
Time consuming Diluent compatibility with method
Special handling considerations & storage of biological matrices
Potentially greater week-week variability in results
Table 19. Use of Reference Materials—Type of Test
Type of test Use of Ref. Mat. Examples Requirements of the Ref. Mat.
Instrument qualification/ Calibration
Establish system performance Annual qualifications Traceable
Measurement accuracy Routine balance calibrations
Routine calibration/ System suitability
Daily/weekly Pre-use balance calibrations Qualify as suitable for use
System/method specific System performance checks for LC-UV/MS; GC-FID…
Establish routine performance
Method validation Accuracy Pharma QC; Environmental testing Accurate
Precision Standards of the analyte(s), interferences, impurities
Traceable
Specificity & interferences
LOD/LOQ & Linearity
Identity Comparison of unknown to known
Incoming raw materials in pharma, food etc.
Authenticity
Screening tests
Content or assay Quantitation of analytes Pesticide/toxin limits Certified content
Pharma QC—API content Traceable
Stability assessment Monitor product stability Pharma QC Stable, homogenous
Internal Quality Control Method accuracy Routine quantitation of analytes —pharma/pesticides/diagnostics
Certified content
Traceable
Reference material formats: do you need a neat, solution, or matrix material?Reference materials can be used in different formats in the testing laboratory depending on product availability and method requirements. The three formats for reference materials are a neat or powder form, in solution, or matrix. The Supelco® family of reference materials include CRMs, RMs, or analytical standards in each format depending on the testing laboratory’s needs and application.
Choosing the correct reference material for your testing purposeFor instrument qualifications and calibrations, establishing and maintaining traceability is key, and the selected reference material should help the laboratory achieve this. In daily routine system suitability applications, it may be important to qualify something that is practical and easy-to-use, yet reliable and cost-effective for everyday applications In method validation, it is critical to use highly accurate and precise materials to ensure a method maintains these parameters. For identity and screening purposes, proven authenticity and identity are important attributes of reference materials. For quantitation, assays, or stability assessment, stable and accurate reference materials are needed.
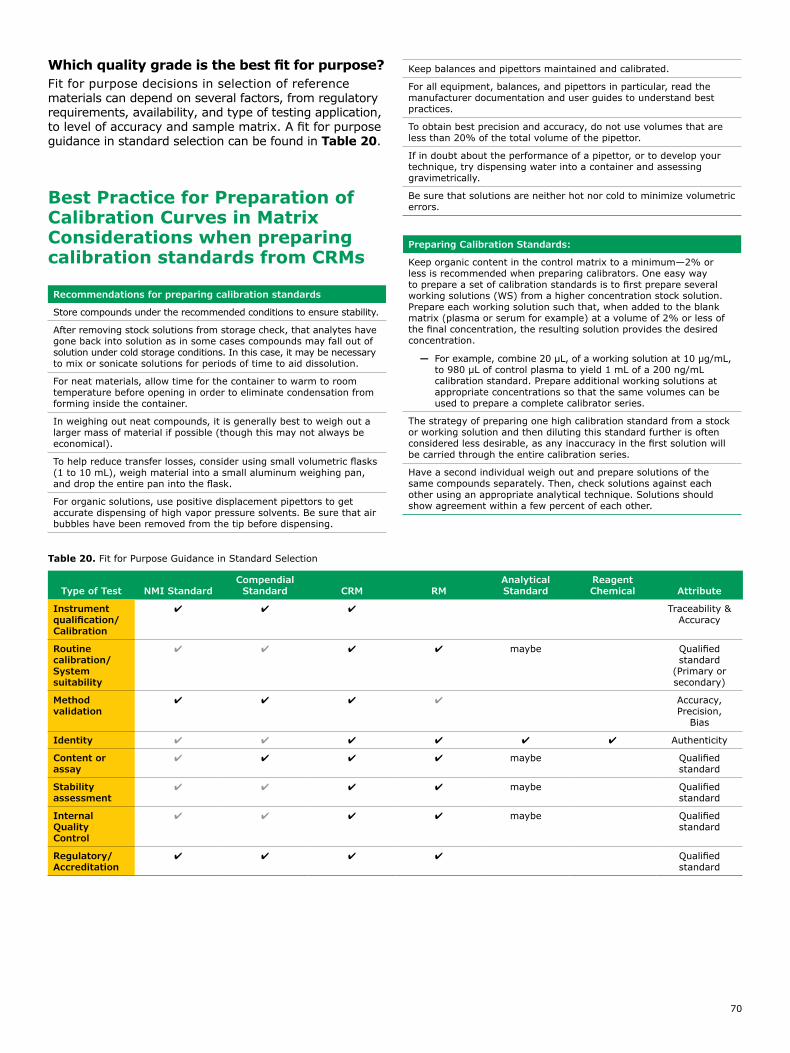
70
Which quality grade is the best fit for purpose?Fit for purpose decisions in selection of reference materials can depend on several factors, from regulatory requirements, availability, and type of testing application, to level of accuracy and sample matrix. A fit for purpose guidance in standard selection can be found in Table 20.
Best Practice for Preparation of Calibration Curves in Matrix Considerations when preparing calibration standards from CRMs
Recommendations for preparing calibration standards
Store compounds under the recommended conditions to ensure stability.
After removing stock solutions from storage check, that analytes have gone back into solution as in some cases compounds may fall out of solution under cold storage conditions. In this case, it may be necessary to mix or sonicate solutions for periods of time to aid dissolution.
For neat materials, allow time for the container to warm to room temperature before opening in order to eliminate condensation from forming inside the container.
In weighing out neat compounds, it is generally best to weigh out a larger mass of material if possible (though this may not always be economical).
To help reduce transfer losses, consider using small volumetric flasks (1 to 10 mL), weigh material into a small aluminum weighing pan, and drop the entire pan into the flask.
For organic solutions, use positive displacement pipettors to get accurate dispensing of high vapor pressure solvents. Be sure that air bubbles have been removed from the tip before dispensing.
Keep balances and pipettors maintained and calibrated.
For all equipment, balances, and pipettors in particular, read the manufacturer documentation and user guides to understand best practices.
To obtain best precision and accuracy, do not use volumes that are less than 20% of the total volume of the pipettor.
If in doubt about the performance of a pipettor, or to develop your technique, try dispensing water into a container and assessing gravimetrically.
Be sure that solutions are neither hot nor cold to minimize volumetric errors.
Preparing Calibration Standards:
Keep organic content in the control matrix to a minimum—2% or less is recommended when preparing calibrators. One easy way to prepare a set of calibration standards is to first prepare several working solutions (WS) from a higher concentration stock solution. Prepare each working solution such that, when added to the blank matrix (plasma or serum for example) at a volume of 2% or less of the final concentration, the resulting solution provides the desired concentration.
— For example, combine 20 µL, of a working solution at 10 µg/mL, to 980 µL of control plasma to yield 1 mL of a 200 ng/mL calibration standard. Prepare additional working solutions at appropriate concentrations so that the same volumes can be used to prepare a complete calibrator series.
The strategy of preparing one high calibration standard from a stock or working solution and then diluting this standard further is often considered less desirable, as any inaccuracy in the first solution will be carried through the entire calibration series.
Have a second individual weigh out and prepare solutions of the same compounds separately. Then, check solutions against each other using an appropriate analytical technique. Solutions should show agreement within a few percent of each other.
Table 20. Fit for Purpose Guidance in Standard Selection
Type of Test NMI StandardCompendial
Standard CRM RMAnalytical Standard
Reagent Chemical Attribute
Instrument qualification/ Calibration
4 4 4 Traceability & Accuracy
Routine calibration/ System suitability
4 4 4 4 maybe Qualified standard
(Primary or secondary)
Method validation
4 4 4 4 Accuracy, Precision,
Bias
Identity 4 4 4 4 4 4 Authenticity
Content or assay
4 4 4 4 maybe Qualified standard
Stability assessment
4 4 4 4 maybe Qualified standard
Internal Quality Control
4 4 4 4 maybe Qualified standard
Regulatory/ Accreditation
4 4 4 4 Qualified standard

71
AppendixAbbreviationsAPCI Atmospheric pressure chemical ionization
CA Charged aerosol (detector)
DAD Diode array detector
DMSO Dimethyl sulfoxide
EC Electrochemical (detector)
ELS Evaporative light scattering (detector)
ESI Electrospray Ionization
FL Fluorescence (detector)
GC Gas chromatography
HILIC Hydrophilic liquid interaction chromatography
HPLC High performance liquid chromatography
i.d. Internal diameter
LC Liquid Chromatography
LLE Liquid-liquid extraction
LOD limit of detection
LOQ limit of quantification
MS Mass spectrometry/spectrometer
NP Normal phase
PEEK Polyetheretherketone
PES Polyethersulfone
PTFE Polytetrafluoro ethylene
PVDF Polyvinyliden fluoride
RAM Restricted access materials
RI Refractive index (detector)
RP Reversed phase
RSD Relative standard deviation
S/N Signal to noise ratio
SPE Solid phase extraction
SPP Superficially porous particle
SST System suitability test
TFA Trifluoroacetic acid
THF Tetrahydrofuran
TPP Totally porous particle
UHPLC Ultra high performance liquid chromatography
USP US pharmacopoeia
UV/Vis Ultraviolet/Visible (detector)
ZIC Zwitterionic
Links and Literature for Download• LC-MS Resource guide
• HPLC Columns selection guide for small molecules separation wallchart
• Chiral selection guide wallchart
• HPLC Troubleshooting Guide “Untangle your liquid chromatography problems”
• Ascentis® Express columns brochure
• BIOshell™ columns brochure
• Chromolith® columns brochure
• Puropher™ STAR columns brochure
• Discovery® BIO columns brochure
• SigmaAldrich.com

72

© 2021 Merck KGaA, Darmstadt, Germany and/or its affiliates. All Rights Reserved. Merck, the vibrant M, Supelco, Sigma-Aldrich, Chromolith, Ascentis, BIOshell, Purospher, Milli-Q, Supel, Discovery, Titan, SeQuant, LiChroCART, Hibar, ZIC, Durapore, Express Plus, Extrelut, CHIROBIOTIC, CapRod, and Millex are trademarks of Merck KGaA, Darmstadt, Germany or its affiliates. All other trademarks are the property of their respective owners. Detailed information on trademarks is available via publicly accessible resources.
To place an order or receive technical assistance in Europe, please call Customer Service:France: 0825 045 645 Germany: 069 86798021 Italy: 848 845 645
Spain: 901 516 645 Option 1 Switzerland: 0848 645 645 United Kingdom: 0870 900 4645
For other countries across Europe, please call: +44 (0) 115 943 0840 Or visit: MerckMillipore.com/offices For Technical Service visit: MerckMillipore.com/techservice
Merck KGaAFrankfurter Strasse 250 64293 Darmstadt, Germany
MerckMillipore.com
MK_BR6818EN Ver. 1.03440105/2021
![What is HPLC? High Performance Liquid Chromatography High Pressure Liquid Chromatography (usually true] Hewlett Packard Liquid Chromatography (a joke)](https://static.fdocuments.in/doc/165x107/56649c855503460f9493c784/what-is-hplc-high-performance-liquid-chromatography-high-pressure-liquid-chromatography.jpg)