
A Practical Guide on Designing and Conducting Impact Studies in ...
45
1000 THOMAS JEFFERSON STREET, NWWASHINGTON, DC 20007-3835TEL 202 403 5000FAX 202 403 5020WEBSITE WWW.AIR.ORG A Practical Guide on Designing and Conducting Impact Studies in Education: Lessons Learned From the What Works Clearinghouse (Phase I) Mengli Song Rebecca Herman American Institutes for Research Prepared for: William T. Grant Foundation June 2009 (Revised June 2010)
Transcript of A Practical Guide on Designing and Conducting Impact Studies in ...

1000 THOMAS JEFFERSON STREET, NWWASHINGTON, DC 20007-3835TEL 202 403 5000FAX 202 403 5020WEBSITE WWW.AIR.ORG
A Practical Guide on Designing and Conducting Impact Studies in Education:
Lessons Learned From the What Works Clearinghouse (Phase I)
Mengli Song
Rebecca Herman
American Institutes for Research
Prepared for:
William T. Grant Foundation
June 2009
(Revised June 2010)

ii
Acknowledgement
This paper was written with support from a William T. Grant Foundation Officers’ Discretionary
Grant. The contents of this paper are based primarily on work conducted during the first phase of
the What Works Clearinghouse (WWC) funded by the U.S. Department of Education's Institute
of Education Sciences. The reader should not assume, however, that either funding agency has
endorsed any of the ideas presented in this paper. We thank the technical advisors of the first
phase of the WWC for their invaluable guidance on the development of WWC standards and
technical guidance: Betsy Becker, Jessie Berlin, Robert Boruch, Thomas Cook, Harris Cooper,
David Francis, Larry Hedges, Mark Lipsey, Rebecca Maynard, David Myers, Andy Porter,
David Rindskopf, William Shadish, and Jeffrey Valentine. We also thank Michael S. Garet,
Rebecca Maynard, and Jeffrey Valentine for their extremely helpful comments on earlier drafts
of this paper. All errors remain, of course, the responsibility of the authors.

iii
Contents
Acknowledgement ......................................................................................................................... ii
Introduction ................................................................................................................................... 1
Sampling Design ............................................................................................................................ 1 Overview ..................................................................................................................................... 1
Sample Allocation for Randomized Controlled Trials ............................................................... 2
Methods of Random Assignment............................................................................................ 3
Functionally Random Assignment .......................................................................................... 3
Level of Random Assignment ................................................................................................ 4
The ―N=1‖ Problem ................................................................................................................ 5
Sample Allocation for QEDs ...................................................................................................... 8
Equating Groups Through Matching ...................................................................................... 9
Equating Groups Through Statistical Adjustment ................................................................ 11
Statistical Power and Sample Size ............................................................................................ 13
Power and Study Design ....................................................................................................... 14
Power and Sampling Plan ................................................................................................. 14
Power and Analysis Model ............................................................................................... 14
Power and Alpha ................................................................................................................... 16
Power and Effect Size ........................................................................................................... 16
Conducting Power Analysis Based on MDES ...................................................................... 17
Study Implementation ................................................................................................................ 17 Measurement of Outcomes ....................................................................................................... 17
Explication of Constructs: Grain Size................................................................................... 18
Explication of Constructs: Face Validity and Reliability of Outcome Measures ................. 19
Construct Confounding: Overalignment of Outcome Measures .......................................... 20
Implementation Fidelity ............................................................................................................ 21
Attrition ..................................................................................................................................... 22
Differential Versus Overall Attrition .................................................................................... 23
Systematic Versus Random Causes of Attrition ................................................................... 24
Replacement of Dropouts After Randomization................................................................... 25
Critical Issues in Data Analysis ................................................................................................. 26 Proper Unit of Analysis for Clustered Data .............................................................................. 26
Adjustment for Multiple Comparisons ..................................................................................... 27
Reporting ..................................................................................................................................... 28 Full Reporting Guidelines ......................................................................................................... 29
Title and Abstract .................................................................................................................. 30
Background and Purpose ...................................................................................................... 30
Methods................................................................................................................................. 30
Results ................................................................................................................................... 31
Discussion ............................................................................................................................. 31
Common Missing Information From Reports of Education Interventions ............................... 32

iv
Missing Information About Sampling Design ...................................................................... 32
Inadequate Reporting of Effect Sizes ................................................................................... 33
Concluding Remarks .................................................................................................................. 34
References .................................................................................................................................... 35

1
Introduction
The What Works Clearinghouse (WWC) was established in 2002 by the U.S. Department of
Education's Institute of Education Sciences (IES) to evaluate and synthesize research evidence
for the effectiveness of educational interventions and to serve as a central and trusted source of
scientific evidence for what works in education.1 The purpose of this paper is to provide practical
guidance on critical design, implementation, analysis, and reporting issues for impact studies in
education and related fields, drawing upon our five years of experience with the first phase of the
WWC as well as state-of-the-art knowledge of the field. 2
We will also illustrate, with real
examples from the WWC reviews, common pitfalls to avoid in designing and conducting impact
studies. Unless otherwise noted, discussions related to the WWC pertain only to WWC’s work
during its first five years.
This paper is not meant to be a comprehensive handbook about research design, but rather a
quick reference guide highlighting some of the key issues in impact studies based on our WWC
experience. The audience for this paper is researchers—primarily novice researchers and even
some experienced researchers—who design and conduct impact studies in education and other
social science fields. Information presented in this paper also may help consumers of such
research (e.g., peer researchers, policy makers, intervention developers, and practitioners) make
better informed judgments about the quality of the research and the credibility of the evidence
produced from the research.
This paper is organized in the order in which an impact study is typically conducted. We will
first discuss issues related to sampling design, and then issues pertaining to study
implementation, data analysis, and reporting. The paper ends with concluding remarks.
Sampling Design
Overview
The quality of an impact study hinges critically upon its sampling design, particularly on whether
a comparison group is used and if so, the nature of the comparison group. Impact studies that
employ one-group pretest-posttest designs are subject to serious threats to internal validity
(Shadish, Cook, & Campbell, 2002). It is widely recognized that the use of a comparison group
that is similar to the intervention group is essential, although not necessarily sufficient, for
drawing valid inference about an intervention’s impact. This is because a comparison group that
did not receive the intervention but was otherwise similar to the intervention group allows us to
1 The first phase of the WWC was administered by IES through a five-year contract with the American Institutes for
Research® and the Campbell Collaboration. The clearinghouse is currently operated by Mathematica Policy
Research, Inc. 2 By ―impact studies,‖ we refer to studies that are designed to assess the impact of an intervention—which may be a
program, a product, a practice, or a policy—on certain outcomes, such as student achievement.

2
infer what would have happened in the absence of the intervention, which provides the basis for
estimating the causal effect of the intervention.3
This paper, therefore, focuses on designs of impact studies that incorporate a comparison group
created through either random or nonrandom sample allocation. In the remainder of this section,
we discuss issues related to sample allocation for both randomized controlled trials (RCT) and
quasi-experimental designs (QED) with equating, which are rigorous designs most commonly
used for impact studies in education and the focus of the WWC Phase I standards development
and study reviews.4 We will also discuss issues related to statistical power and sample size,
which, although not the focus of WWC standards or reviews, are other key aspects of sampling
design for impact studies.
Sample Allocation for Randomized Controlled Trials
Random assignment is the hallmark of RCTs. It refers to the assignment of units (e.g., students,
classrooms, schools, or districts) to different study conditions based entirely on chance. Random
assignment ensures that prior to the intervention, participants in the intervention group are
similar on both observed and unobserved characteristics to their counterparts in the comparison
group.5 If random assignment is successfully implemented, then differences between the two
groups observed after the intervention are more likely to be caused by the intervention rather
than their preexisting differences. In the absence of random assignment, however, the study
groups may differ in important characteristics prior to the intervention. As a result, inferences
about the intervention’s causal effects based on the observed differences between groups after
the intervention are necessarily more tentative, because we will be unable to rule out alternative
explanations (e.g., preexisting differences between the groups) for the observed differences.
By means of random assignment, RCTs provide the most reliable study design for causal
inference, and are considered the ―gold standard‖ for impact studies. Although nonrandomized
experiments often incorporate design features to approximate RCTs, they could not always
replicate the results generated by RCTs. The impact estimates based on randomized experiments
and nonrandomized experiments testing the same interventions often produce different results;
the differences are sometimes substantial and often unpredictable (Bloom, Michalopoulos,
3 The causal effect of an intervention, under Rubin’s potential outcomes framework of causality, is the average
difference between the outcomes that were observed for subjects who received the intervention and the outcomes
that would have been observed had the subjects not received the intervention (Rubin, 1974; Little & Rubin, 2001). 4 QEDs also include regression discontinuity designs and single-case designs. Regression discontinuity designs are
designs in which participants are assigned to the intervention and the comparison conditions based on a cutoff score
on a preintervention measure that typically assesses need or merit. Single-case designs are designs that involve
repeated measurement of a single subject in different conditions or phases over time. As the WWC standards for
these special QED designs are still under development, we will not address them in this paper.
Studies reviewed by the WWC were judged against the WWC Evidence Standards (WWC, 2006a). Well designed
and implemented RCTs Met Evidence Standards. QEDs with equating and no severe design or implementation
problems and RCTs with severe design or implementation problems Met Evidence Standards With Reservations,
Studies providing insufficient causal evidence for an intervention’s effect Did Not Meet Evidence Screens. 5 To be more precise, randomization equates groups on expectation; that is, on the mean of the distribution of sample
means resulting from all possible random assignments of units to conditions (Shadish et al., 2002). In reality, it is
possible that the randomized groups may differ on observed characteristics by chance; such differences can be
substantial, particularly when the sample size is small.

3
& Hill, 2005; Fraker & Maynard, 1987; Glazerman, Levy, & Myers, 2003; and Kunz & Oxman,
1998). It is generally agreed that nonrandomized experiments are no substitute for RCTs,
although nonrandomized experiments may produce impact estimates that are comparable to
those based on RCTs under certain circumstances (Cook, Shadish, & Wong, 2008).6
Methods of Random Assignment
Random assignment of study participants to different study conditions is often carried out by
means of a random number table or a random number generator, the flip of a coin, or the roll of a
die. What these procedures have in common is that the determination of each participant’s
assignment is completely based on chance and is totally unpredictable and, hence, ―random.‖
The random assignment can be arranged so that the number of participants allocated to each
study condition is the same (i.e., balanced sample allocation). It may also be arranged so that
participants are allocated to study conditions based on a pre-specified ratio (e.g., two comparison
units for every intervention unit). Unbalanced sample allocation may be justified in certain
situation. For example, an intervention may be deemed too expensive to implement across a
large group of participants; the researcher therefore may choose to assign more participants to
the comparison group than to the intervention group under budget constraints.
Random assignment can be carried out across the full sample or within blocks or strata that
consist of participants with similar characteristics. A study of a teacher professional development
program, for instance, may randomly assign teachers to the program group or the comparison
group within each participating school rather than across all participating schools. This type of
design is often referred to as a multisite design, where each block (school in the example) can be
viewed as a distinct study site and the overall study viewed as a series of site-specific
replications. The use of blocking ensures that all blocks are properly represented in each study
condition. Moreover, it may help improve the precision of the impact estimates, as will be
explained in the section on statistical power.
Functionally Random Assignment
Sometimes researchers form study groups through haphazard assignment, a procedure that is not
formally random but is ostensibly irrelevant to the characteristics of the study participants or
outcomes. Some haphazard assignment procedures may approximate random assignment
reasonably well in certain circumstances and may be considered functionally random. For
example, a researcher may first order students by an identification code (e.g., social security
number) and then alternate assignment by the last digit of the identification code (e.g., ―evens‖
are placed into Group A and ―odds‖ Group B). Since students whose identification code ends
with an even number are unlikely to be systematically different from students whose
identification code ends with an odd number, this method of assignment can be considered
functionally random. Other examples of haphazard assignment that might be functionally
random include (a) alternating alphabetically by last name (e.g., Acosta is placed into Group A,
6 Cook et al. (2008) suggest three conditions under which a nonrandomized experiment may produce causal
estimates that are comparable to those based on a randomized experiment: (1) It uses a regression discontinuity
design; (2) it matches intact treatment and comparison groups on at least the pretest; or (3) it properly models the
selection process.

4
and Aguilera Group B) and (b) alternating by date of birth (e.g., January 5 is placed into Group
A, January 7 Group B, January 13 Group A, and so on).
As Rosenbaum (1999) points out, however, haphazard is not random, and ostensibly haphazard
assignment can produce severe and undetected biases that would not be present with truly
random assignment. Examples of haphazard assignment that are unlikely to be functionally
random include (a) placing birth months January–June into Group A, birth months
July–December into Group B; (b) placing participants with a last name beginning with A–M into
Group A, and last names beginning with N–Z into Group B; and (c) placing the first 20 arrivals
into Group A, and the last 20 arrivals into Group B. These seemingly haphazard assignment
methods may actually result in systematically different study groups. In the last example, for
instance, the early arrivals are likely to have a stronger interest in the event and more motivated
to attend the event than late arrivals, and such differences may introduce selection bias that
confounds the intervention’s effects.
A special type of haphazard assignment procedure adopted by some education researchers is to
assign students to different study conditions using a class-scheduling software program.
Although assignment based on scheduling programs could be functionally random, very often it
is not, because there are typically pre-specified rules or constraints in the scheduling process. For
example, certain types of students or classes (e.g., gym, band, and art classes) might be first
entered into the scheduling system before the other students are randomly assigned. This might
mean, for example, that all students who take band are not eligible for placement in the
intervention class(es), but are placed in the comparison class(es). Such nonrandom rules or
constraints imposed on an otherwise random scheduling process is likely to compromise the
randomness of sample assignment unless (1) such rules or constraints are completely unrelated to
student characteristics or outcomes, or (2) the analytic sample of the impact analysis is limited to
students not affected by the nonrandom scheduling rules or constraints.
Unlike random assignment, which is based on fact, haphazard assignment involves judgment,
and it is often difficult to determine what is functionally random and what is not. The use of
haphazard assignment, therefore, should generally be avoided, particularly given that true
random assignment is often feasible in situations where haphazard assignment is feasible.
Level of Random Assignment
Random assignment can take place at different levels. In individual randomized trials,
individuals are randomly assigned to the intervention condition and the comparison condition. In
cluster randomized trials (CRT), which are also referred to as group randomized trials or
place-based randomized trials, entire clusters or groups of individuals (e.g., classrooms, schools,
or districts) are randomly assigned to different conditions. The randomization of clusters ensures
that the study groups will be equivalent on expectation (i.e., on the average values across all
possible randomized samples) in both cluster and individual characteristics, even if
randomization is not carried out at the individual level. Nevertheless, individuals could be
randomly assigned to clusters before clusters are randomly assigned to conditions, which will
lead to improved statistical power and greater precision of the impact estimate (Schochet,
2008a).

5
In education as well as other social science fields, CRTs have become a popular design choice
for a number of reasons (Bloom, 2005). First, most educational interventions are intended to be
implemented at the cluster level (e.g., whole-school reform operates across the school). It is
therefore logical to carry out the assignment at the cluster level as well. Second, a major problem
with individual randomized trials is treatment diffusion or spillover, which occurs when
individuals in the intervention condition influence individuals in the comparison condition
through, for instance, sharing intervention information or experiences. Because the comparison
group receives some of the same treatment given to the intervention group, spillover weakens the
intervention/control contrast and therefore dilutes the intervention’s effect. By creating a spatial
separation between individuals in different study conditions, randomization at the cluster level
can potentially minimize the occurrence of spillover effects and maintain the integrity of random
assignment. Finally, from a practical point of view, randomizing clusters, such as whole schools,
instead of individual students, is likely to incur less political opposition and logistical challenges
and is thus often a more viable option.
CRTs, however, have drawbacks as well. During our WWC Phase I reviews, we found that most
CRTs in education were based on a limited number, sometimes only a handful, of clusters. One
obvious consequence of having too few clusters is the lack of statistical power. As will be
explained later, the statistical power of a CRT depends primarily on the number of clusters rather
than the number of individuals within clusters. As a result, CRTs generally need a much larger
sample size and incur higher costs in order to achieve the same level of power as RCTs with
individual-level assignment.
Another potential problem with CRTs is that when very few clusters are randomly assigned,
randomization may fail to balance all sample characteristics, and the differences in covariate
distributions across study conditions may introduce selection bias that confounds the
intervention’s effect. This is because randomization relies on the law of large numbers and
equates groups on the expected values of pre-intervention characteristics over all possible
randomized samples, but not necessarily on the observed values of a particular sample. When
only a small number of units are randomized, it is quite possible that the study groups will differ
in important ways due to large sampling errors. In extreme cases, a study sample may include
only two clusters (e.g., teachers, classrooms, or schools), with one cluster randomly assigned to
each condition. Such ―N=1‖ studies are particularly problematic in that randomization in this
case is completely ineffective in removing preexisting differences between the study groups, as
we will explain in further detail under Scenario (1) in the section to follow.
The “N=1” Problem
―N=1‖ studies include CRTs with only two clusters as well as other types of RCTs and QEDs
with only one cluster per condition. A major problem with such studies is that the intervention’s
effects may be completely confounded with cluster effects (e.g., teacher effects or school
effects), which makes it impossible to draw a valid conclusion about the intervention’s effects
unless it is reasonable to assume that cluster effects are negligible. This assumption, however, is
often untenable (e.g., in a study of classroom practice, it is equivalent to assuming that there are
no teacher effects). Surprisingly, such ―N=1‖ studies are by no means rare. Over 70 QEDs of
beginning reading interventions, for example, that went through WWC Phase I reviews failed to

6
meet the WWC evidence screens because of this confounding problem. In general, ―N=1‖
studies may fall under three scenarios.7 We discuss each in turn in the following paragraphs.
Scenario (1): RCTs with one teacher or school randomly assigned to each condition and students
not randomly assigned, and analogous QEDs
In this scenario, two intact clusters (e.g., two classrooms and their teachers or two schools) are
randomly assigned to the intervention and the comparison conditions. Although such a study still
qualifies as an RCT, it suffers a serious internal validity threat because randomization in this case
cannot remove any of the preexisting group differences at either the teacher level or the student
level. Such differences may confound the intervention’s effects because outcome differences
between the study groups may reflect a mix of the intervention’s effects and preexisting
differences in both teacher and student characteristics between the groups.
In addition to the internal validity problem, designs with one intact cluster per condition also
have an estimation problem, because a correct statistical analysis that properly takes into account
the clustering of students within classes or schools (i.e., a multilevel analysis) cannot be done
with only two clusters and, hence, zero degree of freedom. Although a few options are available
for analyzing such data, they are all imperfect and rely on strong and untestable assumptions
(Varnell, Murray, & Baker, 2001). It is for these reasons that RCTs with one cluster randomly
assigned to each condition generally did not meet WWC evidence screens.
During the WWC Phase I reviews, we found that Scenario (1) was relatively rare for RCTs, but
much more common for QEDs. Of the approximately 1,400 QEDs that were rated as ―Does Not
Meet Evidence Screens‖ during the WWC Phase I reviews, 118 failed to meet the evidence
screens because there was only one teacher or school assigned in a nonrandom way to each study
condition and there was no evidence that the teacher or school effects were negligible (see
Exhibit 1 for an illustrative example).
Exhibit 1. A QED With One School per Condition
Summary of Study Design The purpose of the study is to assess the effects of a whole-school reform on the reading achievement of students with limited English proficiency. The study sample consisted of one elementary school that had already started the reform prior to the beginning of the study and a comparison school selected from the same district. The two schools were similar in overall achievement levels, but differed substantially in school size and demographic composition. The researchers assessed the reform’s impact by comparing the reforming school and the comparison school in student performance on a series of reading tests using multivariate analysis of variance, followed by univariate analyses of variance, at the student level.
Design Flaw The main problem with this study is that with only one school per condition, the reform’s effects were totally confounded with school effects. In other words, it is impossible to know whether any of the observed differences in student outcomes between the two schools were caused by the reform or simply reflective of the preexisting differences between the two schools in school size, demographic composition, and possible differences in other unmeasured school characteristics (e.g., school climate, teacher quality, school resources, or school policy).
7 The WWC technical guidance on Teacher-Intervention Confound provides a detailed discussion about this issue,
which can be found at WWC’s Web site: http://ies.ed.gov/ncee/wwc/pdf/teacher_confound.pdf.

7
Scenario (2): RCTs with one teacher or school per condition and students randomly assigned to
conditions8
While random assignment is carried out at the cluster level in Scenario (1), it is carried out at the
individual level in Scenario (2). In some studies, one teacher may teach the intervention
condition and a different teacher may teach the comparison condition. Students are then
randomly assigned to the two teachers/conditions. This design is seriously flawed because the
intervention’s effects are completely confounded with teacher effects and the impact estimates
represent a mix of these two types of effects. If, for example, the more experienced teacher
delivers the intervention, then it would not be appropriate to attribute the differences in student
outcomes between the two conditions exclusively to the intervention, as such differences may be
due to the intervention, due to the difference in teacher experience, or most likely due to both.
In certain circumstances, it is possible that teacher effects are negligible. For instance, a
computer instruction program may be relatively freestanding and require little teacher
engagement in the actual programmatic instruction and measurement of outcomes. In a
comparison of two such computer programs, teachers might have little effect on either condition
and the potential bias due to teacher-intervention confound may be considered negligible or
limited. If this is the case, then the study would not have been downgraded during the WWC
Phase I reviews for the ―N=1‖ problem, if it did have other design or implementation problems.
This, however, is not the case in the example shown in Exhibit 2.
Exhibit 2. An RCT With Teacher-Intervention Confound
Summary of Study Design This RCT was designed to test the effect of a math curriculum software program on high school students’ math achievement. It took place in one high school, where all ninth-grade students enrolled in Algebra I in the study year were randomly assigned to either intervention classes or traditional classes. The intervention classes were taught by a teacher trained in the use of the curriculum software program and the traditional classes were taught by a regular classroom teacher using a traditional textbook. At the end of the semester, all students took the state-mandated, end-of-course test. The researcher then compared the percentage of students passing the test in the two study groups using a chi-square test.
Design Flaw This study design is flawed because it does not allow the researcher to separate out intervention effects from teacher effects, which were unlikely to be negligible because the teachers were deeply involved in both conditions. The difference in students’ passing rate on the state test might well be explained by the differences between the two teachers rather than the differences between the curricula in the two study conditions. Therefore, the internal validity of this study is highly questionable even though the study did employ random assignment.
8 Analogous QEDs are not discussed under this scenario because they are the same type of QEDs discussed under
Scenario (1) (i.e., QEDs with one cluster per condition and nonrandom assignment of clusters and students).

8
Scenario (3): RCTs with one teacher teaching both conditions and students randomly assigned to
conditions, and analogous QEDs
In some RCTs, one teacher may teach both the intervention and the comparison conditions, and
students are randomly assigned to the two conditions. Such a study is a fair test of the
intervention if it is reasonable to assume that (a) the teacher’s ability and motivation to teach
students in the intervention condition is the same as his or her ability and motivation to teach
students in the comparison condition, or (b) teacher effects are negligible because the
intervention requires very little input on the part of the teacher. The study is not a fair test of the
intervention if neither assumption is tenable and should be downgraded according to WWC
standards, because the teacher-intervention confound would pose a serious threat to the internal
validity of the study (see Exhibit 3 for an example).
Exhibit 3. An RCT With One Teacher Teaching Both Conditions
Summary of Study Design The purpose of this study was to test the effectiveness of a particular math instructional approach in improving the math achievement of middle school students. Participants in the study were sixth graders from one middle school who were randomly assigned to two classes. One class was randomly assigned to be the experimental class and the other the control class. The researcher taught both classes. He taught the experimental class using the experimental instructional approach and taught the control class using the traditional instructional approach. The relative effects of the two instructional approaches on students’ math achievement were assessed using independent-samples t-tests and ANOVA.
Design Flaws As the researcher himself noted in the study report, researcher bias for or against the experimental instructional approach because of his previous knowledge of the intervention could have affected the outcome of the study. Indeed, the teacher-intervention confound posed a potential threat to the internal validity of the study, as the differences in student outcomes between the two conditions could not be attributed conclusively to the differences in instructional approach. The impact estimates from this study may well depend on the capability of the teacher to deliver the instruction as intended in the two different study conditions.
The potential problem with one teacher teaching both conditions also applies to QEDs. Unless
there was strong evidence that teacher effects were negligible, QEDs in which one teacher taught
both conditions would generally be downgraded to ―Does Not Meet Evidence Screens‖ based on
the WWC standards.
Sample Allocation for QEDs
Although random assignment of cases to conditions is ideal for causal inference, it is not always
feasible for practical or ethical reasons. Very often, the evaluation of an intervention’s impact
employs a quasi-experimental design (QED), a design for impact studies in which units are not
randomly assigned to conditions. Lacking random assignment, QEDs are vulnerable to internal
validity threats because systematic differences—which can be observed or unobserved—may
exist between the nonrandomly formed study groups, and such differences (i.e., selection bias)
may confound the intervention’s effects. Researchers can, however, reduce selection bias and
enhance the internal validity of QEDs through thoughtful choices of design features, particularly
design features that improve group equivalence or comparability. Two of the most commonly

9
used and potentially effective design features for improving group equivalence are matching at
the sampling stage and statistical adjustment at the data analysis stage.
Equating Groups Through Matching
Matching refers to a collection of methods for creating a comparison group that is as similar as
possible to the intervention group on covariates that are likely correlated with the outcome. If a
QED relies on matching as the primary strategy for reducing selection bias, then at a minimum
matching should be done on a pre-intervention measure (pretest) of the outcome or a close proxy
measure for the pretest. In addition to pretest, it is advisable that matching also be done on other
preexisting variables that are strongly related with the outcome (e.g., student age, ethnicity, and
socioeconomic status, or school demographic composition). The appropriate matching variables
are likely to vary depending on the nature of the intervention (e.g., a beginning reading
curriculum or an early childhood education program), the outcomes of interest (e.g., reading
achievement or school readiness), and the units of matching (e.g., student-level matching or
school-level matching).
An important task for the design of a QED is thus to identify—based on substantive knowledge
of the field and existing empirical evidence—a set of key covariates that are most likely to
introduce selection bias and make sure that the study groups are equivalent on these potential
confounders through either matching or statistical adjustment. The review protocol for each
WWC topic area, for instance, specified a set of sample characteristics that should be equated for
QEDs.9 While all topic areas require that participants in different study groups of a QED must be
equated on a pretest, a good proxy of pretest, or prior achievement, some of the additional
required equating variables are topic-specific. The review protocol for the topic area of English
language learners, for example, requires that study groups in QEDs must be equated not only on
pretest or a proxy of pretest, but also on level of English language skills and grade level. For the
early childhood education topic area, although QEDs are required to demonstrate group
equivalence only in pretest or a proxy of pretest, the review team will also consider whether
study groups are equivalent along the dimensions of age and prevalence of developmental delays
and disabilities, among others.
Matching can be done at different levels (e.g., school level or student level). There has been
evidence that matching of intact groups (e.g., whole schools) instead of, or prior to, matching of
individuals is particularly effective in reducing selection bias in QEDs (Cook et al., 2008).
Moreover, where appropriate, the comparison units should be selected from the same geographic
area as the intervention units to which they are matched so as to maximize the comparability of
the intervention and the comparison groups (e.g., match reforming schools and comparison
schools within the same district).10
9 The WWC topic areas include beginning reading, elementary school math, middle school math, English language
learners, early childhood education, character education, and dropout prevention. The review protocol that guides
the WWC review in each topic area can be found at the WWC’s Web site: http://ies.ed.gov/ncee/wwc/. 10
It may not be advisable, however, to match schools within the same district if the reforming schools are a highly
select group of schools that are clearly different from the other schools in the district.

10
A simple way to implement matching is through blocking or stratification, where units with
similar values on a matching variable are first grouped into blocks or strata and then assigned to
different study conditions within blocks or strata. This strategy can effectively equate groups on
a single matching variable, but quickly becomes impractical as the number of variables to be
matched increases. For matching on multiple variables simultaneously (i.e., multivariate
matching), two common approaches are propensity score matching (Rosenbaum & Rubin, 1983;
Rubin & Thomas, 2000) and matching based on Mahalanobis distance (Cochran & Rubin, 1973;
Rosenbaum & Rubin, 1985; Rubin, 1979, 1980). Both approaches identify matched units based
on a multivariate measure of similarity (or ―distance‖) in terms of covariate values so that the
matched groups have balanced covariate distributions.
In propensity score matching, the balanced distributions of multiple covariates are achieved
through matching on a single summary index—the propensity score, which, in Rosenbaum and
Rubin’s (1983) seminal work, is defined as ―the conditional probability of assignment to a
particular treatment given a vector of observed covariates‖ (p. 41). 11
Clearly, the ability to
balance a large number of covariates simultaneously is a major strength of propensity score
matching. Matching methods based on propensity scores, however, are not without limitations.
The effectiveness of propensity score matching depends critically on the quality of the data
available. Unlike randomization, propensity score matching can only reduce bias due to observed
covariates, but cannot remove bias due to unobserved covariates, except to the extent that the
unobservables are correlated with the observables. Thus, where causality is concerned,
propensity score matching can only approximate, but not substitute for, randomization.
Another limitation of propensity score matching is that its effectiveness depends on sample size.
If only a small pool of potential comparison units is available, then it may be difficult to find a
good match for every intervention unit. Propensity score matching does not work well either for
studies with a limited number of intervention units. This is because the estimation of propensity
scores is based on a logit or probit model and is highly unreliable if the number of intervention
units is too small relative to the number of covariates used to predict the propensity scores. As a
rule of thumb, the number of parameters in a logistical regression model should not exceed m/10,
where m is the number of cases with a value of the dichotomous outcome that is less likely to be
observed (Peduzzi, Concato, Kemper, Holford & Feinstein, 1996). It implies that there should be
at least 10 intervention units for each covariate included in a propensity score model. This
requirement sometimes renders propensity score matching inappropriate for interventions
implemented on a limited scale.
For studies with a limited sample size, Mahalanobis metric matching may provide a more viable
alternative (Cochran & Rubin, 1973; Rosenbaum & Rubin, 1985; Rubin, 1980). Instead of
matching on propensity scores, Mahalanobis metric matching matches on Mahalanobis distance,
which is a measure of overall similarity between two units with respect to a set of covariates and
is calculated based on the covariate differences between the units and the sample
variance-covariance matrix. Since it does not involve statistical modeling, Mahalanobis metric
matching requires few assumptions and is very flexible, particularly in situations where matching
11
Other than matching, propensity scores can also be used to reduce selection bias through subclassification,
reweighting samples, or regression adjustment (D’Agostino, 1998; Rosenbaum & Rubin, 1983).

11
is to be done on a relatively small set of key covariates.12
It can be used alone or in combination
with propensity score matching where appropriate. A number of empirical studies have found,
for instance, that Mahalanobis metric matching within boundaries (―calipers,‖ in technical terms)
defined by the propensity score to be superior to either method used alone (Gu & Rosenbaum,
1993; Rosenbaum & Rubin, 1985; Rubin & Thomas, 2000).
Equating Groups Through Statistical Adjustment
While matching is often used to create a comparison group that is similar to the intervention
group on preexisting characteristics at the sampling stage, statistical adjustment (e.g., covariate
adjustment through regression-based models, such as analysis of covariance) attempts to equate
existing non-equivalent groups statistically at the data analysis stage. Like matching variables,
the appropriate covariates for statistical adjustment are potential confounders, i.e., variables that
might be responsible for the observed outcome differences between study groups. They may
include a pretest measure or a close proxy for the pretest and other covariates such as student or
school demographic variables. Statistical adjustment may not only help reduce selection bias due
to preexisting group differences, but also improve the statistical power of the impact analysis, as
will be explained in the section to follow.
Statistical adjustment as a strategy for reducing selection bias, however, has limitations.
Obviously, it can only adjust for observed covariates but not unobserved covariates. QEDs that
rely solely on covariate adjustment for equating groups therefore cannot rule out alternative
explanations for the observed effects due to unobserved covariates.
Further, it has been well recognized in the statistical literature that regression-based covariate
adjustment is not always trustworthy. When substantial differences in covariate distributions
exist between the study groups, covariate adjustment may overcorrect or undercorrect for the
initial bias, because it relies heavily on extrapolation and strong model assumptions (Cochran &
Rubin, 1973; Rubin, 2001).13
Serious lack of overlap between treatment and control conditions in
the covariate distribution often goes unnoticed in regression analysis with covariate adjustment;
however, it can be easily detected in propensity score matching. As a single summary index of an
entire collection of covariates, propensity scores allow a straightforward assessment of the
degree of overlap in covariate distributions between the intervention and comparison groups
(Rubin, 1997). Insufficient overlap in covariate distributions indicates that the two study groups
are too different to warrant a valid estimation of the intervention’s effects. Propensity scores thus
provide an important diagnostic tool for assessing the quality of the comparison group and the
validity of the intervention effect estimates.
12
Mahalanobis metric matching becomes less effective as the number of covariates increases, as it is attempting to
obtain balance on all possible interactions of the covariates, which is very difficult in a multivariate space. See
Stuart and Rubin (2008) for an excellent review on various matching methods for causal inference, and Rubin
(2006) for a comprehensive collection of publications authored by Rubin and his colleagues on matched sampling. 13
See Rubin (2001, p. 174) for a discussion of the basic distributional conditions that must be met for regression-
based adjustment to be trustworthy. Based on Ho, Imai, King, and Stuart (2007), the recently released Version 2
WWC standards require that for both RCTs with severe attrition and QEDs, baseline differences on each important
covariate must be less than 0.25 of a standard deviation based on pooled sample. Otherwise, they Do Not Meet
Evidence Standards even with statistical adjustment (WWC, 2008).

12
Even if sufficient overlap in covariate distributions exists, propensity score matching methods
may still be superior to regression-based adjustment, which requires assumptions about the
functional form of the relationships between covariates and outcomes that may be difficult to test
(Morgan, 2001). Propensity score methods, on the other hand, rely on weaker and often more
plausible assumptions and are more robust to misspecification than regression-based models
(Drake, 1993). It thus comes as no surprise that propensity score methods have been gaining
popularity as a strategy for reducing selection bias and improving the validity of causal inference
in nonexperimental studies across disciplines (e.g., Foster, 2003; Heckman, Ichimura, & Todd,
1997; Hill, Waldfogel, Brooks-Gunn, & Han, 2005; Hong & Raudenbush, 2006; Imbens, Rubin,
& Sacerdote, 2001; Rosenbaum, 1986).
As a matter of fact, one does not have to choose between matching and statistical adjustment,
which are best viewed as complementary rather than competing strategies. Research has shown
that matching combined with covariate adjustment is more effective in removing selection bias
than either method used alone (Rubin, 1973, 1979; Rubin & Thomas, 2000). Matched sampling
ensures that the study groups are at least roughly comparable on the observed covariates, and
covariate adjustment may be able to reduce the remaining differences on the observed covariates
between the matched groups and improve the precision of the impact estimates.
For QEDs reviewed during the first phase of the WWC, both matching and statistical adjustment,
either used alone or in combination, were acceptable methods for demonstrating baseline
equivalence. QEDs that did not use any equating method to demonstrate baseline equivalence
would be rated as Does Not Meet Evidence Screens according to the WWC Evidence Standards.
Out of the 1,573 studies reviewed during the first phase of the WWC, 290 QEDs failed to meet
the WWC Evidence Screens because of lack of baseline equivalence. Exhibit 4 provides one
example.
Exhibit 4. A QED Lacking Baseline Equivalence
Summary of Study Design This study assessed the impact of a federally funded program designed to promote high school graduation and college enrollment among low-income students. The intervention group consisted of a sample of students who participated in the program during a 10-year period. The comparison group consisted of a sample of students who were eligible for the program but chose not to participate. The two groups differed significantly in certain background characteristics. The percentage of students whose mothers had at least some college education, for example, was more than twice as high in the intervention group as in the comparison group. The study authors assessed the program’s impact by comparing the postsecondary enrollment rate of the program participants and the rate for the comparison students with a chi-square test.
Design Flaw This study provides a typical example of selection bias—students in the intervention group chose to participate in the program and students in the comparison group chose not to. The sample characteristics confirm the lack of baseline equivalence of the study groups, which, however, was left unaddressed in the impact analysis. Therefore, the internal validity of the study was in jeopardy, as one cannot be sure that the different postsecondary enrollment rates of the two groups were caused entirely by program participation. The different background characteristics of the study groups may well constitute a reasonable alternative explanation.

13
Statistical Power and Sample Size
In addition to sample allocation methods, another key decision regarding the sampling design of
a study is the sample size needed to achieve adequate statistical power. Put simply, statistical
power is the probability that a statistical test will yield a statistically significant result, given a
true effect of a specified magnitude (Cohen, 1988). For impact studies, power can be defined as
the probability of detecting an intervention’s impact of a given magnitude at a pre-specified
significance level (i.e., alpha, or the Type I error rate) under a given study design. Adequate
power is essential for statistical conclusion validity because insufficient power may lead a
researcher to incorrectly conclude that the intervention does not have a significant impact when it
actually does. Determining sample size based on a proper power analysis also prevents wasting
resources on collecting and analyzing data from a sample larger than necessary. Therefore, we
feel it is important to include the issue of statistical power in our discussion about sampling
design in primary studies, even though it was not the focus of the WWC Phase I reviews.14
Power analyses are usually conducted to determine the sample size needed for a study to have a
reasonable chance of correctly rejecting a false null hypothesis (i.e., avoid making a Type II
error). Power is affected by more than sample size; rather, it depends on a set of interrelated
parameters or design elements related to the study. As shown by the ―power scheme‖ depicted in
Exhibit 5, power is determined by alpha, study design, and the true effect of the intervention
being tested (effect size). In the remainder of this section, we discuss in detail how power is
related to each of the elements in the power scheme, and suggest strategies for increasing power.
Our discussion focuses on continuous outcomes such as students’ test scores.
Exhibit 5. Essential Elements of the Power Scheme
StatisticalPower
Alpha Study Design
Effect Size
Sample size& allocation
Analysis model
Level
1- or 2-tailed?
14
It is an exception rather than a norm for study authors to report the statistical power of their study, or the methods
and assumptions used in their power analysis. Therefore, the WWC did not systematically assess the adequacy of the
statistical power of individual studies.

14
Power and Study Design
Power and Sampling Plan
Power is affected by study design, which has two dimensions: the sampling plan and the analysis
model. The sampling plan has two further elements: the total sample size and the allocation of
the sample to different study conditions. Power not only depends on sample size, but also on the
methods of sample allocation; in particular, on whether the assignment of units to study
conditions is carried out at the individual level or the cluster level and whether blocking or
stratification is used in the assignment process. If assignment occurs at the cluster level, then the
number of clusters will be a much more important determinant of power than the number of
individuals within clusters, particularly for data exhibiting a nontrivial degree of clustering as
measured by the intra-class correlation (ICC).15
Whether the assignment is random or not,
however, does not directly affect power.
Another sampling design feature that affects power is blocking or stratification used in multisite
studies where the assignment of participants is carried out within blocks or strata that consist of
participants with similar characteristics (e.g., assignment of students within schools). Blocking is
a popular strategy for improving power, because it increases the precision (i.e., reduces the
standard error) of the impact estimate by removing the outcome variance attributable to
differences between blocks.16
It is particularly effective when a large proportion of the outcome
variance exists between blocks as opposed to within blocks. There is a trade-off, however, in that
the gains in precision resulting from blocking may be offset to some extent by the loss of degrees
of freedom due to the incorporation of block effects in the impact analysis, particularly if blocks
are treated as random effects rather than fixed effects (see the following section for further
discussion about this issue).
Power and Analysis Model
Since power is the probability of detecting a statistically significant intervention effect, it is
obviously affected by the statistical model of the impact analysis. In particular, it is affected by
whether covariate adjustment is used and whether blocks or sites in multisite designs are treated
as fixed effects or random effects, assuming that the impact analysis is based on the proper unit
of analysis and properly takes multiple comparisons, if relevant, into account.17
Covariate adjustment has been widely recognized as an effective strategy for increasing power in
impact studies (Bloom, Richburg-Hayes, & Black, 2007; Raudenbush, 1997; Raudenbush,
Martinez, & Spybrook, 2007). Intuitively, covariate adjustment reduces the ―noise‖ in the data
15
ICC is a measure of the correlation or dependence among units within the same clusters. For two-level clustered
data, it is computed as the proportion of the total variance of the outcome that lies between clusters. Power is
negatively related and highly sensitive to the value of ICC, which varies with the type of outcome and the type of
clusters. See Hedges and Hedberg (2007) for a compilation of ICC values for achievement outcomes in designs
involving school-level assignment. 16
Blocking has another benefit—improved face validity, for blocking ensures that the different study groups are
perfectly balanced in all block characteristics. 17
See Critical Issues in Data Analysis section for further discussions about the issues of unit of analysis and multiple
comparisons.

15
caused by the covariates and thus makes it easier to detect the ―signal‖ (i.e., intervention effect).
In technical terms, covariate adjustment increases power by reducing the amount of unexplained
variance of the outcome and hence improving the precision of the impact estimate. As a result, a
smaller sample size is needed to achieve a given level of power. The reduction in sample size can
be substantial if the covariates included in the impact analysis, such as a pretest, are strongly
related to the outcome (Bloom et al., 2007). It is for this reason that covariate adjustment is
recommended not only for QEDs but also for RCTs, even if the study sample is well balanced on
the covariates as a result of random assignment.18
For studies with cluster-level assignment, the covariates adjusted can be at either the individual
or the cluster level. In general, individual-level covariates are preferable because they can reduce
the outcome variance at both the individual and cluster levels, whereas cluster-level covariates
can only reduce the outcome variance at the cluster level.19
Moreover, individual-level covariates
do not affect the degrees of freedom of the impact analysis, whereas each cluster-level covariate
will cost at least one degree of freedom, which may decrease power if the number of clusters is
small. Cluster-level covariates, however, are likely to be more easily available and can
potentially be as effective as individual-level covariates in boosting power (Bloom et al., 2007).
For multisite designs, power is also affected by another analytic decision, i.e., whether sites are
treated as fixed or random effects in the impact analysis. This decision should also be made
based on the nature of the sites and the purpose of the statistical inference. If the study sites are
regarded as unique entities (for example, as in a purposive sample) and the focus of the study is
on the impact just for the sites in the study sample, then it is appropriate to treat sites as fixed
effects. If, however, the researcher views the study sites as a random sample drawn from a larger
population of all possible sites, and wishes to generalize the impact findings from the study sites
to the larger population of sites, then the random-effects model may be more appropriate.20
The distinction between fixed-effects and random-effects models has important power
implications. In fixed-effects models, both the average outcome and the intervention effect are
assumed to be fixed across sites. Between-site variance is assumed to be zero and thus does not
enter the variance calculations for the impact estimates. In random-effects models, however, both
the average outcome and the intervention effect are assumed to vary randomly across sites;
hence, between-site variance can be a major source of variance for the impact estimate. As a
result, impact estimates based on random-effects models tend to be less precise than those based
on fixed-effects models. Moreover, the number of degrees of freedom associated with the
significance test also tends to be smaller in random-effects models than in fixed-effects models,
because degrees of freedom are mainly determined by the number of sites for random-effects
18
If the covariates are not balanced, as in a QED with inadequate matching, the variance of the impact estimate will
be inflated by a factor of 1/(1-R2) due to the correlation (R) between the covariate(s) and the intervention status.
19 Reducing cluster-level variance is much more important for improving power than reducing individual-level
variance, because cluster-level variance is the binding constraint on power in cluster randomized trials. Nevertheless,
the reduction of individual-level variance may also have an appreciable effect on power, particularly in studies with
relatively few individuals per cluster and studies with a low degree of clustering. 20
Schochet (2008a) argues that fixed-effects models are usually more realistic for evaluations of education
interventions, because the sites in most multisite studies are purposively selected and limited in number. Therefore,
it is often not appropriate to assume that the study sites are representative of a larger, well defined population.

16
models and by the total number of clusters (in studies with cluster-level assignment) or the total
number of individuals (in studies with individual-level assignment) for fixed-effects models.
Therefore, a multisite study often needs to recruit a much larger sample to achieve the same level
of power if site effects are to be treated as random rather than fixed.
Power and Alpha
Another key element in the power scheme is the significance level, alpha (or the Type I error
rate), for the statistical test. All else equal, the higher the alpha, the easier it is to achieve
statistical significance, and hence the more powerful the design will be. By convention, alpha is
usually set at .05 in a power analysis based on a two-tailed test, which is more conservative and
less powerful than a one-tailed test.
In some cases, it may be justifiable to use a one-tailed (or directional) statistical test. A one-tailed
test, for example, is often chosen when there are strong a priori reasons to expect an effect in a
certain direction. Alternatively, one may argue that a one-tailed test should be used when a
statistically significant finding in the opposite direction to the one hypothesized would have the
same implications as a null finding (Cohen, 1988). For example, if the purpose of a program
evaluation is to inform decisions about whether to support a particular program or not, a
one-tailed test would be justified—assuming that the program will be supported only if it
produces beneficial effects. If, however, a statistically significant finding in the direction
opposite to the one hypothesized has different implications than a null result, a two-tailed test
should be used for the impact analysis and for power calculations. An example might be a study
that is designed to assess the relative effectiveness of two reading interventions. In this study, a
significant finding in one direction would indicate that one reading intervention was more
effective, and a significant finding in the opposite direction would indicate that the other reading
intervention was more effective. Both types of findings are meaningful and should be
distinguished based on a two-tailed test.
Power and Effect Size
Last, but not least, power depends on an intervention’s effect on the outcome of interest.
Intuitively, other things being equal, the larger the effect of an intervention, the easier it is to
detect it, and the greater the statistical power. In practice, an intervention’s effect is commonly
expressed in a standardized metric—the effect size metric—to adjust for the different and often
arbitrary units of measurement of different outcome measures. For impact studies, the most
commonly used effect size index is standardized mean difference, which is defined as the
difference between the mean outcome of the intervention group and the mean outcome of the
comparison group divided by the pooled within-group standard deviation of the outcome (Lipsey
& Wilson, 2001).21
21
Under certain circumstances (e.g., when the standard deviation of the outcome for the intervention group is
affected by the intervention), it is preferable to use the standard deviation of the comparison group rather than the
pooled standard deviation to compute the effect size, because presumably the standard deviation of the comparison
group is unaffected by the intervention and is therefore a better estimate of the population standard deviation.

17
It is worth noting that effect size in the power scheme is a population parameter, which, like
other population parameters, is usually unknown and difficult to guess. If researchers have a
good idea about the effect size of the intervention to be tested (e.g., based on experience or
evidence from prior research), then they can use this expected effect size as the basis for
estimating the sample size needed to achieve the target level of power at a given level of alpha.
A more common approach to power analysis, however, is to compute the ―minimum detectable
effect size‖ (MDES) based on desired alpha and power level under a given study design, and
adjust the sample size so that the MDES meets a desired target. Very often, the target MDES is
established based on what the researcher believes is the smallest policy-relevant or practically
meaningful effect size that the study should be designed to detect rather than a guess of the true
effect size of the intervention.
Conducting Power Analysis Based on MDES
More formally, MDES represents the smallest intervention effect, expressed in the effect size
metric, that can be detected as being statistically significant at the pre-specified alpha level and
power level for a given study design (Bloom, 1995, 2005). Conventional practice in social
science research sets alpha at .05 for a two-tailed test and target power at 80%, which ensures a
reasonably good chance of detecting a true intervention effect, but is not so high that the sample
size needed would be prohibitively large (Cohen, 1988). With both alpha and power set by
convention, a power analysis typically centers on the relationship between sample size and
MDES. It attempts to answer the question: What is the sample size needed to achieve the target
MDES based on the pre-specified alpha and power level under the given study design? For a
given alpha level and power level, MDES is a function of the standard error of the impact
estimate, which in turn is a function of the sample size and variance components at different
levels of the data.
To acquire the basics for conducting a power analysis, readers are referred to Schochet (2008a),
which provides an excellent primer of power analysis for various types of study designs. The
documentation for Optimal Design, a freely available power analysis software program, provides
a more extensive explication of both conceptual and technical backgrounds of power analysis, as
well as easy-to-follow tutorials for conducting power analysis under different scenarios using the
Optimal Design program (Spybrook, Raudenbush, Congdon, & Martinez, 2009). For simpler
designs (i.e., those that do not involve a multilevel design), Web-based power calculators are
also available (e.g., Lenth, 2006-9).
Study Implementation
Having discussed the key elements in the sampling design of an impact study, we now move on
to study implementation. We will examine a number of important issues that one needs to
consider when carrying out an impact study: measurement of outcomes, implementation fidelity,
and attrition.
Measurement of Outcomes
The outcome measures in an impact study are useful only if they have adequate construct
validity; that is, if they capture well the relevant underlying constructs that they are intended to

18
measure.22
The construct validity of outcome measures matters because measures with weak
construct validity (e.g., a poorly designed reading test) may provide very little useful, and even
misleading, information about the underlying construct that they are intended to measure
(i.e., student reading achievement). As a result, incorrect conclusions may be drawn about the
impact of the intervention under study, even if the study employs a design with strong internal
validity. The WWC considered several issues related to the construct validity of outcome
measures:
Explication of constructs23
o ―Grain size‖: Is the construct identified at too specific a level? Is the ―grain size‖ of
the measure appropriate? Does the measure purport to measure a broad construct, but
in fact measure a narrower construct (i.e., construct underrepresentation)?
o Face validity and reliability of outcome measures: Does the outcome measure
demonstrate face validity and adequate reliability?
Construct confounding
o Overalignment: Does the study confound exposure to the measure with improvement
of the construct? In more specific terms, is the measure overaligned with the
intervention?
Explication of Constructs: Grain Size
Researchers sometimes analyze very narrowly defined constructs. For example, a researcher
might only measure students’ improvement in a very specific skill, phonemic awareness, in a
study of a reading intervention. This is appropriate if the intervention is specifically designed to
improve students’ phonemic awareness and if the goal of the study is to provide evidence on the
effect of the intervention on this narrow outcome. However, practitioners are often more
interested in whether an intervention has an impact on broader constructs, such as general
reading achievement. Therefore, a study that focuses only on a very narrow construct is likely to
have limited practical applicability.
Alternatively, researchers may be concerned about broad constructs, but use narrow measures
that only relate to some aspects of the broad constructs. This is known as construct
underrepresentation. For example, a researcher may measure students’ improvement in phonemic
awareness with the intent of demonstrating that the intervention improves overall reading
achievement. This is problematic because reading is composed of many subskills, and
improvement in only one of those subskills—phonemic awareness—does not necessarily mean
improvement in reading more generally. Drawing conclusions about an intervention’s impact on
a broader construct (e.g., reading achievement) based on very narrow outcome measures is
unwarranted at best and misleading at worst.
22
The notion of construct validity refers to the validity of making inferences from the sampling particulars of a
study—persons, settings, treatments, and measures—to the higher-order constructs that they represent (Shadish et al.,
2002). In the WWC, and in this paper, we focus on the construct validity of outcome measures. 23
See Shadish et al. (2002, p. 73–81) for a more extensive discussion of threats to construct validity. The WWC
focused on several of these threats, especially inadequate explication of constructs and construct confounding.

19
In a third common scenario, researchers may analyze a large number of micro-level outcomes
which, together, comprise a larger construct, but report the individual findings separately rather
than as a factor representing the larger construct. As an extreme example, one study reviewed by
the WWC reported as many as 77 item-level findings in a single study report. Studies that report
many micro-level findings, rather than findings at the construct level, are problematic for the
following reasons:
1. It is hard to interpret large numbers of findings. If, for example, a study reports an
intervention’s effects on 30 items from a survey, some positive and some negative, some
statistically significant and some not, it is difficult for the reader to understand in any
global sense the effectiveness of the intervention.
2. It is easy for a reader to focus on the statistically significant positive findings as
indicators of positive effects when, in fact, they may be only important at a micro level.
For example, a study of a reading intervention might analyze 20 items related to reading
comprehension and find that the intervention has a statistically significant positive effect
on one of those items, but no effect on the remaining 19 items or on the scale composed
of the 20 items. If the study author reports only the item-level findings (or, as is
sometimes done in data mining, only the statistically significant findings), it is tempting
for readers to incorrectly conclude that the intervention improves reading
comprehension overall.
3. When a large number of analyses are conducted, there is an increased chance that some
findings will turn out to be statistically significant when, in fact, there is no true effect
(i.e., inflated Type I error rate), unless some correction is made (see Critical Issues in
Data Analysis section for further discussion about the multiplicity problem).
Ideally, a well designed study specifies beforehand the outcome constructs that it intends to
measure and the specific measures that it will use to measure those constructs, using multiple
measures to fully capture each construct.24 It is also advisable that multiple measures of the
same construct be combined through, for example, a factor analysis, into a composite scale and
study findings be reported at the scale level. In general, a composite scale created with multiple
items is likely to have better psychometric properties (higher reliability in particular) and provide
a better representation of the often multi-faceted outcome construct than individual items
(Cortina, 1993; Shadish et al., 2002). If the researcher decides to analyze large numbers of
micro-level findings individually, he or she should correct for multiple hypothesis testing as
appropriate and should indicate, a priori, which items are of central importance and which are
more peripheral to aid in interpretation.
Explication of Constructs: Face Validity and Reliability of Outcome Measures
Valid and reliable outcome measures are a prerequisite to valid conclusions about the effects of
an intervention on the constructs that the intervention is intended to affect. At a minimum, an
outcome measure should demonstrate face validity; that is, ―on its face‖ the measure should
24
See, for example, the discussion of mono-operational bias and mono-method bias in Shadish et al. (2002),
p. 75–76. The WWC reported on whether the study looked at a variety of types of outcome measures, but this
information did not factor into the evidence rating.

20
appear to be a good representation of the construct that it is intended to measure. An outcome
measure should also demonstrate adequate reliability or consistency. A measure is considered
reliable if it would produce the same result over and over again, assuming what is measured is
not changing.
Although most researchers agree that validity and reliability are important properties of outcome
measures, there is a lack of clear and consistent guidelines on how to quantify validity and on
what constitutes acceptable levels of validity and reliability. Therefore, the WWC, in its first
phase, set a low bar for the validity and reliability of outcome measures for pragmatic reasons
(most importantly, few studies reported validity information for their outcome measures). It only
required that, to be eligible for WWC reviews, a study should have at least one relevant outcome
measure with face validity or adequate reliability. The default reliability requirement was that an
outcome measure was considered reliable if it met at least one of the following thresholds:
(1) internal consistency of .60, (2) temporal stability/test-retest reliability of .40, or (3) inter-rater
reliability of .50. Each WWC review team, however, could adjust these default values as
appropriate for the specific topic area.
The WWC assumed that outcome measures based on standardized tests had adequate validity
and reliability as a result of the standardization process. Studies that measured outcomes using
nonstandardized tests, however, had the burden of proof and were required to provide
information about the validity or reliability of the outcome measures. Essentially, most outcome
measures met WWC standards, with the rare exception of nonstandardized measures that were
clearly not relevant or did not provide enough information to judge face validity or reliability as
in the study illustrated below.
Exhibit 6. A QED With No Valid, Reliable Outcomes
Summary of Study Design This study assessed the effects of a character education intervention on students’ reasoning about human relationships and implications of individuals’ actions. The study sample included students from one intervention class and students from a matched comparison class from the same urban middle school.
Design Flaw In this study, outcomes were assessed with a short test adapted specifically for the study. The primary outcomes, reasoning about human relationships and implications of an individual's actions, were assessed through seven short answer items administered at both pretest and posttest. The researcher indicated that students’ reading ability may have limited the validity of the test. However, the researcher did not provide any other information about the validity or reliability of the test. Given the lack of evidence for demonstrating that the test provided reliable or valid measures for the outcome constructs, the study was excluded from the WWC review.
25
Construct Confounding: Overalignment of Outcome Measures
When a study focuses on micro-level outcomes that were specifically chosen because they reflect
the focus of the intervention, there is a risk of overalignment. Overalignment between the
25
This study also has the ―N=1‖ problem, as the intervention’s effect was completely confounded with the
differences between the two classes.

21
intervention and the outcome measure occurs when ―the outcome measures assess skills taught in
the experimental group but not the control group‖ (Slavin, 2008, p. 11). The most serious type of
overalignment occurs when the intervention group is exposed to the outcome measure during the
intervention, but the comparison group is not. For example, students in the intervention group
completed a vocabulary worksheet during class, but the comparison students did not. Both
groups were then tested using that vocabulary worksheet and their scores were compared. The
problem with this study is that it is not possible to separate the effect of exposure to the outcome
measure from the effect of the intervention itself, and it is very likely that the estimate of the
intervention’s effect would be biased toward the intervention group.
A second type of overalignment occurs when the outcome measure evaluates a skill that was
taught to the intervention group but not the comparison group. For example, in one study
reviewed by the WWC, students in the intervention group were taught phonemic awareness, and
students in the comparison group were not. The study found that students in the intervention
group outperformed students in the comparison group on a phonemic awareness test. This study
demonstrates the effect of exposure to phonemic awareness through this intervention, rather than
the effect of the intervention per se, on students’ phonemic awareness skills. It is not appropriate
to conclude that the intervention is more effective than other phonemic awareness interventions
or business as usual (Crawford & Snider, 2000; Slavin, 2008; Van Dusen & Worthen, 1994;
Ysseldyke, Spicuzza, Kosciolek, Teelucksingh, Boys, & Lemkuil, 2003).
In general, if a study is designed to test the effect of an intervention on a particular skill, both the
intervention and the comparison groups should be exposed to the skill and the difference
between the two groups should be limited to the intervention’s approach to teaching that skill.
Another way of thinking about this is that the outcome measure should not be overaligned with
the intervention—it should focus on skills taught in both the intervention and the comparison
groups.
Implementation Fidelity
Impact studies vary, sometimes by design, in the degree to which the intervention is fully
implemented under well controlled conditions. Some impact studies are designed to test the
effects of an intervention in optimal conditions, to determine whether the intervention can have
an impact under ideal circumstances (i.e., efficacy studies). Other impact studies are designed to
test the effects of an intervention under typical conditions, to determine whether the intervention
is likely to have an impact when implemented as it would be if delivered at scale (i.e.,
effectiveness studies). Although these two types of studies may differ in terms of implementation
fidelity—how closely the intervention-as-implemented resembles the intervention-as-designed—
both address valid questions.26
IES recommends a hierarchy of impact research in which an intervention is first tested for
efficacy (can it work?) and then, if it seems to work under ideal circumstances, tested for
26
The WWC was concerned with the impact of interventions implemented under varied conditions and therefore
included both efficacy studies and effectiveness studies in its review.

22
effectiveness (does it generally work?).27
If an intervention has been found effective under ideal
conditions, and the intervention itself has not changed substantially from what was tested in
efficacy trials, the next logical step is to assess its impact under typical implementation
conditions. Therefore, a researcher should review existing impact research on an intervention
before deciding whether to conduct an efficacy or effectiveness study.
Regardless of whether a study is designed to test the impact of an intervention under optimal
conditions or in real-world applications, it is advisable to collect data on implementation. Such
data are valuable to (1) explore the mechanisms through which the intervention achieved its
impact or the lack thereof; (2) support claims of causality (if the intervention was implemented
with high fidelity and the intervention and control conditions differed); (3) challenge claims of
causality (if the intervention was implemented with low fidelity or the intervention and control
conditions were very similar); (4) identify challenges to future implementation and scale-up; and
(5) examine the relationship between implementation and intervention effects.
Implementation data are particularly important for understanding what actually occurred in both
the intervention and the comparison conditions, which can help researchers accurately describe
the nature of the comparison and explore how the intervention caused the outcomes. For
example, in many studies of comprehensive school reform, comparison schools implemented
reforms that were similar to the intervention being tested. In those cases, ―business as usual‖ was
an alternative intervention rather than ―no intervention.‖ It is essential for the researchers to
make it clear that the reported impact estimates represent the impact of the reform being tested
relative to the reform being implemented in the comparison schools.
Data on implementation may also shed light on what may actually account for the observed
impact or the lack of impact. If, for instance, an impact study found that a particular reform
program had an impact relative to the comparison condition, and the data on implementation
reveal that schools in both conditions used the same curriculum, one would hypothesize that
some element of the intervention other than curriculum was responsible for the observed impact.
Attrition
Attrition refers to ―any loss of response from participants‖ (Shadish et al., 2002, p. 323).
Sometimes attrition is due to participants being unable or unwilling to continue participation and
sometimes is due to decisions by the researcher to exclude participants. In either case, attrition
can pose a threat to internal validity because attrition rarely occurs at random and the cause of
the attrition may be correlated in some unknown way with the intervention. Consider, for
example, an evaluation of a tutoring program which included initially low- and initially high-
achieving students in the sample. Suppose low-achieving students assigned to the program failed
to improve, became discouraged, and dropped out of the program and study. Analysis based only
on the high-achieving students who remained in the program and the mix of students in the
control group might incorrectly indicate that the program worked for all students, including
27
This framework was originally developed in health-care research and subsequently adopted by IES (Flay, 1988;
Starfield, 1977). See a description of research goals for IES-supported research programs at
http://ies.ed.gov/funding/pdf/2009_84305A.pdf, p. 9.

23
initially low-achieving students. Research suggests that attrition is often systematic rather than
random, and can lead to biased impact estimates because it introduces the possibility that the
intervention and control groups differ on some important characteristics other than exposure to
the intervention (Shadish et al., 2002).
Attrition may also be a threat to external validity. If the subjects who leave the study differ
systematically from those who stay (e.g., leavers are mostly highly mobile students with lower
socioeconomic status than stayers), it is not longer appropriate to generalize the findings to
people similar to those leavers. Consequently, the findings may apply only to a narrower
population than originally intended.
Differential Versus Overall Attrition
Differential attrition occurs when one study group has a higher attrition rate than the other
group.28
Differential attrition is a serious problem because it suggests that some factor—other
than the intervention itself—is influencing the intervention group and the comparison group in
different ways. That factor provides a competing explanation for differences in outcomes
between the groups; thus it is no longer safe to assume that the intervention alone is responsible
for those differences.
For WWC Phase I reviews, severe differential attrition was defined as a difference in attrition
rates between the intervention and comparison groups greater than 7%. The WWC Phase I
Technical Advisory Group concluded that there was no empirical basis for a clear cut point (see
Valentine, 2009), but general agreement among researchers was that differential attrition rates
between 5 and 10% would be problematic. Therefore, the WWC adopted a value in that range. If
the difference in attrition rates was less than or equal to 7%, the WWC assumed that the bias
associated with it was minimal. If it was greater than 7%, the study had to show that the
differential attrition did not bias the impact estimate through, for instance, demonstrating post-
attrition group equivalence on a pretest; otherwise the study would be downgraded according to
the WWC Evidence Standards29
.
Severe overall attrition occurs when there is a substantial amount of attrition across the overall
study sample. Severe overall attrition is a problem because it may introduce differential
attrition—if a large number of participants leave the study, there may be some underlying,
nontrivial differences between those who leave the intervention group and those who leave the
comparison group. For WWC Phase I reviews, severe overall attrition was generally defined as
greater than 20% sample loss. 30
If the overall attrition rate was less than or equal to 20%, the
WWC assumed that the bias associated with it was minimal. If it was greater than 20%, the study
28
Differential attrition may also occur when participants in the intervention and comparison conditions drop out for
different reasons or if the dropouts in the two conditions have different characteristics that are related to the outcome,
even if the attrition rates in the two conditions are the same. This type of differential attrition was not addressed in
WWC Phase I, because data for assessing such attrition were rarely available from study reports. 29
The Version 2 of the WWC standards judges attribution bias based on a more sophisticated model that takes into
account both differential attrition and overall attrition simultaneously (see WWC, 2008). 30
The WWC recommended default values for acceptable levels of overall and differential attrition. However, the
WWC Principal Investigators in different topic areas could propose alternative values if the nature of the topic might
affect attrition rates in ways that would not jeopardize the validity of the study.
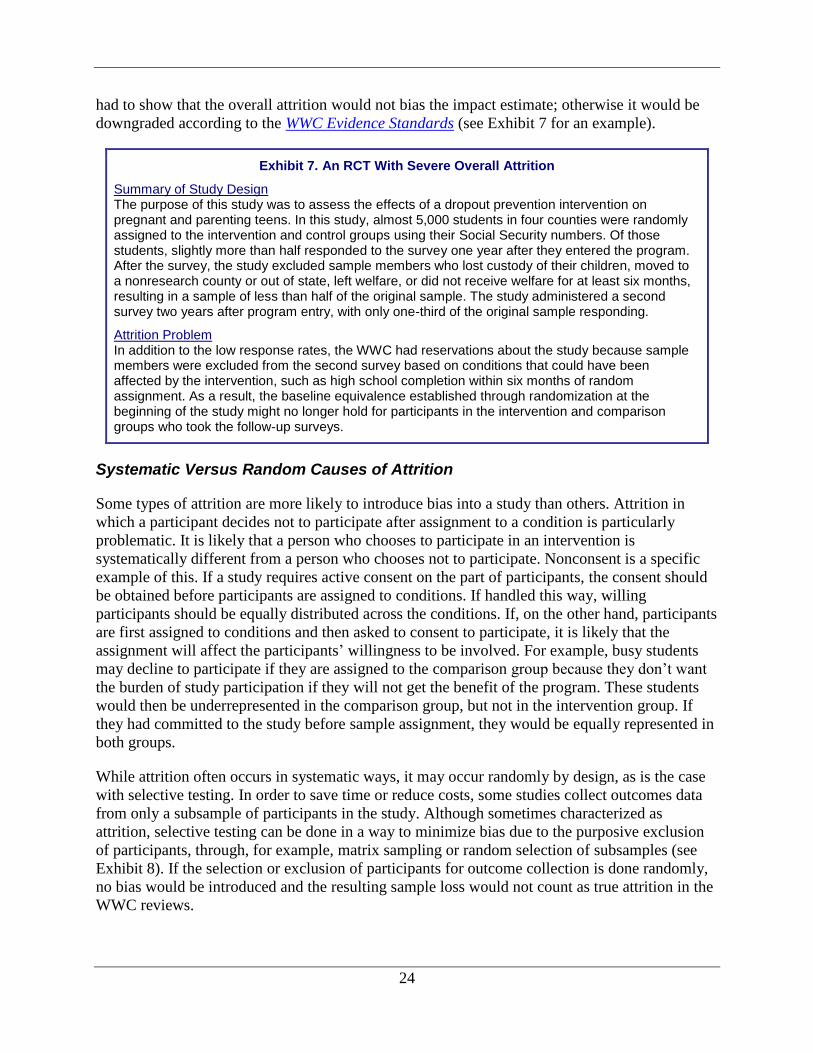
24
had to show that the overall attrition would not bias the impact estimate; otherwise it would be
downgraded according to the WWC Evidence Standards (see Exhibit 7 for an example).
Exhibit 7. An RCT With Severe Overall Attrition
Summary of Study Design The purpose of this study was to assess the effects of a dropout prevention intervention on pregnant and parenting teens. In this study, almost 5,000 students in four counties were randomly assigned to the intervention and control groups using their Social Security numbers. Of those students, slightly more than half responded to the survey one year after they entered the program. After the survey, the study excluded sample members who lost custody of their children, moved to a nonresearch county or out of state, left welfare, or did not receive welfare for at least six months, resulting in a sample of less than half of the original sample. The study administered a second survey two years after program entry, with only one-third of the original sample responding.
Attrition Problem In addition to the low response rates, the WWC had reservations about the study because sample members were excluded from the second survey based on conditions that could have been affected by the intervention, such as high school completion within six months of random assignment. As a result, the baseline equivalence established through randomization at the beginning of the study might no longer hold for participants in the intervention and comparison groups who took the follow-up surveys.
Systematic Versus Random Causes of Attrition
Some types of attrition are more likely to introduce bias into a study than others. Attrition in
which a participant decides not to participate after assignment to a condition is particularly
problematic. It is likely that a person who chooses to participate in an intervention is
systematically different from a person who chooses not to participate. Nonconsent is a specific
example of this. If a study requires active consent on the part of participants, the consent should
be obtained before participants are assigned to conditions. If handled this way, willing
participants should be equally distributed across the conditions. If, on the other hand, participants
are first assigned to conditions and then asked to consent to participate, it is likely that the
assignment will affect the participants’ willingness to be involved. For example, busy students
may decline to participate if they are assigned to the comparison group because they don’t want
the burden of study participation if they will not get the benefit of the program. These students
would then be underrepresented in the comparison group, but not in the intervention group. If
they had committed to the study before sample assignment, they would be equally represented in
both groups.
While attrition often occurs in systematic ways, it may occur randomly by design, as is the case
with selective testing. In order to save time or reduce costs, some studies collect outcomes data
from only a subsample of participants in the study. Although sometimes characterized as
attrition, selective testing can be done in a way to minimize bias due to the purposive exclusion
of participants, through, for example, matrix sampling or random selection of subsamples (see
Exhibit 8). If the selection or exclusion of participants for outcome collection is done randomly,
no bias would be introduced and the resulting sample loss would not count as true attrition in the
WWC reviews.

25
Exhibit 8. A QED With Sample Loss Due to Selective Testing
Summary of Study Design This study assessed the effects of a character education intervention on outcomes such as service learning based on a student survey. The study was carried out in more than 20 schools in several states. To reduce burden on students, students were assigned to complete two of the three outcome measures. The researchers used matrix sampling to ensure that every student was given two outcome measures and that each outcome measure was completed by enough students.
Computation of Attrition Rates In this study, selective testing was done in a way that was unlikely to introduce systematic differences between the analytic samples in the two study conditions. Therefore, although fewer students took each test than participated in the study, the sample loss was not counted as true attrition. Attrition rates for each measure were therefore computed based on the numbers of students intended to complete that measure, rather than the total number of students in the study.
Replacement of Dropouts After Randomization
When faced with attrition after random assignment, some researchers choose to make up for the
sample loss by replacing the dropouts with new participants. While replacement after
randomization may increase the precision of the impact estimate by increasing the sample size, it
cannot eliminate the potential bias introduced by attrition unless the dropouts and their
replacements share the same characteristics—both observed and unobserved—that are related to
the outcomes (Shadish et al., 2002). This condition, however, is unlikely to hold because one can
match replacements with dropouts on observed characteristics, but not on unobserved
characteristics. In fact, even if the replacements are randomly selected from the same pool of
potential participants as those in the original randomized sample and deemed ―similar‖ to the
dropouts, the initial randomization may still be compromised because the dropouts and their
replacements are likely to differ systematically, at least in their willingness to participate in the
condition to which they are assigned. Exhibit 9 provides one such example. If the participants
who opt out are not replaced, this can be considered a straightforward attrition issue.
Exhibit 9. An RCT With Replacement of Dropouts After Randomization
Summary of Study Design The purpose of this RCT was to test the effects of a character education program on student behavior and achievement. The researchers stratified the eligible schools based on demographic variables, randomly selected two schools from each stratum, and randomly assigned the two schools to the intervention and comparison conditions. If a school did not agree to participate in the condition to which it was assigned, it was replaced with another school randomly selected from the remaining schools within the same stratum.
Design Flaw The problem with this design is that the replacement schools differed from the schools being replaced, because the replacement schools were willing to participate in the condition assigned and the schools being replaced were not. Thus, the assignment took into account an important factor other than chance: the schools’ willingness to participate in the conditions they were assigned to (a self-selection issue). Moreover, the refusal of participation was intervention-related, as more schools assigned to the intervention condition than schools assigned to the control condition refused to participate—due to political pressure, according to the authors. This suggests the possibility that the dropouts from the intervention condition differed systematically from those from the comparison condition, which could not be addressed by random selection of replacements.

26
Critical Issues in Data Analysis
A well designed and well implemented impact study will not produce credible evidence without
sound data analysis. We highlight in this section two analytic issues that are particularly
important for the statistical conclusion validity of impact studies and that surfaced in many of the
studies that the WWC reviewed: choice of unit of analysis for clustered data and adjustment for
multiple comparisons.
Proper Unit of Analysis for Clustered Data
The ―unit of analysis‖ problem has been a well-known and once intractable problem to social
science researchers who often work with clustered data. When the data are of a clustered
structure (e.g., students clustered or nested within classes and schools), analysis at either the
individual level or the cluster level is problematic. Individual-level analyses ignore the clustering
of individuals within higher-level units (i.e., the design effect). Students in the same class, for
instance, often share characteristics (e.g., all high-achieving students are in the same class due to
tracking) or experiences (e.g., all students in a class are regular computer users due to their
teacher’s emphasis on computer-assisted learning) that may affect outcomes. This leads to the
violation of the independence of observations assumption underlying traditional hypothesis tests.
Such analyses often yield underestimated standard errors and misleadingly high levels of
statistical significance, with p-values much smaller than they should be.31
In other words, this
may lead to claiming a statistically significant effect when there is none.
Indeed, failure to take into account clustering in impact analysis has been a common problem
encountered by WWC reviewers. To address the problem, Larry Hedges, a member of the WWC
Phase I Technical Advisory Group, developed a method for correcting a significance test that
incorrectly ignored clustering. Based on results from the incorrect test, the method would
generate the p value that would have been obtained had the impact analysis properly taken
clustering into account (see Hedges, 2007, for technical details). The WWC had been routinely
applying the clustering correction method to studies that ignored clustering, and identified many
findings that the authors claimed to be statistically significant but were in fact not significant
once corrected for clustering. An Excel program for implementing Hedges’ clustering correction
method can be found in the Clustering_Correction workbook in the WWC (Phase I)
Computation Tools that accompanies this paper.
Analysis at the cluster level, or aggregated analysis, may also be problematic.32
Aitkin and
Longford (1986) voiced their objection against aggregated analysis most forcefully: relying on
aggregate analysis to analyze clustered data ―is dangerous at best, and disastrous at worst‖
(p.42). Potential problems with aggregated analysis, according to Snijders and Bosker (1999),
include shift of meaning, ecological fallacy (i.e., relationships between aggregated variables
cannot be used to make assertions about the relationships between individual-level variables),
31
Another weakness of individual-level analysis is that it is unable to account for heterogeneity of regression slopes
(e.g., the wider minority gap in achievement in some schools than in others) that is often of particular interest in
educational research, especially research on school effects that have equity implications. 32
An aggregated analysis would be appropriate if there is no within-cluster variation in the outcome (i.e., an ICC of
1), which, however, rarely occurs in the field of education.
27
neglect of the original data structure, and inability to examine potential cross-level interaction
effects. Snider and Bosker strongly recommend that multilevel statistical models be used to
analyze clustered data, and many concur (e.g., Bloom, Bos, & Lee, 1999; Donner & Klar, 2000;
Flay & Collins, 2005; Murray, 1998).33
Recent methodological advances in multilevel modeling have offered not only fresh insights into
the nature of the unit of analysis problem, but also effective analytic tools (e.g., HLM and SAS
Proc Mixed) for conducting multilevel analysis (Raudenbush & Bryk, 2002). Rather than
focusing on one particular data level, multilevel analysis, as its name suggests, analyzes data at
both the individual level and the cluster level simultaneously.34
While single-level analysis
(either individual-level or cluster-level analysis) only recognizes one source of random variation
and totally ignores variation from other sources, multilevel analysis recognizes multiple sources
of variation embedded in the data (both between and within clusters), and explicitly takes into
account the dependence among individuals within the same clusters in analyzing the data. It is
thus able to overcome the problems with single-level analysis, and produce less-biased effect
estimates.
Adjustment for Multiple Comparisons
Another common source of inflated statistical significance is the failure to adjust for multiple
comparisons or multiple hypothesis tests, which may arise when a study tests an intervention’s
effects on multiple outcomes, for multiple subgroups, or across multiple intervention conditions.
As Williams, Johns, and Tukey (1999) observe:
Unless some correction is incorporated, the overall (simultaneous) Type I error rate—the
probability that the decision for any one or more comparison will be in error—will
exceed (often very substantially) the nominal α. … With multiplicity, it is appropriate—
and usually essential—to adjust for the increased probability of simultaneous Types I
error. (p. 43)
Indeed, as the number of comparisons increases, the overall or familywise Type I error rate
increases exponentially, resulting in spurious significant findings.35
If, for a single hypothesis
test, the probability of erroneously rejecting the null hypothesis and claiming a significant effect
is 5% (i.e., the typical level of statistical significance), then the probability of finding at least one
spurious significant effect will be 10% with 2 independent hypothesis tests, 23% with 5 tests,
and 40% with 10 tests, when the intervention actually has no true effects (i.e., all null hypotheses
are true).
The problem of multiple comparisons has long been recognized, and a plethora of adjustment
methods have been proposed (e.g., Bonferroni, 1935; Benjamini & Hochberg, 1995; Dunnett,
1955; Hochberg, 1988; Hochberg & Tamhane, 1987; Scheffe, 1953; Tukey, 1949). No single
33
So does the WWC—see Tutorial on Mismatch Between Unit of Assignment and Unit of Analysis (WWC, 2006b). 34
For simplicity, this discussion is based on a two-level framework (i.e., individuals nested with clusters). The idea
can easily be extended to a three-level model (e.g., students nested with teachers and teachers nested within schools). 35
For g independent hypotheses, each tested at the significance level of α, the overall Type I error rate is [1 – (1– α)g]
when all the null hypotheses are true (Cohen & Cohen, 1983; Bland & Altman, 1995).

28
method, however, is superior to all other methods under all circumstances. Reflecting the general
tension between Type I and Type II errors, multiplicity adjustment methods typically guard
against inflated Type I error rates at the cost of increased Type II error rates and, hence, reduced
statistical power for detecting real intervention effects. Thus, it is not surprising that most studies
of educational interventions reviewed during WWC Phase I ignored the multiple comparisons
problem.
To address the multiple comparisons problem, the WWC reviewers conducted post hoc
corrections of the statistical significance of study findings where necessary and feasible, using
the Benjamini-Hochberg method, which, although not perfect, has been shown to be the
preferred approach to the multiple comparisons problem in many practical situations (Benjamini,
Hochberg, & Kling, 1993, 1997; Curran-Everett, 2000; Keselman, Cribbie, & Holland, 1999;
Williams, Jones, & Tukey, 1999). Most importantly, the Benjamini-Hochberg method tends to
have greater statistical power and is more robust to the number of comparisons involved than
most alternative multiplicity-adjustment methods. A detailed explanation about how the method
was applied to the WWC Phase I reviews can be found in the Technical Details of WWC-
Conducted Computations document. The steps in making the Benjamini-Hochberg corrections
are illustrated in the BH_Correction workbook in the WWC (Phase I) Computation Tools.
In recognition of the prevalence of the multiple comparisons problem in studies of education
interventions that surfaced from the WWC Phase I reviews, the Institute of Education Sciences
(IES) commissioned its Methods Issues Working Group to develop guidelines for addressing the
problem for researchers planning and conducting impact evaluations in education. Released in
May 2008, the guidelines present the following basic principles for multiple testing (Schochet,
2008b, p.3–4):
1. The multiple comparisons problem should not be ignored.
2. Limiting the number of outcomes and subgroups forces a sharp focus and is one of the
best ways to address the multiple comparisons problem.
3. The multiple comparisons problem should be addressed by first structuring the data.
Furthermore, protocols for addressing the multiple comparisons problem should be
made before data analysis is undertaken.
The IES guidelines also provide a set of specific recommendations for developing multiple
testing strategies, including delineating separate outcome domains in the study protocols and
defining confirmatory and exploratory analyses prior to data analysis, among others. In addition,
the document also provides the relevant technical background for the recommended guidelines in
several technical appendices, which discuss in detail the nature of the multiple comparisons
problem, statistical solutions to the problem, and methods for constructing composite outcome
measures that are central to the recommended guidelines. Educational researchers are
encouraged to follow these guidelines, and take multiple comparisons into account in sampling
design, data analysis, and report writing.
Reporting
A study’s value cannot be fully realized without a high-quality study report. As the primary
means of dissemination of study findings, a study report not only documents study findings, but

29
also provides essential information about the study that would allow readers, including program
officers from funding agencies and journal reviewers, to judge the quality of the study design and
the credibility of the study findings. In this section, we first provide general reporting guidelines,
and then highlight some of the most commonly missing information from reports of studies of
educational interventions.
Full Reporting Guidelines
As suggested throughout this paper, the methodological rigor of an impact study determines the
credibility of study findings. It can be hard to determine how rigorous a study is—and therefore
to judge how much to trust the findings—when critical information is not reported, or is
incompletely reported. There has been a concerted effort over the past 10 years or so, paralleling
the emphasis on more rigorous impact studies, to improve reporting practices. Many articles and
guides describe the elements that should be reported in impact studies, and these guides tend to
converge on which are most essential. In this section, we draw from these influential guides to
summarize the elements that should be included in reports of impact studies.
Of the many guides that list the essential elements to be reported in impact studies, one of the
most widely used is the CONSORT Statement (Altman et al., 2001; Moher, Schulz, & Altman,
2001). Although the CONSORT Statement was originally developed to guide the reporting of
RCTs, many of its components also apply to other types of impact studies. The CONSORT Web
site recorded an average of almost 50,000 page views and more than 8,000 visitors per month,
from over 115 countries, in late 2007. In addition to its popularity, there is also evidence that the
CONSORT Statement has indeed improved the reporting of RCTs. Plint, Moher, Schulz, Altman,
& Morrison (2005), for example, reviewed eight evaluations of the impact of using the
CONSORT Statement, and concluded that the use of the CONSORT Statement was associated
with better reporting of RCTs.
As part of the first phase of the WWC, the Coalition for Evidence-Based Policy (2005)
developed Reporting the Results of Your Study: A User-friendly Guide for Evaluators of
Educational Programs and Practices. This guide built on the reporting guidelines of the
CONSORT Statement,36
but was specifically designed to reflect the standards of the WWC and
the needs of the WWC users. For example, Reporting the Results of Your Study expanded the
scope the CONSORT Statement by addressing QEDs as well as RCTs, as well designed QEDs
were included in WWC reviews. In the remainder of this section, we summarize the essential
components of the study report of an impact study, drawing on both the CONSORT Statement
and Reporting the Results of Your Study.
Full reporting of an impact study should include at least the following sections: (1) title and
abstract, (2) background and purpose, (3) methods, (4) results, and (5) discussion. As noted later,
the WWC Phase I reviews revealed that certain sections were less likely to be fully reported than
others in study reports. The title and abstract were seldom missing or incomplete. However, the
methods and results sections often lacked key information. Therefore, important elements to be
reported in the methods and results sections are described here in greater detail.
36
This guide also incorporates technical decisions from the WWC and Flay et al. (2005).

30
Title and Abstract
In addition to the obvious (title and authors), the abstract should state the purpose of the study
and provide a basic description of the study design (i.e., RCT, QED , or other design) and other
elements described more fully in the methods section (e.g., setting, sample, intervention
description). It should also highlight the key findings from the study.
Background and Purpose
This section should set the context for the study, including a brief description of the intervention
and its history, the theory of action or conceptual framework guiding the study, a summary of the
existing evidence base, and the need for the current study. This section should also clearly state
the purpose of the study, as well as the research questions to be addressed or hypotheses to be
tested.
Methods
The methods section should provide information about the setting, sample, intervention,
assignment process, measures, data collection, and statistical methods. Information about the
setting—geographical location, time period, type of environment (e.g., public elementary
school)—and information on the sample—including eligibility criteria, sample size, participants’
background characteristics, including pretest scores—can provide valuable guidance on where
and to whom the study can be generalized.
The methods section should also describe the intervention and comparison conditions, both the
conditions as planned and the conditions as implemented. A clear description of the intervention
condition—including training and technical assistance, costs, personnel, and material
resources—can provide the details necessary to replicate the intervention or the study. A clear
description of the comparison condition, especially how it differed from the intervention
condition, can help readers understand the precise nature of the comparison and properly
interpret the substantive meaning of the impact estimates.
The process of allocating cases to different study conditions should be reported in detail in the
methods section. If the study claims to use random assignment, the description should include
the methods for generating the random assignment sequence (e.g., coin toss, random number
generator), the persons who implemented the random assignment (e.g., blinded researchers,
school staff), and the steps taken to protect against bias in the process. For QEDs with a
comparison group, the description should include how the comparison group was formed, and
matching methods and timing (before or after the intervention) if applicable. This information
can help determine the degree to which the assignment process produces fair and comparable
groups.
The methods section should describe the outcome constructs, the measures used in the study to
capture these constructs, and how the data were collected.37
Specifically, this section should
37
See American Educational Research Association et al. (1999) for a discussion of construct validity and the ways
in which outcome measures should map to the underlying constructs in the context of a specific study.
31
name each measure and provide evidence of adequate reliability and validity. This section can
provide information on the administrators of the measures, and strategies taken to ensure the
administrators do not compromise the integrity of the instruments. The timing of the assessments
should be noted, especially in terms of the progress of the intervention. For example, an
assessment given in the last month of a year-long intervention might have very different results
from an assessment given as a follow-up two years later.
Finally, the methods section should describe the analytic methods used for addressing the
research questions. Sufficient details should be provided to allow readers to understand how the
statistical models were specified, what assumptions were made, whether study design features
(e.g., clustering and blocking) were properly taken into account, and whether correction for
multiple comparisons was needed and made, among others.
Results
The results section should go beyond simple reporting of analysis findings and include
information about attrition, analytic sample sizes, and baseline equivalence of the analytic
sample, among other issues. It is recommended that the results section provide information about
the flow of participants through each stage of the study, attrition rates, and the final analytic
sample sizes for the outcomes. It is especially important to clearly identify pre-intervention
differences between the intervention and comparison groups in the analytic sample, not only for
QEDs, but also for RCTs, because randomization does not always lead to equivalent groups,
particularly in studies with small samples, and post-randomization attrition may also introduce
baseline differences. If substantial baseline differences were detected, the study authors should
explain whether and how the baseline differences were taken into account in the impact analyses.
When reporting findings, it is important to report all findings (not just positive, large, or
statistically significant findings) and to report all the information necessary to replicate the
findings. This may include analytic sample sizes, means, standard deviations, impact estimates
with standard errors, test statistics (e.g., t or F-statistic, or chi-square) with associated p values
and confidence intervals, and other information as appropriate. Study authors are also strongly
encouraged to report the magnitude of the effects in terms of an appropriate effect size, and
express findings in substantively meaningful, ―real-world‖ terms such as grade-level gains or
percentile increase in achievement, where possible. Subgroup and dosage analysis, if conducted,
should describe the nature of the subgroup or dosage, the reasoning behind this analysis, and,
again, complete reporting for all findings, not just statistically significant findings. If analyses of
multiple outcomes or subgroups were conducted, the study authors should indicate how the
multiple comparison problem was handled to avoid the risk of spurious significant findings.
Discussion
The discussion section should interpret the results and contributing factors, note the extent to
which these results may be generalized, and explore the implications of these results for
educators, policy makers, researchers, and others. In addition, the study authors should
acknowledge any limitations of the study and may suggest directions for future research.

32
Common Missing Information From Reports of Education Interventions
Having described what should be included in a study report, we discuss next the types of critical
information that were most likely to be missing in study reports as revealed by our WWC Phase I
reviews. In particular, we found that many study authors failed to provide sufficient details about
the sampling design and the findings of their study.
Missing Information About Sampling Design
The causal validity of an impact study depends most critically on its sampling design,
particularly on how the comparison group is formed. While many studies provide details about
sample characteristics, they typically include only sketchy descriptions of the sample allocation
process. During our WWC Phase I reviews, we found that in most of the studies that involved
random assignment, the authors merely stated that study participants were randomly assigned to
different conditions without providing further details about the assignment process. It is thus
difficult for readers to tell whether the randomization procedures were designed properly and
implemented effectively.38
As well recognized among experienced researchers, designing and implementing an RCT is a
highly complex and challenging task that is subject to a variety of practical problems (Gueron,
2002; Shadish et al., 2002). For example, one problem that occurred in some studies, as we
mentioned earlier, is that certain participants opted out of the study after random assignment and
were replaced by other participants. Such ad hoc sampling adjustments made after random
assignment are likely to compromise the integrity of the original randomization because one
could no longer be sure that the resulting study groups were equivalent. As another example,
some researchers may not fully understand what random assignment entails and mistakenly label
a haphazard assignment procedure as random assignment. Without information about how the
assignment was actually carried out, readers would be led to believe that the study is a true RCT
when it is essentially a QED.
Therefore, for studies designed to be an RCT, the researcher should report in sufficient detail
how the study groups were formed and whether any problems were encountered in the sample
allocation process, and if so, how the problems were handled. Such information will help readers
make a fair judgment of both the strengths and the weaknesses of the study design and the
credibility of the study findings.
The lack of specifics about the sample allocation process was common not only among RCTs,
but also among QEDs that were reviewed by the WWC. Many QEDs that equated study groups
through matching, for instance, offered little explanation about exactly how matching was done
and how closely the study groups were matched. Given that exact match is often difficult to
38
The WWC Evidence Standards require that for studies received by the WWC beginning January 1, 2007, for the
sample allocation to be considered ―random assignment,‖ the study authors must report specifics about the
randomization procedures, including details about the generation of the assignment sequence, the role of the person
who generated the sequence, and the methods used to conceal the sequence before assignment. For studies received
earlier, the WWC assumes that the random assignment was carried out properly even if no specifics were given by
the study authors, unless there is reason to believe otherwise.

33
achieve, particularly when the pool of potential comparison units is small and the number of
characteristics to be matched is large, study authors should explain clearly the matching methods
used and the baseline characteristics of the matched groups. This information will help readers to
better understand the adequacy of matching in equating the study groups, which is particularly
important for studies that rely on matching as the primary means to achieve group equivalence.
In addition to the sample allocation mechanism, another key aspect of sampling design is sample
size determination. In designing an impact study, the researcher should perform a power analysis
to ensure that the study has adequate sample size. Otherwise, the study may fail to yield
statistically significant findings even if the intervention has a real impact. However, the WWC
Phase I reviews showed that study authors rarely reported how they determined the sample size
for their study or whether their study had adequate statistical power, which made it difficult to
tell whether the nonsignificant findings in some studies were the result of an ineffective
intervention or the result of insufficient power. Therefore, we strongly encourage researchers not
only to routinely conduct a power analysis to inform the sampling design of their studies, but
also to explain their power calculations, particularly the underlying assumptions (e.g., the desired
power level, alpha, effect size, and ICC), in the study report.
With the availability of user-friendly power-analysis software programs (e.g., Optimal Design)
and widely circulated primers on power analysis (particularly Schochet, 2008a) in recent years,
more and more researchers have begun to pay attention to power analysis. This increased
attention may also be attributable to the fact that power analysis has become a standard
requirement of many funding agencies, including the U.S. Department of Education, for
proposals that seek support for conducting impact studies. Therefore, we are hopeful that power
analysis will be routinely performed and reported by researchers conducting impact studies in the
future.
Inadequate Reporting of Effect Sizes
Another area of reporting that limited studies reviewed by the WWC concerns study findings.
While almost all studies reviewed by the WWC reported the statistical significance of
intervention effects, few reported their findings in terms of effect sizes, and some did not provide
enough data to allow effect size computation by the WWC (even though the data requirements to
do so are minimal). Without information about effect sizes, it is difficult to judge the magnitude
or the practical significance of study findings (Valentine & Cooper, 2003). As the American
Psychological Association (APA) Publication Manual (2001, 5th edition) states:
For the reader to fully understand the importance of your findings, it is almost always
necessary to include some index of effect size or strength of relationship in your Results
section. … The general principle to be followed … is to provide the reader not only with
information about statistical significance but also with enough information to assess the
magnitude of the observed effect or relationship. (p. 25–26)
The APA manual asserts that "failure to report effect sizes" is a ―defect in the design and
reporting of research" (p. 5). The more recent American Educational Research Association
(2006) reporting standards also emphasize the importance of reporting effect sizes, noting that

34
―interpretation of statistical analyses is enhanced by reporting magnitude of relations (e.g., effect
sizes) and their uncertainty separately‖ (p. 37).
Effect sizes not only help readers understand the magnitude and the practical significance of
effects estimated by individual studies, but also provide the primary means for combining
findings across studies in research synthesis (Lipsey & Wilson, 2001). Therefore, the WWC
Evidence Standards explicitly requires that a study report must provide the data necessary for
computing the effect size for at least one relevant outcome in order to be considered eligible for
WWC review. An RCT that assessed an intervention’s effects using t-tests, for example, should
report the means and standard deviations of each outcome, as well as the analytic sample size for
each study group separately, to allow the computation of effect sizes. Effect sizes in this case can
also be computed if the analytic sample size for each study group and the actual t-statistics from
the impact analyses were reported.
Readers can refer to the Technical Details of WWC-Conducted Computations document for a
detailed account of the types of data needed for effect size computation and the formulae for
computing effect sizes under various scenarios. We have also created a set of Excel programs—
the WWC (Phase I) Computation Tools—to assist researchers in conducting effect size
computations. We highly recommend that researchers not only report effect sizes in their study
report, but also explain how the effect sizes were computed and provide the necessary data (e.g.,
means, standard deviations, and sample sizes) for the effect size computation to allow readers
and reviewers to replicate their effect size findings.
Concluding Remarks
The process of developing evidence standards and reviewing studies during the first phase of the
WWC generated a wealth of information that may be useful for designing and reporting future
impact studies in education and related fields. The work undertaken during the first phase of the
WWC also raised the awareness among many educational researchers of the need for more
rigorous studies of educational interventions. Indeed, the paucity of rigorous studies of
educational interventions was one of the most striking findings from the WWC Phase I reviews.
Of the more than 1,500 studies that were reviewed during the first phase of the WWC, only 5%
Met Evidence Standards, 5% Met Evidence Standards With Reservations, and 89% Did Not Meet
Evidence Screens. Clearly, there is ample room for improvement in the rigor of empirical studies
of educational interventions.
Drawing upon what we learned from the WWC and the literature on the design and analysis of
impact studies, we have provided practical guidance on critical issues related to the design,
implementation, analysis, and reporting of impact studies in education and related social science
fields. We hope that the information presented in this paper will be useful for researchers as they
plan and conduct their own studies, and for readers and reviewers as they judge the quality of the
design and the credibility of the findings from studies conducted by other researchers. We also
hope that as a result of the WWC and related work such as ours, an increasing number of studies
will be able to meet the WWC standards and contribute to the scientific knowledge base about
what works in education and to better-informed policies and practices that will have a positive
impact on the achievement and well-being of schoolchildren.

35
References
Aitkin, M., & Longford, N. (1986). Statistical modeling issues in school effectiveness studies
(with discussion). Journal of the Royal Statistical Society, A(149), 1–43.
American Educational Research Association, American Psychological Association, and National
Council for Measurement in Education (1999). Standards for Educational and
Psychological Testing. Washington, DC: Author.
Altman, D. G., Schulz, K. F., Moher, D., Egger, M., Davidoff, F., Elbourne, D., et al. (2001).
The revised CONSORT statement for reporting randomized trials: Explanation and
elaboration. Annals of Internal Medicine, 134(8), 663–694.
American Educational Research Association. (2006). Standards for reporting on empirical social
science research in AERA publications. Educational Researcher, 35(6), 33-40.
American Psychological Association (2001). Publication manual of the American Psychological
Association (5th ed.). Washington, DC: Author.
Benjamini, Y., & Hochberg, Y. (1995). Controlling the false discovery rate: A practical and
powerful approach to multiple testing. Journal of the Royal Statistical Society, Series B
(Methodological), 57(1), 289–300.
Benjamini, Y., Hochberg, Y., & Kling, Y. (1993). False discovery rate control in pairwise
comparisons (Working Paper 93-2). Department of Statistics and O.R., Tel Aviv
University.
Benjamini, Y., Hochberg, Y., & Kling, Y. (1997). False discovery rate control in multiple
hypothesis testing using dependent test statistics (Research Paper 97-1). Department of
Statistics and O.R., Tel Aviv University.
Bland, J. M., & Altman, D. G. (1995). Multiple significance test: The Bonferroni method. British
Medical Journal, 310, 170.
Bloom, H. S. (1995). Minimum detectable effects: A simple way to report the statistical power.
Evaluation Review, 19(5), 547–556.
Bloom, H. S. (2005). Randomizing groups to evaluate place-based programs. In H. S. Bloom
(Ed.), Learning more from social experiments: Evolving analytic approaches (pp. 115–
172). New York: Russell Sage Foundation.
Bloom, H. S., Bos, J. M., & Lee, S. W. (1999). Using cluster random assignment to measure
program impacts: Statistical implications for the evaluation of education programs.
Evaluation Review, 234, 445–69.

36
Bloom, H. S., Michalopoulos, C., & Hill, C. J. (2005). Using experiments to assess
nonexperimental comparison-group methods for measuring program effects. In H. S.
Bloom (Ed.), Learning more from social experiments (pp. 173–235). New York: Russell
Sage Foundation.
Bloom, H. S., Richburg-Hayes, L., & Black, A. R. (2007). Using covariates to improve precision
for studies that randomize schools to evaluate educational interventions. Educational
Evaluation and Policy Analysis, 29(1), 30–59.
Bonferroni, C. E. (1935). Il calcolo delle assicurazioni su gruppi di teste. In Studi in Onore del
Professore Salvatore Ortu Carboni. Rome, pp. 13–60.
Coalition for Evidence-Based Policy. (2005). Reporting the results of your study: A user-friendly
guide for evaluators of educational programs and practices. Retrieved January 2, 2009,
from http://ies.ed.gov/ncee/wwc/pdf/guide_SRF.pdf
Cochran, W. G., & Rubin, D. B. (1973). Controlling bias in observational studies: A review.
Sankhya, 35, 417–446.
Cohen, J. (1988). Statistical power analysis for the behavioral sciences. (2nd ed.) Hillsdale, NJ:
Lawrence Erlbaum Associates, Inc.
Cohen, J., & Cohen, P. (1983). Applied multiple regression/correlation analysis for the
behavioral sciences. (2nd ed.). Hillsdale, NJ: Lawrence Erlbaum Associates, Inc.
Cook, T. D., Shadish, W. R., & Wong, V. C. (2008). Three conditions under which experiment
and observational studies produce comparable causal estimates: New findings from
within-study comparisons. Journal of Policy Analysis and Management, 27(4), 724–750.
Cortina, J.M. (1993). What is coefficient alpha? An examination of theory and application.
Journal of Applied Psychology, 78(1), 98-104.
Crawford, D. B., & Snider, V. E. (2000). Effective mathematics instruction: The importance of
curriculum. Education and Treatment of Children, 23(2), 122–142.
Curran-Everett, D. (2000). Multiple comparisons: Philosophies and illustrations. American
Journal of Physiology. Regulatory, Integrative and Comparative Physiology, 279, R1–R8.
D'Agostino, R. B. Jr. (1998). Tutorial in biostatistics: Propensity score methods for bias
reduction in the comparison of a treatment to a non-randomized control group. Statistics
in Medicine, 17, 2265–2281.
Donner, A. & Klar, N. (2000). Design and analysis of cluster randomized trials in health
research. London: Arnold Publishing.
Drake, C. (1993). Effects of misspecification of the propensity score on estimators of treatment
effect. Biometrics, 49, 1231-1236.
37
Dunnett, C. (1955). A multiple comparisons procedure for comparing several treatments with a
control. Journal of American Statistical Association, 50, 1096–1121.
Flay, B. R. (1986). Efficacy and effectiveness trials (and other phases of research) in the
development of health promotion programs. Preventive Medicine, 15, 451–474.
Flay, B. R., Biglan, A., Boruch, R. F., Castro, F. G., Gottfredson, D., Kellam, S., et al. (2005).
Standards of Evidence: Criteria for Efficacy, Effectiveness, and Dissemination. Falls
Church, VA: Society for Prevention.
Flay, B. R., & Collins, L. M. (2005). Historical review of school-based randomized trials for
evaluating problem behavior prevention programs. The Annals of the American Academy
of Political and Social Science, 599, 147–175.
Foster, E. M. (2003). Propensity score matching: An illustrative analysis of dose response.
Medical Care, 41, 1183–1192.
Fraker, T., & Maynard, R. (1987). The adequacy of comparison group designs for evaluations of
employment-related programs. Journal of Human Resources, 22(2), 194–227.
Glazerman, S., Levy, D. M., & Myers, D. (2003). Nonexperimental versus experimental
estimates of earnings impacts. The Annals of the American Academy of Political and
Social Science, 589, 63–93.
Gu, X. S., & Rosenbaum, P. R. (1993). Comparison of multivariate matching methods:
Structures, distances, and algorithms. Journal of Computational and Graphic Statistics,
2(4), 405–420.
Gueron, J. M. (2002). The politics of random assignment: Implementing studies and impacting
policy. In F. Mosteller and R. Boruch (Eds.), Evidence matters: Randomized trials in
education research (pp. 15–49). Washington, DC: Brookings Institution Press.
Heckman, J. J., Ichimura, H., & Todd, P. (1997). Matching as an econometric evaluation
estimator: Evidence from evaluating a job training programme. Review of Economic
Studies, 64, 605-654.
Hedges, L. V. (2007). Correcting a significance test for clustering. Journal of Educational and
Behavioral Statistics, 32(2), 151–179.
Hedges, l. V. & Hedberg, E. C. (2007). Intraclass correlation values for planning group-
randomized trials in education. Educational Evaluation and Policy Analysis, 29, 60-87.
Hill, J. L., Waldfogel, J., Brooks-Gunn, J., & Han, W. J. (2005). Maternal employment and child
development: A fresh look using newer methods. Developmental Psychology, 41(6), 833-
850.

38
Ho, D., Imai, K., King, G., & Stuart, E. A. (2007). Matching as nonparametric preprocessing for
reducing model dependence in parametric causal inference. Political Analysis, 15, 199–
236.
Hochberg, Y. (1988). A sharper Bonferroni procedure for multiple tests of significance.
Biometrika, 75, 800–803.
Hochberg, Y. & Tamhane, A. (1987). Multiple comparison procedures. New York: Wiley.
Hong, G., & Raudenbush, S. W. (2006). Evaluating kindergarten retention policy: A case study
of causal inference for multilevel observation data. Journal of American Statistical
Association, 101(475), 901-910.
Imbens, G. W., Rubin, D. B., & Sacerdote, B. (2001). Estimating the effect of unearned income
on labor earnings, savings, and consumption: Evidence from a sample of lottery players.
American Economic Review, 91, 778–794.
Keselman, H. J., Cribbie, R., & Holland, B. (1999). The pairwise multiple comparison
multiplicity problem: An alternative approach to familywise and comparisonwise Type I
error control. Psychological Methods, 4(1), 58–69.
Kunz, R., & Oxman, A. D. (1998). The unpredictability paradox: Review of empirical
comparisons of randomised and nonrandomised clinical trials. British Medical Journal,
7167, 1185–1190.
Lenth, R. V. (2006-9). Java Applets for Power and Sample Size [Computer software]. Retrieved
February 13, 2010, from http://www.stat.uiowa.edu/~rlenth/Power.
Lipsey, M. W., & Wilson, D. B. (2001). Practical meta-analysis. Thousand Oaks, CA: Sage
Publications.
Little, R. J., & Rubin, D. B. (2001). Causal effects in clinical and epidemiological studies via
potential outcomes: Concepts and analytical approaches. Annual Review of Public Health,
21, 121–145.
Moher D., Schulz, K. F., & Altman, D. (2001). The CONSORT statement: Revised
recommendations for improving the quality of reports of parallel-group randomized
trials. JAMA, 285(15), 1987–1991.
Morgan, S. L. (2001). Counterfactuals, causal effect heterogeneity, and the Catholic School
Effect on Learning. Sociology of Education, 74, 341-374.
Murray, D. M. (1998). Design and analysis of group-randomized trials. (Vol. 27). New York:
Oxford University Press.
Peduzzi, P., Concato, J., Kemper, E., Holford, T. R., & Feinstein, A. (1996). A simulation of the
number of events per variable in logistic regression analysis. Journal of Clinical
Epidemiology, 99, 1373–1379.
39
Plint, A. C., Moher, D., Schulz, K., Altman, D. G., & Morrison, A. (September 16–18, 2005).
Does the CONSORT checklist improve the quality of reports of randomized controlled
trials? A systematic review. Fifth International Congress of Peer Review and Biomedical
Publication [PMID: 16948622].
Raudenbush, S. W. (1997). Statistical analysis and optimal design in cluster randomized trials.
Psychological Methods, 2(2), 173–185.
Raudenbush, S. W., & Bryk, A. S. (2002). Hierarchical linear models: Applications and data
analysis methods (Vol. 1). Thousand Oaks, CA: Sage Publications.
Raudenbush, S. W., Martinez, A., & Spybrook, J. (2007). Strategies for improving precision in
group-randomized experiments. Educational Evaluation and Policy Analysis, 29(1), 5–29.
Rosenbaum, P. R. (1986). Dropping out of high school in the United States: An observational
study. Journal of Educational Statistics, 11(3), 207-224.
Rosenbaum, P. R. (1999). Choice as an alternative to control in observational studies. Statistical
Science, 14(3), 259–301.
Rosenbaum, P. R., & Rubin, D. B. (1983). The central role of propensity score in observational
studies for causal effects. Biometrika, 70(1), 41–55.
Rosenbaum, P. R., & Rubin, D. B. (1985). Constructing a control group using multivariate
matched sampling methods that incorporate the propensity score. The American
Statistician, 39(1), 33–38.
Rubin, D. B. (1973). The use of matched sampling and regression adjustment to remove bias in
observational studies. Biometrics, 29, 185–203.
Rubin, D. B. (1974). Estimating causal effects of treatments in randomized and non-randomized
studies. Journal of Educational Psychology, 66, 688–701.
Rubin, D. B. (1979). Using multivariate matched sampling and regression adjustment to control
bias in observational studies. Journal of the American Statistical Association, 74, 318–
328.
Rubin, D. B. (1980). Bias Reduction Using Mahalanobis Metric Matching. Biometrics, 36, 293-
298.
Rubin, D. B. (1997). Estimating causal effects from large data sets using propensity scores.
Annals of Internal Medicine, 127, 757-763.
Rubin, D. B. (2001). Using propensity scores to help design observational studies: Application to
the tobacco litigation. Health Services & Outcomes Research Methodology, 2, 169–188.
Rubin, D. B. (2006). Matched sampling for causal effects. New York: Cambridge University
Press.

40
Rubin, D. B., & Thomas, N. (2000). Combining propensity score matching with additional
adjustments for prognostic covariates. Journal of American Statistical Association, 95,
573–585.
Scheffe, H. (1953). A method for judging all contrasts in the analysis of variance. Biometrika,
40, 87–104.
Schochet, P. Z. (2008a). Statistical power for random assignment evaluations of education
programs. Journal of Educational and Behavioral Statistics, 33(1), 62–87.
Schochet, P. Z. (2008b). Technical Methods Report: Guidelines for Multiple Testing in Impact
Evaluations (NCEE 2008-4018). Washington, DC: National Center for Education
Evaluation and Regional Assistance, Institute of Education Sciences, U.S. Department of
Education. Retrieved December 15, 2008, from http://ies.ed.gov/ncee/pdf/20084018.pdf
Shadish, W. R., Cook, T. D., & Campbell, D. T. (2002). Experimental and quasi-experimental
designs for generalized causal inference. Boston: Houghton Mifflin Company.
Slavin, R. E. (2008). What works? Issues in synthesizing educational program evaluations.
Educational Researcher, 37(1), 5–14.
Snijders, T., & Bosker, R. (1999). Multilevel analysis: An introduction to basic and advanced
multilevel modeling. London: Sage Publications.
Spybrook, J., Raudenbush, S. W., Congdon, R., & Martinez, A. (2009). Optimal design for
longitudinal and multilevel research: Documentation for the "Optimal Design" software
(Version 2.0). Retrieved April 15, 2009, from http://sitemaker.umich.edu/group-
based/files/od-manual-v200-20090722.pdf
Starfield, B. (1977). Efficacy and effectiveness of primary medical care for children. In Harvard
Child Health Project, children's medical care needs and treatment: Report of the
Harvard Child Health Project. Cambridge, MA: Ballinger.
Stuart, E. A., & Rubin, D. B. (2008). Best practices in quasi-experimental designs: Matching
methods for causal inference. In J. Osborne (Ed.), Best practices in quantitative social
science (pp. 155–176). Thousand Oaks, CA: Sage Publications.
Tukey, J. (1949). Comparing individual means in the analysis of variance. Biometrika, 5, 99–
114.
Valentine, J. C. (2009). Judging the quality of primary research for research synthesis. In H.
Cooper, L. V. Hedges, & J. C. Valentine (Eds.), The handbook of research synthesis and
meta-analysis (2nd ed.), pp. 129–146. New York: Russell Sage Foundation.
Valentine, J. C., & Cooper, H. (2003). Effect size substantive interpretation guidelines: Issues in
the interpretation of effect sizes. Washington, DC: U.S. Department of Education.
Retrieved December 15, 2008, from http://ies.ed.gov/ncee/wwc/pdf/essig.pdf

41
Van Dusen, L., & Worthen, B. (1994). The impact of integrated learning system implementation
on student outcomes: Implications for research and evaluation. International Journal of
Educational Research, 21, 13–24.
Varnell, S. P., Murray, D. M., & Baker, W. L. (2001). An evaluation of analysis options for the
one-group-per-condition design: Can any of the alternatives overcome the problems
inherent in this design? Evaluation Review, 25(4), 440–453.
What Works Clearinghouse. (2006a). WWC study review standards. Washington, DC: Author.
What Works Clearinghouse. (2006b). Tutorial on Mismatch Between Unit of Assignment and
Unit of Analysis. Washington, DC: Author. Retrieved July 15, 2008, from
http://ies.ed.gov/ncee/wwc/references/iDocViewer/Doc.aspx?docId=20&tocId=7
What Works Clearinghouse (2008). WWC procedures and Version 2 standards handbook.
Washington, DC: Author. Retrieved December 15, 2008, from
http://ies.ed.gov/ncee/wwc/pdf/wwc_procedures_v2_standards_handbook.pdf
Williams, V. S. L., Jones, L. V., & Tukey, J. W. (1999). Controlling error in multiple
comparisons, with examples from state-to-state differences in educational achievement.
Journal of Educational and Behavioral Statistics, 24(1), 42–69.
Ysseldyke, J., Spicuzza, R., Kosciolek, S., Teelucksingh, E., Boys, C., & Lemkuil, A. (2003).
Using a curriculum-based instructional management system to enhance math
achievement in urban schools. Journal of Education for Students Placed at Risk, 8(20),
247–265.


