A portfolio model for component purchasing strategy and ...
67
HAL Id: hal-00543965 https://hal.archives-ouvertes.fr/hal-00543965 Submitted on 7 Dec 2010 HAL is a multi-disciplinary open access archive for the deposit and dissemination of sci- entific research documents, whether they are pub- lished or not. The documents may come from teaching and research institutions in France or abroad, or from public or private research centers. L’archive ouverte pluridisciplinaire HAL, est destinée au dépôt et à la diffusion de documents scientifiques de niveau recherche, publiés ou non, émanant des établissements d’enseignement et de recherche français ou étrangers, des laboratoires publics ou privés. A portfolio model for component purchasing strategy and the case study of two South Korean elevator manufacturers Dong Myung Lee, Paul R Drake To cite this version: Dong Myung Lee, Paul R Drake. A portfolio model for component purchasing strategy and the case study of two South Korean elevator manufacturers. International Journal of Production Research, Taylor & Francis, 2009, pp.1. 10.1080/00207540902897780. hal-00543965
Transcript of A portfolio model for component purchasing strategy and ...

HAL Id: hal-00543965https://hal.archives-ouvertes.fr/hal-00543965
Submitted on 7 Dec 2010
HAL is a multi-disciplinary open accessarchive for the deposit and dissemination of sci-entific research documents, whether they are pub-lished or not. The documents may come fromteaching and research institutions in France orabroad, or from public or private research centers.
L’archive ouverte pluridisciplinaire HAL, estdestinée au dépôt et à la diffusion de documentsscientifiques de niveau recherche, publiés ou non,émanant des établissements d’enseignement et derecherche français ou étrangers, des laboratoirespublics ou privés.
A portfolio model for component purchasing strategyand the case study of two South Korean elevator
manufacturersDong Myung Lee, Paul R Drake
To cite this version:Dong Myung Lee, Paul R Drake. A portfolio model for component purchasing strategy and the casestudy of two South Korean elevator manufacturers. International Journal of Production Research,Taylor & Francis, 2009, pp.1. �10.1080/00207540902897780�. �hal-00543965�

For Peer Review O
nly
A portfolio model for component purchasing strategy and
the case study of two South Korean elevator manufacturers
Journal: International Journal of Production Research
Manuscript ID: TPRS-2008-IJPR-0926.R1
Manuscript Type: Original Manuscript
Date Submitted by the Author:
27-Feb-2009
Complete List of Authors: Lee, Dong Myung; University of Liverpool, Management School Drake, Paul; University of Liverpool, Operations Management and e-Business Group
Keywords: PURCHASING, PROCUREMENT, SUPPLY CHAIN MANAGEMENT
Keywords (user): PURCHASING, PROCUREMENT
http://mc.manuscriptcentral.com/tprs Email: [email protected]
International Journal of Production Research

For Peer Review O
nly
A portfolio model for component purchasing strategy and
the case study of two South Korean elevator manufacturers.
Dong Myung Lee and Paul R. Drake*
Operations Management and e-Business Group
University of Liverpool Management School
Liverpool, L69 7ZH, UK
Abstract
A new approach to purchasing portfolio modelling, stemming from Kraljic’s matrix,
for developing purchasing strategies that are aligned with competitive priorities, is
developed to address the weaknesses of existing approaches that are preventing
widespread application, especially in SMEs. The importance of strategic purchasing
to achieving competitive priorities and the need to align it with business strategy is
argued through a literature review, which is also used to establish that purchasing
portfolio modelling is an effective tool in achieving this alignment. The new approach
is applied to two South Korean elevator manufacturers.
Keywords - Purchasing strategy, Portfolio model, SME, AHP
*Corresponding author: Dr Paul R Drake, Telephone: 0151-7953603, Email:
Page 1 of 65
http://mc.manuscriptcentral.com/tprs Email: [email protected]
International Journal of Production Research
123456789101112131415161718192021222324252627282930313233343536373839404142434445464748495051525354555657585960

For Peer Review O
nly
1
A portfolio model for component purchasing strategy and the
case study of two South Korean elevator manufacturers.
Abstract
A new approach to purchasing portfolio modelling, stemming from Kraljic’s matrix, for
developing purchasing strategies that are aligned with competitive priorities, is developed
to address the weaknesses of existing approaches that are preventing widespread
application, especially in SMEs. The importance of strategic purchasing to achieving
competitive priorities and the need to align it with business strategy is argued through a
literature review, which is also used to establish that purchasing portfolio modelling is an
effective tool in achieving this alignment. The new approach is applied to two South
Korean elevator manufacturers.
Keywords - Purchasing strategy, Portfolio model, SME, AHP
Page 2 of 65
http://mc.manuscriptcentral.com/tprs Email: [email protected]
International Journal of Production Research
123456789101112131415161718192021222324252627282930313233343536373839404142434445464748495051525354555657585960

For Peer Review O
nly
2
1. Introduction
Many manufacturers spend approximately 50% to 70% of each sales dollar on purchased
materials and components (van Weele, 2005), so their success is heavily influenced by
the performance of their suppliers and purchased components. Purchasing has become
one of the most critical activities of a manufacturing business (Parikh and Joshi,
2005)(Sarkis and Talluri, 2002). It is a key strategic activity for achieving high quality,
high variety, low cost and fast delivery of the end-product.
The purchasing function is largely responsible for specifying the characteristics of
purchased materials, components and services, selecting suitable suppliers and managing
the transaction so that purchases are delivered in a timely manner (Burt, 1989 cited in
Krause et al., 2001). The buyer must determine and manage the purchasing strategy on
the basis of its business strategy and a deep understanding of its products (Watts et al.,
1995) (van Weele, 2005) to achieve “strategic purchasing”. For example, if the corporate
strategy is concentrated on providing customers with high quality products, then both the
manufacturing strategy and the purchasing strategy must also focus on quality. If the
basis of competition is cost then the focus of both must be on reducing costs although
qualifying levels of quality must be maintained.
A survey of 111 purchasing executives in the UK concluded that, “Strategic purchasing
leads to improved supplier integration and socialisation mechanisms, giving overall
improvements in buyer performance.” (Lawson et al, 2008). Chen and Paulraj (2004)
placed strategic purchasing at the centre of their theoretical framework for supply chain
management research, referring to the “imperative role” of strategic purchasing within
Page 3 of 65
http://mc.manuscriptcentral.com/tprs Email: [email protected]
International Journal of Production Research
123456789101112131415161718192021222324252627282930313233343536373839404142434445464748495051525354555657585960

For Peer Review O
nly
3
supply chain management. The widely cited Hayes and Wheelwright (1984) model of the
relationship between business strategy and functional strategy is unequivocal in that
functional strategies should support the business strategy and be internally consistent.
Based on a survey of 180 pairs of manufacturing and purchasing executives from
manufacturing firms in the USA, Pagell and Krause (2002) confirmed that higher levels
of consensus among internal functions regarding competitive priorities are associated
with higher levels of performance and competitive advantage.
Major manufacturers such as Motorola, Honda and Toyota have benefited from
strategically managing purchasing and relationships with their suppliers (Metty et al.,
2005)(Pressey et al., 2007), attaining higher quality, increased operational flexibility,
shorter lead-times and cost reductions as a result (Janda and Seshadri, 2001). Strategic
purchasing can also benefit small firms (Carr and Pearson, 2002). However, small and
medium size enterprises’ (SMEs’) use of portfolio models is much lower than that of
larger enterprises (Gelderman and van Weele, 2005). Instead, purchasing decisions in
small firms are generally made by the owner or a chosen few on the basis of intuition and
personal experience (Cagliano and Spina, 2002), or possibly misconception, and this can
lead naturally to poor performance. Moreover, small firms may find it difficult to gain
interest in development and collaboration from their suppliers because they have little
purchasing power (Quayle, 2002) (Gonzalez-Benito et al, 2003) and lack the management
resource to find and develop alternative suppliers and solutions (Gadde and Hakansson,
2001). Most previous research into purchasing strategy has been in the context of large
companies (Cagliano and Spina, 2002), so little has been reported on purchasing strategy
for SMEs in particular. This paper reports the development of a portfolio model for
Page 4 of 65
http://mc.manuscriptcentral.com/tprs Email: [email protected]
International Journal of Production Research
123456789101112131415161718192021222324252627282930313233343536373839404142434445464748495051525354555657585960

For Peer Review O
nly
4
developing purchasing strategy and applies it in two SMEs. The focus is on the
development of a practical approach that is simple enough for SMEs to implement with
their limited resources and limited access to quantitative supplier data (they have less
power), although the approach is still intended to be valid for all sizes of enterprises.
ABC inventory analysis has been used widely to classify the importance of components
by cost of consumption, i.e. unit-cost times units-consumed. This indicates priorities for
inventory management, but it does not provide any purchasing strategies for the
categories, it merely provides information on the concentration of purchase spend
(Gelderman and van Weele, 2005). ABC analysis is easy to understand and use, but it has
major weaknesses (Flores et al., 1992). It can over-emphasize items that have a high cost
of consumption but no critical effects on production operations or the quality of the end-
product, whilst it may under-emphasize items that have a low cost of consumption but are
critical to quality. The problem stems from ABC classification using a single measure,
cost of consumption, when there are other important criteria such as inventory cost,
obsolescence, durability and stock-out penalty (Ng, 2007)(Partovi and Anandarajan,
2002). When manufacturers buy components they should focus on the total overall cost
rather than simply the lowest price (Burt, 1989).
Kraljic (1983) introduced a portfolio approach to purchasing in which purchased items
are classified on the basis of two dimensions, importance of the purchase and complexity
of the supply market. Items are classified by evaluating and positioning them into one of
four quadrants of the two-dimensional portfolio model. The quadrants represent different
purchasing strategies. Gelderman (2003) defined a portfolio model as a tool that uses two
Page 5 of 65
http://mc.manuscriptcentral.com/tprs Email: [email protected]
International Journal of Production Research
123456789101112131415161718192021222324252627282930313233343536373839404142434445464748495051525354555657585960

For Peer Review O
nly
5
or more dimensions to define heterogeneous categories for which different strategic
recommendations are provided. Following on from Kraljic, others have developed similar
portfolio models based on a two-dimensional framework, for example see (Bensaou,
1999) and (Olsen and Ellram, 1997). Purchasing portfolio models enable a business to
identify the more important purchased items from the point of view of purchasing
strategy, helping it to achieve a sustainable competitive edge and high profitability
(Wagner and Johnson, 2004) through differentiated purchasing strategies (Gelderman and
van Weele, 2005).
Recently, purchasing portfolio models have received a great deal of attention in the
academic and business fields. They are easy to understand and give practical guidelines
on how to manage different purchased items, suppliers and supplier relationships (Dubois
and Pedersen, 2002). Surveys found that 74% of Dutch purchasers (Gelderman, 2003)
and 55% of French purchasers (Kibbeling, 2005) in the manufacturing and engineering
sectors use purchasing portfolio analysis. In a survey of 122 companies in the UK across
the manufacturing, service and other industry sectors, purchasing portfolio analysis was
found to be the second most used of 65 purchasing and supply tools, with vendor rating
coming first (Cox and Watson, 2004).
2. Existing Portfolio Models
Markowitz (1952) originally developed portfolio theory for financial investment
decision-making and it has been used widely in strategic planning and marketing. Kraljic
(1983) introduced the first portfolio matrix for purchasing and supply management
(Gelderman and van Weele, 2005), but until recently application within purchasing had
Page 6 of 65
http://mc.manuscriptcentral.com/tprs Email: [email protected]
International Journal of Production Research
123456789101112131415161718192021222324252627282930313233343536373839404142434445464748495051525354555657585960

For Peer Review O
nly
6
been limited (Nellore and Soderquist, 2000). Portfolio models have been applied in
related areas such as supplier involvement in product development (Wynstra and ten
Pierick, 2000), e-purchasing (Bartezzaghi and Ronchi, 2004), the specification process
(Nellore and Soderquist, 2000) and inter-organisational competence development (Moller
et al., 2000).
In Kraljic’s portfolio matrix, purchased items are classified by two dimensions; the profit
impact of the purchase and the complexity of the supply market (supply risk). Profit
impact is defined in terms of the volume purchased, the percentage of the total cost of
purchases and the impact on product quality or competitive strategy. Supply risk is
assessed in terms of availability, the number of suppliers, competitive demand from
others for the supplied item, make-or-buy opportunities, storage risks and substitution
possibilities (alternatives). Each dimension spans the values high and low, so the
segmented (2 x 2) matrix in Figure 1 is used to classify purchases into four categories,
strategic, bottleneck, leverage and non-critical, that lay the foundations of the purchasing
strategy. A summary of the nature of the purchasing strategies implied by these
categories is synthesised below from (Kraljic, 1983) (de Boer et al., 2001) and
(Gelderman and van Weele, 2005).
Strategic purchases are critical to success and require close interactions between the
buyer and the supplier, they cannot be left to the vagaries of open-market based supply.
The purchasing strategy is to maintain a strategic partnership, so the manufacturer should
manage these purchases by regular information exchanges with suppliers, frequent visits
from both partners and long-term supply relationships, perhaps moving towards virtual
Page 7 of 65
http://mc.manuscriptcentral.com/tprs Email: [email protected]
International Journal of Production Research
123456789101112131415161718192021222324252627282930313233343536373839404142434445464748495051525354555657585960

For Peer Review O
nly
7
integration. A long-term relationship perspective increases the intensity of buyer–supplier
co-ordination (De Toni and Nassimbeni, 1999), which could extend to a manufacturer
involving a supplier in its product development.
Leverage purchases are easy to manage but have high strategic importance. They could
be obtained from various suppliers, so the general recommendation is to exploit
purchasing power, managing these purchases by supplier selection, product substitution
and targeted pricing negotiations. The purchasing strategy could be based upon the
principle of competitive bidding.
Bottleneck purchases are difficult to manage but have low strategic importance. They
cause significant problems and risks in their supply, possibly because suppliers are scarce
and/or too powerful. The core of the purchasing strategy is to ensure the volume of
components, so these purchases should be managed by supplier control, safety stock and
backup plans. Alternative suppliers could be found.
Non-critical purchases are easy to manage and have low strategic importance. They cause
only few technical or commercial problems from the point of view of purchasing.
However, they are ordered frequently from many suppliers, so their logistical and
administrative costs are high. Therefore, the focus of the purchasing strategy is to reduce
transaction costs through efficient processing, product standardisation and the
optimisation of order volumes and inventory levels. The number of suppliers could be
reduced through category management.
Page 8 of 65
http://mc.manuscriptcentral.com/tprs Email: [email protected]
International Journal of Production Research
123456789101112131415161718192021222324252627282930313233343536373839404142434445464748495051525354555657585960

For Peer Review O
nly
8
There have been empirical studies to test and develop Kraljic’s model (Caniels and
Gelderman, 2007) (Gelderman and van Weele, 2003) (Wagner and Johnson, 2004).
Whilst Gelderman (2003) argues that it is not clear why Kraljic selected the particular
dimensions used, endorsement is seen in their use by others and in the use of similar
dimensions in the literature reviewed below. This paper makes a contribution through the
interpretation, justification and subsequent development of these dimensions.
Based on the work of Kraljic (1983) and Fiocca (1982) and following on from
Narasimhan (1983), Olsen and Ellram (1997) proposed a portfolio model to assist in
managing different kinds of supplier relationships. They renamed the vertical and
horizontal dimensions in Figure 1, “strategic importance of the purchase” and “difficulty
of the purchasing situation” respectively, although in effect there is little change in
meaning. They assess strategic importance by three factors internal to the firm:
competence, economics and image. These factors have three, four and two measures
respectively, resulting in a total of nine measures. The difficulty of managing the
purchasing situation is assessed by three factors external to the company: product, supply
market and environmental characteristics. Each of these factors has two measures,
resulting in a total of six measures, so that overall Olsen and Ellram use fifteen measures,
as listed in Table 1. The dimensions make up a portfolio model with the same four
categories or matrix quadrants used by Kraljic. However, they have been criticised for not
testing their model empirically (Zolkiewski and Turnbull, 2000). Moller et al. (2000)
found the model impractical because it incorporates too many factors and measures.
Bensaou (1999) developed a portfolio model using the two dimensions, buyers’ specific
Page 9 of 65
http://mc.manuscriptcentral.com/tprs Email: [email protected]
International Journal of Production Research
123456789101112131415161718192021222324252627282930313233343536373839404142434445464748495051525354555657585960

For Peer Review O
nly
9
investments and suppliers’ specific investments. These are broadly defined and can
include anything from tangible to intangible resources developed to meet the needs of
specific suppliers or customers. They are typically difficult or expensive to transfer to
another relationship and may lose their value when redeployed. Bensaou’s model
classifies supplier relationships into four categories: strategic partnership, captive
supplier, captive buyer and market exchange - see Figure 2. Wasti et al. (2006) tested this
model on a case study taken from the automotive industry in Turkey, with the result that
no captive buyer relationships were identified. Comparing their findings with those of
Bensaou, the Turkish situation resembles that seen in Japan where there are few captive
buyer relationships and that seen in the USA where there are fewer market exchange
relationships than strategic partnerships. Since Bensaou’s model has been developed
primarily for the automotive industry, there is insufficient guidance provided for practical
use in other industries, which can be quite different, so it has not seen widespread
application (Gelderman, 2003). Large automobile manufacturers sit at the top of their
supplier pyramids and their relationships with their major suppliers are generally closed
and involve contracts for long periods of time, so that the suppliers become very
dependent upon them. This is why the level of specific investments is important in
determining strategy in Bensaou’s automotive model. In contrast, the model developed in
this paper is based on Kraljic’s approach, which is not sector specific. A summary of the
dimensions of the models discussed above is given in Table 1.
The existing approaches to purchasing portfolio modelling show that a common problem
in defining dimensions is the synthesising of qualitative and quantitative measures
(Ahone and Salmi, 2003). If it is difficult discriminating between high and low on the
Page 10 of 65
http://mc.manuscriptcentral.com/tprs Email: [email protected]
International Journal of Production Research
123456789101112131415161718192021222324252627282930313233343536373839404142434445464748495051525354555657585960

For Peer Review O
nly
10
dimensions’ scales then the classification of purchases will be arbitrary (Gelderman and
van Weele, 2003). The Analytic Hierarchy Process (AHP) is a decision making tool that
can help in setting priorities and making the best decisions using both qualitative and
quantitative data. It scores or weights alternative courses of action based on the decision
makers’ judgments of the relative importance of the criteria and the extent to which they
are met by each alternative (Nydick and Hill, 1992). For this reason, it is introduced in
the portfolio purchasing model presented in this paper. On the use of the Kraljic (1983)
matrix in the determination of purchasing strategy, Gelderman and van Weele (2003)
state, “In-depth discussions on the positions in the matrix are considered as the most
important phase of the analysis. Strategic discussions provide deeper in-sights and may
lead more easily to consensus-based decisions.” The AHP can facilitate and encourage
such consensus reaching discussion as it makes the decision-making process very
transparent, highlighting misconceptions (Drake, 1998). As it synthesises the perspectives
of different people, counteracting the vested interests or restricted vision of individuals, it
provides the triangulation that is desired when dealing with qualitative data in particular.
3. Development of the purchasing portfolio model
3.1 The dimensions
The dimensions used for the portfolio model and the way in which they are
measured need to be defined. The authors propose the use of the ‘component value’
and ‘risk in the supply market’ dimensions. This section gives a justification for
these and a practical but justified way in which they can be measured. This
discourse is an important contribution as the dimensions and measures used are at
Page 11 of 65
http://mc.manuscriptcentral.com/tprs Email: [email protected]
International Journal of Production Research
123456789101112131415161718192021222324252627282930313233343536373839404142434445464748495051525354555657585960

For Peer Review O
nly
11
the core of the proposed approach to purchasing strategy formulation and
weaknesses identified in existing approaches are addressed.
Note, the application presented here concerns production-related items (raw materials and
components) used in manufacturing an end-product, i.e. strategic purchases. These have
different purchasing structures and strategies compared to non-production-related items
such as maintenance, repair and overhaul (MRO) items, i.e. non-strategic purchases
(Xideas and Moschuris, 1998).
It has been seen that the common form of a purchasing portfolio model has one
dimension related to the importance of a purchase and one related to the nature of the
supply. The importance of a purchase depends on the product in which it will reside; is
the purchase critical to the product’s quality, competitive stance and profitability? The
supply dimension is fundamentally concerned with risk assessment and here it is labelled
‘risk in the supply market’. It relates to the performance of the suppliers and factors
outside the control of the buyer. For example, a component that has only one supplier
who in turn is financially unstable is higher risk than a component that has numerous,
stable suppliers.
3.2 Measuring the ‘component value’ dimension
If purchasing strategy is to support business strategy, it follows that the importance of a
particular purchase is determined by the competitive priorities of the business. Hayes and
Wheelwright (1984) introduced the term “competitive priorities” and argued that
companies compete in the marketplace by virtue of one or more of the four, core
Page 12 of 65
http://mc.manuscriptcentral.com/tprs Email: [email protected]
International Journal of Production Research
123456789101112131415161718192021222324252627282930313233343536373839404142434445464748495051525354555657585960

For Peer Review O
nly
12
competitive priorities; cost, quality, delivery time and flexibility. Following their
research, there has been a consensus in the operations management literature that these
are the four main competitive priorities, for example see (Dangayach and Deshmukh,
2001) and (Krajewski and Ritzman, 2005). Any company, regardless of the industry in
which it operates, should improve its product quality and service (flexibility or
availability) and reduce lead times and cost simultaneously as illustrated in Figure 3
(Johansson et al., 1993), which portrays the calculation of the total value of the product to
the customer and gives insight into what is covered by each of the four priorities.
According to Krause et al.’s (2001) empirical research, purchasing's competitive
priorities are conceptualised as being similar to the competitive priorities in operations
management. Manufacturers use materials and components sourced from external
suppliers, so their products and customer service are affected significantly by the
performance of their suppliers in terms of cost, quality, time and availability (Krause and
Scannell, 2002). These four competitive priorities are measured on the basis of the
importance of the factors in Table 2 to the process of purchasing components. These
factors are adopted here in measuring the importance dimension, which is labelled
‘component value’ in line with Johansson et al. (1993), as the fundamental importance of
a component is determined by its contribution to the value of the product to the customer.
Note, in the literature the words service, flexibility and availability are effectively used
interchangeably and availability is used from hereon in this paper.
It has been argued that quality is the most important concern for strategic supplier
management (Chao and Scheuing, 1994). The assurance of an adequate supply of
Page 13 of 65
http://mc.manuscriptcentral.com/tprs Email: [email protected]
International Journal of Production Research
123456789101112131415161718192021222324252627282930313233343536373839404142434445464748495051525354555657585960

For Peer Review O
nly
13
materials and components is certainly one of the key elements of total quality
management (Gonzalez-Benito et al, 2003). The quality of purchased components is a
major determinant of the quality of the end-product (Gadde and Snehota, 2000). In this
paper, the importance of quality is measured on the basis of the importance of the
durability, reliability and innovation of the component. Quality is associated with
conformance to specifications and meeting the customers’ expectations (Dangayach and
Deshmukh, 2001)(Miltenburg, 2005)(Slack and Lewis, 2002) and durability and
reliability in particular must conform (Chan and Chan, 2004). In general, these two
measures are often used as measures of quality (Krause et al., 2001)(MacKenzie and
Hardy, 1996)(Park and Hartley, 2002)(Shin et al., 2000). Innovation is included as a
measure of quality as it can be central to achieving competitive advantage, and high
innovation in purchased components is often the quickest and easiest way to improve the
quality of the end-product (Burt, 1989). Pagell and Krause (2002) included innovation as
a separate, 5th
competitive priority. The method of analysis presented here could be
modified to do this, however, in the present analysis innovation is explicitly accounted
for within quality.
The importance of availability is measured on the basis of the importance of volume
flexibility, modification flexibility and technological capability. Volume flexibility
directly impacts customers’ perceptions by preventing out of stock conditions of products
when demand is suddenly high and modification flexibility is a value-adding attribute
that is immediately visible to the customer (Vickery et al., 1999). Modification flexibility
relates to the ability to meet the demands of high variety and personalised products. If the
purchasing function of a firm can manage effectively its supplier capabilities, the result
Page 14 of 65
http://mc.manuscriptcentral.com/tprs Email: [email protected]
International Journal of Production Research
123456789101112131415161718192021222324252627282930313233343536373839404142434445464748495051525354555657585960

For Peer Review O
nly
14
could be an increase in manufacturing flexibility (Clark, 1989) (Narasimhan and Das,
1999). Technological change is one of the principal factors of competition (Porter, 1985)
and new technologies present opportunities to enter into the market with a new product
(Christensen and Bower, 1996). For these reasons, the technological capability of
suppliers has received focal attention as a supplier selection criterion (Katsikeas et al.,
2004).
The importance of cost is measured on the basis of the importance of purchasing cost,
inventory cost and quality cost. Purchasing cost is clearly one of the fundamental
measures in assessing the importance of overall cost (Kraljic, 1983) (Olsen and Ellram,
1997). Inventory cost is important in the wider context of supply chain management
(Childerhouse and Towill, 2000). The quality of components has substantial implications
for cost (Bowersox et al., 2002). Purchasing high quality components reduces the
inventory cost (Nicholas, 1998) and production costs by eliminating rework, scrap and
inspection in manufacturing processes (Pitts and Lei, 2000). A firm can improve its cost
position by ensuring that the quality of purchased components meets its requirements
(Porter, 1985) and if the cost of inspection of purchased items is reduced, then the quality
cost is reduced (van Weele, 2005).
The importance of time is measured on the basis of the importance of delivery speed,
delivery reliability and development speed. These times can be crucial in determining the
success of a product (Christopher and Towill, 2000) and many businesses are gaining a
competitive advantage by purchasing from suppliers who offer a reduction in standard
delivery times (Lee and Billington, 1992).
Page 15 of 65
http://mc.manuscriptcentral.com/tprs Email: [email protected]
International Journal of Production Research
123456789101112131415161718192021222324252627282930313233343536373839404142434445464748495051525354555657585960

For Peer Review O
nly
15
As discussed earlier, to combine these measures to give an overall measure for
‘component value’ the AHP is used as described in Section 5. To achieve the aims and
objectives set by the business strategy one must focus on the strategic or competitive
priorities, i.e. that which contributes most, and ‘priority’ is a relative measure. This
means that ‘component value’ is a relative rather than absolute measure. For example, the
impact of a component on cost depends on its proportion of the overall cost of the end-
product, i.e. its costs relative to the cost of the other components. This makes the AHP
appropriate.
3.2 Measuring the ‘risk in the supply market’ dimension
However, ‘risk in the supply market’ is quite different. If a component fails to be
delivered then the final product cannot be completed. High risk purchases must be
managed accordingly, irrespective of whether other components are more or less risky.
Consider for example the number of suppliers; having only one or two suppliers is high
risk. However, having many suppliers is low risk. If two components had (say) 20 and
100 potential suppliers respectively, then both are low risk on an absolute basis. If a
relative view was taken, 20 is much smaller than 100 so would be classed, incorrectly, as
high risk. Therefore, the AHP is not appropriate, as the risk associated with an individual
component should be measured independently or directly. This difference between how
‘component value’ and ‘risk in the supply market’ are measured (relative versus absolute)
is important to appreciate as it results in different treatments in the model presented here.
Page 16 of 65
http://mc.manuscriptcentral.com/tprs Email: [email protected]
International Journal of Production Research
123456789101112131415161718192021222324252627282930313233343536373839404142434445464748495051525354555657585960

For Peer Review O
nly
16
The dimension of ‘risk in the supply market’ is based on the similar dimensions used by
Kraljic (1983) and Olsen and Ellram (1997). Kraljic used the following factors in
measuring the “complexity of the supply market”: availability; number of potential
suppliers; competitive demand; make-or-buy opportunities; storage risks; substitution
possibilities. Olsen and Ellram used three factors with seven sub-factors for measuring
“difficulty of the purchasing situation”: product characteristics (sub-factors: novelty and
complexity); supply market characteristics (sub-factors: suppliers' power, suppliers'
technical and commercial competence); environmental characteristics (sub-factors: risk
and uncertainty). These measures require the acquisition of data external to the business.
It is not easy to get all the required data for either of these sets of factors using a
business’s internal resources as much time and expense may be required. Rajagopal and
Sanchez (2005) argued that data is only available from the closest suppliers and even
when it is available, it can be incorrect due to reasons such as the commitment of the
supplier and the fundamental size and complexity of the task of data acquisition. It may
be particularly difficult for an SME to acquire accurate data from suppliers as SMEs do
not have the ‘power’ of large customers to command the attention of suppliers. In the
case study SMEs introduced in the following section, the staff reported that they certainly
did not have the data required. Furthermore, even though Olsen and Ellram used several
factors and sub-factors they still noted that the list was not comprehensive and it may
need to vary for individual businesses. It is reiterated that Moller et al. (2000) found
Olsen and Ellram’s model to be impractical because it is too elaborated. The argument
subscribed to in this paper is that the over elaboration of the measurement of this
dimension is neither immediately helpful nor practical.
Page 17 of 65
http://mc.manuscriptcentral.com/tprs Email: [email protected]
International Journal of Production Research
123456789101112131415161718192021222324252627282930313233343536373839404142434445464748495051525354555657585960

For Peer Review O
nly
17
It is proposed here that two simple factors can be used to assess ‘risk in the supply
market’. First, ‘size of supplier’ is a way of measuring the “supplier’s power” as used by
Olsen and Ellram, on the assumption that power is typically related to size. Larson et al.
(2005) argue that small firms are dependent and in less powerful negotiating
positions in supply chain management. A buyer should assess ‘size of supplier’
relative to its own size rather than in absolute terms, as it is the relative size that
fundamentally determines power. Second, the measure ‘monopoly conditions’ is used
to combine and simplify Olsen and Ellram’s use of “product characteristics” and
“environmental characteristics”. Looking at the sub-factors, if a purchase exhibits
“novelty” or “complexity” then it will typically be available from only one or very few
suppliers, which means that there are monopoly or at best oligopoly conditions creating
risk. The supply risk matrix in Figure 4 combines the two factors, ‘size of supplier’ and
‘monopoly conditions’ to score the ‘risk in the supply market’ in the range 1 to 9. As
with the AHP, the supply risk matrix converts the qualitative measurement of the factors
into a quantitative measurement or score to use with the purchasing portfolio model.
4. The Case Studies and Data Acquisition
Two South Korean, electric elevator manufacturers, Company-A and Company-B,
provide case studies. Their profiles are summarised in Table 3. As these are similar, the
companies provide a test to see how different or similar portfolio models may be
produced to meet the needs of ostensibly similar businesses.
An elevator is designed for a specific building, considering such factors as the height
of the building, the number of users on each floor and the expected usage periods.
Page 18 of 65
http://mc.manuscriptcentral.com/tprs Email: [email protected]
International Journal of Production Research
123456789101112131415161718192021222324252627282930313233343536373839404142434445464748495051525354555657585960

For Peer Review O
nly
18
The numbers of components varies with the number of stories and the complexity of
the design of the elevator. Customers provide functional requirements such as speed
and capacity, desired style options and the dimensions of the building. An
appropriate set of elevator components is specified and ordered from the component
suppliers. This is a high-variety, low-volume market in which competition is very
high. As the cost of in-house manufacturing of components is much higher than the
cost of outsourcing, elevator manufacturers focus on design, assembly, marketing
and sales and most in-house component manufacturing has ceased (van Weele,
2005). Discussions with several elevator manufacturers revealed that they spend
typically more than 70% of each sales dollar on purchased components, so they
should strive to improve not only availability but also to reduce costs. The key to
success in this industry is the ability to embrace both efficiency and customisation.
Elevator manufacturers are representative of many other manufacturers as they are
noticing the criticality of purchased components, supplier performance and,
therefore, purchasing strategy to competitiveness.
The data for the portfolio mapping exercise was gathered by questioning five of
Company-A’s staff who are involved directly or indirectly with component purchasing;
two from the purchasing department, one from engineering, one from manufacturing
operations and one from accounting. In Company-B only three staff were available for
questioning. They came from purchasing, manufacturing operations and accounting; but
the member of staff from manufacturing operations was responsible for the engineering
function also. These samples give coverage of different functions and therefore
perspectives. Nicholas (1998) referred to purchasing, manufacturing operations,
Page 19 of 65
http://mc.manuscriptcentral.com/tprs Email: [email protected]
International Journal of Production Research
123456789101112131415161718192021222324252627282930313233343536373839404142434445464748495051525354555657585960

For Peer Review O
nly
19
engineering and accounting as the four key functions to have represented in a supplier
selection team. Interviews with the staff required visits to the companies to gather data
‘face to face’. During each interview, the specific terminology of the decision criteria was
explained as necessary. Special care was taken to avoid the pitfall of using leading
questions when asking the staff for their evaluations.
5. Applying the AHP to measure the ‘component value’ dimension
The staff of Company-A and Company-B were the ‘evaluators’ for the purposes of the
AHP, which was implemented using the Expert Choice (2004) software. The AHP is
explained in detail by Saaty and Vargas (2001) and succinctly by Drake (1998). An
introduction in the context of purchasing strategy and the elevator application is given
here. In summary, it proceeds as follows:
i. Select the criteria and their sub-criteria (measures) according to which the
components are to be prioritized; these encapsulate the competitive priorities
of the business.
ii. Weight the relative importance of the criteria using pair-wise comparisons
based on a ‘1 to 9’ relative importance scale as described below.
iii. Weight the relative importance of the sub-criteria within each criterion using
pair-wise comparisons and the ‘1 to 9’ scale and multiply these weights by
their parent criterion weights to get overall sub-criterion weights.
iv. Score the impact of each component on each sub-criterion using the direct
rating scale described below and weight these scores using the sub-criterion
weights before summing to give an overall score for the component.
Page 20 of 65
http://mc.manuscriptcentral.com/tprs Email: [email protected]
International Journal of Production Research
123456789101112131415161718192021222324252627282930313233343536373839404142434445464748495051525354555657585960

For Peer Review O
nly
20
To structure the problem, the goal is placed at Level 1 of the AHP hierarchy, as shown in
Figure 5. The goal in this application is the ranking or scoring of each component’s
impact on the competitive priorities of the business. Level 2 of the hierarchy contains the
competitive priorities (ranking criteria) introduced above. Level 3 contains the sub-
criteria that are used to assess or ‘measure’ the criteria. The relative importance of the
competitive criteria and sub-criteria to the business and the parent criteria respectively are
rated using the basic AHP approach of pair-wise comparison. Level 4 of the hierarchy
contains the rating scale for assessing the impact of individual components of the elevator
on the sub-criteria. This is different from the usual AHP approach in that an absolute
measurement is assigned to each sub-criterion for each component to be purchased,
instead of pair-wise comparisons of the components on the basis of each sub-criterion.
This direct approach avoids the large number of pair-wise comparisons and has been used
in supplier selection (Chan and Chan, 2004)(Tam and Tummala, 2001). The last level of
the hierarchy consists of the components of the elevator’s bill of materials (BOM) to be
evaluated.
The nine-point scale in Table 4, suggested by Saaty and Vargas (2001), is used in making
the pair-wise comparisons of the criteria and sub-criteria. For example, if an evaluator
decides that quality is moderately more important than time, then the former is rated ‘3’
and the latter ‘1/3’ in this pair-wise comparison. Within each criterion, the sub-criteria are
compared pair-wise to establish their relative importance to their parent criterion. For
example, if component durability is considered absolutely (maximally) more important in
Page 21 of 65
http://mc.manuscriptcentral.com/tprs Email: [email protected]
International Journal of Production Research
123456789101112131415161718192021222324252627282930313233343536373839404142434445464748495051525354555657585960
For Peer Review O
nly
21
determining quality compared to component reliability, then it is rated ‘9’ and component
reliability ‘1/9’ in this pair-wise comparison. Matrices of pair-wise comparisons are
obtained by the completion of all the pair-wise comparisons. Table 5 gives the five
comparison matrices for Evaluator-1 for Company-A, one for the criteria and one for
each of the four groups of sub-criteria within the criteria.
There is the possibility of inconsistency in the pair-wise comparisons. For example, an
evaluator may rate quality as ‘7’ against cost, cost as ‘7’ against time and time as ‘7’
against quality. This is inconsistent as the first two ‘7’s imply that quality should be rated
more highly than time. To understand Saaty’s (1980) treatment of inconsistency, let aij
denote the comparison of criterion i against criterion j, the element of the comparison
matrix at row i, column j. A matrix is then called “consistent” if aik = aijajk, for all i, j, k.
Based on this, Saaty then shows that for a pair-wise comparison matrix of size (n x n) to
be “absolutely consistent”, it must have one positive eigenvalue λmax= n, while all other
eigenvalues equal zero. In the real world, human evaluators do not usually achieve
absolute consistency; so to be pragmatic Saaty introduces the consistency index (C.I.) to
measure the “closeness to absolute consistency”:
C.I. = (λmax – n) / (n -1) (1)
Having measured the closeness to absolute consistency, there is then a need to
interpret the level to determine if it is acceptable, i.e. sufficiently close enough to
zero. Saaty’s basis for making this decision starts with the premise that, if one has
little or no information about the factors being compared, then judgments will
appear to be random (Forman and Selly, 2001). Saaty then introduced the
consistency ratio (C.R.) to assess whether a matrix is sufficiently consistent or not. This is
Page 22 of 65
http://mc.manuscriptcentral.com/tprs Email: [email protected]
International Journal of Production Research
123456789101112131415161718192021222324252627282930313233343536373839404142434445464748495051525354555657585960

For Peer Review O
nly
22
the ratio of the C.I. to the random index R.I., which is the C.I. of a matrix of comparisons
generated randomly:
C.R. = C.I. / R.I. (2)
C.R.= 0 indicates perfect consistency because C.I. = 0, but this is not expected in
practise. C.R.=1 indicates C.I. = R.I., which would be achieved if judgments were
made at random rather than intelligently. The closeness of C.R. to 0, relative to the
range 0 to 1, is used as a measure of the degree of consistency. The rule of thumb
that is applied by Saaty and generally by others is that C.I. should be less than 10%
of R.I. to be acceptable, i.e. C.R. < 0.01, see for example (Forman and Selly, 2001)
(Bhattacharya et al, 2005).
The value of R.I. will increase with n. Random pair-wise comparisons have been
simulated to produce average random indices for different sized (n x n) matrices. In Saaty
and Vargas (2001), for n = 3 to 10 the R.I. values given are 0.52, 0.89, 1.11, 1.25, 1.35,
1.40, 1.45 and 1.49 respectively. So for n=3, C.R. should be <0.05 and for n=4 it should
be <0.09, applying the 10% criterion. Each pair-wise comparison matrix in Table 5 is
presented with its C.R. and these satisfy this consistency test. However, for another of
Company-A’s staff C.R.>0.09 for the (4x4) criterion comparison matrix, so his data was
removed from the analysis; this was the representative of the accounting department. C.R.
values very close to 0.05 for his (3x3) cost and time comparison matrices provide further
support for this decision.
Page 23 of 65
http://mc.manuscriptcentral.com/tprs Email: [email protected]
International Journal of Production Research
123456789101112131415161718192021222324252627282930313233343536373839404142434445464748495051525354555657585960

For Peer Review O
nly
23
As suggested by Saaty and Vargas (2001), the geometric mean (the nth
root of the product
of n items), rather than the arithmetic mean, is used to consolidate the pair-wise
comparison matrices of the individual evaluators. This yields the five ‘consensus
matrices’ in Table 6 for Company-A and Table 7 for Company-B. The next step is to
compute the ‘priority vectors’ to define the relative priorities of the criteria and sub-
criteria (the final columns of Tables 6 and 7). There are potentially many ways in which
this might be done. However, Saaty’s consistency principle that aik = aij.ajk and
subsequent argument for using the special case of the consistent matrix formed by
elements aij = wi/wj , where wi and wj are the elements of the priority weight vector
corresponding to criteria i and j (i.e. their priorities), leads to the following method that is
used here. In terms of matrix algebra, a priority vector is computed as the normalized,
principal (largest) eigenvector of the consensus matrix of pair-wise comparisons. The
calculation is complex and is normally executed using proprietary software. However,
there are simpler methods for calculating an approximate solution. For example,
normalize the ratings in a consensus matrix by dividing each entry in a column by
the sum of all the entries in that column, so that the entries in the column add up to
one, and then average these normalized weights across the rows to give an average
priority weight for each criterion. The normalization down the columns makes it
statistically sound to compare and average scores across the columns to give row
averages. Drake (1998) has provided a detailed demonstration of this algorithm and
it can be implemented readily in a spreadsheet.
The priority vectors in Tables 6 and 7 are used to produce the overall or global weights
for the sub-criteria in Table 8. The corresponding criterion and sub-criterion weights are
Page 24 of 65
http://mc.manuscriptcentral.com/tprs Email: [email protected]
International Journal of Production Research
123456789101112131415161718192021222324252627282930313233343536373839404142434445464748495051525354555657585960

For Peer Review O
nly
24
multiplied to give a global weight for each sub-criterion, so that the importance or weight
of a sub-criterion is measured by its importance to its parent criterion weighted by the
importance of the parent criterion to the business strategy. For example, looking at
Table 8, Company-A has generated a weight of 0.21 for quality when rating it
against the other criteria (availability, cost and time). Within quality, a weight of
0.51 has been assigned to component durability when rating it against component
reliability and component innovation. So the overall or global weight for component
durability is 0.21 x 0.51 = 0.11. This is the weight given to this sub-criterion relative
to all the sub-criteria across all the criteria and the sum of all such global sub-
criterion weights is then 1.
In the second stage, the evaluators used absolute measurement to rate the strength of the
impact of the individual elevator components on the sub-criteria using the five-point scale
(VH=very high; H=high; M=medium; L=low; VL=very low) suggested by Tam and
Tummala (2001). Table 9 gives the ratings of two example evaluators. Table 10 shows
the normalized weights calculated for the five-point scale using the AHP procedure
described above. Absolute or direct measurement is used because there would be an
intractable number of pair-wise comparisons to perform. There are 23 components to be
rated against the 12 measures in Table 2, resulting in 23C2 = 23!/2!(23-2)! = 253 pair-wise
comparisons for each of the 12 measures, giving a total of 253 x 12 = 3036 comparisons.
Absolute measurement reduces this to 23 x 12 = 276 direct measurements. This
difference would grow very rapidly with increases in numbers of components. Tam and
Tummala (2001) and Chan and Chan (2004) also used direct measurement for this reason.
Page 25 of 65
http://mc.manuscriptcentral.com/tprs Email: [email protected]
International Journal of Production Research
123456789101112131415161718192021222324252627282930313233343536373839404142434445464748495051525354555657585960

For Peer Review O
nly
25
For each component, the results obtained with the five-point rating scale are multiplied
by the global weights of the sub-criteria. This process is illustrated in Table 11 for the
control panel component for Evaluator-1 in Company-A. For example, the global
weight for component durability is 0.11 (from Table 8) and the impact of the control
panel on durability has been assessed as high, which equates to weight of 0.26 from
Table 10. So the score for control panel in respect of durability is 0.11 x 0.26 = 0.028.
The total score for each component is normalized by dividing by the sum of the total
scores across all the components, so that they sum to 1. Looking at Table 11, the total
score for the control panel is 0.028 + 0.019 + ….. + 0.002 = 0.242. The sum of the
total scores across all the components was calculated as 2.547. So the normalized
score for the control panel is 0.242/2.547 = 0.095. The normalized, total scores for each
component from each evaluator are then combined using the geometric mean to give the
results in the final two columns of Table 12.
As the AHP is based on the 1 to 9 weighting scale the ‘component value’ scores are
transformed onto this scale for consistency using Equation (3). The scaled scores are used
in positioning the components in the purchasing portfolio matrix.
Zi = 8 (yi – Min(y)) / (Max(y) – Min(y)) + 1 (3)
where:
Zi = transformed score of component i;
Page 26 of 65
http://mc.manuscriptcentral.com/tprs Email: [email protected]
International Journal of Production Research
123456789101112131415161718192021222324252627282930313233343536373839404142434445464748495051525354555657585960

For Peer Review O
nly
26
yi = normalised score of component i;
Min(y) = minimum normalised score across all components;
Max(y) = maximum normalised score across all components.
For example, for Company-A in Table 12 the mean score for the brake y1 = 0.051,
Min(y) = 0.021 and Max (y) = 0.097. So, the transformed score for the brake on the 1
to 9 scale is Z1 = 8 (0.051-0.021) / (0.097-0.021) + 1 = 4.16. This score is used as the
‘component value’ ordinate in Figure 6.
After scoring ‘component value’, the ‘risk in the supply market’ is scored by the
evaluators using the supply risk scoring matrix in Figure 4, giving the results in Table 13.
Finally, the components are positioned in the purchasing portfolio matrix using their
scores for ‘component value’ and ‘risk in the supply market’, as shown in Figure 6.
6. Analysis of results
The weights calculated for the competitive priorities are given in Tables 6 and 7 (final
column, rows 1-4) for Company-A and Company-B respectively. In the case of
Company-A, availability (0.39) is nearly twice as heavily weighted as quality (0.21) and
over four times more heavily weighted than time (0.09). Since this elevator manufacturer
has adopted the make-to-order (MTO) strategy, availability is naturally the supreme
competitive priority. Cost (0.31) is the second priority, which is justified as Company-A
spends more than 70% of each sales dollar on purchased materials and components.
Quality still maintains a significant weight for safety reasons; elevators are built to strict
Page 27 of 65
http://mc.manuscriptcentral.com/tprs Email: [email protected]
International Journal of Production Research
123456789101112131415161718192021222324252627282930313233343536373839404142434445464748495051525354555657585960

For Peer Review O
nly
27
quality standards such as ASME A17 for the U.S.A. and the EN 81 series for Europe.
Time has the lowest weight due to the overriding importance of availability and cost,
agreeing with Quayle’s (2003) survey, which found that the highest priority requirements
placed on suppliers by SMEs are pricing, quality and capability, while time to market and
procurement have lower importance.
Company-B’s results are strikingly similar to Company-A’s for availability and time,
underlining again the importance of availability to the MTO strategy. A difference seen is
that quality and cost are rated equally by Company-B, whereas Company-A rates cost
more highly. This difference is justified as Company-A targets the housing estate market,
which has a typical batch size of more than 10, whereas Company-B targets the market
for office buildings and flats, which has a typical batch size less than 5. Company-A’s
customers expect a quantity discount as they are ordering in large batches, so cost is a
higher priority.
The weightings of the sub-criteria within each competitive priority seen in Tables 6 and 7
(final column, rows 5-16) show remarkably strong agreement between the companies for
quality and fairly strong agreement for cost. For availability and time there is a larger
difference in the weightings between the companies. However, the ranking of the sub-
criterion weights within each competitive priority is consistent across the companies. The
conclusion drawn here is that there is a fairly high level of consistency between the
companies’ weighting and ranking of the sub-criteria.
Page 28 of 65
http://mc.manuscriptcentral.com/tprs Email: [email protected]
International Journal of Production Research
123456789101112131415161718192021222324252627282930313233343536373839404142434445464748495051525354555657585960

For Peer Review O
nly
28
The global weights for the sub-criteria, in Table 8, show consistency in the ranking of the
sub-criteria between the companies with only minor differences, but there are some
differences in their values. Most notably, Company-A yields higher global values for the
two biggest weights, modification flexibility and purchasing cost. As their parent criteria,
availability and cost respectively, are also more heavily weighted by Company-A, there is
the effect of multiplying ‘peak’ values, which amplifies differences.
The rating of the strength of the impact of the components on the competitive priority
measures (the sub-criteria) is given in Table 9 for two example components and two
evaluators from Company-A and Company-B respectively. Where there are differences
between their evaluations they are small. Analysing the data across all the evaluators, this
high level of consistency was observed in general.
Table 11 gives the total score for the impact of the control panel for Evaluator-1 in
Company-A. As discussed above, Company-A has high weights for modification
flexibility and purchasing cost. As Evaluator-1 considers the control panel to have a high
impact on these measures, it follows that the overall score for the control panel in respect
of these measures is high.
Figure 6 shows the final result, the positioning of the components within the purchasing
portfolio. Company-B has a large number of components in the low value, low risk, non-
critical items category, whereas Company-A has moved several of these further along the
‘risk in the supply market’ dimension into the bottleneck category. Company-B has
placed more components into the high levels of ‘component value’.
Page 29 of 65
http://mc.manuscriptcentral.com/tprs Email: [email protected]
International Journal of Production Research
123456789101112131415161718192021222324252627282930313233343536373839404142434445464748495051525354555657585960

For Peer Review O
nly
29
Company-A has a clear natural-break in its ‘risk in the supply market’ values in the
region of the middle value of 5. This is important because the use of this middle value as
the boundary between low and high has no real justification, whereas a natural-break in
the data is an intuitively more reasoned boundary between strategic groupings. Company-
A has two components just under 5 on the ‘component value’ scale, so there is not a
natural-break at 5. However, a natural-break does appear moving up the value scale
beyond 5 towards the position of the motor generator. Company-B has a natural-break in
its scores for ‘risk in the supply market’ and ‘component value’ in the region of 5. It is
also noted that the high scores for ‘component value’ break into two groups for both
companies – high and very high.
Due to the differences noted above, differences exist in the implied purchasing strategies.
Both companies have a large cluster of non-critical items to be managed accordingly.
Company-A also has several low-value components to be managed on the basis of high
‘risk in the supply market’, i.e. bottleneck items, whereas Company-B has only one such
item. Company-B has more components classified as clearly high value.
7. Recommendations to companies.
Company-A has many components with high ‘risk in the supply market’, so it should
focus on reducing this risk. For its many bottleneck items, it should develop supplier
control, use safety stocks and backup plans, and seek alternative suppliers. For the
strategic items it should ensure close relationships and frequent information exchange
with its suppliers, involving them in product and supply chain development. For its many
Page 30 of 65
http://mc.manuscriptcentral.com/tprs Email: [email protected]
International Journal of Production Research
123456789101112131415161718192021222324252627282930313233343536373839404142434445464748495051525354555657585960

For Peer Review O
nly
30
non-critical items it can continue with its underlying strategy of competing on price. This
can be done through efficient, low-cost transactions, product standardisation and
optimised inventory management. As Company-A has few components with high
‘component value’, it should consider more carefully which components have high
impact on achieving its competitive strategies in case some important impacts have been
underestimated.
As Company-B has many non-critical components, it has the opportunity to pursue lower
costs. It has been identified that Company-B attaches equally high weight to cost and
quality in its competitive priorities. However, the purchasing portfolio matrix is showing
that Company-B has a number of very high value components that need to be managed
for quality and a large number of non-critical components that need to be managed for
cost. This is what the equal importance of cost and quality mean, rather than every
component should be managed on the basis of high quality and cost. So whilst Company-
B should focus on close relationships with its suppliers of high value components to
achieve high quality, it should not ignore the opportunity to reduce the cost of its many
non-critical items by exploiting market-based supply. Generally, for its non-critical items
Company-B should aim to reduce transaction costs through efficient processing, product
standardisation and the optimisation of order volumes and inventory levels, whilst the
number of suppliers could be reduced through category management. Having seen
Company-A rate far more components as high ‘risk in the supply market’, Company-B
should consider whether it is being complacent in assessing its own risk as being lower or
reassure itself that its own risk is indeed lower.
Page 31 of 65
http://mc.manuscriptcentral.com/tprs Email: [email protected]
International Journal of Production Research
123456789101112131415161718192021222324252627282930313233343536373839404142434445464748495051525354555657585960

For Peer Review O
nly
31
8. Conclusion
The case for aligning purchasing strategy with business strategy has been argued.
Purchasing portfolio models have received great attention in both the academic and
business fields recently and the evidence suggests that they are effective tools for
developing differentiated purchasing strategies that are aligned with business strategy.
However, their application still has some limitations, so this paper has presented a
purchasing portfolio modelling approach to address some of these limitations.
Factors and their measures for defining competitive priorities in a tractable way have
been identified and justified. Further interpretation and justification of the dimensions of
Kraljic’s purchasing portfolio model have been provided, as well as their further
development into the pragmatic ‘component value’ and ‘risk in the supply market’
dimensions. The positioning of purchases on the ‘component value’ scale has been made
systematic by the application of the AHP to consolidate the qualitative measures of the
competitive priorities into a single quantitative measure of a component’s impact on the
value of the end-product. The positioning of purchases on the ‘risk in the supply market’
scale has been made simple by the use of the supply risk matrix which quantifies the risk
based on a qualitative assessment of ‘monopoly conditions’ and the ‘size of the supplier’.
As justified in the paper, measurement is direct for each purchased component in respect
of ‘risk in the supply market’ but relative to other components in respect of ‘component
value’. The use of methods based on the users’ qualitative judgments rather than hard,
quantitative data is of particular value to SMEs that lack the power and resource to
acquire the large quantity of quantitative data required, which may in any case lack
integrity.
Page 32 of 65
http://mc.manuscriptcentral.com/tprs Email: [email protected]
International Journal of Production Research
123456789101112131415161718192021222324252627282930313233343536373839404142434445464748495051525354555657585960

For Peer Review O
nly
32
The purchasing portfolio approach developed here has been applied to two South Korean
elevator manufacturers using face-to-face interviews with their staff. This has yielded
some notable differences in the positioning of their purchased components in the
purchasing portfolio matrix, even though these companies have ostensibly similar
situations. These differences have been analysed and related to the business strategies of
the companies so that recommendations have been made on the future purchasing
strategies of the companies. It is acknowledged that the approach presented should
now be tested, exercised and, if necessary, refined on more industrial case studies.
References
Ahone, P. and Salmi, A. (2003), “Portfolios in supply network management: An analysis
of a Finnish company in the electro technical industry”, Proceedings of the 19th IMP
Conference, Lugano, Switzerland.
Bartezzaghi, E. and Ronchi, S. (2004), “A portfolio approach in the e-purchasing of
materials”, Journal of Purchasing and Supply Management, 10(3), 117-126.
Bhattacharya, A, Sarkar, B. and Mukherjee, S. K. (2005), “Integrating AHP with
QFD for robot selection under requirement perspective”, International Journal of
Production Research, 43(17), 3671–3685.
Bensaou, M. (1999), “Portfolios of buyer-supplier relationships”, MIT Sloan
Management Review, 40(4), 35-44.
de Boer, L., Labro, E. and Morlacchi, P. (2001), “A review of methods supporting
supplier selection”, European Journal of Purchasing and Supply Management, 7(2), pp.
75-89.
Bowersox, D.J., Closs D.J., and Cooper M.B. (2002), Supply Chain Logistics
Management, McGraw-Hill, London.
Burt, D.N., (1989), “Managing product quality through strategic purchasing”, Sloan
Management Review, 30(1), pp. 39–47.
Cagliano, R. and Spina, G. (2002), “A comparison of practice-performance models
between small manufacturers and subcontractors”, International Journal of Operations
and Production Management, 22(12), 1367-1388.
Page 33 of 65
http://mc.manuscriptcentral.com/tprs Email: [email protected]
International Journal of Production Research
123456789101112131415161718192021222324252627282930313233343536373839404142434445464748495051525354555657585960

For Peer Review O
nly
33
Caniels, M.C.J. and Gelderman, C.J. (2007), “Power and interdependence in buyer
supplier relationships: A purchasing portfolio approach”, Industrial Marketing
Management, 34(2), 219-229.
Carr, A.S. and Pearson, J.N. (2002), “The impact of purchasing and supplier involvement
on strategic purchasing and its impact on firm's performance”, International Journal of
Operations and Production Management, 22(9), 1032-1053.
Chan, F.T.S. and Chan, H.J. (2004), “Development of the supplier selection model - a
case study in the advanced technology industry”, Journal of Engineering Manufacture,
218(12), 1807-1824.
Chao, C.N. and Scheuing, E.E. (1994), “Marketing services to professional purchasers”,
Journal of Strategic Marketing, 2(2), 155-162.
Chen, I.J. and Paulraj, A. (2004), “Understanding supply chain management: critical
research and a theoretical framework”, International Journal of Production Research,
42(1), 131-163.
Childerhouse, P. and Towill, D.R. (2000), “Engineering supply chains to match customer
requirements”, Logistics Information Management, 13(6), 337-345.
Christensen, C.M. and Bower, J.L. (1996), “Customer power, strategic investment, and
the failure of leading firms”, Strategic Management Journal, 17(3), 197-218.
Christopher, M. and Towill, D.R. (2000), “Supply chain migration from lean and
functional to agile and customised”, Supply Chain Management: An International
Journal, 5(4), 206-213.
Clark, K.B. (1989), “What strategy can do for technology”, Harvard Business Review,
67(6), 94-98.
Cox, A. and Watson, G. (2004), “Top tools: one hit wonders or lasting classics?”, Supply
Management, 4 November, 20-23.
Dangayach, G. and Deshmukh, S. (2001), “Manufacturing strategy: Literature review and
some issues”, International Journal of Operations and Production Management, 21(7),
884-932.
De Toni, A. and Nassimbeni, G. (1999), “Buyer–supplier operational practices, sourcing
policies and plant performances: results of an empirical research”, International Journal
of Production Research, 37 (3), 597–619.
Drake, P.R. (1998), “Using the analytic hierarchy process in engineering education”,
International Journal of Engineering Education, 14(3), 191-196.
Page 34 of 65
http://mc.manuscriptcentral.com/tprs Email: [email protected]
International Journal of Production Research
123456789101112131415161718192021222324252627282930313233343536373839404142434445464748495051525354555657585960

For Peer Review O
nly
34
Dubois, A. and Pedersen, A-C. (2002), “Why relationships do not fit into purchasing
portfolio models; a comparison between the portfolio and industrial network approaches”,
European Journal of Purchasing and Supply Management, 8(1), 35-42.
Expert Choice (2004), Expert Choice 11: Quick Start Guide and Tutorials, Expert Choice
Inc., Arlington.
Fiocca, R. (1982), “Account portfolio analysis for strategy development”, Industrial
Marketing Management, 11(1), 53-62.
Flores, B.E., Olson, D.L. and Dorai, V.K. (1992) “Management of multicriteria inventory
classification”, Mathematical and Computer Modelling, Vol. 16, No. 12, pp. 71-82.
Forman E.H. and Selly M. A. (2001), Decision by Objectives, World Scientific,
Singapore
Gadde, L. and Hakansson, H. (2001), Supply Network Strategies, John Wiley and Sons,
Chichester, England.
Gadde, L. and Snehota, I. (2000), “Making the most of supplier relationships”, Industrial
Marketing Management, 29(4), 305-316.
Gelderman, C.J. (2003), A portfolio approach to the development of differentiated
purchasing strategies. Eindhoven University of Technology, Eindhoven.
Gelderman, C.J. and van Weele, A.J. (2003), “Handling measurement issues and strategic
directions in Kraljic's purchasing portfolio model”, Journal of Purchasing and Supply
Management, 9(5), 207-216.
Gelderman, C.J. and van Weele, A.J. (2005), “Purchasing portfolio models: a critique and
update”, The Journal of Supply Chain Management, 41(3), 19-28.
Gonzalez-Benito, J., Martinez-Lorente, A.R. and Dale, B.G. (2003), “A study of the
purchasing management system with respect to total quality management”, Industrial
Marketing Management, 32(6), 443-454.
Hayes, R.H. and Wheelwright, S.C. (1984), Restoring our competitive edge: Competing
through manufacturing, John Wiley, New York.
Janda, S. and Seshadri, S. (2001), “The influence of purchasing strategies on
performance”, Journal of Business and Industrial Marketing, 16(4), 294-306.
Johansson, H.J., Mchugh, P., Pendlebury, A.J. and Wheeler III, W.A. (1993), Business
process reengineering, John Willey and Sons, Chichester, England.
Page 35 of 65
http://mc.manuscriptcentral.com/tprs Email: [email protected]
International Journal of Production Research
123456789101112131415161718192021222324252627282930313233343536373839404142434445464748495051525354555657585960

For Peer Review O
nly
35
Katsikeas, C.S., Paparoidamis, N.G. and Katsikea, E. (2004), “Supply source selection
criteria: the impact of supplier performance on distributor performance”, Industrial
Marketing Management, 33(8), 755-764.
Kibbeling, M.I. (2005), An explorative study into the role of culture in the buyer-supplier
relationship: a Dutch-French comparison of differentiated purchasing portfolio
strategies, Eindhoven University of Technology, Eindhoven.
Krajewski, L.J. and Ritzman, L.P. (2005), Operations management; Processes and value
chains, Prentice Hall, New Jersey.
Kraljic, P. (1983), “Purchasing must become supply management”, Harvard Business
Review, 61(5), 109-117.
Krause, D.R., Pagell, M. and Curkovic, S. (2001), “Toward a measure of competitive
priorities for purchasing”, Journal of Operations Management, 19(4), 497-512.
Krause, D.R. and Scannell, T.V. (2002), “Supplier development practices: product and
service based industry comparisons”, The Journal of Supply Chain Management, 38(2),
13-21.
Larson, P.D., Carr, P. and Dhariwal K.S. (2005), “SCM Involving Small Versus Large
Suppliers: Relational Exchange and Electronic Communication Media”, The Journal of
Supply Chain Management, 41(1), 18-29.
Lawson, B., Cousins, P.D., Handfield, R.B. and Petersen, K.J. (2008), “Strategic
purchasing, supply management practices and buyer performance improvement: an
empirical study of UK manufacturing organizations”, International Journal of
Production Research, 1–19, iFirst, DOI: 10.1080/00207540701694313
Lee, H.L. and Billington, C. (1992), “Managing supply chain inventory”, MIT Sloan
Management Review, 33(3), 65-73.
MacKenzie, H.F. and Hardy, K.G. (1996), “Manage your offering or manage your
relationship?”, Journal of Business and Industrial Marketing, 11(6). pp. 20-37.
Markowitz, H. (1952), “Portfolio Selection”, The Journal of Finance, 7(1), 77-91.
Metty, T., Harlan, R., Samelson, Q., Moore, T., Morris, T., Sorensen, R., Scheur, A.,
Raskina, O., Scheur, R., Kanner, J., Potts, K. and Robbins, J. (2005), “Reinventing the
supplier negotiation process at Motorola”, Interfaces, 35(1), 7-23.
Miltenburg, J. (2005), Manufacturing strategy: How to formulate and implement a
winning plan, Productivity Press, New York.
Page 36 of 65
http://mc.manuscriptcentral.com/tprs Email: [email protected]
International Journal of Production Research
123456789101112131415161718192021222324252627282930313233343536373839404142434445464748495051525354555657585960

For Peer Review O
nly
36
Moller, M., Momme J. and Johansen, J. (2000), “Supplier segmentation in theory and
practice – towards a competence perspective”, Proceedings of the 9th International
IPSERA Conference, London, Ontario, Canada, 24-27 May, 508-519.
Narasimhan, R. (1983). “An analytic approach to supplier selection”, Journal of
Purchasing and Materials Management, Vol. 19, pp. 27-32.
Narasimhan, R. and Das, A. (1999), “An empirical investigation of the contribution of
strategic sourcing to manufacturing flexibilities and performance”, Decision Sciences,
30(3), 683-718.
Nellore, R. and Soderquist, K. (2000), “Portfolio approaches to procurement analysing
the missing link to specifications”, Long Range Planning, 33(2), 245-267.
Ng, W.L. (2007), “A simple classifier for multiple criteria ABC analysis”, European
Journal of Operational Research, Vol. 177, No.1 , pp. 344-353.
Nicholas, J.M. (1998), Competitive manufacturing management: continuous
improvement, lean production, customer-focused quality, McGraw-Hill, London
Nydick, R.L. and Hill, R.P. (1992), “Using the analytic hierarchy process to structure the
supplier selection procedure”, International Journal of Purchasing and Materials
Management, 28(2), 31-36.
Olsen, R.F. and Ellram, L.M. (1997), “A portfolio approach to supplier relationships”,
Industrial Marketing Management, 26(2), 101-113.
Pagell, M. and Krause, D.R. (2002), “Strategic consensus in the internal supply chain:
exploring the manufacturing-purchasing link”, International Journal of Production
Research, 40(13), 3075-3092.
Parikh, M.A. and Joshi, K. (2005), “Purchasing process transformation: restructuring for
small purchases”, International Journal of Operations and Production Management,
25(11), 1042-1061.
Park, S. and Hartley, J.L. (2002), “Exploring the Effect of Supplier Management on
Performance in the Korean Automotive Supply Chain”, The Journal of Supply Chain
Management, 38(2), pp. 46-52.
Partovi, F.Y. and Anandarajan, M. (2002), “Classifying inventory using an artificial
neural network approach”, Computers and Industrial Engineering, Vol. 41, No. 4, pp.
389-404.
Pitts, R.A. and Lei, D. (2000), Strategic management: Building and sustaining
competitive advantage, 2nd
edition, South-Western College Publishing, Cincinnati, OH.
Porter, M.E. (1985), Competitive advantage: creating and sustaining superior
performance, Free Press, New York.
Page 37 of 65
http://mc.manuscriptcentral.com/tprs Email: [email protected]
International Journal of Production Research
123456789101112131415161718192021222324252627282930313233343536373839404142434445464748495051525354555657585960

For Peer Review O
nly
37
Pressey, A., Tzokas, N. and Winklhofer, H. (2007), “Strategic purchasing and the
evaluation of “problem” key supply relationships: what do key suppliers need to know?”,
Journal of Business and Industrial Marketing, 22(5), 282-294.
Quayle, M. (2002), “Purchasing in small firms”, European Journal of Purchasing and
Supply Management, 8(3), 151-159.
Quayle, M. (2003), “A study of supply chain management practice in UK industrial
SMEs”, Supply Chain Management: An International Journal, 8(1), pp. 79-86.
Rajagopal, S. and Sanchez, R. (2005), “Analysis of customer portfolio and relationship
management models: bridging managerial dimensions”, Journal of Business and
Industrial Marketing, 20(6), 307-316.
Saaty, T.L. (1980), The analytic hierarchy process: planning, priority setting, resource
allocation, McGraw-Hill, London.
Saaty T.L. and Vargas, L.G. (2001), Models, methods, concepts and applications of the
analytic hierarchy process, Boston, Kluwer Academic Publishers.
Sarkis, J. and Talluri, S. (2002), “A model for strategic supplier selection”, The Journal
of Supply Chain Management, 38(1), 18-28.
Shin, H., Collier, D.A. and Wilson, D.D. (2000), “Supply management orientation and
supplier/buyer performance”, Journal of Operations Management, 18(3), pp. 317-333.
Slack, N. and Lewis, M. (2002), Operations Strategy, Prentice Hall, UK.
Tam, M.C.Y. and Tummala, V.M.R. (2001), “An application of the AHP in vendor
selection of a telecommunication system”, Omega – The International Journal of
Management Science, 29(2), 171-182.
Vickery, S., Calantone, R. and Droge, C. (1999), “Supply chain flexibility: an empirical
study”, The Journal of Supply Chain Management, 35(3), 16-24.
Wagner, S.M. and Johnson, J.L. (2004), “Configuring and managing strategic supplier
portfolios”, Industrial Marketing Management, 33(8), 717–730.
Wasti, S.N., Kozan, M.K. and Kuman, A. (2006), “Buyer-supplier relationships in the
Turkish automotive industry”, International Journal of Operations and Production
Management, 26(9), 947-970.
Watts, C.A., Kim, Y.K. and Hahn, C. (1995), “Linking purchasing to corporate
competitive strategy”, International Journal of Purchasing and Materials Management,
31(2), 2-8.
Page 38 of 65
http://mc.manuscriptcentral.com/tprs Email: [email protected]
International Journal of Production Research
123456789101112131415161718192021222324252627282930313233343536373839404142434445464748495051525354555657585960

For Peer Review O
nly
38
van Weele, A.J. (2005), Purchasing and supply chain management; Analysis, strategy,
planning and practice, Thomson Learning, London.
Wynstra, F. and ten Pierick, E. (2000), “Managing supplier involvement in new product
development: A portfolio approach”, European Journal of Purchasing and Supply
Management, 6(1), 49-57.
Xideas, E. and Moschuris, S. (1998), “The influence of product type on the purchasing
structure”, European Journal of Marketing, 32(11/12), 974-992.
Zolkiewski, J.M. and Turnbull, P.W. (2000), “Relationship portfolios - past, present and
future”, Proceedings of the 16th Annual IMP Conference, Bath, UK.
Page 39 of 65
http://mc.manuscriptcentral.com/tprs Email: [email protected]
International Journal of Production Research
123456789101112131415161718192021222324252627282930313233343536373839404142434445464748495051525354555657585960

For Peer Review O
nly
39
Figure captions:
Figure 1: Kraljic’s Purchasing Portfolio Model
Figure 2: Bensaou’s Purchasing Portfolio Model
Figure 3: Calculating Value (Johansson et al., 1993)
Figure 4: Supply risk scoring matrix
Figure 5: AHP model for analysis of ‘component value’ for the elevator
manufacturer
Figure 6: Purchasing portfolio models for Company-A and Company-B
Table 1: Classification dimensions of purchasing portfolio models
Table 2: Factors influencing the ‘component value’
Table 3: Summary of companies’ profiles
Table 4: 1 to 9 scale for AHP preferences
Table 5: Pair-wise comparison matrices for Evaluator-1 for Company-A
Table 6: Geometric mean of pair-wise comparison matrices of all evaluators for
Company-A
Table 7: Geometric mean of pair-wise comparison matrices of all evaluators for
Company-B
Table 8: Combined criteria and sub-criteria weights in two elevator firms
Page 40 of 65
http://mc.manuscriptcentral.com/tprs Email: [email protected]
International Journal of Production Research
123456789101112131415161718192021222324252627282930313233343536373839404142434445464748495051525354555657585960

For Peer Review O
nly
40
Table 9: Absolute ratings given by Evaluator-1 of Company-A and Evaluator-1 of
Company B to some of the components
Table 10: Pair-wise comparison judgment matrix for five-point rating scale
Table 11: Calculation of overall score for the control panel component for
Evaluator-1 in Company-A
Table 12: Summary of normalized ‘component value’ scores
Table 13: Scores for ‘risk in the supply market’
Page 41 of 65
http://mc.manuscriptcentral.com/tprs Email: [email protected]
International Journal of Production Research
123456789101112131415161718192021222324252627282930313233343536373839404142434445464748495051525354555657585960

For Peer Review O
nly
Appendix
The Questionnaire
Part 1: Criteria and Sub-criteria; competitive priorities and their measures.
(1) Compare the criteria on a pair-wise basis, decide which is most important and circle the weight that
indicates how much more important it is.
Criteria Criteria
9 8 7 6 5 4 3 2 1 2 3 4 5 6 7 8 9 Availability
9 8 7 6 5 4 3 2 1 2 3 4 5 6 7 8 9 Cost Quality
9 8 7 6 5 4 3 2 1 2 3 4 5 6 7 8 9 Time
9 8 7 6 5 4 3 2 1 2 3 4 5 6 7 8 9 Cost
Availability
9 8 7 6 5 4 3 2 1 2 3 4 5 6 7 8 9 Time
Cost 9 8 7 6 5 4 3 2 1 2 3 4 5 6 7 8 9 Time
(2) Compare the sub-criteria for measuring quality on a pair-wise basis, decide which is most important
and circle the weight that indicates how much more important it is.
Sub-criteria Sub-criteria
9 8 7 6 5 4 3 2 1 2 3 4 5 6 7 8 9 Component
reliability Component
durability
9 8 7 6 5 4 3 2 1 2 3 4 5 6 7 8 9 Component
innovation
Component
reliability 9 8 7 6 5 4 3 2 1 2 3 4 5 6 7 8 9
Component
innovation
Equality Importance Importance
Equality Importance Importance
Page 42 of 65
http://mc.manuscriptcentral.com/tprs Email: [email protected]
International Journal of Production Research
123456789101112131415161718192021222324252627282930313233343536373839404142434445464748495051525354555657585960

For Peer Review O
nly
(3) Compare the sub-criteria for measuring availability on a pair-wise basis, decide which is most
important and circle the weight that indicates how much more important it is.
Sub-criteria Sub-criteria
9 8 7 6 5 4 3 2 1 2 3 4 5 6 7 8 9 Modification
flexibility Volume
flexibility
9 8 7 6 5 4 3 2 1 2 3 4 5 6 7 8 9 Technological
capability
Modification
flexibility 9 8 7 6 5 4 3 2 1 2 3 4 5 6 7 8 9
Technological
capability
(4) Compare the sub-criteria for measuring cost on a pair-wise basis, decide which is most important and
circle the weight that indicates how much more important it is.
Sub-criteria Sub-criteria
9 8 7 6 5 4 3 2 1 2 3 4 5 6 7 8 9 Inventory cost Purchasing cost
9 8 7 6 5 4 3 2 1 2 3 4 5 6 7 8 9 Quality cost
Inventory cost 9 8 7 6 5 4 3 2 1 2 3 4 5 6 7 8 9 Quality cost
(5) Compare the sub-criteria for measuring time on a pair-wise basis, decide which is most important and
circle the weight that indicates how much more important it is.
Sub-criteria Sub-criteria
9 8 7 6 5 4 3 2 1 2 3 4 5 6 7 8 9 Delivery
reliability Delivery speed
9 8 7 6 5 4 3 2 1 2 3 4 5 6 7 8 9 Development
speed
Delivery
reliability 9 8 7 6 5 4 3 2 1 2 3 4 5 6 7 8 9
Development
speed
Equality Importance Importance
Equality Importance Importance
Equality Importance Importance
Page 43 of 65
http://mc.manuscriptcentral.com/tprs Email: [email protected]
International Journal of Production Research
123456789101112131415161718192021222324252627282930313233343536373839404142434445464748495051525354555657585960

For Peer Review O
nly
Part 2: Component assessment to be completed for each component
(1) What is the name of component? _______________________________
Rate the impact of the component on the following measures of the competitive priorities:
(2) Quality
(2.1) Durability
_____Very High _____High _____Moderate _____Low _____Very Low
(2.2) Reliability
_____Very High _____High _____Moderate _____Low _____Very Low
(2.3) Innovation
_____Very High _____High _____Moderate _____Low _____Very Low
(3) Availability
(3.1) Volume flexibility
_____Very High _____High _____Moderate _____Low _____Very Low
(3.2) Modification flexibility
_____Very High _____High _____Moderate _____Low _____Very Low
(3.3) Technological capability
_____Very High _____High _____Moderate _____Low _____Very Low
(4) Cost
(4.1) Purchasing cost
_____Very High _____High _____Moderate _____Low _____Very Low
(4.2) Inventory cost
_____Very High _____High _____Moderate _____Low _____Very Low
(4.3) Quality cost
_____Very High _____High _____Moderate _____Low _____Very Low
(5) Time
(5.1) Delivery speed
_____Very High _____High _____Moderate _____Low _____Very Low
(5.2) Delivery reliability
_____Very High _____High _____Moderate _____Low _____Very Low
(5.3) Development speed
_____Very High _____High _____Moderate _____Low _____Very Low
Page 44 of 65
http://mc.manuscriptcentral.com/tprs Email: [email protected]
International Journal of Production Research
123456789101112131415161718192021222324252627282930313233343536373839404142434445464748495051525354555657585960

For Peer Review O
nly
(6) Supply Risk
(6.1) Circle the component’s position in the matrix below to score its ‘supply risk’.
Page 45 of 65
http://mc.manuscriptcentral.com/tprs Email: [email protected]
International Journal of Production Research
123456789101112131415161718192021222324252627282930313233343536373839404142434445464748495051525354555657585960

For Peer Review O
nly
1
Figure 1: Purchasing Portfolio Model Kraljic (1983)
Page 46 of 65
http://mc.manuscriptcentral.com/tprs Email: [email protected]
International Journal of Production Research
123456789101112131415161718192021222324252627282930313233343536373839404142434445464748495051525354555657585960

For Peer Review O
nly
1
Figure 3: Calculating Value (Johansson et al., 1993)
Page 47 of 65
http://mc.manuscriptcentral.com/tprs Email: [email protected]
International Journal of Production Research
123456789101112131415161718192021222324252627282930313233343536373839404142434445464748495051525354555657585960

For Peer Review O
nly
1
Figure 2: Purchasing Portfolio Model Bensaou (1999)
Page 48 of 65
http://mc.manuscriptcentral.com/tprs Email: [email protected]
International Journal of Production Research
123456789101112131415161718192021222324252627282930313233343536373839404142434445464748495051525354555657585960
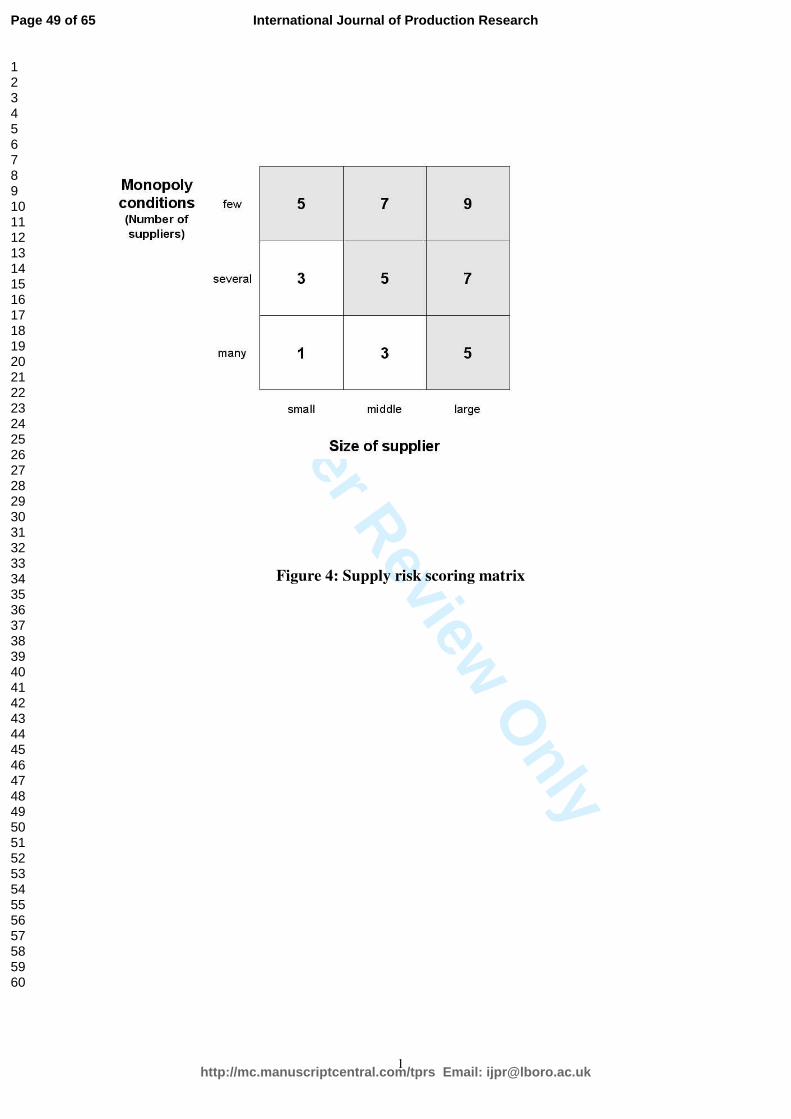
For Peer Review O
nly
1
Figure 4: Supply risk scoring matrix
Page 49 of 65
http://mc.manuscriptcentral.com/tprs Email: [email protected]
International Journal of Production Research
123456789101112131415161718192021222324252627282930313233343536373839404142434445464748495051525354555657585960

For Peer Review O
nly
1
Figure 5: AHP model for analysis of ‘component value’ for the elevator
manufacturer
Page 50 of 65
http://mc.manuscriptcentral.com/tprs Email: [email protected]
International Journal of Production Research
123456789101112131415161718192021222324252627282930313233343536373839404142434445464748495051525354555657585960

For Peer Review O
nly
1
Figure 6: Purchasing portfolio models for Company-A and Company-B
Page 51 of 65
http://mc.manuscriptcentral.com/tprs Email: [email protected]
International Journal of Production Research
123456789101112131415161718192021222324252627282930313233343536373839404142434445464748495051525354555657585960

For Peer Review O
nly
1
Classification dimensions Portfolio
models Internal factors External factors
Kraljic
(1983)
Importance of purchase
- volume purchased, percentage of total purchase cost, impact on product quality and business growth
Complexity of supply market
- availability, number of suppliers, competitive demand, make-or-buy opportunities, storage risks and substitution possibilities
Olsen and
Ellram
(1997)
Strategic importance of the purchase Competence factors
1. extent to which the purchase of the firm's core competencies
2. purchase improves knowledge of buying organization
3. purchase improves technological strength of buying organization
Economic factors
4. volume or monetary value of purchases
5. extent to which purchase is part of final product and value adding
6. extent to which purchase is part of a final product and profitable
7. criticality of purchase to get leverage with supplier for other purchases
Image factors
8. supplier critical image/brand name 9. potential environmental/safety
concerns
Difficulty of the purchasing situation Product characteristics
10. novelty 11. complexity
Supply market characteristics
12. suppliers' power 13. suppliers' technical and commercial
competence Environmental characteristics
14. risk 15. uncertainty
Bensaou
(1999)
Buyer’s specific investments Tangible investments
- buildings, tooling, equipment Intangible investments
- people, time, effort, best practice, knowledge
Supplier’s specific investments Tangible investments
- plant or warehouse location or layout, specialized facilities, dies
Intangible investments
- sending guest engineers, developing information systems
Table 1: Classification dimensions of purchasing portfolio models
Page 52 of 65
http://mc.manuscriptcentral.com/tprs Email: [email protected]
International Journal of Production Research
123456789101112131415161718192021222324252627282930313233343536373839404142434445464748495051525354555657585960

For Peer Review O
nly
1
Quality factors
1. Component durability
2. Component reliability
3. Component innovation
Availability factors
1. Volume flexibility
2. Modification flexibility
3. Technological capability
Cost factors
1. Purchasing cost
2. Inventory cost
3. Quality cost
Time 1. Delivery speed
2. Delivery reliability
3. Development speed
Table 2: Factors influencing the ‘component value’
Page 53 of 65
http://mc.manuscriptcentral.com/tprs Email: [email protected]
International Journal of Production Research
123456789101112131415161718192021222324252627282930313233343536373839404142434445464748495051525354555657585960

For Peer Review O
nly
1
Company A Company B
Number of
employees 53 47
Turnover (2005) £5M £4.5M
Product demand Unpredictable
Product life cycle 1 year to 2 years
Profit margin on
individual orders 20% to 50%
Product variety >100 variants
Business strategy Differentiation
Manufacturing
strategy Make to order (MTO)
Table 3: Summary of companies’ profiles
Page 54 of 65
http://mc.manuscriptcentral.com/tprs Email: [email protected]
International Journal of Production Research
123456789101112131415161718192021222324252627282930313233343536373839404142434445464748495051525354555657585960

For Peer Review O
nly
1
Intensity of
importance Definition Explanation
1 Equal importance Two criteria contribute equally to the objective
3 Moderate importance Experience and judgement slightly favour one over
another
5 Strong importance Experience and judgement strongly favour one over
another
7 Very strong
importance
A criterion is strongly favoured and its dominance is
demonstrated in practice
9 Absolute importance Importance of one over another affirmed on the highest
possible order
2, 4, 6, 8 Intermediate values Used to represent compromise between the priorities
listed above
Reciprocals of
above non-zero
numbers
If criterion i has one of the above non-zero numbers assigned to it when compared
with criterion j, then j has the reciprocal value when compared with i
Table 4: 1 to 9 scale for AHP preferences
Page 55 of 65
http://mc.manuscriptcentral.com/tprs Email: [email protected]
International Journal of Production Research
123456789101112131415161718192021222324252627282930313233343536373839404142434445464748495051525354555657585960

For Peer Review O
nly
1
Competitive
Priority Quality Availability Cost Time
Quality 1 1/2 1/2 2
Availability 2 1 2 3
Cost 2 1/2 1 2
Time 1/2 1/3 1/2 1
Consistency Ratio C.R. = 0.03
Quality Component
durability
Component
reliability
Component
innovation
Component durability 1 2 5
Component reliability 1/2 1 3
Component innovation 1/5 1/3 1
C.R.=0.00
Availability Volume
flexibility
Modification
flexibility
Technological
capability
Volume flexibility 1 1/5 1/3
Modification flexibility 5 1 2
Technological capability 3 1/2 1
C.R.=0.00
Cost Purchasing
cost
Inventory
cost
Quality
cost
Purchasing cost 1 7 4
Inventory cost 1/7 1 1/2
Quality cost 1/4 2 1
C.R.=0.00
Time Delivery
speed
Delivery
reliability
Development
speed
Delivery speed 1 1/2 3
Delivery reliability 2 1 8
Development speed 1/3 1/8 1
C.R.=0.01
Table 5: Pair-wise comparison matrices for Evaluator-1 for Company-A
Page 56 of 65
http://mc.manuscriptcentral.com/tprs Email: [email protected]
International Journal of Production Research
123456789101112131415161718192021222324252627282930313233343536373839404142434445464748495051525354555657585960

For Peer Review O
nly
1
Competitive
Priority Quality Availability Cost Time
Priority
weight
Quality 1 0.5 0.5 2.9 0.21
Availability 2.1 1 1.4 3.5 0.39
Cost 1.9 0.7 1 3.1 0.31
Time 0.3 0.3 0.3 1 0.09
C.R.=0.02
Quality Component
durability
Component
reliability
Component
innovation
Priority
weight
Component durability 1 1.4 3.9 0.51
Component reliability 0.7 1 2.7 0.36
Component innovation 0.3 0.4 1 0.13
C.R. = 0.00
Availability Volume
flexibility
Modification
flexibility
Technological
capability
Priority
weight
Volume flexibility 1 0.3 0.5 0.14
Modification flexibility 3.9 1 2.4 0.59
Technological capability 2.2 0.4 1 0.27
C.R. = 0.01
Cost Purchasing
cost
Inventory
cost
Quality
cost
Priority
weight
Purchasing cost 1 5.9 3.7 0.69
Inventory cost 0.2 1 0.5 0.11
Quality cost 0.3 2.0 1 0.20
C.R. = 0.01
Time Delivery
speed
Delivery
reliability
Development
speed
Priority
weight
Delivery speed 1 0.5 3.0 0.31
Delivery reliability 1.9 1 6.3 0.59
Development speed 0.3 0.2 1 0.10
C.R. = 0.00
Table 6: Geometric mean of pair-wise comparison matrices of all evaluators for
Company-A
Page 57 of 65
http://mc.manuscriptcentral.com/tprs Email: [email protected]
International Journal of Production Research
123456789101112131415161718192021222324252627282930313233343536373839404142434445464748495051525354555657585960

For Peer Review O
nly
1
Competitive
Priority Quality Cost Availability Time
Priority
weight
Quality 1 0.6 1.0 2.6 0.26
Availability 1.6 1 1.6 2.9 0.37
Cost 1.0 0.6 1 2.6 0.26
Time 0.4 0.3 0.4 1 0.11
C.R.=0.01
Quality Component
durability
Component
reliability
Component
innovation
Priority
weight
Component durability 1 1.6 3.3 0.51
Component reliability 0.6 1 2.6 0.35
Component innovation 0.3 0.4 1 0.14
C.R.=0.01
Availability Volume
flexibility
Modification
flexibility
Technological
capability
Priority
weight
Volume flexibility 1 0.4 0.5 0.19
Modification flexibility 2.3 1 1.3 0.45
Technological capability 2.0 0.8 1 0.36
C.R.=0.00
Cost Purchasing
cost
Inventory
cost
Quality
cost
Priority
weight
Purchasing cost 1 6.2 2.6 0.64
Inventory cost 0.2 1 0.3 0.09
Quality cost 0.4 3.1 1 0.27
C.R.=0.01
Time Delivery
speed
Delivery
reliability
Development
speed
Priority
weight
Delivery speed 1 0.8 2.6 0.39
Delivery reliability 1.3 1 2.9 0.46
Development speed 0.4 0.3 1 0.15
C.R.=0.00
Table 7: Geometric mean of pair-wise comparison matrices of all evaluators for
Company-B
Page 58 of 65
http://mc.manuscriptcentral.com/tprs Email: [email protected]
International Journal of Production Research
123456789101112131415161718192021222324252627282930313233343536373839404142434445464748495051525354555657585960

For Peer Review O
nly
1
Company Competitive
priority
Local
weight
Competitive priority
measures
Local
weight
Global
weight
Rank
Quality 0.21 Component durability 0.51 0.11 3=
Component reliability 0.36 0.07 5
Component innovation 0.13 0.03 9=
Availability 0.39 Volume flexibility 0.14 0.05 8
Modification flexibility 0.59 0.23 1
Technological capability 0.27 0.11 3=
Cost 0.31 Purchasing cost 0.69 0.21 2
Inventory cost 0.11 0.03 9=
Quality cost 0.20 0.06 6=
Time 0.09 Delivery speed 0.31 0.03 9=
Delivery reliability 0.59 0.06 6=
Development speed 0.10 0.01 12
Company-A
Total 1.00 Total 1.00
Quality 0.26 Component durability 0.51 0.13 3=
Component reliability 0.35 0.09 5
Component innovation 0.14 0.04 9=
Availability 0.37 Volume flexibility 0.19 0.07 6=
Modification flexibility 0.45 0.17 1=
Technological capability 0.36 0.13 3=
Cost 0.26 Purchasing cost 0.64 0.17 1=
Inventory cost 0.09 0.02 11=
Quality cost 0.27 0.07 6=
Time 0.11 Delivery speed 0.39 0.04 9=
Delivery reliability 0.46 0.05 8
Development speed 0.15 0.02 11=
Company-B
Total 1.00 Total 1.00
Table 8: Combined criteria and sub-criteria weights in two elevator firms
Page 59 of 65
http://mc.manuscriptcentral.com/tprs Email: [email protected]
International Journal of Production Research
123456789101112131415161718192021222324252627282930313233343536373839404142434445464748495051525354555657585960

For Peer Review O
nly
1
Company-A Evaluator-1
Company-B Evaluator-1
Competitive
priority
Component
Competitive
priority measures Control panel Governor Control
panel Governor
Quality Component durability H H H H
Component reliability H H H H
Component innovation VH H VH H
Availability Volume flexibility L M L M
Modification flexibility H M H M
Technological capability H H H H
Cost Purchasing cost H L VH M
Inventory cost VL VL VL VL
Quality cost M L M L
Time Delivery speed H M H H
Delivery reliability H M H H
Development speed H L H M
VH=very high; H=high; M=medium; L=low; VL=very low
Table 9: Absolute ratings given by Evaluator-1 of Company-A and Evaluator-1 of
Company B to some of the components
Page 60 of 65
http://mc.manuscriptcentral.com/tprs Email: [email protected]
International Journal of Production Research
123456789101112131415161718192021222324252627282930313233343536373839404142434445464748495051525354555657585960

For Peer Review O
nly
1
Rating scale VH H M L VL Priority weight
Very high (VH) 1 3 5 7 9 0.51
High (H) 1/3 1 3 5 7 0.26
Moderate (M) 1/5 1/3 1 3 5 0.13
Low (L) 1/7 1/5 1/3 1 3 0.06
Very low (VL) 1/9 1/7 1/5 1/3 1 0.04
Table 10: Pair-wise comparison judgment matrix for five-point rating scale
Page 61 of 65
http://mc.manuscriptcentral.com/tprs Email: [email protected]
International Journal of Production Research
123456789101112131415161718192021222324252627282930313233343536373839404142434445464748495051525354555657585960
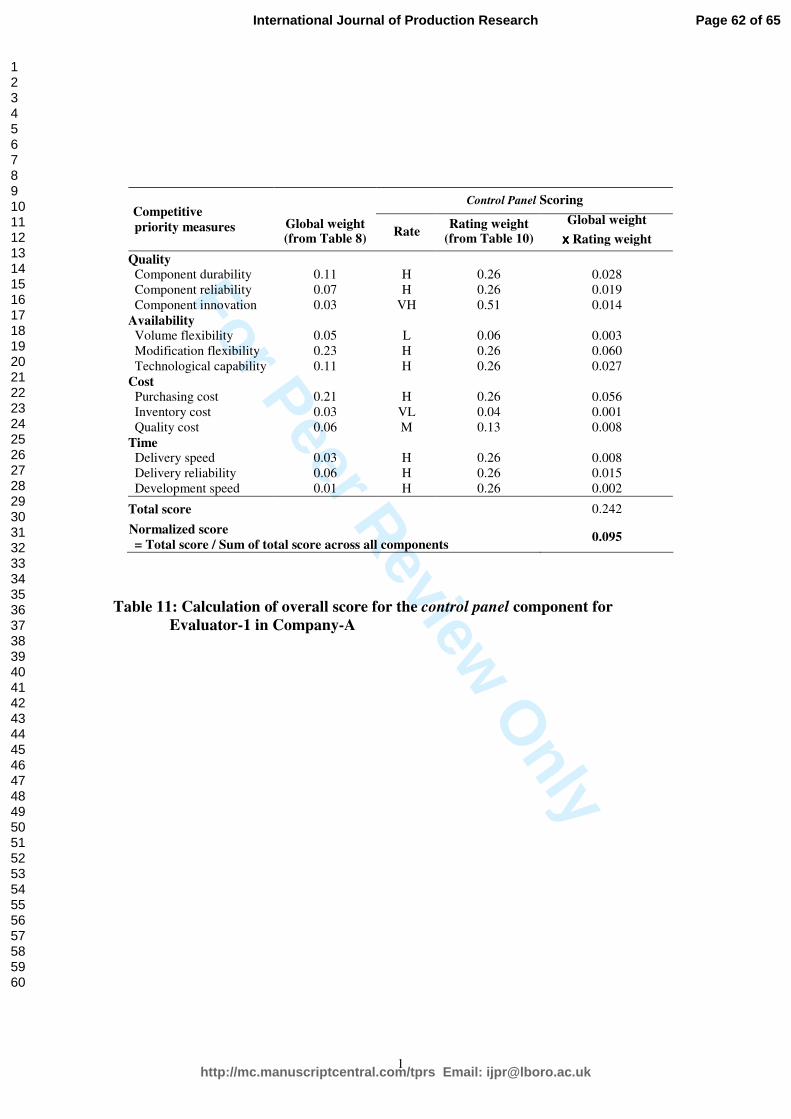
For Peer Review O
nly
1
Control Panel Scoring Competitive
priority measures Global weight (from Table 8)
Rate Rating weight
(from Table 10)
Global weight
xxxx Rating weight
Quality Component durability
0.11
H
0.26 0.028
Component reliability 0.07 H 0.26 0.019
Component innovation 0.03 VH 0.51 0.014
Availability Volume flexibility
0.05
L
0.06 0.003
Modification flexibility 0.23 H 0.26 0.060
Technological capability 0.11 H 0.26 0.027
Cost Purchasing cost
0.21
H
0.26 0.056
Inventory cost 0.03 VL 0.04 0.001
Quality cost 0.06 M 0.13 0.008
Time Delivery speed
0.03
H
0.26 0.008
Delivery reliability 0.06 H 0.26 0.015
Development speed 0.01 H 0.26 0.002
Total score 0.242
Normalized score
= Total score / Sum of total score across all components 0.095
Table 11: Calculation of overall score for the control panel component for
Evaluator-1 in Company-A
Page 62 of 65
http://mc.manuscriptcentral.com/tprs Email: [email protected]
International Journal of Production Research
123456789101112131415161718192021222324252627282930313233343536373839404142434445464748495051525354555657585960

For Peer Review O
nly
1
Company-A
Component Evaluator-1
Score
Evaluator-2
Score
Evaluator-3
Score
Evaluator-4
Score
Mean
Score
Company-B
Mean
Score
Brake 0.049 0.047 0.051 0.058 0.051 0.064
Buffers 0.024 0.019 0.018 0.025 0.021 0.024
Car Set 0.110 0.098 0.083 0.101 0.097 0.085
Compensating Chain 0.028 0.025 0.028 0.036 0.029 0.026
Control Panel 0.095 0.089 0.093 0.087 0.092 0.086
Counterweights 0.025 0.022 0.022 0.024 0.023 0.025
Door Operator 0.044 0.053 0.043 0.045 0.047 0.045
Door Safety Device 0.041 0.041 0.040 0.037 0.040 0.039
Governor 0.054 0.052 0.059 0.057 0.055 0.059
Guide Rails 0.043 0.050 0.035 0.045 0.043 0.041
Guide Shoes 0.026 0.029 0.026 0.028 0.027 0.027
Interlock Device 0.040 0.036 0.038 0.035 0.038 0.038
Limit Switch 0.025 0.029 0.026 0.027 0.027 0.027
Load Weighing Devices 0.023 0.031 0.025 0.026 0.026 0.025
Motor Generator 0.066 0.058 0.087 0.064 0.069 0.081
Operation Fixtures 0.059 0.053 0.059 0.061 0.057 0.061
Rail Brackets 0.024 0.029 0.026 0.027 0.026 0.027
Roller Guides 0.024 0.029 0.026 0.026 0.026 0.027
Rope Brake 0.029 0.033 0.026 0.028 0.029 0.029
Ropes 0.038 0.054 0.044 0.037 0.043 0.042
Safety Gear 0.025 0.029 0.026 0.027 0.027 0.027
Traction Machine 0.079 0.071 0.093 0.068 0.078 0.081
Travelling Cables 0.028 0.025 0.028 0.030 0.028 0.031
Total 1.00 1.00 1.00 1.00 1.000 1.000
Table 12: Summary of normalized ‘component value’ scores
Page 63 of 65
http://mc.manuscriptcentral.com/tprs Email: [email protected]
International Journal of Production Research
123456789101112131415161718192021222324252627282930313233343536373839404142434445464748495051525354555657585960

For Peer Review O
nly
1
Company-A
Component Evaluator-1
Score
Evaluator-2
Score
Evaluator-3
Score
Evaluator-4
Score
Mean
Score
Company-B
Mean
Score
Car set 1 1 3 1 1.3 1.0
Control panel 7 9 7 7 7.5 7.6
Traction machine 7 7 7 9 7.5 6.8
Motor generator 3 3 3 5 3.4 4.2
Operation fixtures 5 3 5 3 3.9 3.6
Governor 5 5 5 7 5.4 4.2
Brake 7 7 7 9 7.5 7.6
Door operator 5 5 5 7 5.4 4.2
Guide Rails 5 5 3 3 3.9 3.6
Ropes 5 5 3 3 3.9 3.6
Door Safety Device 5 5 5 7 5.4 4.2
Interlock Device 5 5 5 7 5.4 4.2
Rope Brake 5 5 5 7 5.4 4.2
Compensating Chain 5 3 3 5 3.9 3.6
Guide Shoes 3 3 3 3 3.0 3.0
Travelling Cables 5 3 3 5 3.9 2.5
Limit Switch 5 5 5 7 5.4 4.2
Load Weighing Devices 3 3 3 3 3.0 3.6
Rail Brackets 3 1 3 1 1.7 1.0
Roller Guides 3 1 3 5 2.6 2.1
Safety Gear 7 7 7 7 7.0 5.6
Counterweights 3 3 3 3 3.0 2.1
Buffers 3 1 3 3 2.3 1.0
9=very high; 7=high; 5=medium; 3=low; 1=very low
Table 13: Scores for ‘risk in the supply market’
Page 64 of 65
http://mc.manuscriptcentral.com/tprs Email: [email protected]
International Journal of Production Research
123456789101112131415161718192021222324252627282930313233343536373839404142434445464748495051525354555657585960

For Peer Review O
nly
1
Figure 2: Purchasing Portfolio Model Bensaou (1999)
Page 65 of 65
http://mc.manuscriptcentral.com/tprs Email: [email protected]
International Journal of Production Research
123456789101112131415161718192021222324252627282930313233343536373839404142434445464748495051525354555657585960