A portable fluorescence detector for fast ultra trace...
9
A portable fluorescence detector for fast ultra trace detection of explosive vapors Yunhong Xin, Gang He, Qi Wang, and Yu Fang Citation: Rev. Sci. Instrum. 82, 103102 (2011); doi: 10.1063/1.3642661 View online: http://dx.doi.org/10.1063/1.3642661 View Table of Contents: http://rsi.aip.org/resource/1/RSINAK/v82/i10 Published by the American Institute of Physics. Related Articles Communication: Quantitative estimate of the water surface pH using heterodyne-detected electronic sum frequency generation J. Chem. Phys. 137, 151101 (2012) Surface plasmon enhanced broadband spectrophotometry on black silver substrates Appl. Phys. Lett. 98, 241904 (2011) A colorimetric receptor combined with a microcantilever sensor for explosive vapor detection Appl. Phys. Lett. 98, 123501 (2011) Characterization of a fast gas analyzer based on Raman scattering for the analysis of synthesis gas Rev. Sci. Instrum. 81, 125104 (2010) Photolysis of solid NH3 and NH3–H2O mixtures at 193 nm J. Chem. Phys. 133, 214506 (2010) Additional information on Rev. Sci. Instrum. Journal Homepage: http://rsi.aip.org Journal Information: http://rsi.aip.org/about/about_the_journal Top downloads: http://rsi.aip.org/features/most_downloaded Information for Authors: http://rsi.aip.org/authors Downloaded 26 Nov 2012 to 202.117.145.246. Redistribution subject to AIP license or copyright; see http://rsi.aip.org/about/rights_and_permissions
Transcript of A portable fluorescence detector for fast ultra trace...

A portable fluorescence detector for fast ultra trace detection of explosivevaporsYunhong Xin, Gang He, Qi Wang, and Yu Fang Citation: Rev. Sci. Instrum. 82, 103102 (2011); doi: 10.1063/1.3642661 View online: http://dx.doi.org/10.1063/1.3642661 View Table of Contents: http://rsi.aip.org/resource/1/RSINAK/v82/i10 Published by the American Institute of Physics. Related ArticlesCommunication: Quantitative estimate of the water surface pH using heterodyne-detected electronic sumfrequency generation J. Chem. Phys. 137, 151101 (2012) Surface plasmon enhanced broadband spectrophotometry on black silver substrates Appl. Phys. Lett. 98, 241904 (2011) A colorimetric receptor combined with a microcantilever sensor for explosive vapor detection Appl. Phys. Lett. 98, 123501 (2011) Characterization of a fast gas analyzer based on Raman scattering for the analysis of synthesis gas Rev. Sci. Instrum. 81, 125104 (2010) Photolysis of solid NH3 and NH3–H2O mixtures at 193 nm J. Chem. Phys. 133, 214506 (2010) Additional information on Rev. Sci. Instrum.Journal Homepage: http://rsi.aip.org Journal Information: http://rsi.aip.org/about/about_the_journal Top downloads: http://rsi.aip.org/features/most_downloaded Information for Authors: http://rsi.aip.org/authors
Downloaded 26 Nov 2012 to 202.117.145.246. Redistribution subject to AIP license or copyright; see http://rsi.aip.org/about/rights_and_permissions

REVIEW OF SCIENTIFIC INSTRUMENTS 82, 103102 (2011)
A portable fluorescence detector for fast ultra trace detectionof explosive vapors
Yunhong Xin,1,a) Gang He,2 Qi Wang,1 and Yu Fang2,a)
1School of Physics and Information Technology, Shaanxi Normal University, Xi’an 710062,People’s Republic of China2Key Laboratory of Applied Surface and Colloid Chemistry, Ministry of Education, School of Chemistry andMaterials Science, Shaanxi Normal University, Xi’an 710062, People’s Republic of China
(Received 4 May 2011; accepted 2 September 2011; published online 4 October 2011)
This paper developed a portable detector based on a specific material-based fluorescent sensing filmfor an ultra trace detection of explosives, such as 2,4,6-trinitrotoluene (TNT) or its derivate 2,4-dinitrotoluene (DNT), in ambient air or on objects tainted by explosives. The fluorescent sensing filmsare based on single-layer chemistry and the signal amplification effect of conjugated polymers, whichexhibited higher sensitivity and shorter response time to TNT or DNT at their vapor pressures. Dueto application of the light emitting diode and the solid state photomultiplier and the cross-correlation-based circuit design technology, the device has the advantages of low-power, low-cost, small size, andan improved signal to noise ratio. The results of the experiments showed that the detector can real-time detect and identify of explosive vapors at extremely low levels; it is suitable for the identificationof suspect luggage, forensic analyses, or battlefields clearing. © 2011 American Institute of Physics.[doi:10.1063/1.3642661]
I. INTRODUCTION
During the past 10 years, violence of terrorist bombings,with the most alarming increase in number, has made thetask of standoff detection of improvised explosive devices ex-tremely urgent. Yet, because of the variety of explosive mate-rials available, cleverness of packaging, variability of venue,and the (mostly) low vapor pressures of explosives, the taskof detection is extremely difficult. There already exist vari-ous valid technologies for the analysis of explosives: high-performance liquid chromatography, electrochemical detec-tion, gas chromatography/mass spectroscopy (GC/MS), IR,x-ray imaging , NMR, and ion mobility spectrometry.1 How-ever, because of the cost, the portability, and the com-plexity, these methods are unfit for on-site monitoringdevices.
As a result, much interest has been focused on the devel-opment of portable, low-cost, and more reliable detection de-vices. First of all, the sensor is the critical component for de-veloping the detectors. Up to now, a wide variety of chemicalsensors have been developed based on various transductions.Although mass sensors have suitable detection properties, inmost cases they fail to detect explosives with very low vaporpressures. Optical devices based on immune sensors exhibithigh selectivity, thanks to the specific reaction of antibodieswith explosive molecules.2, 3 The enzyme-linked immunosor-bent assays (ELISAs) device exhibits a detection sensitivityof 1–15 ng/ml of TNT, in 5 h.4 This technique is dedicated tothe detection of explosives in a liquid matrix. Despite theseadvances, there is currently a strong demand for explosivesvapor sensors that are more suitable for the inspection oflandmine detection, forensic analysis, and suspicious luggage.
a)Authors to whom correspondence should be addressed. Electronic ad-dresses: [email protected] and [email protected].
Recently, the fluorescent sensing films for detection of TNThave received a great deal of attention. Caron et al.5 devel-oped a system for the detection of nitroaromatic explosivesconsisting of a portable detector based on a specific fluores-cent material. The system was able to perform an ultra tracedetection of explosives, such as TNT or its derivate DNT, inambient air or on objects tainted by explosives. However, itsresponse speed is very slow and it will take many minutes foran efficient test. Swager and co-workers6–11 have continuedto advance the ability of semiconductive organic polymers todetect explosives vapors at extremely low levels. Selectivitybetween explosives and interferents is being improved in thedevices via a fundamental understanding of the energy trans-port mechanism along the poly(arylene ethynylene) backboneand its response to polymer structure, assembly architecture,and receptor characteristics.10 Fisher et al., at Nomadics, havecontinued to provide novel packaging and testing of the Fidosensor based on Swager’s fluorescent polymers. They haverecently reported successful detection of simulated vehicle-borne ion energy distribution (IED) targets using both vaporand swipe sampling.12 Cross-reactive chemical sensors usingfluorescent polymers with both narrow and broad specificityare being utilized in an artificial olfactory system for landmine detection.13 These devices rely on the transport of tracevapor, but active air movement can produce detection withina few seconds.
Compared with the other sensors, the special processand structure guarantee the advantages of the single-layerchemistry and conjugated polymer-based fluorescent sensingfilms: (1) fast response based on the design strategy of di-rectly exposing fluorophores to the testing solution, (2) highstability coming from the chemical bond among the compo-nents, (3) so-called “molecule wire effect,” which result in“super quenching effect,” and (4) multiple measurable photophysical parameters.14, 15
0034-6748/2011/82(10)/103102/8/$30.00 © 2011 American Institute of Physics82, 103102-1
Downloaded 26 Nov 2012 to 202.117.145.246. Redistribution subject to AIP license or copyright; see http://rsi.aip.org/about/rights_and_permissions

103102-2 Xin et al. Rev. Sci. Instrum. 82, 103102 (2011)
FIG. 1. (Color online) Schematics of synthesis of poly(diphenylsilane)s and its coupling onto a glass plate surface.
In this paper, based on our specific material-based flu-orescent sensing film,16 we develop a low-cost, low-power,high sensitivity, and small size device for the detection ofnitroaromatic explosives and give an elaboration on the de-sign process and relative technology. The results of theexperiments showed that the developed detector was ableto perform an ultra trace detection of explosives, such as2,4,6-trinitrotoluene (TNT) or its derivate 2,4-dinitrotoluene(DNT).
II. FLUORESCENT FILM SENSOR
A. Synthesis of fluorescent film sensor
The fluorescent film was prepared in the same way asreported in Ref. 16. Poly (diphenylsilane) (0.04 g) was dis-persed in tetrahydrofuran (THF) (20 ml), and then stirredfor 20 min. To the suspensions, a few drops of n-butyl-lithium were added under stirring. The scission reaction wascompleted within a few minutes, and the solution was thenpoured onto the substrates with reactive anchors, and re-acted for another 15 min. After coupling, the substrates werecollected and rinsed repeatedly with THF and toluene. Fur-ther cleanout was conducted by immersing the substrates intoluene overnight, and then separated and refluxed in THF for5 h to make sure that all physically adsorbed oligomer andother impurities are removed from the plate surface. The syn-thesis of poly(diphenylsilane) and its coupling onto a glassplate surface is schematically shown in Fig. 1.
B. Steady-state excitation and emission spectraof the film
The excitation and emission spectra of the oligomer-functionalized film in dry state are shown in Fig. 2. The max-imum excitation and emission of the film appeared at 370 nm
and 410 nm, respectively. Lots of experiments revealed thatthe fluorescent films have a fast, sensitive, and selective re-sponse to nitroaromatic compounds (NACs) in vapor phase;it is suited to sense DNT and TNT vapors. The film charac-terization and fluorescence quenching process is described indetail in Ref. 16.
III. SYSTEM DESIGN PRINCIPLES
This measurement system is in nature a kind of weak op-tical signals detecting device; it involves fluorescent materi-als, optics, computer, signal processing, and many other tech-nologies. Its work principle is as follows: the light emittingdiode (LED) emits an optical signal with specific wavelength,by which the fluorescent sensing film is excited to emit a cer-tain intensity of fluorescent signal. If the sample air containsexplosive material, such as the TNT vapors, the fluorescentmaterials would interact with explosive vapors, which would
FIG. 2. (Color online) Excitation and emission spectra of the oligomer-functionalized film in dry state.
Downloaded 26 Nov 2012 to 202.117.145.246. Redistribution subject to AIP license or copyright; see http://rsi.aip.org/about/rights_and_permissions
103102-3 Xin et al. Rev. Sci. Instrum. 82, 103102 (2011)
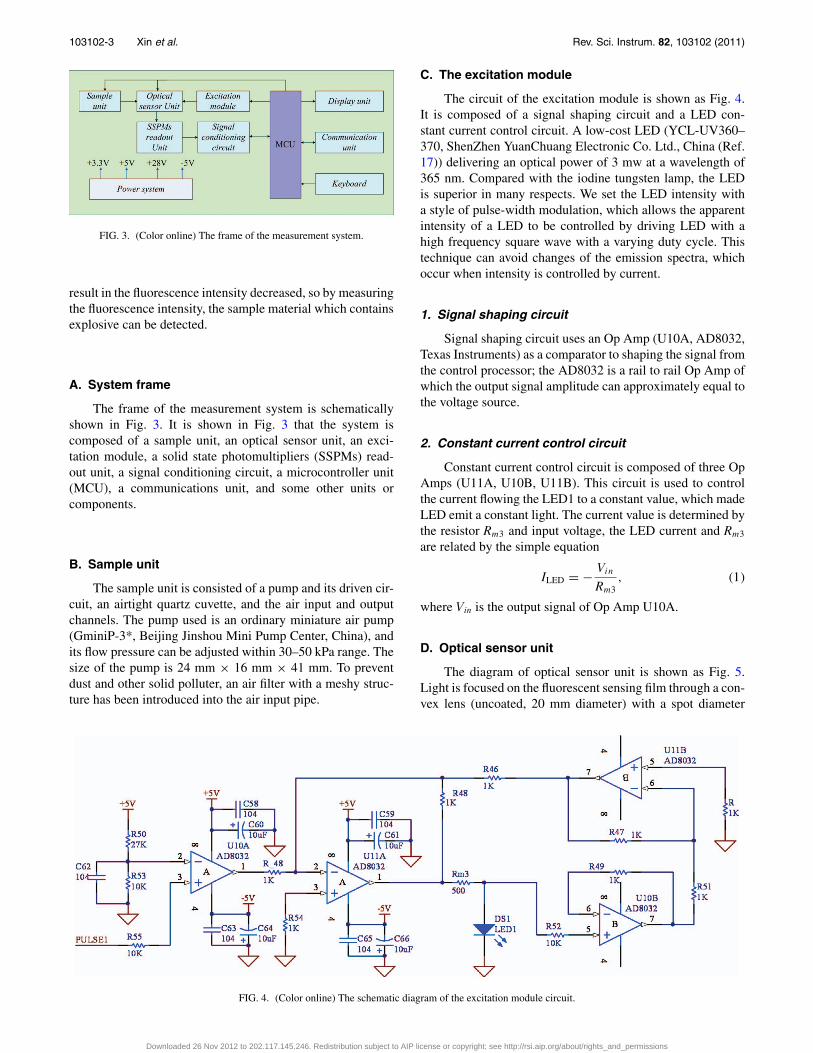
FIG. 3. (Color online) The frame of the measurement system.
result in the fluorescence intensity decreased, so by measuringthe fluorescence intensity, the sample material which containsexplosive can be detected.
A. System frame
The frame of the measurement system is schematicallyshown in Fig. 3. It is shown in Fig. 3 that the system iscomposed of a sample unit, an optical sensor unit, an exci-tation module, a solid state photomultipliers (SSPMs) read-out unit, a signal conditioning circuit, a microcontroller unit(MCU), a communications unit, and some other units orcomponents.
B. Sample unit
The sample unit is consisted of a pump and its driven cir-cuit, an airtight quartz cuvette, and the air input and outputchannels. The pump used is an ordinary miniature air pump(GminiP-3*, Beijing Jinshou Mini Pump Center, China), andits flow pressure can be adjusted within 30–50 kPa range. Thesize of the pump is 24 mm × 16 mm × 41 mm. To preventdust and other solid polluter, an air filter with a meshy struc-ture has been introduced into the air input pipe.
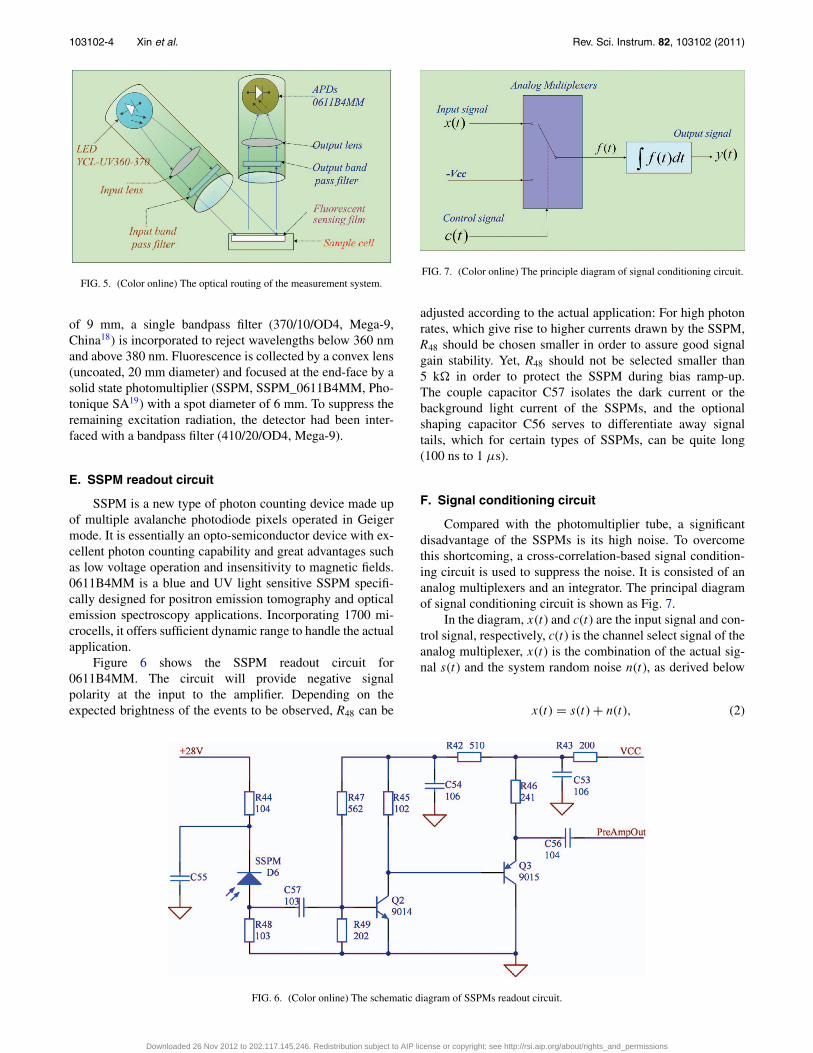
C. The excitation module
The circuit of the excitation module is shown as Fig. 4.It is composed of a signal shaping circuit and a LED con-stant current control circuit. A low-cost LED (YCL-UV360–370, ShenZhen YuanChuang Electronic Co. Ltd., China (Ref.17)) delivering an optical power of 3 mw at a wavelength of365 nm. Compared with the iodine tungsten lamp, the LEDis superior in many respects. We set the LED intensity witha style of pulse-width modulation, which allows the apparentintensity of a LED to be controlled by driving LED with ahigh frequency square wave with a varying duty cycle. Thistechnique can avoid changes of the emission spectra, whichoccur when intensity is controlled by current.
1. Signal shaping circuit
Signal shaping circuit uses an Op Amp (U10A, AD8032,Texas Instruments) as a comparator to shaping the signal fromthe control processor; the AD8032 is a rail to rail Op Amp ofwhich the output signal amplitude can approximately equal tothe voltage source.
2. Constant current control circuit
Constant current control circuit is composed of three OpAmps (U11A, U10B, U11B). This circuit is used to controlthe current flowing the LED1 to a constant value, which madeLED emit a constant light. The current value is determined bythe resistor Rm3 and input voltage, the LED current and Rm3
are related by the simple equation
ILED = − Vin
Rm3, (1)
where Vin is the output signal of Op Amp U10A.
D. Optical sensor unit
The diagram of optical sensor unit is shown as Fig. 5.Light is focused on the fluorescent sensing film through a con-vex lens (uncoated, 20 mm diameter) with a spot diameter
FIG. 4. (Color online) The schematic diagram of the excitation module circuit.
Downloaded 26 Nov 2012 to 202.117.145.246. Redistribution subject to AIP license or copyright; see http://rsi.aip.org/about/rights_and_permissions
103102-4 Xin et al. Rev. Sci. Instrum. 82, 103102 (2011)
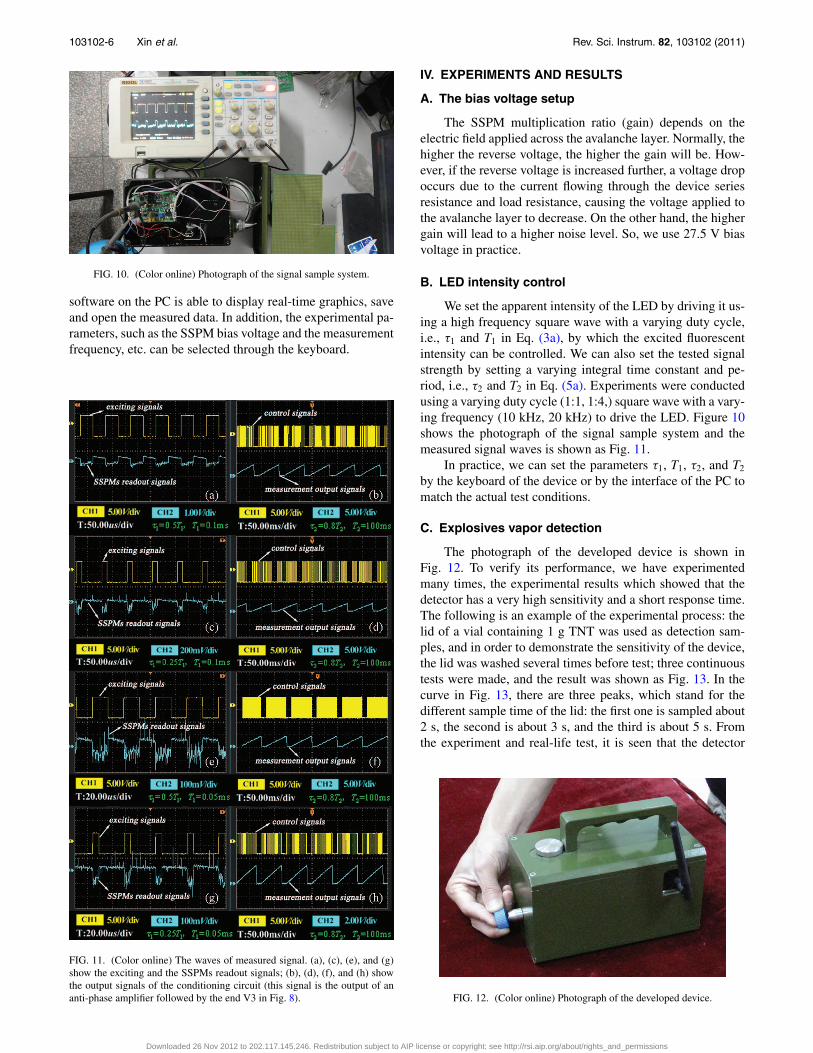
FIG. 5. (Color online) The optical routing of the measurement system.
of 9 mm, a single bandpass filter (370/10/OD4, Mega-9,China18) is incorporated to reject wavelengths below 360 nmand above 380 nm. Fluorescence is collected by a convex lens(uncoated, 20 mm diameter) and focused at the end-face by asolid state photomultiplier (SSPM, SSPM_0611B4MM, Pho-tonique SA19) with a spot diameter of 6 mm. To suppress theremaining excitation radiation, the detector had been inter-faced with a bandpass filter (410/20/OD4, Mega-9).
E. SSPM readout circuit
SSPM is a new type of photon counting device made upof multiple avalanche photodiode pixels operated in Geigermode. It is essentially an opto-semiconductor device with ex-cellent photon counting capability and great advantages suchas low voltage operation and insensitivity to magnetic fields.0611B4MM is a blue and UV light sensitive SSPM specifi-cally designed for positron emission tomography and opticalemission spectroscopy applications. Incorporating 1700 mi-crocells, it offers sufficient dynamic range to handle the actualapplication.
Figure 6 shows the SSPM readout circuit for0611B4MM. The circuit will provide negative signalpolarity at the input to the amplifier. Depending on theexpected brightness of the events to be observed, R48 can be
FIG. 7. (Color online) The principle diagram of signal conditioning circuit.
adjusted according to the actual application: For high photonrates, which give rise to higher currents drawn by the SSPM,R48 should be chosen smaller in order to assure good signalgain stability. Yet, R48 should not be selected smaller than5 k� in order to protect the SSPM during bias ramp-up.The couple capacitor C57 isolates the dark current or thebackground light current of the SSPMs, and the optionalshaping capacitor C56 serves to differentiate away signaltails, which for certain types of SSPMs, can be quite long(100 ns to 1 μs).
F. Signal conditioning circuit
Compared with the photomultiplier tube, a significantdisadvantage of the SSPMs is its high noise. To overcomethis shortcoming, a cross-correlation-based signal condition-ing circuit is used to suppress the noise. It is consisted of ananalog multiplexers and an integrator. The principal diagramof signal conditioning circuit is shown as Fig. 7.
In the diagram, x(t) and c(t) are the input signal and con-trol signal, respectively, c(t) is the channel select signal of theanalog multiplexer, x(t) is the combination of the actual sig-nal s(t) and the system random noise n(t), as derived below
x(t) = s(t) + n(t), (2)
FIG. 6. (Color online) The schematic diagram of SSPMs readout circuit.
Downloaded 26 Nov 2012 to 202.117.145.246. Redistribution subject to AIP license or copyright; see http://rsi.aip.org/about/rights_and_permissions

103102-5 Xin et al. Rev. Sci. Instrum. 82, 103102 (2011)
FIG. 8. (Color online) The schematic diagram of cross-correlation-based circuit.
where
s(t) ={
A, 0 ≤ t < τ1
0, τ1 ≤ t < T1, (3a)
s(t) = s(t + nT1), n = −∞, . . . ,−1, 0, 1, . . . ,+∞.
(3b)
The control signal c(t) is set as
c(t) = s(t)v(t), (4)
where
v(t) ={
C, 0 ≤ t < τ2
0, τ2 ≤ t < T2, (5a)
v(t) = v(t + nT2), n = −∞, . . . ,−1, 0, 1, . . . ,+∞.
(5b)
In Eqs. (3a) and (5a), the parameter T1, T2 are the periodof the signal s(t) and v(t), respectively, where T1 � T2. When0 ≤ t < τ2, the integrator output y(t) will be
y(t) = −∫
x(t)dt = −∫
[s(t) + n(t)]dt . (6)
The negative symbol in Eq. (6) is because of the integra-tor being an anti-phase one. If n(t) is a zero mean randomsignal and the integral time constant is much larger than theperiod T2, y(t)can be found as follows:
y(t) = −∫
[s(t) + n(t)]dt = −∫
s(t)dt = −Aτ1T2
T1+ C0,
(7)where C0 is the initial value of integrator and it is approximateto the value of the voltage source (Vcc) in actual.
When τ2 ≤ t < T2, y(t)will be
y(t) = −∫
(−V cc)dt =∫
V cc dt. (8)
Due to the saturation of electronic devices, y(t) will atfinal reach and stabilize at the voltage source value Vcc.
Figure 8 shows the actual circuit, where V1 is the outputsignal of the SSPMs readout circuit, CD4051 is a single 8-Channel CMOS analog multiplexer having three binary con-trol inputs: A, B, and C. Here, only 0–2 Channels were used:CHAL0 and CHAL1 are the channel selected logical controlsignal coming from the MCU. U5A, C12, and R15 constructan integrator which is a key component of the circuit, the peakvalue of the output of the integrator V3 stands for the fluo-rescence intensity, the smaller the peak value, the higher thedensity of explosives vapors. The signal sequence diagramswere shown as Fig. 9.
G. The control module
The system is controlled by a fully integrated mixed-signal system-on-a-chip MCU (C8051F350 Silicon Labora-tories Inc., USA (Ref. 20)). It is a high-speed pipelined 8051-compatible microcontroller core (up to 50 MIPS) and has a24-bit single-ended or differential analog-to-digital converterwith analog multiplexer and two 8-bit current output DACs.And the system had been programmed using C51 language.The MCUs is interfaced with a personal computer (PC) us-ing a Zigbee wireless sensor network, and the developed
FIG. 9. (Color online) The signal sequence diagram.
Downloaded 26 Nov 2012 to 202.117.145.246. Redistribution subject to AIP license or copyright; see http://rsi.aip.org/about/rights_and_permissions
103102-6 Xin et al. Rev. Sci. Instrum. 82, 103102 (2011)
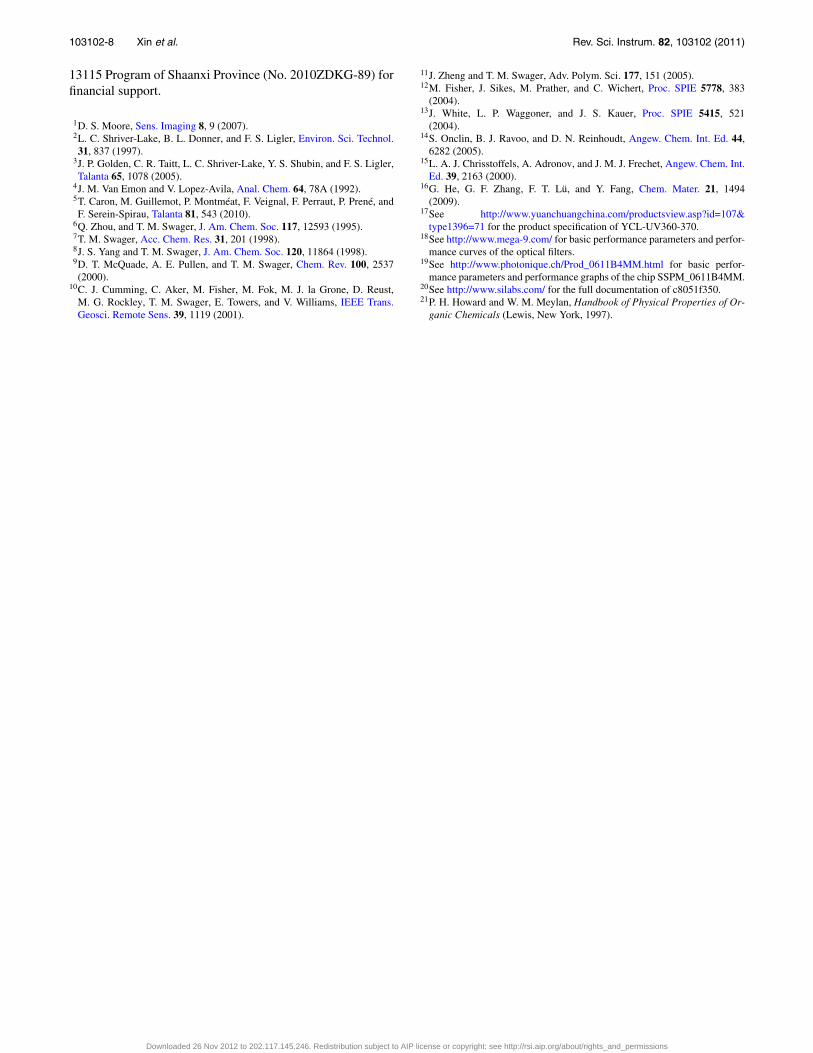
FIG. 10. (Color online) Photograph of the signal sample system.
software on the PC is able to display real-time graphics, saveand open the measured data. In addition, the experimental pa-rameters, such as the SSPM bias voltage and the measurementfrequency, etc. can be selected through the keyboard.
FIG. 11. (Color online) The waves of measured signal. (a), (c), (e), and (g)show the exciting and the SSPMs readout signals; (b), (d), (f), and (h) showthe output signals of the conditioning circuit (this signal is the output of ananti-phase amplifier followed by the end V3 in Fig. 8).
IV. EXPERIMENTS AND RESULTS
A. The bias voltage setup
The SSPM multiplication ratio (gain) depends on theelectric field applied across the avalanche layer. Normally, thehigher the reverse voltage, the higher the gain will be. How-ever, if the reverse voltage is increased further, a voltage dropoccurs due to the current flowing through the device seriesresistance and load resistance, causing the voltage applied tothe avalanche layer to decrease. On the other hand, the highergain will lead to a higher noise level. So, we use 27.5 V biasvoltage in practice.
B. LED intensity control
We set the apparent intensity of the LED by driving it us-ing a high frequency square wave with a varying duty cycle,i.e., τ1 and T1 in Eq. (3a), by which the excited fluorescentintensity can be controlled. We can also set the tested signalstrength by setting a varying integral time constant and pe-riod, i.e., τ2 and T2 in Eq. (5a). Experiments were conductedusing a varying duty cycle (1:1, 1:4,) square wave with a vary-ing frequency (10 kHz, 20 kHz) to drive the LED. Figure 10shows the photograph of the signal sample system and themeasured signal waves is shown as Fig. 11.
In practice, we can set the parameters τ1, T1, τ2, and T2
by the keyboard of the device or by the interface of the PC tomatch the actual test conditions.
C. Explosives vapor detection
The photograph of the developed device is shown inFig. 12. To verify its performance, we have experimentedmany times, the experimental results which showed that thedetector has a very high sensitivity and a short response time.The following is an example of the experimental process: thelid of a vial containing 1 g TNT was used as detection sam-ples, and in order to demonstrate the sensitivity of the device,the lid was washed several times before test; three continuoustests were made, and the result was shown as Fig. 13. In thecurve in Fig. 13, there are three peaks, which stand for thedifferent sample time of the lid: the first one is sampled about2 s, the second is about 3 s, and the third is about 5 s. Fromthe experiment and real-life test, it is seen that the detector
FIG. 12. (Color online) Photograph of the developed device.
Downloaded 26 Nov 2012 to 202.117.145.246. Redistribution subject to AIP license or copyright; see http://rsi.aip.org/about/rights_and_permissions

103102-7 Xin et al. Rev. Sci. Instrum. 82, 103102 (2011)
FIG. 13. (Color online) The control panel and the waves of measured data.
possesses extremely high sensitivity and rapid response to thevapor of the explosives. Its estimated detection limit (thresh-old concentration) to TNT is less than 10−15 g/ml.21
Additionally, from the point of real-life applications, de-tection of NACs-contained explosives is almost unaffected bythe presence of common organic solvents, daily chemicals,and fruit juice, such as benzene, toluene, methanol, ethanol,perfume, and apple juice. This is because the response of thefilm to these compounds is much weaker than that to the ex-plosives and thereby their interference can be easily screenedby the set up of a suitable threshold. False alarm can be onlyfound when the system is not properly used, for example,contamination of the sampling unit or un-suitable set up ofa threshold.
V. CONCLUSION AND DISCUSSION
In this paper, we dealt with the development of a portable,low-power, and low-cost vapor phase explosive detector basedon a specific materials-based fluorescent sensing film. The in-strument has been designed by using a LED as the light sourceand a SSPM as the photosensitive device. As the componentschosen in the design are not as good as those used in thecommercially available instruments, such as Edinburgh In-strument FLS920, some special circuits with superior perfor-mances and advanced signal processing techniques, e.g., lownoise preamplifier, code pulse-width modulation technique,and cross-correlation-based signal conditioning circuit, havebeen employed to suppress the system’s noise and guaranteethe performances of the system. With all these efforts, eventhough the system is much smaller and cheaper, it shows com-parable sensing performances to the machine, which is com-mercially available but of much larger size and cost more than10 times.
Caron et al.5 have done the efficient work in the ultratrace detection of explosives. Comparison to the work con-ducted by Caron et al., the design adopted and the compo-nents used in the construction of our instrument are very dif-ferent from those employed by them, and furthermore, thesensing component is also different. Among others, the mostimportant fact is that our system is superior because of itsmuch faster response to the presence of NACs, specifically afew seconds to a few minutes.
As the device is developed for the ultra trace detection ofexplosive vapors, it is very difficult to quantify the concentra-tion of an explosive in vapor phase. The actual readout of thedetector is not the real density value and it is only a referencevalue, which is relative to the initial parameter we set. Thefuture work is to find an appropriate way to calibrate the testdata and make it be consistent with the real value.
Another problem is that the effect of temperature and hu-midity on the performance of the device is not fully investi-gated, and this effect will be studied later on.
As a continuation of our efforts in the past, we have beentrying to develop even more and powerful fluorescent sens-ing films for the detection of variety of poisonous, harmful,incendive, and explosive compounds, and combine them intosensor arrays, which should possess multiple sensing abilities.Based on these sensing platforms, we will develop the newsystem that can detect many kinds of compounds and have abetter performance. This is our main objective in the future.
ACKNOWLEDGMENTS
We thank the Natural Science Foundation of China(NSFC) (Nos. 20803046 and 20927001), the Ministry of Sci-ence and Technology of China (No. 2007AA03Z349), and the
Downloaded 26 Nov 2012 to 202.117.145.246. Redistribution subject to AIP license or copyright; see http://rsi.aip.org/about/rights_and_permissions
103102-8 Xin et al. Rev. Sci. Instrum. 82, 103102 (2011)
13115 Program of Shaanxi Province (No. 2010ZDKG-89) forfinancial support.
1D. S. Moore, Sens. Imaging 8, 9 (2007).2L. C. Shriver-Lake, B. L. Donner, and F. S. Ligler, Environ. Sci. Technol.31, 837 (1997).
3J. P. Golden, C. R. Taitt, L. C. Shriver-Lake, Y. S. Shubin, and F. S. Ligler,Talanta 65, 1078 (2005).
4J. M. Van Emon and V. Lopez-Avila, Anal. Chem. 64, 78A (1992).5T. Caron, M. Guillemot, P. Montméat, F. Veignal, F. Perraut, P. Prené, andF. Serein-Spirau, Talanta 81, 543 (2010).
6Q. Zhou, and T. M. Swager, J. Am. Chem. Soc. 117, 12593 (1995).7T. M. Swager, Acc. Chem. Res. 31, 201 (1998).8J. S. Yang and T. M. Swager, J. Am. Chem. Soc. 120, 11864 (1998).9D. T. McQuade, A. E. Pullen, and T. M. Swager, Chem. Rev. 100, 2537(2000).
10C. J. Cumming, C. Aker, M. Fisher, M. Fok, M. J. la Grone, D. Reust,M. G. Rockley, T. M. Swager, E. Towers, and V. Williams, IEEE Trans.Geosci. Remote Sens. 39, 1119 (2001).
11J. Zheng and T. M. Swager, Adv. Polym. Sci. 177, 151 (2005).12M. Fisher, J. Sikes, M. Prather, and C. Wichert, Proc. SPIE 5778, 383
(2004).13J. White, L. P. Waggoner, and J. S. Kauer, Proc. SPIE 5415, 521
(2004).14S. Onclin, B. J. Ravoo, and D. N. Reinhoudt, Angew. Chem. Int. Ed. 44,
6282 (2005).15L. A. J. Chrisstoffels, A. Adronov, and J. M. J. Frechet, Angew. Chem. Int.
Ed. 39, 2163 (2000).16G. He, G. F. Zhang, F. T. Lü, and Y. Fang, Chem. Mater. 21, 1494
(2009).17See http://www.yuanchuangchina.com/productsview.asp?id=107&
type1396=71 for the product specification of YCL-UV360-370.18See http://www.mega-9.com/ for basic performance parameters and perfor-
mance curves of the optical filters.19See http://www.photonique.ch/Prod_0611B4MM.html for basic perfor-
mance parameters and performance graphs of the chip SSPM_0611B4MM.20See http://www.silabs.com/ for the full documentation of c8051f350.21P. H. Howard and W. M. Meylan, Handbook of Physical Properties of Or-
ganic Chemicals (Lewis, New York, 1997).
Downloaded 26 Nov 2012 to 202.117.145.246. Redistribution subject to AIP license or copyright; see http://rsi.aip.org/about/rights_and_permissions