
A Platform for Change - National Transport Authority · A Platform for Change ... • define a land...
84
A Platform for Change Final Report An integrated transportation strategy for the Greater Dublin Area 2000 to 2016 Dublin Transportation Office November 2001 1
Transcript of A Platform for Change - National Transport Authority · A Platform for Change ... • define a land...

A Platform for ChangeFinal Report
An integrated transportation strategy for the Greater Dublin Area 2000 to 2016
Dublin Transportation OfficeNovember 2001
1

The Contents
1. The Background 3
2. The Vision 10
3. The Challenge 12
4. The Technical Tasks 16
5. The Strategy 50
6. The Costs 68
7. The Benefits 70
8. The Programme 75
9. The Next Steps 80
Appendix: DTO Committees
2

1. The BackgroundThe Dublin Transportation Office (DTO) was set up by Government in 1995, and was given primary responsibility for strategictransportation planning in the Greater Dublin Area.
The genesis of the DTO was in the Final Report of the Dublin Transportation Initiative (DTI), which was published in August1995. The DTI had three critical objectives:
• the production of a long-term transportation strategy (to 2011) for the Greater Dublin Area;
• the preparation of a medium-term Investment and Implementation Programme for the period 1994-1999 drawn from the
recommended Strategy;
• the putting in place of a continuous transportation planning process.
The Government decided that the DTI Strategy should provide the planning framework for the future development of thetransport network in the Greater Dublin Area.
One of the key recommendations of the DTI Final Report was that the DTI Strategy should form the first phase of an ongoingtransportation planning process. The Dublin Transportation Office was set up in 1995 to carry on that transportation planningprocess. This report provides a description of the first updating by the DTO of the original DTI Strategy and outlines theresulting DTO Strategy. An outline of the DTO Strategy was published in September 2000 under the title "A Platform forChange". This report provides a full description of the DTO Strategy and the process by which it was developed.
Terms of ReferenceThe DTO Steering Committee agreed the Terms of Reference for the Updating of the DTI Strategy on 22 December 1998 andset up a Steering Group to oversee the development of the strategy. The Terms of Reference set the following tasks:
• review the definition of the study area;
• review the Vision Statement;
• review the fundamental policy principles underlying the DTI Strategy;
• complete the analysis of multi-modal travel surveys and develop a full set of origin-destination matrices for 1997;
• define a land use / socio-economic / demographic scenario consistent with the Strategic Planning Guidelines against which
to assess the updated Strategy;
• review the testing methodology;
• refine the performance indicators;
• develop alternative transportation options for testing;
• test and evaluate the alternative transportation options;
• develop a draft Updated DTO Strategy for 2000-2016;
• derive a medium term investment and implementation programme;
• review institutional arrangements for implementation of the updated strategy.
The Study AreaThe original DTI Study Area comprised the "journey to work" area for Dublin. It covered the city and county of Dublin and partsof counties Meath, Kildare and Wicklow. In February 1999, the DTO Steering Committee decided to broaden the study area toinclude the entire Greater Dublin Area. This comprises the administrative areas of Dublin Corporation and of the county councilsof Fingal, South Dublin and Dún Laoghaire-Rathdown (the Dublin Region), and the counties of Kildare, Meath and Wicklow (theMid-East Region). This enlarged study area reflects the increasing influence of Dublin on the surrounding counties, theextending journey to work patterns and the expansion of employment opportunities to these areas. It is also the same area asthat covered by the Strategic Planning Guidelines.
3
Fundamental Policy BackgroundThe DTO Strategy set out in this report has been designed to support and complement the strategic land use planning frameworkset out in the Strategic Planning Guidelines for the Greater Dublin Area, published in February 1999 and reviewed in April 2000.
The Strategy also takes account of:
• the transport investment proposals in the National Development Plan 2000 to 2006;
• the development plans of the local authorities;
• the National Sustainable Development Strategy;
• the Green Paper on Sustainable Energy;
• the National Climate Change Strategy
• the Dublin Suburban Rail Strategic Review;
• the Bus Network Strategy Appraisal for the Greater Dublin Area;
• the National Road Needs Study;
• the Eastern By-Pass Strategic Study;
• the ESRI Medium Term Review;
• the views of representative organisations and interested parties.
Strategic Planning Guidelines and ReviewThe Strategic Planning Guidelines for the Greater Dublin Area were published in February 1999. They were prepared for theseven Local Authorities in the Greater Dublin Area and the Department of the Environment and Local Government inconjunction with the Dublin and Mid-East Regional Authorities and were drafted by a team of consultants led by Brady ShipmanMartin. They have been accepted as Government policy and are given statutory recognition under the Planning andDevelopment Act, 2000. The Guidelines provide a broad planning strategy for the area to 2011, including recommendations onthe general location of residential, commercial and industrial development.
The overall strategy in the Guidelines envisages the consolidation of future growth into a limited number of locations. Thestrategy distinguishes between the Metropolitan Area and the Hinterland Area (see figure 1.1), but in both areas the strategyseeks and facilitates a better balance between public and private transport.
In the Metropolitan Area, development will be consolidated in line with the principles of sustainable development, toaccommodate a greater population than at present. One of the principal reasons for consolidating development in theMetropolitan Area is to achieve a more compact city, which will reduce the amount of travel and will create the conditionswhere improved public transport can provide a viable alternative to the private car. A more compact city also encourages themost sustainable travel modes of walking and cycling. The key transportation objective is, therefore, to develop an integratednetwork of public transport services throughout the Metropolitan Area, together with a well managed road network, an extensivecycle network and improved walking routes and pedestrian facilities.
In the Hinterland Area development will be concentrated into primary ‘development centres’, which will be located on existing orfuture transportation corridors at Naas-Newbridge-Kilcullen, Navan, Balbriggan and Wicklow, with additional secondary centresat Arklow, Athy, Kildare-Monasterevin and Rush-Lusk. In the longer-term, these development centres will become self-sufficient,which involves the development of a strong employment and service base in each development centre.
The Guidelines’ strategic forecasts of population, residential location and employment location constitute the land use scenariofor the development of the DTO Strategy.
In April 2000, the first annual Review and Update of the Strategic Planning Guidelines was published. The Review revisedupwards the forecasts of population, household and employment given in the Guidelines. It concluded that this furtherstrengthens the need to implement the strategy of consolidation, with its associated emphasis on public transport. Thealternative would be unsustainable and unacceptable sprawl, accompanied by intolerable traffic congestion. It is now especiallyimportant that a commitment be made to the location and character of the rail based elements of the public transport system,as these will determine the detailed location of future land uses and will reduce the pressure for sprawl.
4

The Development Plans of the Local AuthoritiesEach local authority in the DTO area publishes its own development plan, in accordance with the Local Government (Planningand Development) Act, 1963 (which has been replaced by the Planning and Development Act, 2000). The development plansset out the development policies of the local authorities. In particular, they provide detailed information about the location ofresidential, retail and employment developments. This information was an important input to the technical task of forecasting thedemand for travel, during the development of the Strategy. They also show the alignments of proposed transportationdevelopments such as proposed roads, cycle routes and LUAS lines.
The National Development Plan 2000-2006The National Development Plan 2000-2006 is a coherent development strategy, which lays the foundation for Ireland’scontinuing economic and social development. A key element of the Plan is a major investment in economic and socialinfrastructure. Of relevance to the DTO are elements of the Economic and Social Infrastructure Operational Programme underthe headings National Roads and Transport in the Greater Dublin Area.
The investment in National Primary Roads includes the development to motorway/high quality dual carriageway standard of theroutes from Dublin to the Border (M1), to Galway (N4/N6), to Limerick (N7), to Cork (N8) and to Waterford (N9).
There will be major improvements on other National Primary Routes including those from Dublin to Monaghan (N2), toEnniskillen (N3), and to Rosslare (N11) and the completion of the Dublin C-Ring (M50) and the Dublin Port Tunnel.
Among the National Secondary Roads to be improved is the Tallaght to Blessington route (N81).
The National Development Plan’s investment programme for the Greater Dublin Area is largely drawn from the DTO’s "DublinTransportation Blueprint 2000-2006". The Plan’s strategy for the Greater Dublin Area is to concentrate investment on:
• developing, extending and increasing the capacity of the bus network by expanding the route network to include orbital and
local routes, purchasing additional buses, providing additional Quality Bus Corridors (QBCs), extending and enhancing the
existing QBCs and introducing other bus priority measures;
• implementing the light rail network approved by Government in 1998 including the construction of the surface element of
the proposed LUAS network from Tallaght to Connolly Station and from Sandyford to St Stephen’s Green;
• exploiting much more fully the potential for development of the suburban rail network by purchasing additional rolling stock,
quadrupling of track between Hazelhatch and Sallins, providing new stations and new depot facilities and resignalling
between Howth and Grand Canal Dock;
• promotion of transport integration through the provision of additional park and ride facilities and the introduction of
integrated public transport ticketing and public transport interchange facilities;
• completion and upgrading of the C-Ring (M50), Dublin Port Access Tunnel and national road projects;
• implementation of non-national road projects of particular relevance to the achievement of DTI Strategy objectives;
• provision of further cycle infrastructure and facilities;
• implementation of traffic management measures (including measures to respond to the needs of mobility impaired and
disabled people).
The National Development Plan provides for an indicative expenditure of €5,968m (IR£4,700m) (1999 prices) on NationalRoads, including €3,792m (IR£2,986m) in the Southern and Eastern Region of the country, and €2,012m (IR£1,585m) (1999prices) for Public Transport in the Greater Dublin Area.
5

National Sustainable Development StrategyIn 1997, the Government published Sustainable Development: A Strategy for Ireland. This comprehensive document redefinesall relevant aspects of government policy in the context of sustainable development. Key elements of the Strategy, relating totransportation, include:
• minimisation of the potential growth in transport demand will be incorporated as a leading consideration in land use planning;
• increased efforts will be made to manage the existing roads network more efficiently;
• government policy will continue to support and improve public transport systems and infrastructure with a view to
increasing their market share;
• relevant agencies will provide more sustainable and environmentally acceptable alternatives to private car transport;
• implementation of the DTI Strategy will be intensified;
• opportunities for non-motorised transport will be improved;
• appropriate agencies will actively encourage public awareness of the unsustainable aspects of increasing use of vehicle
transport;
• continuing efforts to reduce CO2 emissions from motor vehicles.
Green Paper on Sustainable EnergyThe Department of Public Enterprise published its Green Paper on Sustainable Energy in September 1999. The Green Paperindicates how Ireland will progress towards meeting its energy requirements in an environmentally and economically sustainableway. It addresses targets for reducing consumption of greenhouse gases, arising from the Kyoto Protocol. In relation to thetransport sector, domestic policies to be addressed include:
• land use planning;
• road pricing;
• promotion of public transport.
The Green Paper highlights the benefits of taking an integrated approach to land use planning and transport policy development.
National Climate Change StrategyThe Government adopted the National Climate Change Strategy to ensure that Ireland meets its targets under the Kyoto Protocol.Under the Kyoto Protocol, Ireland agreed to limit the growth of emissions of a number of greenhouse gases to 13% above 1990levels by the period 2008-2012. The Environmental Protection Agency has confirmed that emissions exceeded this target in 1998.The Strategy sets out a framework for action and is designed to achieve the necessary reduction in emissions equitably, witheconomic and environmental efficiency and while continuing to support economic growth. Key initiatives include:
• a commitment to put in place an appropriate framework of greenhouse gas taxation, prioritising carbon dioxide emissions;
• a commitment to participate in international emissions trading, as a supplement to, and not a substitute for, domestic
action;
• a balanced range of measures within the transportation sector to address fuel efficiency, demand management and modal
shift. The fuel efficiency measures include a rebalancing of Vehicle Registration Tax and annual motor tax to favour more fuel
efficient cars, fuel economy labelling for all new cars, and fuel switching and efficiency for public transport and State vehicles.
Measures for demand management have also been set out including development of integrated traffic management, higher
residential densities and setting fuel taxes at appropriate levels to limit the rate of increase of overall fuel consumption.
The Dublin Suburban Rail Strategic ReviewIarnród Éireann and Córas Iompair Éireann commissioned consultants, led by Arup Consulting Engineers, to conduct a strategicreview of the Dublin suburban rail system and to provide a vision for the network to 2020. The review was based on land useand planning forecasts from the Strategic Planning Guidelines. It identified three main constraints in the existing rail network: thecapacity of the Loop Line, the level crossings south of Grand Canal Dock and the conflicts between inter-city and suburbantrains. A number of investment options were developed to achieve four strategic aims: meet demand for rail travel, support
6
development, facilitate sustainability initiatives and promote a commercial rail business. The recommended plan comprises anumber of schemes that build on the strengths of the existing suburban rail network and address its weaknesses. They include:
• lengthening of platforms to cater for 8 car trains;
• three- or four-tracking of the Kildare line;
• upgrading the Loop line including resignalling from Howth to Grand Canal Dock and the provision of an additional platform
at Pearse;
• three or four tracking of the Northern suburban line from Connolly to north of Howth Junction;
• new stations along existing alignments (eg Lucan South and Leixlip);
• construction of a heavy rail link to Dublin Airport, subject to further review;
• building of new spur lines off existing alignments (eg to Navan, Blanchardstown and Tallaght West);
• removal of level crossings;
• an East-West city centre tunnel;
• electrification of suburban lines from Maynooth and Sallins/Kildare to the city centre;
• acquisition of additional rolling stock, depots and stabling facilities.
The review considered suburban rail schemes only, although it recognised that suburban rail has a close interaction with LUAS.It suggested that the systems need to be planned together to achieve a fully integrated system.
Bus Network Strategy Appraisal for the Greater Dublin AreaCIE appointed consultants led by Scott Wilson to undertake a strategic review of the network of bus services in the GreaterDublin Area. The objective of the study was to develop a strategy for the 2006 bus network. The study was based on theStrategic Planning Guidelines. It developed a preferred strategy for both the Metropolitan and Hinterland Areas. The preferredstrategy made recommendations on enhancing the service network and greatly extending bus priority measures, including:
• additional QBCs;
• increased interchange opportunities;
• better service distribution to and within the city centre through the provision of new city centre orbital routes and the
extension of certain radial routes to operate across the city centre;
• enhanced service frequency on key radial routes;
• introduction of an integrated ticketing system;
• new orbital and local services in the Hinterland Area.
The National Road Needs StudyThe National Road Needs Study was commissioned by the National Roads Authority and carried out by a team of consultantsled by MC O’Sullivan & Co Ltd. One of the broad objectives of the study was to determine the appropriate type of roadway foreach segment of the national road network in order to cater for projected traffic flows over the twenty-year period 2000-2019.The study assessed likely traffic growth rates from 1995 to the design year 2019 and carried out a sensitivity analysis withhigher and lower growth rates. It recommended six different road types as suitable for Irish conditions, ranging from a reducedtwo-lane road to dual carriageway motorway. In particular, the study identified the appropriate road type for each section of thenational road network in the Greater Dublin Area. Its recommendations for the DTO area were incorporated into the DublinTransportation Blueprint 2000-2006 and subsequently into the National Development Plan.
7

The Eastern By-Pass Strategic StudyThe National Roads Authority appointed Arup Consulting Engineers to undertake a strategic study of the proposal for anEastern By-pass of Dublin. The purpose of the study was to examine the implications of such a scheme in terms of strategicobjectives dealing with planning, environmental, transportation, financial and engineering issues. The study was primarilyundertaken with a view to establishing the feasibility of the Eastern By-pass concept and did not recommend a definitivealignment. It concluded that the Eastern By-pass accords with the strategic objectives set out in the study, that it has a robusteconomic performance, that it is suitable for a Public Private Partnership and that it should be taken forward for detailedconsideration. The Government has endorsed this position.
The ESRI Medium Term ReviewThe Economic and Social Research Institute (ESRI) published the Medium Term Review in October 1999. It included macroeconomic forecasts of gross national product (GNP), gross domestic product (GDP) and employment to 2015. GNP was forecast togrow by 5.1% per year between 2000 and 2005, by 4.3% per year between 2005 and 2010 and by 3.2% per year between 2010and 2015. The unemployment rate (on an ILO basis) was forecast to fall from 5.6% in 2000, to 5.3% in 2005 and to 4.7% in 2010.These forecasts form the basis of the economic assumptions that underlie the transport demand forecasts in chapter 3 of thisreport.
ConclusionThe DTO Strategy was not developed in a vacuum. The above documents provide both a general policy background and moredetailed technical analysis.
The policy documents such as the Strategic Planning Guidelines, the National Development Plan and the local authoritydevelopment plans, have been adopted by Government and the local authorities. The Strategy must therefore be consistentwith the policies that are set out in these documents.
The technical documents, such as the Dublin Suburban Rail Strategic Review and the Eastern By-Pass Strategic Study,examine proposed infrastructural schemes and public transport services. They provide valuable information on the strengthsand weaknesses of the schemes and facilitate decisions on whether the schemes should be included in the Strategy.
8

9
Figure 1.1 STRATEGIC PLANNING GUIDELINES

2. The VisionTransportation is a means to an end. That is, people do not normally travel for the sake of travelling; they travel to achieve someother need or want. It is important, therefore, to put transportation in the context of the broader objectives for the city and region. Thestarting point for the development of the DTO Strategy was, therefore, to ask the question: "what type of city and region do we wishto live, work and relax in?". This question was first posed by the DTI and answered in the form of a Vision for Dublin. In accordancewith the Terms of Reference for this study, the original DTI Vision for Dublin was reviewed and amended as set out below.
Vision StatementThe Vision sees the Greater Dublin Area as:
• a City and Region which embraces the principles of sustainability;
• encompassing a leading European City, proud of its heritage and looking to the future;
• having at its heart the National Capital, seat of government and national centres of excellence;
• a strong, competitive, dynamic and sustainable Region;
• a Living City and Region, on a human scale, accessible to all and providing a good quality of life for its citizens.
The next step was to translate this Vision into a series of more concrete, though still broad, objectives. The objectives havebeen grouped under five separate headings as follows:
The Regional Economy• improve accessibility and reduce congestion;
• sustain economic development and regeneration;
• consolidate existing economic activity;
• encourage a further increase in participation in the labour force, particularly by disadvantaged groups in society;
• enhance goods distribution in a sustainable way.
Quality of Life• reduce growth in the demand for transport, especially private transport;
• reduce the need for car commuting by improving the reliability, availability and quality of public transport;
• reduce travel times and congestion;
• ameliorate direct environmental effects of transport – noise, severance, air pollution and greenhouse gas emissions;
• promote cycling and walking as safe, sustainable and healthy means of transport;
• improve transport safety.
International and National Context • act consistently with Government, EU and UN policies;
• improve accessibility to ports and airports for passengers and goods;
• improve accessibility to and from the Greater Dublin Area;
• foster sustainable development.
10

Development of the City and Region • promote implementation of the Strategic Planning Guidelines for the Greater Dublin Area and the proposed National Spatial
Strategy;
• within the Region, consolidate growth in the Metropolitan Area;
• within the Hinterland Area, promote the self-sufficiency of the Development Centres.
Efficiency in Implementation• optimise the use of existing infrastructure and facilities;
• promote sustainable land use;
• ensure timely implementation to meet sustainable transport needs;
• ensure the efficient and cost-effective use of resources – public, EU and private sector;
• ensure that legislative, institutional and administrative structures optimise implementation;
• maximise self-enforcement;
• ensure minimum disruption during construction and implementation.
The Vision and the objectives are largely the same as in the DTI (with some changes in wording and arrangement). There are,however, two substantive differences. First, there is an additional explicit emphasis on sustainability, both in the Vision andconsequently in a number of the objectives. Second, the Strategic Planning Guidelines for the Greater Dublin Area have led toa change in several objectives. In particular, all the objectives under the heading ‘Development of the City and Region’ arederived directly from the Guidelines. There is also a broader focus than existed during DTI. Instead of concentrating onaccessing the city centre, the updated Vision and objectives follow the Guidelines by considering the entire Greater Dublin Areaand do not let the Metropolitan Area dominate the Hinterland Area.
During the course of the update, the DTO Steering Committee set two additional quantitative objectives for the horizon year of 2016:
• to reduce the level of congestion on the road network to 1991 levels when the average speed in the morning peak hour was 22kph;
• to provide adequate capacity for all journeys to work and education, which make up the vast majority of trips in the morning
peak hour.
The additional quantitative objectives provided easily measurable targets for the development of the Strategy. The DTO felt thatthe achievement of these two objectives would provide an effective transportation strategy and would be likely to satisfy all ofthe criteria arising from the Vision Statement.
11

3. The ChallengeIt is worthwhile to compare the 1995 DTI Strategy with the position today and to analyse the challenge that we face in thefuture. First, we note the progress made in the implementation of the recommendations of the DTI Strategy. Second, we reviewthe changes in the demand for transport since 1991 and compare the actual outturn with the DTI forecasts. Finally, we forecasthow the demand for transport will change between now and our planning horizon of 2016.
Substantial progress has been made in implementing the recommendations of the 1995 DTI Strategy. There has, however,been considerable slippage in the implementation of elements of that Strategy, especially major infrastructure projects such asthe QBCs, LUAS and the Dublin Port Tunnel. The growth in demand for travel has been far ahead of the forecasts in DTI. Theresult has been a rapid increase in congestion, for both private and public transport, and consequential environmental damage.
Progress in Implementing DTI RecommendationsQuality Bus Corridors (QBCs): Nine of the DTI’s eleven QBCs have been opened: Malahide Road, Swords (from Whitehallto the city centre), Finglas, Blanchardstown, Lucan, North Clondalkin, Tallaght, Rathfarnham and the N11. The remainder to theSwords QBC, South Clondalkin and an additional QBC from Ballymun are under construction. The Orbital QBC (from Tallaghtvia Clondalkin and Blanchardstown to Dublin Airport) is at the design stage. The longer established QBCs (Malahide, Lucan andN11) are now carrying more than twice as many paople as a lane of general traffic at their design speed of 22kph.
DART/ Suburban Rail: Almost all the main elements of DART/Suburban Rail in the DTI Strategy have been implemented. The Arrow service from Kildare to Heuston has been introduced. DART extensions to Greystones and Malahide are open. New DART rolling stock is in service providing longer trains and increased capacity. There are new stations at Clontarf Roadand Grand Canal Dock and upgraded stations (eg at Dún Laoghaire). The twin-tracking of the Maynooth line is completed. New diesel rolling stock is in service providing longer trains and increased frequency and capacity. There is a new staion atDrumcondra.
Light Rail (LUAS): Lines from Tallaght to Connolly Station and from Sandyford Industrial Estate to St Stephen’s Green areunder construction. They are expected to start operating during 2003. Rolling stock for the lines has been ordered with deliverydue for completion in 2002.
Park and Ride: 2000 extra spaces have been provided at suburban rail stations.
National Roads that have been completed are:
• the Northern Cross Route (M50) (including its extension to the Malahide Road (N32));
• the Southern Cross Route (M50);
• some junction improvements on the C-Ring (M50);
• the Northern Motorway (Balbriggan By-pass) (M1);
• North Road in Finglas (N2);
• the Leixlip-Maynooth-Kilcock By-pass (M4);
• White’s Cross to Knocksinna (N11);
• Naas Road to Blessington Road (N82).
National Roads that are under construction are:
• the Northern Motorway (Airport to Five Roads) (M1);
• Kilmacanogue to the Glen o’ the Downs (N11);
• the Dublin Port Tunnel;
• the South-Eastern Motorway.
12

Other Roads: Non-national roads in the DTI area that have been completed include: phase 2 of Church Road (Ballybrack),the Wyckham By-pass (which is part of the Dundrum relief road scheme), the Mercer Street/Stephen’s Street scheme, MilltownRoad, the Newlands to Fonthill Road, the Nangor to Fox & Geese Road, Grange Road (Baldoyle) and parts of the Outer RingRoad. Non-national roads in the DTI area that are under construction include phase 3 of Church Road (Ballybrack) and theDundrum Main Street By-pass.
Traffic Management and Parking: Availability of on-street parking in the city centre has improved radically - largely due to bothparking policy measures (eg the reduction of free on-street parking and the new pricing structure) and improved enforcement byclamping and tow-away. A centrally controlled system of variable message signs giving real-time information on parking availabilityat city centre car parks has been installed. These measures have reduced the number of cars circulating in traffic looking foravailable car parking spaces. The computerised traffic signal system (SCATS) now covers 320 junctions in the city centre and theinner suburbs. Dublin Corporation monitors traffic in a central control room using Closed Circuit Television (CCTV). A new trafficcontrol centre has also been installed by South Dublin County Council. Traffic cells and traffic calming are widespread.
Cycling: 160km of two-way cycle routes and 2,500 cycle parking spaces have been provided.
Factors Influencing Traffic Growth The main factors that influence growth in the demand for travel are economic growth, employment levels, car ownership,population and average household size.
Economic growth has an indirect influence on travel because it leads to higher employment levels and increased carownership. Also, people with higher disposable incomes tend to travel more for retail, leisure and recreation purposes,especially during off peak periods.
Employment is the most important single causal factor in the growth in the demand for travel, particularly in the criticalmorning peak hour. Travel surveys in 1991 and 1997 showed that over 90% of trips in the morning peak hour are trips fromhome to work or education. It follows that if there is an increase in the number of people in employment, there will be acorresponding increase in the demand for travel.
Car ownership affects both the total demand for travel and fundamental travel choices. Because car-based travel is generallymore convenient and comfortable than public transport, car-owners tend to travel more than others, especially in off peakperiods. There is a strong correlation between economic growth and growth in car ownership. As the economy grows, carownership grows. The growth in car ownership is slow at low levels of economic development, then rises steeply and finallylevels off at a high level of economic development because car ownership reaches saturation levels (ie when almost everyonewho has a driving licence owns a car).
Population has an obvious effect. If there are more people living in the area, then there will be more people travelling.
As the average household size decreases, (and the number of households correspondingly increases), there is anincrease in the demand for travel. Smaller households tend to have more trips per person than large households.
Review of Factors Influencing Traffic Growth 1991 to 1999The table shows the changes between 1991 and 1999 in the main factors that lead to a demand for travel.
Greater Dublin Area 1991 1996 1999Population (million) 1.35 1.41 1.46Households (‘000) 402 446 521Employment (‘000) 452 549 681Unemployment rate 16% 12% 6%Car ownership (per 1,000 population) 247 292 342% Growth in GDP since 1991 - 42% 79%
13

Growth to date has far outstripped the projections in the 1995 DTI Strategy:
• the population of the original DTI Area has grown more rapidly than was projected in the original DTI Strategy.
The population projected for 2001 was actually exceeded in 1997;
• GDP grew by 79% between 1991 and 1999, compared with a DTI forecast of 38%;
• the unemployment rate has already declined to less than 5% while DTI was forecasting a rate of 17% in 2001 and 12% in
2011;
• the number of employed persons projected for 2011 was exceeded in 1996;
• car ownership rates have substantially exceeded those projected and are steadily increasing towards the European average
of 450 per 1000 population. Car ownership per 1000 population was 292 in 1996 and 342 in 1999, far outstripping the
original DTI forecast of 288 for the year 2001;
• total passenger numbers through Dublin Airport in 2000 (13.8m) exceeded those originally projected for 2011 (11.0m), while the
annual tonnage throughput at Dublin Port in 2000 (21.0m tonnes) was almost twice the projected level for 2011 (10.7m tonnes).
The consequence of this unexpected growth is that Dublin has faced a rapidly increasing demand for travel, the scale of whichis illustrated in the following table:
Review of demand for travel 1991 – 1999 (Thousand person trips)1991 1997 1999
AM Peak Hour 172 250 283Off Peak Hour 107 157 179
Total peak hour trips increased by 78,000 or 45% between 1991 and 1997. However, the bulk of that growth has beenaccounted for by private car commuting (up by 71,000). In 1991, the private car accounted for 64% of peak hour trips; by1997 that had increased to 72%. The average journey time by car increased from 31 minutes in 1991 to 43 minutes in 1997,reflecting greater congestion and longer journeys.
In addition to overall growth, the Strategy will also have to take account of changing patterns of travel. A comparison of journeydestinations in the morning peak hour shows significant changes between the surveys carried out in 1991 and 1997. In the1991 survey, the city centre was the primary destination. The 1997 survey showed that:
• the city centre continues to be the most popular destination;
• the south-east inner city remains a primary and growing destination;
• the fastest growing destination is Clondalkin/Tallaght. There was almost a fourfold increase in morning peak hour car trips to
this area between 1991 and 1997 and it is now the second highest trip destination;
• Dublin Airport is a major destination for trips from all parts of the Greater Dublin Area;
• there is an extensive two-way trip demand between the western towns of Tallaght, Clondalkin, Blanchardstown and the
environs of Dublin Airport;
• other areas of growing importance as peak hour destinations include Ballsbridge, Sandyford and the area on the north
fringe of Dublin City and the south fringe of Fingal.
Forecast of Factors Influencing Traffic Growth 1999 to 2016The table shows the projected changes between 1999 and 2016 in the main factors that lead to a demand for travel.
Greater Dublin Area 1999 2016 GrowthPopulation (million) 1.46 1.75 20%Households (‘000) 521 675 30%Employment (‘000) 681 878 29%Unemployment rate 6% 5%Car ownership (per 1,000 population) 342 480 40%% Growth in GDP since 1991 79% 260% 4.2%pa
14

The projections of population and households are based on the Strategic Planning Guidelines. The projections for GDP,employment and unemployment are from the ESRI’s Medium Term Review. The forecast of car ownership is from the DTO’s carownership model, which is based on the correlation between car ownership and economic growth.
The first annual Review and Update of the Strategic Planning Guidelines indicates that the 2016 forecast of population wasconservative by at least 100,000 and the 2016 forecast of household numbers was conservative by up to 10%. Short termeconomic forecasts from several commentators and stockbrokers are higher than in the Medium Term Review. Overall, thissuggests that the above forecasts may be slightly conservative for the short-term future.
Forecast of demand for travel 1999 – 2016 (Thousand person trips)1999 2016 Growth
AM Peak Hour 283 488 72%Off Peak Hour 179 256 43%
By 2016, total peak hour trips are forecast to be 488,000, a 95% increase on the 1997 level. Total trips in the off peak hour in2016 will be 256,000. That is 6,000 trips more than was experienced in the peak hour in 1997. To take account of theuncertainty associated with long-term forecasts, two sensitivity analyses were conducted. In the first (high growth), the morningpeak hour demand was increased by 20% to 586,000 trips and in the second (low growth), it was reduced by 20% to390,000 trips. The central forecast was used to develop and test various options for transportation strategies. The high growthand low growth forecasts were then used to test the robustness of the final preferred DTO Strategy.
The ChallengeThe challenge for the DTO was to prepare a transportation strategy that meets the objectives derived from the Vision Statementand the additional objectives set by the Steering Committee and that supports the development objectives of the StrategicPlanning Guidelines. It needed to do so in the context of:
• slower than expected delivery of some of the major infrastructure projects recommended in the 1995 DTI Strategy;
• a rapid growth in population and households, leading to increasingly dispersed travel patterns;
• a substantial increase in employment leading to a large growth in the demand for travel in the peak hour;
• increasing car ownership resulting in additional commuting by car, which is economically inefficient and environmentally
unsustainable;
• an unprecedented and continuing high level of economic growth.
15

16
4. The Technical TasksThe development of an integrated, multi-modal transportation strategy for the Greater Dublin Area requires complex analysis.The DTO Strategy was developed with the aid of two complex analytical tools. First, the Trip Attraction / Generation Model(TAGM) takes land use and demographic forecasts for the region and calculates the resultant changes in the demand for travel.Second, the DTO Transportation Model analyses the interaction between the demand for travel and the supply of transportationinfrastructure and services. This chapter begins with a summary of the various technical tasks, which lead to the developmentof the final recommended strategy. It then goes on to describe these technical tasks in more detail, and the two models usedto carry out these tasks.
Summary of Technical TasksThe first step in the development of the Strategy was the updating of the DTO Transportation Model itself. This update began inautumn 1997 with a full set of origin / destination traffic surveys covering all motorised modes of transport (car, bus, rail andheavy goods vehicles). The results of this survey were used to update the travel patterns and levels of demand for travel withinthe model for the 1997 base year. Following this, up to date data on the transportation infrastructure both constructed andcommitted (LUAS, M50 completion etc) was entered into the model.
The model update also included the collation of the latest economic, demographic and land use data and forecasts. Thesewere input into the TAGM to produce forecasts of the demand for travel in the main forecast year, 2016.
With the 1997 base model and forecasts of the future situation established, development of a transportation strategycommenced. The first step in the development of the strategy was the creation and testing of a Do-minimum scenario. The Do-minimum is the base case against which possible strategies are assessed. This scenario, as expected, demonstrated severecongestion levels and did not provide a viable transportation solution.
The next step was to identify a suitable methodology for developing transportation strategies. Three approaches were assessedusing the DTO Model, namely a bottom-up approach, a middle-road approach maximising the use of existing transportnetworks and a top-down approach. These are all described later in more detail. The top-down approach – using a conceptual‘Higher Mode’ public transport network was identified as the most desirable and sound method of creating strategies forassessment. This approach enabled demand for public transport to be identified on each transportation corridor. Differentpublic transport modes, with different passenger carrying capabilities were then applied to these transportation corridorsdepending on the range of passenger flows shown by the model. From this analysis, it became evident that a high capacitypublic transport system would be required for any proposed strategy to work. Further analysis revealed the necessity for someform of demand management to enhance the public transport usage and to reduce congestion.
The strategy development phase concentrated on developing three different themes. From these three themes, a strategyevolved. This strategy encompassed the best elements of the three transportation themes and took account of the strategic railand bus studies (described in Chapter 1). Further refinements to the strategy followed, including introducing park and ride /feeder bus options, rail alignment testing (ie best alignment to serve Dublin Airport), reducing the demand for travel on the M50and introduction of the Eastern By-pass.
The preferred strategy then could be put forward for multi-criteria assessment along with another strategy, similar to thepreferred strategy, but based primarily on the strategic rail study. In this strategy, the METRO system is replaced with heavy railextensions because of the large capital cost associated with the METRO system. The multi-criteria assessment came out infavour of the preferred Strategy on the basis of the large benefits attained.
Sensitivity testing of the Preferred Strategy followed to assess its robustness if economic growth was lower than anticipatedand if it did not include demand management measures.
In the remainder of this chapter a brief description is given of the two models used (the TAGM and the DTO TransportationModel). This is followed by a more detailed description of the technical tasks undertaken and the various phases in thedevelopment of the final preferred strategy.
Trip Attraction / Generation Model – TAGMThe trip attraction / generation model (TAGM) is a spreadsheet type model that is used to predict trends in the growth ofdemand for travel within the Greater Dublin Area. It provides trip growth predictions for the main target forecast year, 2016, andan intermediate year, 2006. The TAGM requires data from three primary sources: population, employment and education. Anestimate of these figures for each zone within the model was made for the years 1996 and 2016. These estimates werefactored to ensure that the overall totals of population and employment for the Greater Dublin Area agreed with the predictionsmade in the Strategic Planning Guidelines.
PopulationThe 1996 data on population and numbers of households for each zone were taken from the 1996 census. Projections forpopulation and households for 2016 were made using the development plans supplied by the seven local authorities in theGreater Dublin Area and estimates of population growth for the region from the Strategic Planning Guidelines.
EmploymentThe baseline data on zonal employment was taken from the 1991 census. In 1996, the planning consultants McHugh andAssociates updated the employment figures to 1996 levels using data from the seven local authorities and CSO labour forcesurveys. Projections of zonal employment for 2016 were based on the level of available zoned development land and otherrelated information supplied by the seven local authorities.
The local authorities, in assessing future employment generation by land use zoning used the following guideline figures:
Industry – 100 jobs per hectareOffices – 1 job per 17sq.mShops – 1 job per 23sq.m
Both industry and shopping were assumed to increase by 1% per annum over the 20-year period.
EducationInformation on primary schools, secondary schools and universities was obtained from the Department of Education.
Strategic Planning GuidelinesThe projected figures for population and employment as set out in the Strategic Planning Guidelines were used as control totalsand the projected zonal growth factors were amended accordingly. Sixty percent of the total growth to 2016 was assumed totake place by 2006.
Using the demographic inputs to produce trip growth factorsThe TAGM – which is a sub model of the DTO Transportation Model – takes as its inputs the population, household, schoolsand employment data for each District Electoral Division (zone) for the base year, 1996, and the forecast year, 2016. The totaltrip generations and attractions for each zone – as taken from the validated base year model – are also input for each zone. Adivision of trip generations by the population figure gives the base year trip generation rate per person for each zone. Similarly, adivision of trip attractions by the employment figure gives the base year trip attraction rate per job for each zone. Using theserates as a basis, the TAGM calculates the growth in trip generations based on the growth in population and the growth in tripattractions based on the growth in employment between 1996 and 2016 for each zone. As school trips are known tocontribute up to 20% of all morning peak hour trips, any growth in full time school places is also factored into the projected tripgrowth rates for each zone.
Additional inputs into the TAGM such as economic growth (GDP) and car ownership forecasts are used to determine theproportion of forecast year (2016) trip makers who will have a car available to them. The main outputs from the model are tripgeneration and attraction growth factors for 2016 for car available trips and car not available trips for each zone.
Based on the assumption that 60% of the predicted growth (1996 to 2016) will take place in the first 10 years, the TAGM alsooutputs trip growth factors for 2006.
17

DTO Transportation Model The DTO Transportation Model was the principal design and analysis tool used in the development of the final recommendedtransportation strategy. This model is based on the original traffic model developed as part of the DTI study 1991 to 1994. Thismodel uses the SATURN software for analysis of highway traffic (cars and heavy goods vehicles) and SATCHMO software forthe analysis of public transport. Two separate travel periods were modelled – ie the morning peak hour between 08:00 and09:00 and a representative off peak period between 14:00 and 15:00.
The model has a number of strengths that make it well suited to carrying out this type of strategic transportation analysis.Among these are:
• the model is multi-modal and encompasses all motorised modes of surface transport (car, heavy goods vehicles, bus and
rail);
• the highway assignment model (SATURN) takes full account of junction delays caused by congestion and the impacts of this
congestion on bus travel;
• unlike many fixed mode-split models, it establishes a realistic mode choice based on the relative perceived costs of a given
trip by the modes available to the trip maker. In performing this mode split, the cost of trips by car varies with the level of
congestion on the highway network;
• the model covers the entire DTO Area and takes into account trips to and from regions of the country outside this area;
• the zoning system used to aggregate trips is based on the District Electoral Divisions (DEDs) but uses much finer zones in
the city centre (inside the canal ring) where the transportation networks are much denser.
The model has some restrictions and limitations that affect the form and extent of the analysis which can be undertaken – inparticular the way it models trips by public transport. No facility exists within the model for public transport interchange betweenbus and rail, and all public transport trips are modelled as complete trips from origin to destination on a single mode. Tocompensate for this, interchange trips are included in trip demand levels for both bus and rail modes that are input into themodel. The model places no capacity restraint on the public transport (bus and rail) networks. It assumes that the publictransport service provided will cater for all trip demand on these services. Public transport passenger flows predicted by themodel are therefore demand flows rather than actual flows. Given that an objective of the strategy is to provide adequatecapacity for all journeys to work and education, it is acceptable to use demand flows when designing a future public transportnetwork. Trips are assigned to public transport routes on an all or nothing basis – ie following the mode split, all public transporttrips between a particular origin and a particular destination will be assigned to a single lowest cost route. This can mean thatwhere parallel bus or rail routes exist in close proximity, the model will sometimes assign most trips to one or other of the routesrather than give a more realistic split of trips on each. However, this limitation does not cause a problem for the vast majority ofpublic transport trips where a clearly defined preferred bus or rail route exists.
In practice, all models have limitations; they attempt to represent only part of reality, and at all times the outputs from modelsmust be interpreted in the light of these limitations and assumptions. Once the limitations and assumptions of the model arerecognised, its strategic nature, the fact that it is multi-modal and the area it covers, then it can be accepted as an eminentlysuitable tool for developing the final transportation strategy.
18

DEVELOPMENT OF PREFERRED STRATEGY USING THE DTO MODELThe technical tasks undertaken using the DTO Transportation Model are illustrated in figure 4.1. The tasks are grouped into thefollowing six phases:
Phase 1: Updating the DTO Transportation Model;Phase 2: Forecasting future growth in trip demand;Phase 3: Development of Do-minimum and Do-Strategic Planning Guidelines scenarios;Phase 4: Identification of methods for strategy development;Phase 5: Strategy development;Phase 6: Preferred strategy identification;Phase 7: Sensitivity testing of the preferred strategy;
Phases 1 to 7 are described in detail below.
Phase 1: Updating of the DTO Transportation ModelBefore the DTO Model could be used to develop the Strategy, the first priority was to update it to reflect current trip patternsand levels of trip demand. For a model of the size and complexity of the DTO Model, this update process is a lengthyprocedure and is normally carried out every 5 years. The model had not been updated since the DTI study (1992), and henceit was appropriate that a full update be carried out in 1997. The process began with a major multi-modal origin and destinationsurvey that was carried out by the DTO in October and November 1997.
The results of this survey were coded into the model, and the outputs from the updated model were checked against surveyed1997 traffic counts and passenger movements – a process known as model validation. Criteria were established to measure‘goodness of fit’ of modelled data to actual surveyed data. Among these, a statistical measure known as *GEH error was usedto measure the overall fit of modelled traffic flows against actual flows. Following the validation procedure, the average GEHerror for the DTO model was 5.5, representing an excellent fit of modelled and actual flows for a strategic model of this size.Similar ‘goodness of fit’ criteria were also established for modelled versus actual bus and rail flows and modelled versus actualjourney times on all major routes into the city. In each case, the model was shown to be an accurate representation of Dublin’speak and off peak traffic in the 1997 base year.
The summary outputs from the new 1997 model – in terms of trips by mode in the morning peak hour is shown in table 4.1below. The table also compares peak hour trip demand with the situation in 1991.
Table 4.1: Peak Hour Trip Demands for 1991 and 1997
Transport 1991 1991 1997 1997 % Increase % ChangeMode Person Mode Person Mode Since In Mode
Trips Share Trips Share 1991 Share(‘000s) (%) (‘000s) (%)
Car 110 64% 181 72% 64% +8%Bus 44 25% 47 19% 7% -7%Rail 18 11% 22 9% 22% -1%Total 172 250 45%
Table 4.1 shows that overall trip demand increased by 45% between 1991 and 1997, with by far the largest growth (64%) being intrips by car. There was also significant growth in trips by rail, but the bus mode, while showing a modest growth in absolute terms,experienced a significant loss in market share. Overall, there was an 8% shift in the modal split to the car mode.
19
*In measuring the ‘goodness of fit’ of modelled (m) to observed (o) traffic flows, the GEH statistic is defined as follows: (o-m)2 / 1_2 (o+m)

20
Figure 4.1 DEVELOPMENT OF UPDATE STRATEGY - METHODOLOGY

Other headlines to emerge from the 1997 survey were:
• there was a large increase in the percentage of car trips from home to school in the morning peak from 3% in 1991 to 19%
in 1997;
• the southeast quadrant of the inner city is by far the largest attractor of trips in the morning peak with a doubling of trips to
this sector since 1991;
• there is now a large orbital trip movement between the three western towns and Dublin Airport, and the Tallaght area is now
a major destination in the morning peak (this was not the case in 1991).
Phase 2: Forecasting future growth in tripsFollowing the update of the model to a 1997 base year, the next technical task was to produce trip growth forecasts for 2006and 2016. This was done using the Trip Attraction / Generation Model (TAGM). The TAGM used various macro economic,demographic and land use data to produce trip growth forecasts. The outputs from the TAGM are in the form of a set of tripgrowth factors (generation and attraction factors) for each zone. Where zones have a well-defined distribution of trip attractionsor generations in the base year, these growth factors are easily applied to the base year figures to give future trip patterns andlevels of demand for travel in 2006 and 2016 (for the peak and off peak periods). In the case of significant new developmentsin existing "green field" zones, the distribution of trip attractions or generations is based on the pattern in a neighbouring zonewith existing similar land uses.
A most significant prediction to emerge from this process was that overall levels of trip demand for the region in the morningpeak hour would almost double (to 488,000 trips) by 2016.
Phase 3: Development of Do-minimum and Do-Strategic Planning GuidelinesDo-minimum Transport NetworkFollowing the development of trip forecasts for 2006 and 2016 using the TAGM, forecast year transport networks weredeveloped and the DTO Model was used to analyse the interaction between the demand for travel and the supply oftransportation infrastructure. Initially, transport networks (highway, bus and rail) were produced for the forecast year, 2016.These networks include all schemes that were committed in the base year (1997) but not yet constructed. This is called theDo-minimum scenario and includes the following:
• LUAS line from Tallaght to Connolly Station;
• LUAS line from Sandyford to St. Stephen’s Green;
• the completed M50 motorway;
• the Dublin Port Tunnel,
• 11 Quality Bus Corridors.
• DART extension to Malahide and Greystones,
• Upgrade of Maynooth line from Clonsilla to Connolly,
• Lengthening of platforms and additional DART and diesel rail-cars
This Do-minimum scenario is the foundation for the development of all future strategic networks. The effects of the Do Minimumscenario in the 2016 morning peak were analysed using the DTO Model, and the main mode split outputs are shown in Table 4.2.
Table 4.2: Modal Split Results for 2016 Do-minimum Scenario
Mode of Person Trips PercentageTransport (‘000s) of Total TripsCAR 316 65%BUS 97 20%RAIL 75 15%TOTAL 488 100%
21

Results of the Do-minimum ScenarioThe proposed transportation projects such as LUAS, the completed M50 motorway and the Dublin Port Tunnel included in theDo-minimum scenario will accommodate some of the anticipated future growth in travel. This is reflected in significant increasesin travel in the Do-minimum scenario relative to the 1997 base year. However, because of the huge increase in overall tripdemand, there would be a demand for an additional 135,000 trips by car and this would lead to severe congestion on thehighway network. The average speed on radial routes into the city in the morning peak would be down to 8kph – a little abovea fast walking pace. It is clear, therefore, that a major transportation deficit will exist in 2016 unless further transportationinfrastructure is provided and measures to reduce car travel are introduced.
The severe congestion on the transport networks in the Do-minimum scenario causes a diversion of trips from routes that arenormally shortest and quickest to routes that involve significant detours avoiding congested areas. Consequently, the actualtravel pattern is not very representative of the desired travel pattern. The Do-minimum scenario, therefore, does not point theway towards the development of a future transportation strategy. The Do-minimum scenario, however, does establish abenchmark against which the performance of future transportation proposals can be judged. The Do-minimum approach isused as a basis for comparison with ‘Do-Something’ proposals. The main rail, QBC and road network proposals for the Do-minimum scenario are shown in figure 4.2.
22
Figure 4.2 DO-MINIMUM

Do Strategic Planning GuidelinesAs the land use patterns for 2016 in the DTO Model are based on the Strategic Planning Guidelines (SPGs), it was appropriatethat the main transportation recommendations in the SPGs be modelled and assessed. The main rail, QBC and road networkproposals for the Do Strategic Planning Guidelines scenario are shown in figure 4.3. This model run (called Do-SPG) containsthe following additions to the Do-minimum scenario:
• LUAS lines D and E (Ballymun to Broadstone and Broadstone to St Stephens Green);
• M50 enhancements;
• dualling the N2 and N3;
• Macken Street Bridge;
• Phoenix Park Rail Tunnel;
• rail line to Navan;
• additional QBCs and extensions of existing QBCs;
Though other transport concepts and transportation corridors were identified in the Strategic Planning Guidelines, these werenot identified as specific proposals and hence could not be included in the transport networks as coded for this scenario test.
23
Figure 4.3 DO-STRATEGIC PLANNING GUIDELINES
Results of the Do Strategic Planning GuidelinesThe transportation recommendations in the Strategic Planning Guidelines relate to a settlement pattern of population andemployment in the Greater Dublin Area and do not attempt to be a transportation strategy for the Metropolitan Area orHinterland Area. Hence, it was not expected that they would represent an overall transportation strategy. However, the testquantified the beneficial effects of the recommendations in the Guidelines. These were shown in terms of significant increasesin trips by rail (37,000 trips) and a small reduction in trips by car (4,000 trips).
Phase 4: Identification of Methods for Strategy Development IntroductionThe key concept that guided the development of the future transportation strategy was that a viable alternative to the private car isessential to the achievement of sustainable urban travel. This concept, translated into a more concrete form, implies:
• the provision of a quality public transport system that is within walking distance of the origins and destinations of the
majority of trips in the urban area (ie a "walk & ride" network);
• the development of a comprehensive cycle network designed to encourage greater use of bicycles;
• the improvement of pedestrian facilities to create a safer walking environment for short journeys to work, school or shops
and for access to public transport.
These three elements, together with the private car, would provide a real choice of travel mode and would facilitate thesustainable management of future travel.
Three different approaches were tried:
• "Bottom-Up"
• "Middle-Road" - maximum exploitation of existing networks
• "Top-Down".
The ‘Bottom–Up’ ApproachThe ‘Bottom-Up Approach’ was the first method tried. This method attempted to build up from the Do-minimum scenario todevelop a multi-modal strategy. Public transport lines were incrementally added to the existing networks (light rail, heavy rail andbus). This approach has the advantage that it mirrors the manner in which any eventual strategy would be practicallyimplemented over time.
Several transport networks were constructed by systematically adding light rail and heavy rail lines to the Do-minimum network, andthese networks were tested using the DTO Model. However, none of these tests represented a transportation solution and thismethodology proved unsatisfactory as a development tool for arriving at the final recommended strategy for the following reasons:
• the Do-minimum starting point represents a very congested network causing trip makers to make large diversions from
‘ideal’ routes and hence the travel patterns are not representative of desired travel patterns;
• given that the Do-minimum scenario does not represent desired travel patterns, it is impossible to clearly establish where
public transport lines (light rail, heavy rail or bus) should be incrementally added to eventually lead to a satisfactory solution.
The ‘Middle-Road Approach’ - Maximum exploitation of existing networksGiven the difficulties encountered with the ‘Bottom-Up’ approach outlined above, other methodologies for strategy building weredeveloped. The next method tried was to take the Do-minimum road and rail networks and to test whether a majorenhancement of the bus system could deal with the anticipated demand. This approach represented a ‘middle road’ in that theexisting networks were accepted and exploited to the maximum.
This comprehensive bus option assumed a dense network of bus routes that would satisfy the ‘walk & ride’ criterion. Thenetwork contains 4 orbital and 15 radial Quality Bus Corridors with a comprehensive range of frequent bus services on eachroute allowing most trips to be made with, at most, one interchange. The DTO Transportation Model was used to analyse theperformance of this scenario.
The main mode split outputs from the comprehensive bus scenario in the morning peak 2016 are shown in Table 4.3.
24

Table 4.3: Modal Split Results for ‘Comprehensive Bus’ scenario
Mode of Person Trips PercentageTransport (‘000’s) of Total TripsCAR 280 57%BUS 124 26%RAIL 84 17%TOTAL 488 100%
The assessment of the ‘Comprehensive Bus’ Scenario showed the importance of a public transport system that offerscomprehensive coverage over a wide area. Such a bus network would attract significant transfers from the car mode.
Examination of the passenger flows on the main orbital and radial bus routes shows that many of the radial bus routes wouldbe well over capacity – particularly as they approach the city centre. To cater for the passenger demand on the main radialroutes would require the operation of double deck buses each carrying 80 passengers at 30-second headways. In such ascenario, passenger loading at bus stops would be so heavy that buses would be unable to deal with passengers boardingand preserve the headway of the service between them. In addition, the physical infrastructure required for such a frequency ofbuses would greatly reduce road capacity for cars and goods vehicles and average radial speeds for these vehicles enteringthe city would be similar to the Do-minimum situation (8kph). In summary, the analysis of the ‘Comprehensive Bus’ scenario established that buses alone could not address the problembecause in many of the main transportation corridors the bus mode cannot provide the necessary capacity to cope with theforecast demand. However, the assessment showed that if the bus network were more comprehensive than currently and if itoffered extensive coverage over the Greater Dublin Area, it would be well used and it would attract significant transfers from car.
The ‘Top-Down’ Approach Though the ‘Comprehensive Bus’ scenario did not deliver a satisfactory strategy for Dublin’s future transportation requirements,it did provide a public transport network with comprehensive coverage over the Greater Dublin Area and hence attractedconsiderable modal shift from car to bus. This realisation of the importance of such a comprehensive public transport network,and the failure of the ‘Bottom Up’ approach led to the devising of a third approach to the development of the strategy.
The starting point, again, for this third method was that an extensive public transport network was required to meet the ‘walk &ride’ criterion. If this network had the same comprehensive coverage as the ‘Comprehensive Bus’ network but was assumed tobe of high quality with no capacity limitations, it would represent an ‘ideal’ travel network where all trips take place in the mostefficient manner and in the shortest time. The assignment of future trip making onto such a theoretical network should,therefore, reveal the most desirable pattern of travel and clearly identify the real level of trip demand on each link in the network.The assignment of trips onto this theoretical ‘higher mode’ network, using the DTO Transportation Model, produced a clearpicture of the levels of demand throughout the Metropolitan Area. For the purposes of this ‘top down’ approach the entire‘higher mode’ network as modelled is assumed to have the characteristics of a heavy rail or METRO type system. In practice,the levels of passenger demand output by the model would not justify building such a tight mesh of heavy rail or METRO linesinvolving hundreds of kilometres of rail. In reality, a mix of public transport modes – including quality bus and light rail - wouldrepresent a more realistic network.
Hence, the next stage of the ‘Top-Down’ approach was to use the information provided by the analysis of the ‘higher mode’network to derive more realistic transport networks that would represent a transportation solution. Using this information fromthe ‘higher mode’ analysis as a base, and using the capacity ranges of various transport modes, parts of the network that hadsimilar capacity requirements were identified and linked up to form transport routes or corridors. In this way the appropriatenetworks for DART, LUAS and Quality Bus Corridors, as well as a new segregated rail system (METRO), were established.These public transport networks were then tested using the DTO Model.
The following were the principal findings and conclusions of the modelling analysis using the ‘Top-Down’ approach.
• The "higher mode" network tested in the ‘Top-Down’ approach satisfied the ‘walk and ride’ criterion. Such a high quality,
high capacity public transport network would provide a viable alternative to the car for most trips and hence would attract
large volumes of car users onto more sustainable modes.
25

• In general, any public transport system – even the comprehensive one as tested – will be perceived as inferior to the car mode
for people with the option of using the car. This is because of issues of comfort, convenience and flexibility. It is only when
traffic congestion increases and the generalised cost of travelling by car is significantly higher than the generalised cost of the
public transport alternative that people will begin to choose the public transport option. Though the "higher mode" network
attracts a significant number of car users onto public transport, this mode shift is largely due to the presence of traffic
congestion, and hence by definition the highway network will still remain congested. Given the objective of reducing highway
congestion to 1991 levels, it is clear that the provision of the additional public transport infrastructure alone will not be
sufficient, and that some form of demand management for car trips is necessary to control highway congestion.
• Rather than devise the precise nature of the mechanism for demand management at this stage, what is required for the
modelling analysis is to set a target level of congestion that is considered acceptable. This in turn sets a limit on the number
of car trips on the road network. It follows then that the remaining trip demand must be catered for by alternative modes.
Later in the analysis, a sensitivity test was carried out to see the impacts on congestion and public transport patronage of
reducing the demand management measures.
• In 1991, the average travel speed on the main traffic routes within the Metropolitan Area was in the order of 22kph. The
equivalent figure for the 1997 base year was 14kph and with continued growth in car travel since 1997, the current average
speed is still lower. Current road conditions are not perceived by the general public to be satisfactory, so some improvement
in travel speed (as a proxy for reduced congestion) must be assumed in any future strategy.
• Planning for a reduction in road congestion was therefore established as a basic principle for future transportation planning
in Dublin.
• For the purposes of analysis and network development, an average road travel target speed of 20kph was assumed. It
should be noted that, coincidentally, this improvement in road speed requires the number of trips on the network to be
equivalent to the 1997 morning peak figures. The highway improvements proposed ensure that the 1997 level of trips on the
network can be accommodated at an average speed of 20kph. The rise in average speed is due to the increase in road
capacity provided by the Dublin Port Tunnel, the Eastern By-pass and the upgrade of the M50.
• Taking the 1997 level of morning peak hour car trips (181,000) as a limit, the public transport network must carry all
remaining trips and this network will have to cater for all additional future growth in travel demand.
• At a later stage in the analysis, a sensitivity test was carried out to test the robustness of the final strategy to reductions in
motorised travel demand because of increases in cycling, walking, teleworking etc. The sensitivity of the strategy to the
assumed travel speed of 20kph was also tested at that stage.
Phase 5: Strategy DevelopmentIntroductionThe DTO Transportation Model was used to assign the travel demand to the theoretical public transport network using a proxyfor demand management. This proxy (which will be described in more detail later) effectively penalised all car trips on thehighway network and had the effect of limiting car trips to 1997 levels. This reduced highway congestion to 1991 levels(because of the improved road network) and identified the number of trips that each transportation corridor of the publictransport networks would be required to carry.
The range of trip levels on each transportation corridor immediately indicated a need to consider a full hierarchy of publictransport modes from conventional bus at the lower end to heavy rail at the upper end. The following public transport modeswere considered in developing the public transport network:
• bus and Quality Bus Corridors;
• LUAS (surface running light rail);
• METRO (ie light rail that is completely segregated along its alignment);
• DART / Heavy Rail.
26
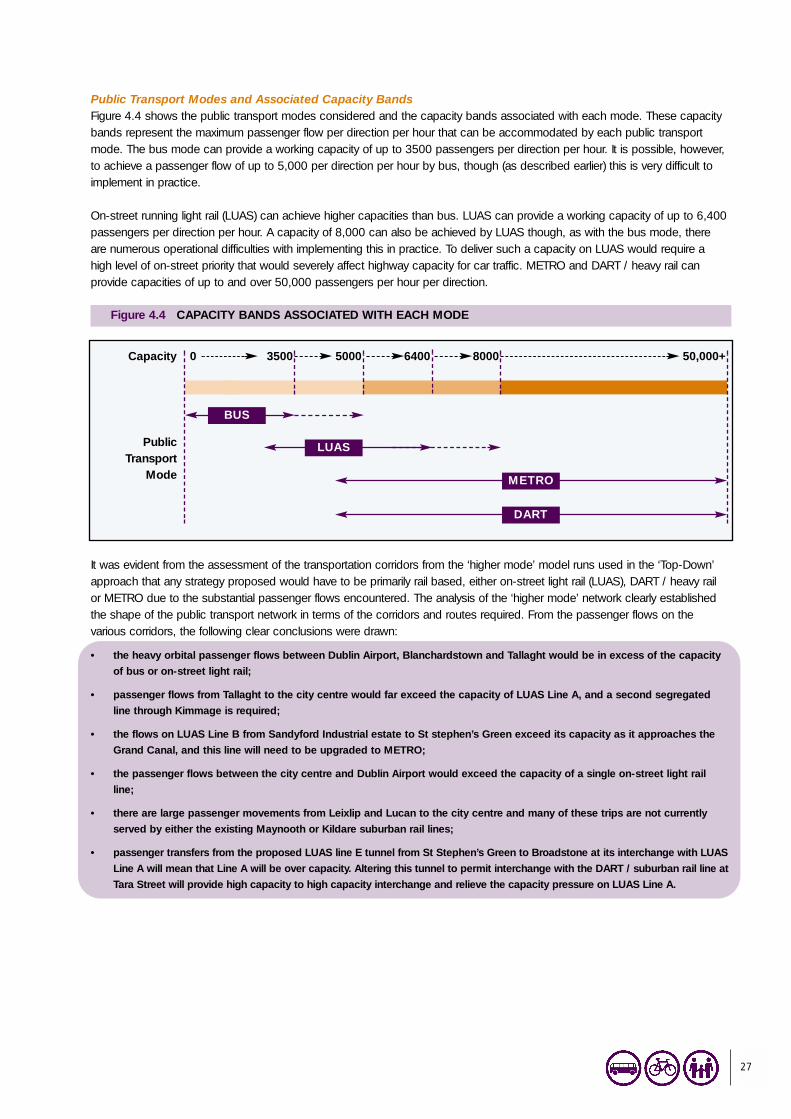
Public Transport Modes and Associated Capacity BandsFigure 4.4 shows the public transport modes considered and the capacity bands associated with each mode. These capacitybands represent the maximum passenger flow per direction per hour that can be accommodated by each public transportmode. The bus mode can provide a working capacity of up to 3500 passengers per direction per hour. It is possible, however,to achieve a passenger flow of up to 5,000 per direction per hour by bus, though (as described earlier) this is very difficult toimplement in practice.
On-street running light rail (LUAS) can achieve higher capacities than bus. LUAS can provide a working capacity of up to 6,400passengers per direction per hour. A capacity of 8,000 can also be achieved by LUAS though, as with the bus mode, thereare numerous operational difficulties with implementing this in practice. To deliver such a capacity on LUAS would require ahigh level of on-street priority that would severely affect highway capacity for car traffic. METRO and DART / heavy rail canprovide capacities of up to and over 50,000 passengers per hour per direction.
It was evident from the assessment of the transportation corridors from the ‘higher mode’ model runs used in the ‘Top-Down’approach that any strategy proposed would have to be primarily rail based, either on-street light rail (LUAS), DART / heavy railor METRO due to the substantial passenger flows encountered. The analysis of the ‘higher mode’ network clearly establishedthe shape of the public transport network in terms of the corridors and routes required. From the passenger flows on thevarious corridors, the following clear conclusions were drawn:
• the heavy orbital passenger flows between Dublin Airport, Blanchardstown and Tallaght would be in excess of the capacity
of bus or on-street light rail;
• passenger flows from Tallaght to the city centre would far exceed the capacity of LUAS Line A, and a second segregated
line through Kimmage is required;
• the flows on LUAS Line B from Sandyford Industrial estate to St stephen’s Green exceed its capacity as it approaches the
Grand Canal, and this line will need to be upgraded to METRO;
• the passenger flows between the city centre and Dublin Airport would exceed the capacity of a single on-street light rail
line;
• there are large passenger movements from Leixlip and Lucan to the city centre and many of these trips are not currently
served by either the existing Maynooth or Kildare suburban rail lines;
• passenger transfers from the proposed LUAS line E tunnel from St Stephen’s Green to Broadstone at its interchange with LUAS
Line A will mean that Line A will be over capacity. Altering this tunnel to permit interchange with the DART / suburban rail line at
Tara Street will provide high capacity to high capacity interchange and relieve the capacity pressure on LUAS Line A.
27
Capacity 0 3500 5000 6400 8000 50,000+
PublicTransport
Mode
BUS
LUAS
METRO
DART
Figure 4.4 CAPACITY BANDS ASSOCIATED WITH EACH MODE

Using these general conclusions, three separate themes were developed to deliver the required rail network using differentcombinations of rail modes. Common to each theme is a METRO loop linking Finglas, Blanchardstown, Clondalkin and Tallaghtand linking both Finglas and Tallaght back into the city centre. The light rail line from Sandyford Industrial Estate to Dublin Airportis upgraded to METRO in each theme. Each theme includes the same highway improvements and greatly enhanced QBC andbus networks, which are shown in figure 4.5. The three themes are as follows:
Theme 1: METRO This theme mainly uses METRO lines to achieve the required rail network. The theme contains a METRO line from Leixlipthrough Lucan, Dolphin’s Barn, Heuston Station and continuing underground through the south inner city to link with TaraStreet. Harcourt Street, Heuston, Broadstone and Tara Street are all joined by an underground section of METRO in the citycentre. The network is shown in figure 4.6.
Theme 2: Heavy RailThis theme uses significant enhancements, extensions and additions to the existing heavy rail network – including an undergroundinter-connector in the city centre linking Heuston Station, Pearse Station and East Wall (taken from the Strategic Rail Study,described earlier). In addition, it contains the eastern rail connection from Dublin Airport to the Northern Suburban line and afurther new rail connection between the Maynooth and Kildare lines west of Lucan. The network is shown in figure 4.7.
28
Figure 4.5 QBC + ROADS IMPROVEMENTS (COMMON TO ALL STRATEGIES)

29
Theme 3: On-Street Light RailThe main focus of this theme is the extensive use of on-street light rail as distinct from heavy rail or METRO. The themecontains both METRO and light rail connections to Dublin Airport with the light rail line continuing on to Swords. A light rail linefrom Leixlip, through Lucan runs parallel to LUAS Line A south of the Liffey and joins Line A via East Link Bridge. Another lightrail line from South Clondalkin penetrates the south inner city using the canal ring and meets up with LUAS Line A via MackenStreet Bridge. The network is shown in figure 4.8.
General Findings from the Theme Tests 1, 2 and 3As the three rail themes 1, 2 and 3 deliver similar transport networks using different combinations of rail modes, the generalimpacts of all three are similar. All three strategies satisfy the ‘walk and ride’ criterion, limit car trips to 1997 levels and generallyreduce highway congestion to 1991 levels. However, in all three strategies the M50 is quite severely congested – particularlybetween the Naas Road (N7) and Ashbourne Road (N2) junctions - and there are large queues on some national primaryroutes approaching the M50 in the inbound direction. In addition to these general findings, each strategy has its own strengthsand weaknesses as described below.
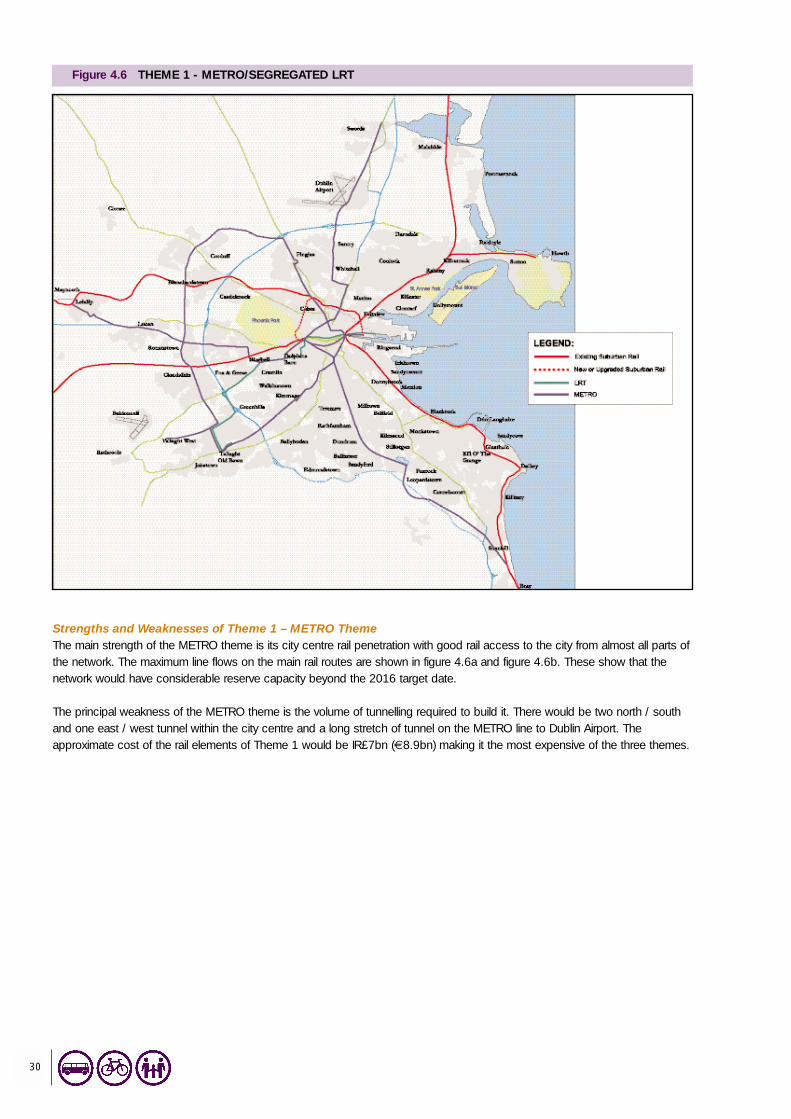
Strengths and Weaknesses of Theme 1 – METRO Theme The main strength of the METRO theme is its city centre rail penetration with good rail access to the city from almost all parts ofthe network. The maximum line flows on the main rail routes are shown in figure 4.6a and figure 4.6b. These show that thenetwork would have considerable reserve capacity beyond the 2016 target date.
The principal weakness of the METRO theme is the volume of tunnelling required to build it. There would be two north / southand one east / west tunnel within the city centre and a long stretch of tunnel on the METRO line to Dublin Airport. Theapproximate cost of the rail elements of Theme 1 would be IR£7bn (€8.9bn) making it the most expensive of the three themes.
30
Figure 4.6 THEME 1 - METRO/SEGREGATED LRT
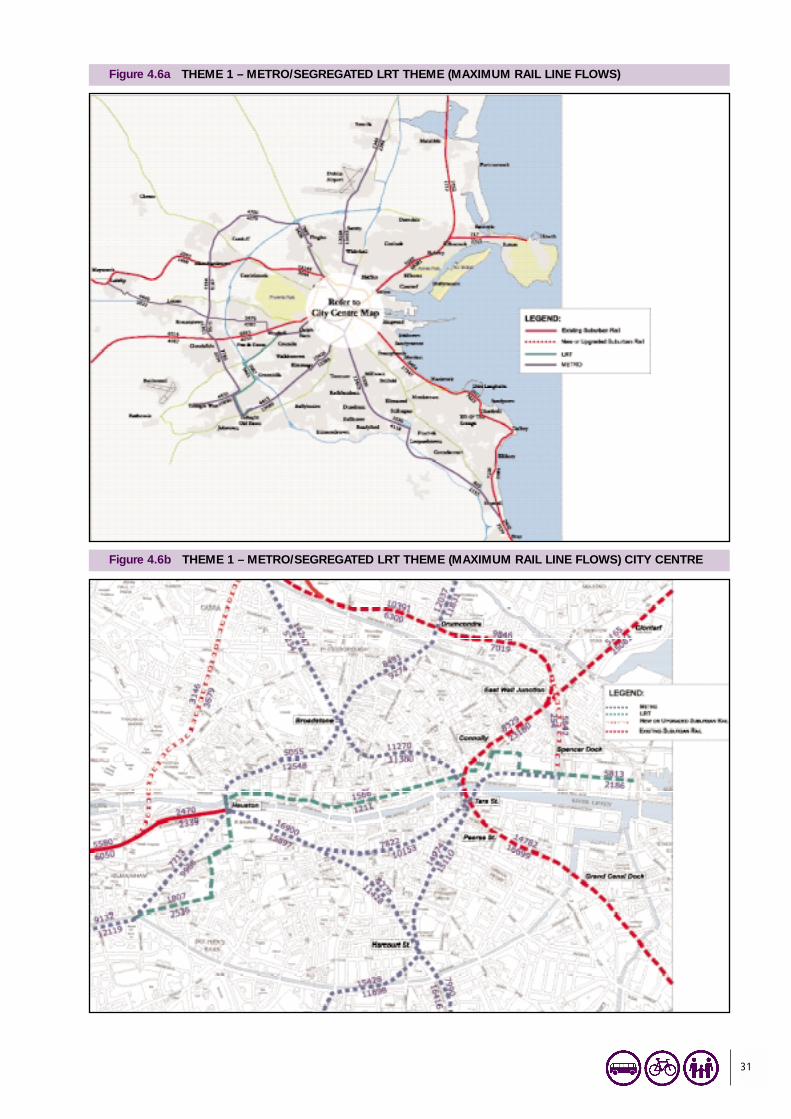
31
Figure 4.6a THEME 1 – METRO/SEGREGATED LRT THEME (MAXIMUM RAIL LINE FLOWS)
Figure 4.6b THEME 1 – METRO/SEGREGATED LRT THEME (MAXIMUM RAIL LINE FLOWS) CITY CENTRE

Strengths and Weaknesses of Theme 2 – Heavy Rail ThemeThe main strength of the Heavy Rail Theme is that it builds on the existing heavy rail network with extensive enhancements,extensions and additions. The underground inter-connector between Heuston and East Wall links the existing Northernsuburban, Maynooth and Kildare lines and hence allows a large number of route and service variants to be provided on the rail network.
The maximum passenger flows for each of the main rail lines in Theme 2 is shown in figure 4.7a and figure 4.7b. These showlow passenger demand in the Phoenix Park Tunnel, with the inter-connector being by far the preferred route for passengers onthe Kildare line.
There are two principal weaknesses of the Heavy Rail Theme:
• though there is an orbital rail link between the Maynooth and Kildare lines west of Lucan, this is not the most efficient or
direct way of servicing the strong trip demand from Lucan and other western areas;
• the heavy rail service to Dublin Airport via an eastern connection to the northern suburban line attracts very poor passenger
demand and is clearly not the preferred option for serving the Airport.
The approximate cost of the rail elements of Theme 2 would be IR£6bn (€7.6bn).
32
Figure 4.7 THEME 2 – SUBURBAN RAIL THEME

33
Figure 4.7b THEME 2 - SUBURBAN RAIL THEME (MAXIMUM RAIL LINE FLOWS) - CITY CENTRE
Figure 4.7a THEME 2 - SUBURBAN RAIL THEME (MAXIMUM RAIL LINE FLOWS)

34
Strengths and Weaknesses of Theme 3 – Light Rail ThemeThe Light Rail Theme provides a very dense and highly accessible (particularly in the city centre) mesh of rail lines. There aremany more stops on this network than is the case with either of the other two themes and hence more people are within easywalking distance of a rail service. Because no tunnelling would be required, this scenario would be the least expensive to buildwith an indicative cost of IR£4.7bn (€6.0bn). In addition, because no additional tunnels are required, Theme 3 would bedeliverable in less time than the other two themes.
The maximum passenger flows on the principal rail lines for Theme 3 are shown in figures 4.8a and 4.8b. These show that withthe exception of the line to Dublin Airport, all on-street light rail lines are within capacity.
There are two principal weaknesses of the Light Rail Theme – namely:
• there would be three (LUAS Line A and two others) parallel on-street light rail lines running West / East across the city
centre in close proximity to each other. In practice, it would be very difficult to obtain the road space to construct such a
tight mesh of lines on city centre streets;
• though (as stated above) all but one of the lines are within capacity, some lines are close to the capacity limit for on-street
light rail. Hence, the network as a whole would have limited reserve capacity beyond the 2016 target date.
Overall, the clear finding from the three theme tests was that some combination of all three with some refinements andimprovements would represent the final preferred strategy.
Figure 4.8 THEME 3 - ON STREET LRT

35
Figure 4.8a THEME 3 – ON STREET LRT THEME (MAXIMUM RAIL LINE FLOWS)
Figure 4.8b THEME 3 – ON STREET LRT (MAXIMUM RAIL LINE FLOWS) - CITY CENTRE

Phase 6: Preferred Strategy IdentificationIntroductionFollowing the assessment of the findings of the three theme tests described above a new preferred strategy was developed,Strategy 4. Also incorporated into the assessment at this stage was information from the Dublin Suburban Rail Strategic Reviewand Bus Network Strategy Appraisal for the Greater Dublin Area.
Strategy 4DescriptionFollowing on from the 3 theme tests and the Strategic Bus and Rail studies, the following conclusions were drawn indeveloping Strategy 4.
• The west / east heavy rail underground inter-connector (as proposed in the Strategic Rail Study) is the best way to satisfy the
strong west / east passenger demand in the city centre and to provide a link between the Maynooth and Kildare lines. This
inter-connector also interchanges with the north / south suburban rail line at Pearse and again north of Connolly station and
hence provides a high degree of flexibility for the provision of services and route variants on the entire heavy rail system.
• Though the Phoenix Park Tunnel does bring Kildare line passengers somewhat closer to the city centre (than Heuston),
it by-passes the important southeast inner city business area. In addition, it reduces the capacity on the Maynooth line for
services from Maynooth and Navan, does not resolve the capacity problems of the Loop Line and brings Kildare trains on a
circuitous route to the city centre (taking in excess of 15 minutes from Heuston to Conolly). For these reasons, the Phoenix
Park Tunnel was excluded.
• The METRO loop, which was part of all three themes, is retained in Strategy 4. This loop will have a section of tunnel as it
enters the city from Kimmage and joins up with Broadstone and Finglas.
• To provide a link with the DART network, LUAS Line B from Sandyford is extended south to Cherrywood and Shanganagh.
This line is upgraded to METRO to cater for passenger demand.
• To maximise the use of the south / north tunnel in the city centre, the METRO loop (joining Finglas, Blanchardstown,
Clondalkin and Tallaght to the west of the city) connects to the city centre via Kimmage and joins the METRO from
Shanganagh and Sandyford at a point north of Ranelagh.
• The north / south city centre tunnel allows for interchange with DART / suburban rail at Tara Street, providing high capacity
to high capacity interchange and relieving capacity pressures on LUAS Line A. A variant on this alignment that does not
interchange with Tara Street is tested later.
• A METRO spur from Finglas to Dublin Airport would have a much shorter section of tunnel than the direct route north
through Ballymun and was taken as the best way to serve the Airport. This spur would provide a high degree of accessibility
to the Airport from most parts of the Greater Dublin Area.
• A METRO spur from Tallaght to serve the new development at Tallaght West was included.
• The on-street light rail line to Dublin Airport via Ballymun attracts significant passenger flows and is retained.
• The on-street light rail line from Lucan attracts significant passenger flows and is retained.
• The areas around Beaumont Hospital, Artane and Rathfarnham remain at a greater than walking distance of a rail (LUAS,
METRO or DART) station and so an additional on-street light rail line between Artane and Rathfarnham was added.
Strategy 4 contains the same road improvements and QBC network as the three theme tests (see figure 4.5).
The rail network for Strategy 4 is shown in figure 4.9. Strategy 4 is an integrated multi-modal strategy, offering extensive publictransport options which provide a viable alternative to the use of the car for most users of the transport network.
36

Figure 4.9 STRATEGY 4
Variants on Strategy 4Three variants on Strategy 4 were tested as follows.
• As explained above, the north / south city centre tunnel in Strategy 4 joins Harcourt Street to Broadstone via Tara Street
DART station. A Strategy 4 test was carried out incorporating a variation of this tunnel alignment joining Harcourt Street to
Broadstone directly and interchanging with LUAS Line A at Abbey Street (i.e. having no interchange with DART at Tara
Street Station). This test showed that large numbers of passengers would interchange from this line to LUAS Line A and
passenger flows on Line A east of this interchange point would be over capacity.
• Strategy 4 with a heavy rail spur serving Dublin Airport via Portmarnock replacing the METRO extension from Finglas to the
Airport. The results of this test showed low flows on the heavy rail link and it is clearly not the preferred option for serving
the Airport.
• Strategy 4 with a heavy rail spur to Dublin Airport from the Maynooth line via Pelletstown replacing the METRO extension
from Finglas to the Airport. This test shows that a heavy rail link via Pelletstown would attract significantly less patronage
than a METRO spur. This is due to the need to interchange to METRO rather than having a through running service. In
addition, such a line from Dublin Airport could compromise the capacity of the Maynooth line – in particular if the rail line
from Navan (as proposed in the Strategic Planning Guidelines) also feeds into this line.
37

38
Findings from Strategy 4Strategy 4 delivers a similar mode split to the three theme tests. Radial journey times into the city are better than in any of thethree tests and the bus mode performs better than in these tests.
However, a number of key problems remain with Strategy 4 as follows.
• Though Strategy 4 delivers major reductions in congestion, significant congestion still exists on the M50 between and the
Navan Road (N3) and Naas Road (N7) interchanges and on the three National Primary routes (N3, N4, N7) as they approach
their junctions with the M50. There is also considerable congestion on the M1 at junctions close to Dublin Airport. Given that
the M50 is a dual 3-lane motorway, this would indicate that special demand management measures are required for the M50
and M1 motorways.
• The congestion on the M50 further implies that Strategy 4 does not provide an attractive public transport alternative to the
use of the car for trips on these sections of the network. To address this problem, an analysis was carried out on these
sections of the M50 to ascertain the pattern of trip origins and destinations. This revealed that in excess of 40% of all trips
using this section of the M50 have origins in areas outside the Metropolitan Area, and are not served by public transport.
The only suitable public transport solution for such trips is to use a combination of Park and Ride and feeder buses.
To address these problems and other issues arising out of the analysis of Strategy 4, Strategy 5 was developed and laterrenamed Strategy A.
Strategy A (Strategy 5)IntroductionStrategy A contains the following additions and improvements to Strategy 4.
• Nine Park and Ride sites (incorporating feeder bus connections) have been incorporated into the public transport network at
Swords, Finglas, Blanchardstown, Lucan, Palmerstown, Nangor, Fox & Geese, West Tallaght and Sandyford. Each site is
restricted to a capacity of 2,000 trips per site. This allows for 1,000 park and ride trips for each site and a further 1,000 trips
by a combination of "kiss and ride" and feeder bus options. For modelling purposes, zones outside the Dublin Metropolitan
Area are connected to high capacity (METRO or heavy rail) nodes at these nine locations. Persons wishing to use the
METRO or heavy rail network from these external zones would then have the option of using Park and Ride or feeder bus
facilities to connect to these rail nodes. The park and ride option provides users of the M50 (particularly those originating in
external zones) with a public transport alternative. However (as was argued earlier), the provision of the public transport
option alone would be insufficient, and hence a separate demand management measure would be required to reduce
congestion on the M50 and its major junctions. A proxy for this demand management measure in the form of a fixed charge
for all car trips accessing the M50 was included into the model.
• The introduction of a charge as a proxy for demand management penalties on the M50 necessitated a more detailed
examination of the appropriate charge for trips using the M50, accessing the city centre, and accessing other parts of the
Greater Dublin Area. The overall objective of this iterative process was to solve the congestion problems on the M50 itself
and ensure radial speeds close to 20kph. These penalties are applied as travel time penalties (in minutes) within the model.
When converted to money units (using the value of time as applied in the DTO model) the analysis yielded a charge that
equates to IR£2.00 (€2.54) for all traffic using the C-Ring, IR£2.80 (€3.56) for city centre bound trips and IR£2.40 (€3.05) for
trips to locations outside the city centre. (These charges were used as a proxy for demand management measures generally.
Other forms of demand management might achieve similar reductions.)
• The proposed on-street light rail line to Dublin Airport is now routed through Dorset Street, via DCU and Ballymun. An
analysis of 3 different routings options for this LUAS line found that the line via DCU attracts the most patronage. A
continuation of this line southwards serves Harold’s Cross, Terenure and Rathfarnham.
• The separate on-street light rail line from Artane to the city centre has been replaced by a spur from the Airport line at
Whitehall through Artane and via Beaumont Hospital to join up with the DART at Kilbarrack. This is a more efficient way to
serve these areas by light rail, does not cause over-capacity flows on the Airport line and provides connectivity to the DART.
• The Eastern By-pass provides the most direct route for cars and heavy goods vehicles accessing Dublin Port from the south
eastern quadrant of Dublin. It also provides a more direct route for trips between the southeast and north / northeast than the
M50 alternative. Because of this, the Eastern By-pass relieves some of the pressures on the M50. In addition, the extensive
new residential developments within the city centre generate significant numbers of car trips travelling outbound from the city
in the morning peak, and the Eastern By-pass helps to relieve some of the city centre congestion which these new trips
generate. For these reasons, the Eastern By-pass is incorporated into Strategy A. Strategy A is illustrated in figure 4.10.
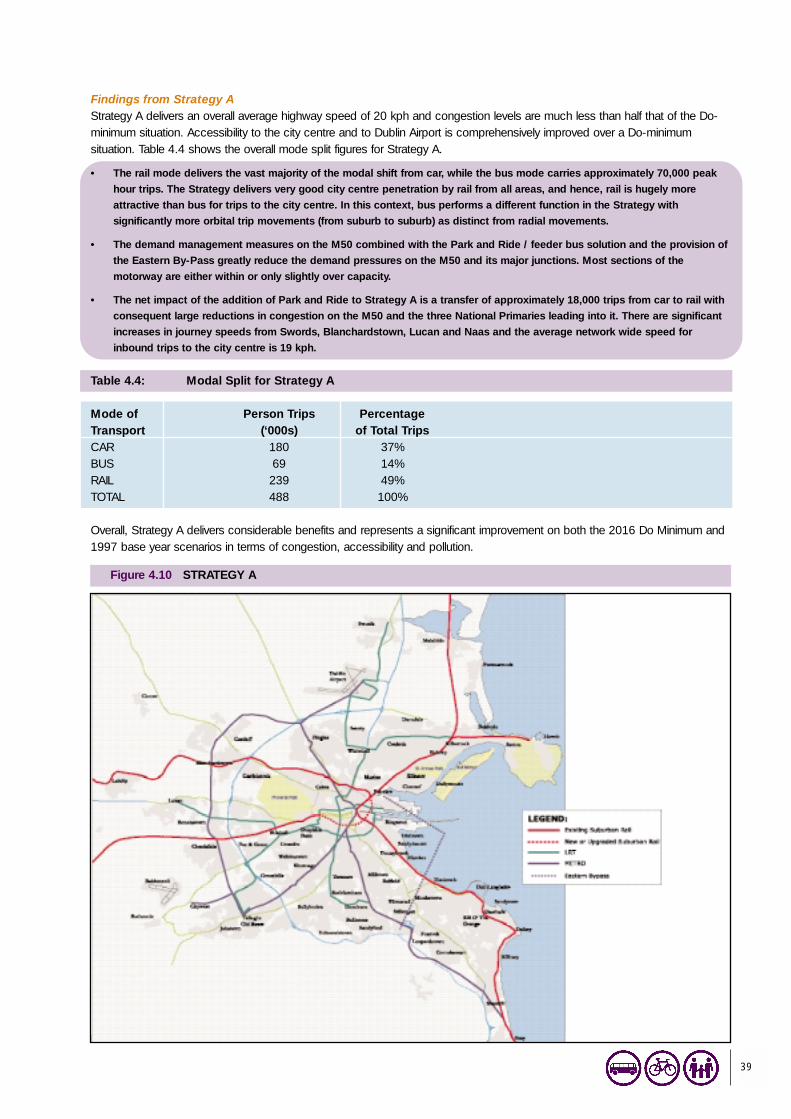
39
Figure 4.10 STRATEGY A
Findings from Strategy AStrategy A delivers an overall average highway speed of 20 kph and congestion levels are much less than half that of the Do-minimum situation. Accessibility to the city centre and to Dublin Airport is comprehensively improved over a Do-minimumsituation. Table 4.4 shows the overall mode split figures for Strategy A.
• The rail mode delivers the vast majority of the modal shift from car, while the bus mode carries approximately 70,000 peak
hour trips. The Strategy delivers very good city centre penetration by rail from all areas, and hence, rail is hugely more
attractive than bus for trips to the city centre. In this context, bus performs a different function in the Strategy with
significantly more orbital trip movements (from suburb to suburb) as distinct from radial movements.
• The demand management measures on the M50 combined with the Park and Ride / feeder bus solution and the provision of
the Eastern By-Pass greatly reduce the demand pressures on the M50 and its major junctions. Most sections of the
motorway are either within or only slightly over capacity.
• The net impact of the addition of Park and Ride to Strategy A is a transfer of approximately 18,000 trips from car to rail with
consequent large reductions in congestion on the M50 and the three National Primaries leading into it. There are significant
increases in journey speeds from Swords, Blanchardstown, Lucan and Naas and the average network wide speed for
inbound trips to the city centre is 19 kph.
Table 4.4: Modal Split for Strategy A
Mode of Person Trips PercentageTransport (‘000s) of Total TripsCAR 180 37%BUS 69 14%RAIL 239 49%TOTAL 488 100%
Overall, Strategy A delivers considerable benefits and represents a significant improvement on both the 2016 Do Minimum and1997 base year scenarios in terms of congestion, accessibility and pollution.

40
Figure 4.10b STRATEGY A (MAXIMUM RAIL LINE FLOWS)
Figure 4.10a STRATEGY A (MAXIMUM RAIL LINE FLOWS)

41
Figure 4.11 STRATEGY B
Strategy BIntroductionWith Strategy A fully developed, there were concerns over the large capital cost associated with the METRO element of theStrategy. It was considered necessary, therefore, to test an option based on Strategy A that did not contain the METRO systembut at the same time could provide similar benefits and choices for commuters. This strategy contained many elements ofStrategy A, and incorporated the rail extensions developed by the Dublin Suburban Rail Strategic Review as an alternative tothe METRO system of Strategy A. This strategy is called Strategy B.
DescriptionStrategy B incorporates the heavy rail solution as outlined in the Dublin Suburban Rail Strategic Review. This rail networkcontains the city centre inter-connector and upgrades to the Maynooth, Kildare and Northern lines – all of which are included inStrategy A. The following additions / amendments to Strategy A rail network (as outlined in the Dublin Suburban Rail StrategicReview) are included:
• heavy rail link to Dublin Airport as a spur off the Maynooth line via Pelletstown;
• heavy rail line from Navan linking into the Maynooth line via Blanchardstown town centre;
• rail spur off the Kildare line serving West Tallaght;
• continuation of LUAS Line B in tunnel from Harcourt Street to Broadstone and from there to Dublin Airport on street.
For the purposes of this model run, the bus network is identical to that used in the Strategy A. The Park and Ride sites for thisproposal are at the same locations as Strategy A – but connected to the heavy rail network only. The rail network for Strategy Bis illustrated in figure 4.11.

42
Findings from Strategy BThe main mode split results for the morning peak in 2016 for Strategy B compared with Strategy A are shown in Table 4.5
Table 4.5 Mode Split Results for Strategy B compared with Strategy A
Strategy A Strategy BMode of Person Trips Percentage Person Trips PercentageTransport (‘000s) Of Total Trips (‘000s) Of Total TripsCar 180 37% 204 42%Bus 69 14% 88 18%Rail 239 49% 196 40%Total 488 100% 488 100%
Table 4.5 above shows that Strategy B would cause a modal shift of 5% (representing 24,000 trips) back to the car modewhen compared to Strategy A. Trips by rail decrease by 9%, while trips by bus increase by 4% (an increase of 19,000 bustrips). The modal shift for city centre trips is 4% - ie an increase of 4,000 car trips over Strategy A. The increase in car trips hasthe effect of increasing highway congestion by 15% overall relative to Strategy A and reducing general accessibility to all partsof the city relative to Strategy A. In addition, Strategy B increases average rail trip lengths by 17% compared with Strategy A,with a consequent increase in rail energy consumption per passenger of 23%. The average traffic speeds on the highwaynetwork would be 17kph in Strategy B as against 20kph in Strategy A.
The maximum line flows on the major rail lines for Strategy A are shown in figure 4.10a and figure 4.10b. The equivalentmaximum rail line flows for Strategy B are shown in figure 4.11a and figure 4.11b.
The maximum line flows on the rail networks show that for Strategy B flows on LUAS Line A would exceed capacity nearHeuston station. Flows on LUAS Line B would be well in excess of capacity approaching the Grand Canal inbound. The railflows on the inter-connector are much higher in Strategy B compared to Strategy A with maximum peak hour flows of 33,000passengers per hour. Though (as stated earlier) DART and METRO have a theoretical capacity of 50,000 passengers per hour,the number of route and service variants using the inter-connector would reduce its practical capacity to approximately 40,000passengers per hour per direction. Hence, in Strategy B, the inter-connector would have limited spare capacity beyond 2016.In the absence of the orbital METRO, the orbital trip demand between Tallaght and Blanchardstown is catered for in two ways:
• because the strong orbital demand between Tallaght and Blanchardstown is not directly served, the model shows that many
trips making this movement have to travel into the city centre, interchange to another rail line and travel back out again. (In
practice, this demand would have to be served by alternative public transport options, which are not modelled). This leads
to an increase in radial trips inbound and outbound on the Maynooth and Kildare lines via the city centre inter-connector;
• an increase in trip demand on the M50 of 1,700 trips northbound and 1,500 trips southbound.
Few bus links in either strategy have passenger flows more than the absolute capacity limit of 5,000. However, in Strategy B,114 bus links have passenger flows more than 3,000 passengers per direction in the peak hour, whereas the equivalentnumber of links for Strategy A is 44. This indicates that in Strategy B, which has an additional peak hour bus demand of19,000 passengers, the bus network would experience significantly more capacity problems and would have little sparecapacity beyond 2016.

43
Figure 4.11b STRATEGY B (MAXIMUM RAIL LINE FLOWS) - CITY CENTRE
Figure 4.11a STRATEGY B (MAXIMUM RAIL LINE FLOWS)

SummaryTwo important conclusions were drawn from the analysis of the theoretical ‘higher mode’ network described earlier – thesewere:
• LUAS line B from Sandyford to the city and its extension to Dublin Airport need to have segregated running to cater for
demand;
• Tallaght to the City Centre cannot be served by a single on-street light rail line, so a line with segregated running through
Kimmage (the route of highest demand) is required.
Strategy B as modelled does not address either of these issues and does not meet the ‘walk and ride’ criterion or the criterionof reducing congestion to 1991 levels. As such Strategy B does not represent a satisfactory solution in terms of the objectivesas set out prior to the development of the strategy. In addition, the strong orbital trip demand between Blanchardstown andTallaght is not directly served and many trips making this movement would have to travel radially into the city, interchange toanother rail line and travel back out again. The public transport network in Strategy B, therefore fails to cater properly fordemand on these routes and would transfer considerable numbers of trips back to car relative to Strategy A, thereby increasinghighway congestion.
A more penal demand management regime than that proposed in Strategy A would be required to achieve an equivalent levelof highway congestion. However, it is difficult to see how such a demand management regime can be applied to highway tripswhere the public transport alternative (LUAS Lines A or B) is over capacity.
Rail CoverageRail coverage maps, showing the areas within 1km of a LUAS, DART / heavy rail or METRO station, are represented in figure4.12 for Strategy A and figure 4.13 for Strategy B.
The rail coverage in Strategy A is 46% higher than in Strategy B, consequently there are a greater number of areas in StrategyB not served by rail, leaving the bus as the only alternative.
Strategy B is very much radially based, and hence the strong orbital trip demand is not catered for in the most efficient mannerin contrast to the direct route provided by the orbital METRO.
Though Strategy B does not provide an overall transportation solution, it was useful in showing the net value of the additionalcost of the METRO. To this end, a full multi-criteria analysis of Strategy A and Strategy B was carried out – and the results ofthis analysis are described below.
Multi-Criteria Analysis of Strategy A and Strategy BStrategies A and B were subject to an evaluation process in order to:
• identify the key benefits and costs of each strategy;
• compare the relative merits of each strategy.
Because of the wide-ranging objectives set for the development of transport in Dublin, a multi-criteria approach to evaluation wasadopted. This approach assesses the impact of the investment strategies from a number of viewpoints, thus facilitating insightsinto the extent to which the strategies contribute to the objectives set for transport in Dublin. A feature of multi-criteria analysis is itsincorporation of impacts, even where money values cannot be placed on them. In this sense, multi-criteria analysis may becontrasted with cost-benefit analysis, which is concerned with money costs and benefits. A cost-benefit assessment of thealternative strategies was also undertaken, within the overall framework provided by the multi-criteria analysis.
44

45
Figure 4.12 RAIL COVERAGE FOR STRATEGY A
Figure 4.13 RAIL COVERAGE FOR STRATEGY B

46
For the purposes of the multi-criteria analysis, the DTO objectives were encapsulated by four effects, which embrace aregrouping of the twenty-seven objectives. These four effects reflect notions of:
• economy;
• accessibility;
• sustainability;
• policy Integration
A number of sub-effects were identified for each of the above.
Cost-Benefit AnalysisThe general approach was to compare the proposed Strategies A and B (Do-something strategies) to a ‘Do-minimum’ strategy,and to assess the additional benefits and costs arising from the former.
The benefits and costs of the strategies were measured over a 30-year period from the year 2000 to the year 2030. As theperformance of the Do-something strategies was modelled for the year 2016 only, the benefits for other years were derivedby interpolation.
The costs included both the capital costs associated with infrastructural development and the rolling stock and vehicles, andpublic transport operating costs.
Transport user benefits were the principal source of benefits. These relate to travel time and vehicle operating cost savings.Other benefits measured were accident benefits, air pollution benefits and noise pollution benefits.
The economic return was measured by estimating the costs and benefits over the thirty-year evaluation period and establishingthe net present value, cost-benefit ratio and internal rate of return of the strategies.
Effect on EconomyTable 4.6 presents the cost benefit results. Strategy A gives rise to discounted benefits of IR£24.4bn (€31.0bn) as comparedwith discounted costs of IR£8.9bn (€11.3bn). The net present value (NPV) is thus very substantial at IR£15.5bn (€19.7bn),indicating that the Strategy is highly effective. The efficiency of the Strategy may be measured by the cost-benefit ratio and theinternal rate of return. Both of these are very high at 2.8 and 14.7% respectively. The internal rate of return (IRR) is well inexcess of the test discount rate of 5%, which is advocated by the Department of Finance.
Strategy B also yields high returns, with impressive results for NPV, IRR and the Cost Benefit Ratio. However, Strategy B is less effectivethan Strategy A. This is measured by the NPV, which is lower for Strategy B (IR£13.9bn) (€17.6bn) than for Strategy A (IR£15.5bn)(€19.7bn). This reflects the greater scale of investment in Strategy A. That is, the higher investment under Strategy A does more tosolve the predicted traffic problems in the year 2016, and thus yields benefits which outweigh the extra investment costs.
In contrast, Strategy B is a more efficient strategy than Strategy A. The internal rate of return for Strategy B is 16%, comparedto 14.7% for Strategy A. Similarly, Strategy B has a higher cost-benefit ratio: 3.21 as opposed to 2.75. In short, Strategy Bprovides somewhat better value for money than A, per pound spent.
This raised the question as to whether the additional capital investment of Strategy A over Strategy B of some IR£2.3bn(€2.9bn) was justified. One way of evaluating this was to estimate the incremental costs and benefits of Strategy A overStrategy B, and establish whether the additional capital spending yields high returns. The results of such an analysis arepresented in Table 4.7. Strategy A yields considerable additional benefits over Strategy B. More importantly, the IRR of theincremental capital spend is 10%. This is double the Department of Finance’s test discount rate and indicates that theincremental capital spend represents good value for money.
The cost benefit analysis for Strategy A (the DTO Strategy) was revised at the time of going to print, with the latest data forcapital costs, operating costs and values of benefits. The results of the CBA are shown in Table 4.8. It shows that theeconomic return in terms of Net Present Value, Cost-Benefit Ratio and Internal Rate of Return are all higher than the originalcost-benefit analysis. This is largely because of the increase in the value of user benefits, particularly user time savings.
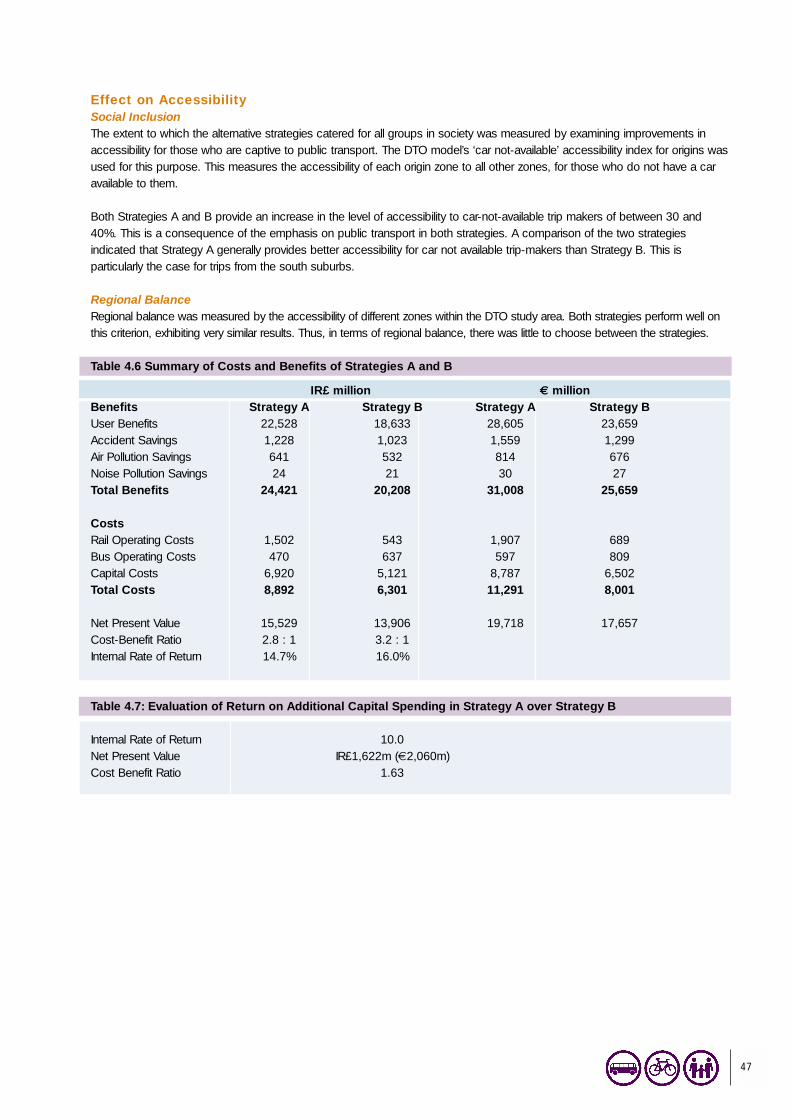
47
Effect on Accessibility Social Inclusion The extent to which the alternative strategies catered for all groups in society was measured by examining improvements inaccessibility for those who are captive to public transport. The DTO model’s ‘car not-available’ accessibility index for origins wasused for this purpose. This measures the accessibility of each origin zone to all other zones, for those who do not have a caravailable to them.
Both Strategies A and B provide an increase in the level of accessibility to car-not-available trip makers of between 30 and40%. This is a consequence of the emphasis on public transport in both strategies. A comparison of the two strategiesindicated that Strategy A generally provides better accessibility for car not available trip-makers than Strategy B. This isparticularly the case for trips from the south suburbs.
Regional BalanceRegional balance was measured by the accessibility of different zones within the DTO study area. Both strategies perform well onthis criterion, exhibiting very similar results. Thus, in terms of regional balance, there was little to choose between the strategies.
Table 4.6 Summary of Costs and Benefits of Strategies A and B
IR£ million € millionBenefits Strategy A Strategy B Strategy A Strategy BUser Benefits 22,528 18,633 28,605 23,659Accident Savings 1,228 1,023 1,559 1,299Air Pollution Savings 641 532 814 676Noise Pollution Savings 24 21 30 27Total Benefits 24,421 20,208 31,008 25,659
CostsRail Operating Costs 1,502 543 1,907 689Bus Operating Costs 470 637 597 809Capital Costs 6,920 5,121 8,787 6,502Total Costs 8,892 6,301 11,291 8,001
Net Present Value 15,529 13,906 19,718 17,657Cost-Benefit Ratio 2.8 : 1 3.2 : 1Internal Rate of Return 14.7% 16.0%
Table 4.7: Evaluation of Return on Additional Capital Spending in Strategy A over Strategy B
Internal Rate of Return 10.0Net Present Value IR£1,622m (€2,060m)Cost Benefit Ratio 1.63

48
Table 4.8 Summary of Revised Costs and Benefits of Strategy A IR£ million € million
BenefitsUser Benefits 25,594 32,498Accident Savings 1,272 1,615Air Pollution Savings 728 924Noise Pollution Savings 28 36Total Benefits 27,622 35,073
CostsRail Operating Costs 1,493 1,896Bus Operating Costs 470 597Capital Costs 7,014 8,906Total Costs 8,977 11,398
Net Present Value 18,645 23,674Cost-Benefit Ratio 3.08 : 1Internal Rate of Return 15.80%
Effect on SustainabilityEmissions The analysis of emissions covered carbon dioxide (CO2), carbon monoxide (CO), volatile organic compounds (VOC), nitrousoxides (NOx), particulate matter (PM), and sulphur dioxide (SO2). Table 4.9 presents the results. The analysis showed thatStrategy A is considerably more successful in reducing emissions than Strategy B. For example, emissions of CO2 fall from2,611kT to 1,551kT or by 41% under Strategy A, as against a decrease of 34% under Strategy B.
Noise Pollution Table 4.6 shows that the sum of the discounted noise pollution benefits is IR£24m (€30m) for Strategy A compared withIR£21m (€27m) for Strategy B.
Energy Because both Strategies A and B are successful in increasing the public transport modal share, they yield substantial energysavings. Strategy A is better in this regard, providing a 40% reduction in energy consumption relative to the Do-minimumScenario. The equivalent figure for Strategy B is 33%.
Table 4.9: Emission levels for the 1997 Baseline Traffic Volumes, the Do-minimum and Strategies A and BEmission Unit of 1997 2016 2016 2016
Measurement Baseline Do-minimum Strategy A Strategy BCO2 KT 1,328 2,611 1,551 1,735CO T 75,649 32,058 18,780 21,342VOC T 12,209 5,321 3,142 3,525NOx T 6,699 1,936 1,288 1,423PM T 204 43 25 28SO2 T 611 810 464 525
Effect on Policy IntegrationLand Use PlansThis criterion assessed the compatibility of the strategies with the Strategic Planning Guidelines for the Greater Dublin Area. The Guidelines are based on the principle of consolidation of land uses and separate approaches have been devised for theMetropolitan Area and the Hinterland Area. With regard to the former, the emphasis is on development of brown-field sites andincreases in residential density. For the Hinterland Area, the emphasis is on self-sufficient development centres ascounterweights to the Metropolitan Area. As both of the strategies considered were based on traffic forecasts derived from theland use patterns envisaged in the Strategic Planning Guidelines, they are both broadly compatible with the Guidelines.
However, as Strategy A has greater capacity and can thus cater for higher traffic flows and passenger numbers, it has greaterpotential for accommodating higher land use densities.
49
Future Transport NeedsThis involved evaluating the strategies based on the spare capacity available at the end of 2016 on the DART/ Suburban Rail,METRO and LUAS networks, and the ability of the strategies to offer greater capacity going forward.
The LUAS lines within Strategy A are close to capacity in year 2016. However, the METRO elements exhibit significant sparecapacity. The capacity utilisation of suburban rail lines is above that of the METRO but below that of the LUAS. There issignificant spare capacity on the rail interconnector.
Because Strategy B relies heavily on suburban rail with no METRO elements, both the suburban rail system (including the railinterconnector) and the LUAS elements are close to capacity by 2016.
The general conclusion is therefore that Strategy B would result in a system with very little spare capacity in 2016, whereas theMETRO elements of Strategy A afford some spare capacity going forward.
Synthesis and ConclusionsStrategy A was preferred to Strategy B on most of the evaluation criteria. By delivering higher net benefits, Strategy A is seen tobe a more effective strategy, giving rise to larger user benefits than Strategy B. Strategy A is also more compatible with thedevelopment of a sustainable economy, provides higher levels of accessibility for non-car users, caters better for long termtransport needs, and is more in keeping with land use planning aspirations. In terms of accessibility to and from all parts of thestudy area, there is less to choose between the strategies.
Strategy B is preferred to Strategy A on only one criterion – efficiency. This means that Strategy B provides a higher return perpound spent. However, despite the greater efficiency of Strategy B, the additional capital spending associated with Strategy Aover Strategy B represents good value for money.
In general terms, therefore, Strategy A is to be preferred. The benefits of Strategy A are very substantial at IR£18.6bn(€23.7bn) in net present value terms. With a cost-benefit ratio of 3.08 and a rate of return of 15.8%, the Strategy providesgood value for money.
Phase 7: Sensitivity Testing of Preferred StrategyIntroductionFollowing the multi-criteria assessments, Strategy A was chosen as the Preferred Strategy. This section describes the sensitivitytests that were carried out on Strategy A to ensure that the strategy is robust.
Sensitivity TestsThere were three sensitivity tests carried out on Strategy A as follows:
• high growth scenario;
• low growth scenario;
• removal of demand management measures.
Sensitivity Test 1 - High Growth ScenarioThe purpose of sensitivity test 1 is to assess the robustness of the preferred strategy in a high economic growth scenario. Forthis scenario, overall peak-hour trip demand was assumed to be 20% more than in the standard runs - ie 586,000 trips. Theimpact of the 20% increase in overall trip demand is to increase the highway and public transport flows on all routes by asimilar percentage. In this scenario, DART / heavy rail and METRO lines will have sufficient reserve capacity to cope withincreasing demand. There is a large increase in rail flows on the inter-connector (up to 24,000 trips).
However, the proposed Lucan LUAS line will be over capacity (max flow of 8,000 trips). The N11 QBC will also have capacityproblems – particularly where it enters the city centre. In addition, an increased level of demand management will be requiredon the M50 to maintain the peak hour flows to within capacity limits.
Sensitivity Test 2 – Low Growth Scenario The purpose of sensitivity test 2 is to assess the robustness of the preferred strategy in circumstances of low economic growthand/or a higher usage of slower modes (cycling / walking) and increased tele-working. For this scenario, overall peak-hour tripdemand was assumed to be 20% less than in the standard runs - ie 390,000 trips. The impact of the 20% reduction in overall
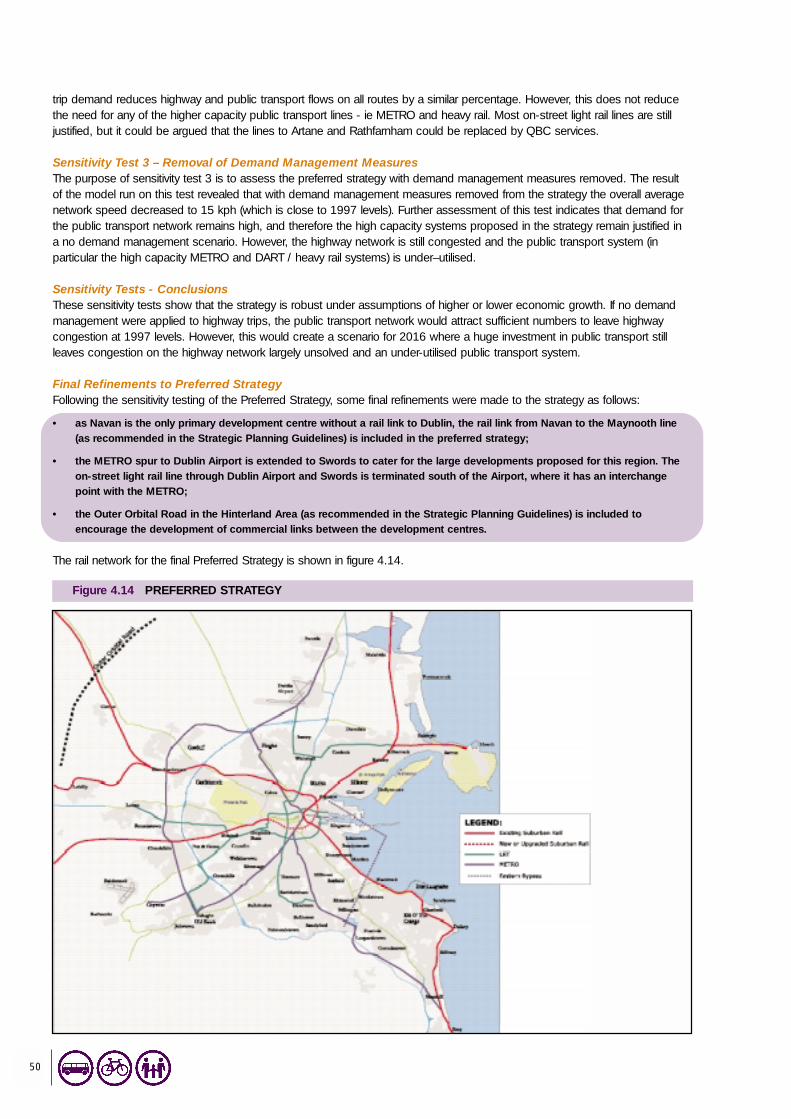
50
trip demand reduces highway and public transport flows on all routes by a similar percentage. However, this does not reducethe need for any of the higher capacity public transport lines - ie METRO and heavy rail. Most on-street light rail lines are stilljustified, but it could be argued that the lines to Artane and Rathfarnham could be replaced by QBC services.
Sensitivity Test 3 – Removal of Demand Management MeasuresThe purpose of sensitivity test 3 is to assess the preferred strategy with demand management measures removed. The resultof the model run on this test revealed that with demand management measures removed from the strategy the overall averagenetwork speed decreased to 15 kph (which is close to 1997 levels). Further assessment of this test indicates that demand forthe public transport network remains high, and therefore the high capacity systems proposed in the strategy remain justified ina no demand management scenario. However, the highway network is still congested and the public transport system (inparticular the high capacity METRO and DART / heavy rail systems) is under–utilised.
Sensitivity Tests - ConclusionsThese sensitivity tests show that the strategy is robust under assumptions of higher or lower economic growth. If no demandmanagement were applied to highway trips, the public transport network would attract sufficient numbers to leave highwaycongestion at 1997 levels. However, this would create a scenario for 2016 where a huge investment in public transport stillleaves congestion on the highway network largely unsolved and an under-utilised public transport system.
Final Refinements to Preferred StrategyFollowing the sensitivity testing of the Preferred Strategy, some final refinements were made to the strategy as follows:
• as Navan is the only primary development centre without a rail link to Dublin, the rail link from Navan to the Maynooth line(as recommended in the Strategic Planning Guidelines) is included in the preferred strategy;
• the METRO spur to Dublin Airport is extended to Swords to cater for the large developments proposed for this region. Theon-street light rail line through Dublin Airport and Swords is terminated south of the Airport, where it has an interchangepoint with the METRO;
• the Outer Orbital Road in the Hinterland Area (as recommended in the Strategic Planning Guidelines) is included toencourage the development of commercial links between the development centres.
The rail network for the final Preferred Strategy is shown in figure 4.14.
Figure 4.14 PREFERRED STRATEGY

51
5. The StrategyThe DTO Strategy (ie Strategy A from Chapter 4), which enables the achievement of the land use goals set out by the StrategicPlanning Guidelines and meets the objectives derived from the Vision Statement and the Steering Committee, has twointerdependent elements:
• Infrastructure and Service Improvements to increase the supply of transport, including a substantial expansion of the
public transport network, some strategic road construction and traffic management;
• Demand Management to reduce the growth in travel through the application of complementary land use and other policies
while maintaining economic progress, and which is designed to encourage a transfer of trips, especially at peak periods,
from the private car to sustainable modes of transport (such as public transport, cycling and walking).
The DTO Strategy is an integrated one. It will only be effective when both elements are implemented together in a coherentway. Going ahead with the infrastructure element alone will not be enough. It must be accompanied by the demandmanagement element and the complementary policies if the Strategy is to achieve its overall objectives.
The DTO Strategy seeks to transform the transportation system in the Greater Dublin Area. There will be extensive, high quality,fully accessible, integrated networks for DART/suburban rail, LUAS, METRO, bus, roads, cycling and walking. Public transportwill cater for a majority of the demand for travel. Rail based systems will see a ten-fold increase in passenger numbers. Roadswill be managed so that congestion for all road users is minimised. The overall effect of the Strategy, compared with a ‘Do-minimum’ scenario, will be to reduce average journey times by half, reduce polluting emissions by a third and reduce trafficaccidents by a third.
The rest of this Chapter briefly describes the principal components of this integrated transportation strategy. It includes:
• an integrated public transport network which provides for a radical transformation in the quality and quantity of services
provided;
• strategic, but limited, improvements to the road network which will be managed in a way which does not encourage peak
hour car commuting;
• traffic management policies which will optimise the use of the road network for all users, including car drivers and
passengers, public transport passengers, cyclists and pedestrians;
• a freight management policy designed to provide the basis for a detailed strategy to facilitate the movement of goods and
improve freight access to the ports and Dublin Airport;
• good quality cycling and pedestrian networks;
• a statement of policy on demand management which will provide the basis for the development of a detailed demand
management implementation programme;
• guidance on complementary land use policies.
PUBLIC TRANSPORTThe public transport elements of the Strategy will provide for approximately 300,000 trips in the morning peak hour in 2016,compared with about 70,000 today. To achieve this it will be necessary to create an integrated public transport networkcomprising the following principal components:
• an improved DART/suburban rail network including improved passenger carrying capacity on the existing network by
lengthening trains to 8-cars and by increasing service frequencies, the development of more tracks on existing alignments
so as to remove bottlenecks, an underground interconnector between Heuston Station and East Wall and other new rail
lines;
• an extension of the on-street light rail network (LUAS);
• the development of a higher capacity segregated light rail network (METRO);
• a much expanded bus network, comprising an integrated mesh of radial and orbital services, higher frequencies on new and
existing services and a substantial increase in passenger carrying capacity;

52
Figure 5.1
• a package of measures designed to improve the integration and attractiveness of the public transport network, including
park and ride facilities, integrated fares and ticketing, quality interchange facilities and improved passenger information.
The Strategy will make it possible to complete the bulk of public transport journeys in the Greater Dublin Area with not morethan one transfer, whether intra-modal (eg bus to bus) or inter-modal (eg bus to rail), and with only one ticket.
When the public transport strategy is in place, the great majority of people living in the Greater Dublin Area will be able toaccess the public transport network by walking 10 minutes or less. With this Strategy, public transport will be a viable option forthe large majority of trips.
Transport services in this Strategy will be accessible to all users. The particular needs of people with mobility impairments anddisabilities will be addressed by providing low-floor buses, level boarding on rail-based modes of public transport and highquality pedestrian facilities. This will consequently ensure a high quality of accessibility to public transport for all transport users.
Bus (see figure 5.1)
Buses are the most flexible form of public transport. The bus is, consequently, the most extensive form of public transport inthe Strategy in terms of route length and geographic coverage. Quality Bus Corridors and bus priority measures can beimplemented relatively quickly and cheaply. They therefore provide the best means of dealing with the existing transportationdeficit in the short term.
The role of the bus is likely to change quite substantially over time, particularly as the longer-term rail-based elements in thisStrategy are put in place. In the short term, the bus will be the primary mode of public transport. As the rail-based networks areput in place, the bus will increasingly be used to feed passengers to rail services as well as carry them directly to their ultimatedestination. The bus will also be used to fill in gaps in the mesh of public transport routes where a rail-based system isuneconomic, impractical or not feasible and also to extend the reach of the rail network.

53
The Quality Bus Network (QBN), shown in indicative form in figure 5.1, will consist of radial and orbital Quality Bus Corridorsand additional bus priority measures. In general, the design of the network will offer clear advantage to public transport overprivate vehicles so as to ensure competitive and reliable door-to-door journey times. The target design speed for publictransport services in the Quality Bus Network will remain at 22kph.
The Strategy requires delivery of the entire Quality Bus Network by 2006, to provide as much public transport capacity, tailoredtowards projected demand, in the shortest possible time. This will involve the provision of approximately 258km of additional
QBCs and bus priority measures, in addition to the 49km in place at the beginning of March 2001. The result will be a tightmesh of radial and orbital routes linking the suburbs with each other and with the city centre.
The infrastructural programme involves completion and extension of the Quality Bus Corridor network and other associated buspriority schemes such as local links to rail stations, and key sections of bus routes that are not on the QBN. Ten of the twelveQBCs in the original DTO programme were completed by the end of June 2001 and the remaining two will be completed by2002 (see Chapter 3 for details).
Following completion of the original DTO QBC programme, described in Chapter 3, the new programme will focus on thedesign and implementation of an extended network of QBCs and other bus priority measures including:
• extensions to the 12 QBCs in the original DTO programme;
• additional radial QBCs;
• a limited number of orbital QBCs;
• bus priority on access routes to major employment centres;
• bus priority on links to radial and orbital QBCs.
The prioritisation of the implementation of the expanded QBN programme will be addressed in a Short Term Action Plan whichis being prepared by the DTO. Some indicative examples of possible QBN measures are set out below.
Quality Bus Network: Indicative Projects
Extension of existing QBCsMalahide Road QBC extension to MalahideBlanchardstown QBC extension to Clonee and DunboyneLucan QBC extension to LeixlipTallaght QBC extension to Tallaght WestStillorgan QBC extension to BrayOrbital QBC extension to BaldoyleNew Radial QBCsSutton – Clontarf – FairviewNew Orbital QBCsGriffith AvenueGrand Canal, North Circular RoadInner City
A QBN Project Team will design and implement the expanded programme. The Team will be under the management of theDirector of Traffic. It will design and implement QBCs and other bus priority measures on a "whole route" basis.
The QBN design will be broadly based. Service characteristics, pedestrian access and passenger waiting facilities will bedesigned with an emphasis on meeting customer requirements. Quality Bus Corridors will be constructed so that buses are notdelayed in traffic. This will involve with-flow and contra-flow bus lanes, converting streets to one-way operation with contra-flowbus lanes, bus only roads, the use of selective bus detection technology and priority at traffic lights, bus gates (where buses

are given a head start at traffic lights) and queue relocation (where general traffic is managed so that queues only occur wherebus lanes are provided). They will have direct, high frequency services with long working hours. There will be a flagship routeon each corridor but the benefits of the infrastructure will accrue to all routes on the corridor. The buses will be clean,comfortable, low-floor and environmentally friendly. Generally, bus stops will have high quality shelters with seating and lighting.Real time passenger information will be introduced at appropriate locations, as the bus fleet becomes equipped with AutomaticVehicle Location (AVL) technology, probably based on a Global Positioning System (GPS). Staff will continue to be trained toprovide a high standard of customer care.
In the city centre, the QBN will allow radial bus routes to access all parts of the city centre and to interchange with and link toDART/suburban rail stations, LUAS stops and METRO stations. It will also improve the reliability of cross-city services. Theimplementation of the Millennium proposals for O’Connell Street and Dame Street will provide a congestion free route for cross-city services. City centre termini will be moved to improve access for passengers, to increase opportunities for interchange andto minimise the environmental impact of the buses.
Local bus priority measures and services will be provided in addition to the QBN, in particular to access major residential, retailand employment centres. Layouts of major new residential, retail and employment developments will allow direct and efficientaccess exclusively for buses.
Local bus services in the Hinterland Area will focus on the Development Centres and rail stations. They will expand as thepopulation and employment levels in the Development Centres grow. They will link employment, service and residential areas,thus promoting the objective in the Strategic Planning Guidelines that the Development Centres become self-sufficient in thelonger term. There will be bus priority measures wherever necessary.
An estimated 495 additional buses, inclusive of the 225 delivered in 2000, will be required to implement the expanded busservices. Approximately 600 replacement buses will be required to upgrade the existing fleet and reduce the maximum age ofbuses in the fleet to 10 years. All new buses for use on urban services will be low-floor.
All new traffic changes and schemes will be audited for public transport, as part of the traffic management element of this Strategy.
DART/Suburban Rail (see figure 5.2)
Heavy rail systems, such as DART and Arrow, have high potential passenger capacities but are very expensive to build. DARTis now experiencing capacity problems during peak hours especially in the city centre. There is a severe bottleneck on thesuburban rail services on the DART and Maynooth lines approaching Connolly Station. The Arrow service from Kildareterminates at Heuston Station, which is more than 2km from the city centre.
The DART/suburban rail strategy is designed to make the maximum use of existing rail lines, in particular by eliminating thecapacity constraints in the existing system. This requires:
• upgrading of signalling on the Dundalk, Maynooth and Kildare lines to allow a substantial increase in the number of peak
hour trains;
• lengthening of platforms to allow the operation of 8-car DART and Arrow trains;
• station improvements, including new platforms, in Connolly, Heuston, Pearse and Grand Canal Dock Stations;
• a new station in the Docklands;
• the removal of or restrictions on the use of level crossings on the DART and suburban rail lines;
• the segregation of intercity services from suburban services on the Dundalk and Kildare lines. This requires three- or four-
tracking from Connolly Station to north of Howth Junction and four-tracking from Cherry Orchard to Sallins.
The centrepiece of the DART/suburban rail strategy is an underground interconnector linking Heuston Station with East Walljunction north of Connolly Station, via the south inner city, Pearse Station and Docklands. This interconnector allows for throughrunning from the Kildare line to the Maynooth line and/or the Dundalk line. It provides a by-pass of the existing severebottleneck approaching Connolly Station; it serves areas of high demand, especially the south-east inner city and Docklands;and it allows for the maximum use of the Maynooth and Kildare lines. The tunnel will be too long and will have too manyunderground stations to allow diesel trains. Therefore, both the Maynooth and Kildare lines will be electrified so that these
54

services can run via the tunnel. This, in effect, will be a major extension of the present DART system. The interconnector willtransform the DART/suburban rail system from one with severe constraints in terms of capacity and accessibility to a systemthat has a well balanced high capacity, that is operationally very efficient and that penetrates all the major areas of demand inthe city centre.
There will be new rail stations, particularly near areas of new development adjacent to the existing rail lines. The exact locationof new stations will be a matter for detailed design and public consultation, but possible locations include North Clondalkin,South Lucan, Ashington, West Blanchardstown and Donaghmede.
A new spur rail line will be constructed off the Maynooth line near Clonsilla via Dunboyne to Navan. Services will run fromNavan to the city centre. There are a number of possible alignments. There is an existing alignment along a disused railwayfrom Clonsilla to Navan. Other options could provide better access to developing lands in Castaheany, Clonee, Ashbourne,Ratoath and/or Dunsaughlin. The final alignment will depend on detailed design and public consultation.
55
Figure 5.2

56
LUAS (on-street light rail) (see figure 5.3)
The LUAS system is appropriate in corridors where passenger numbers are too high to be accommodated on bus but not highenough to justify the expense of DART or METRO. The LUAS system in this Strategy is founded on LUAS lines that are alreadyunder construction. LUAS Line A (Tallaght to Abbey Street) is under construction. Line B (Sandyford Industrial Estate to StStephen’s Green) is under construction as a LUAS line but will be upgraded to METRO later (see under METRO). LUAS Line C(Abbey Street to Connolly Station) is under construction and will be extended to Docklands.
A new north-south line will be constructed from Ballymun via Whitehall, the city centre, Harold’s Cross, Terenure andRathfarnham to Dundrum. This will be extended north of Ballymun to Sillogue. It will interchange with the METRO at fourseparate points: at Sillogue, in the north city centre, in the south city centre and at Dundrum. There will be a spur at Whitehallvia Beaumont and Coolock to Kilbarrack where it will interchange with DART.
A new east-west line will be constructed from Lucan via Ballyfermot, Drimnagh, Dolphin’s Barn and the South City Centre toDocklands via the proposed Macken Street Bridge.
Figure 5.3

57
Figure 5.4
METRO (segregated light rail) (see figure 5.4)
METRO is a light rail system that has many similarities with LUAS, however, it is completely segregated throughout its entirelength (that is, it has no on-street sections). This means that it can have longer trains, operating at higher speeds and higherfrequency and therefore has the potential to provide very high passenger capacity. Tunnels are needed to maintain segregationin densely developed areas.
The METRO system will have a spine from Swords to Shanganagh. This line will run via Dublin Airport, Finglas, Broadstone, thecity centre, Ranelagh, Sandyford and Cherrywood. The section between the Royal Canal and Broadstone will be in the disusedBroadstone rail alignment and will interchange with DART/suburban rail at Liffey Junction. The section between Broadstone andRanelagh will be in tunnel and will interchange with DART at Tara Street Station. Construction of this line will entail the upgradingof LUAS Line B to METRO between the Sandyford Industrial Estate and Ranelagh.
There will be a line from Tallaght West via Tallaght and Kimmage, entering the city centre tunnel in the south city. This line willinterchange with LUAS Line A at Tallaght and with the Rathfarnham LUAS line at Harold’s Cross.
An orbital line will be formed from a spur off the Swords-Shanganagh spine route at Finglas via Blanchardstown and Clondalkinto Tallaght. This line will interchange with DART/suburban rail, and possibly with intercity trains, at Porterstown and Clondalkin.This will allow passengers from Sligo, Ballina, Westport, Galway, Limerick, Tralee, Cork, and Waterford trains to access DublinAirport with only one interchange.
The service pattern will depend on passenger demand but is likely to include services:
• from Tallaght West via Clondalkin, Blanchardstown and Dublin Airport to Swords;
• from Tallaght West via Tallaght, Kimmage, the city centre and Finglas to Dublin Airport;
• from Shanganagh via Sandyford, Ranelagh, the city centre and Finglas to Dublin Airport.

Figure 5.5
INTEGRATION (see figures 5.5 and 5.6)
The Strategy is integrated across the various modes of transport.
There will be numerous interchange points on the METRO, DART/suburban rail, LUAS and bus networks, particularly in the citycentre. There will be bus feeder services to rail-based public transport. It will be possible to make almost all journeys on thepublic transport networks with not more than one interchange. Interchange will be properly planned, so that journeys on publictransport are "seamless".
All public transport networks will be fully accessible by people with mobility impairments and disabilities.
A series of public transport nodes will be designed to facilitate interchange where public transport services converge. Thepublic transport services will, as far as reasonable, have co-ordinated timetables. The nodes will have safe, comfortable waitingfacilities with passenger information. The nodes will include:
• Connolly Station/Busaras (DART/suburban rail, LUAS, QBN, intercity trains, provincial buses);
• Tara Street Station (DART/suburban rail, METRO, QBN);
• Pearse Station (DART/suburban rail, QBN, intercity trains);
• Heuston Station (DART/suburban rail, LUAS, QBN, intercity trains);
• Porterstown (DART/suburban rail, METRO, QBN, intercity trains);
• Clondalkin (DART/suburban rail, METRO, QBN, intercity trains);
• Tallaght (METRO, LUAS, QBN);
• Dundrum (METRO, LUAS, QBN).
58

59
Figure 5.6
Real time travel information and public transport information services by telephone and on the internet will be introduced.
Park and Ride will integrate the car with public transport. There will be Park and Ride facilities for commuters at strategiclocations where the national road network meets the public transport networks. All proposed Park and Ride sites will beassessed to ensure that cars accessing them do not unduly add to congestion.
Cycle parking facilities will be provided at appropriate Park and Ride sites, DART/suburban rail stations, METRO stations,LUAS stops and bus stops. This will increase the catchment of public transport, particularly the rail based modes. There will bea consequent increase in passenger numbers and revenue for the operators.
Integrated fares and ticketing will be introduced. This will allow all public transport users to complete a full journey with onlyone ticket, even if the journey involves more than one bus and/or LUAS and/or DART/suburban rail and /or METRO trip. Theticket will be a contactless ‘smart card’ and will be usable on all forms of public transport including services provided by privateoperators. The use of contactless smart cards speeds up passenger boarding on buses, and consequently speeds up busjourney times. The smart card could be used for other payments such as car-parking charges, taxi fares and electronic roadpricing. As well as making the journey more convenient (especially for occasional users of public transport), integrated fares willmake most journeys involving interchange cheaper.
Taxis and hackneys have the potential to provide a comfortable, door-to-door service at all times of the day. They are animportant link in the transportation chain. If commuters, particularly those who intermittently and unpredictably use their carsduring the working day, know that there is a high quality taxi and hackney service for daytime journeys, then they are more likelyto use public transport for commuting.

Figure 5.7
ROADS (see figure 5.7)
The development of the national road network in the Greater Dublin Area meets national economic policy objectives and,accordingly, a number of national road projects are included in the Strategy. The projects fall into two general categories. Thefirst is the upgrading and completion of the orbital motorway around Dublin (M50, the Dublin Port Tunnel and Eastern By-Pass).The second comprises upgrading the arterial national routes outside the orbital motorway.
The Strategy includes a number of non–national road projects that have a strategic influence (as distinct from local impacts).The main criteria for inclusion are that the project should:
• provide for proper management of access to the M50 and/or national arterial routes;
• complement the Strategic Planning Guidelines;
• serve critical economic development needs in the Metropolitan Area or in the development centres identified in the Strategic
Planning Guidelines;
• provide other environmental or safety benefits;
• increase capacity for public transport;
• provide or improve access to public transport facilities (eg rail stations).
The principal road projects are listed in Chapter 8.
As in the 1995 DTI Strategy, there will be no significant increase in road space on radial roads inside the M50 motorway.Further, there will be no additional roads to cater for car traffic passing through the Metropolitan Area, apart from those roadscontained in the Strategy.
The construction of new and improved roads, especially by-passes, will be accompanied by the reallocation of road space onthe existing road network to pedestrians, cyclists and/or public transport users. This will apply to by-passed towns in theHinterland Area and also to the Metropolitan Area when the South Eastern Motorway and Eastern By-Pass are built.
60

TRAFFIC MANAGEMENT STRATEGY
Define Network By Function,Shape and Use
Determine Overall Objectives forNetwork and each mode
Install Appropriate MeasuringFacilities
Monitor Performance Of Networkand Each Mode
Adjust Control Mechanisms toimprove Performance
Traffic Management Policy
TRAFFIC MANAGEMENTThe primary objective of traffic management is to optimise the use of road space for all users as measured against theobjectives set out in the Vision Statement in Chapter 2. Traffic management will be particularly important in the short term,before the high-capacity rail-based public transport schemes are completed. In 2006, there will be an additional 60,000 publictransport users in the peak hour, most of them travelling by bus. This alone will require the traffic management system toprovide additional bus priority as well as catering for the extra 120,000 pedestrian trips (ie 60,000 at each end of the publictransport journey). In 2006, there will be an additional 84,000 car trips.
A Regional Traffic Management StrategyThere will be a Regional Traffic Management Strategy, which will have 4 main parts:
• the definition of a hierarchy of roads in the network, setting out the purposes and objectives for each level in the hierarchy;
• a monitoring system, to measure how well the highway infrastructure is meeting its objectives;
• a control system, enabling adjustment of the network;
• a series of firm proposals comprising a traffic management policy.
Definition of the highway infrastructure and objectivesA regional hierarchy of roads will be defined, setting out the functions of each link in the network, and reconfiguring these linksto support those functions. Within the road hierarchy, the distributor road network (including national roads within theMetropolitan Area) will concentrate on the regional movements of people and goods. The future role of traffic calming and itsmethodology will be examined as part of this review.
Optimising the use of road space for all users will require the various agencies to agree practical objectives for the networks interms of safety, journey times, capacity and mode splits. These objectives will be translated into measurable indicators, so thatthe best regime for managing traffic is defined objectively, and continually delivered by the agencies in a co-ordinated way.
Monitoring SystemTraffic demand will change constantly. The challenge is to continually monitor changes in demand and performance, and adjusttraffic controls in response to those changes.
A Monitoring Systems Study will be undertaken, to determine how this monitoring framework will be implemented. This will
61

include specifying the monitoring systems required, as well as identifying how to integrate this system with existing andproposed traffic control and travel information systems.
Control SystemsCertain elements of traffic can be directly controlled, including:
• traffic signals;
• speed;
• enforcement;
• on-street parking;
• road works and utilities management.
Traffic SignalsThere will be local traffic signal control centres in each of the four Dublin local authorities. They will have integrated trafficmanagement systems controlling traffic signals, remote fault detection, closed circuit TV and variable message signs. There willbe communication between the centres, as determined by the Monitoring Study. A Regional Signal Control Plan will bedeveloped by the DTO. The Plan will co-ordinate traffic signal control on a regional basis and will seek to achieve broad goals,including the reduction of rat-running, pedestrian delays and congestion, while increasing bus speeds and improving safety.
Speed Control Lower speeds can give higher capacity for traffic and are safer. Therefore, a Regional Speed Study will be conducted toexamine current speed limits and observance. It will develop a speed strategy and make recommendations about itsimplementation.
Enforcement Enforcement will continue to play a key role in improving the effectiveness of traffic management. The likelihood of being caughtand penalised will be enhanced. Enforcement systems will be increasingly automatic, in terms of camera recording andcomputer processing of violations. A penalty points system, which is currently being implemented for safety-related violations,will be considered for traffic flow violations (eg box junction and bus lane infringements).
On-street Parking Control Clamping and towing have made a vital contribution to managing parking. Clamping will be extended to areas of high parkingdemand, especially retail centres. Clamping will be extended to additional main traffic routes.
Road Works and Utilities Management The local authorities and the utility companies will develop a more co-ordinated approach to the planning and management ofroad works. All non-emergency disruptive works (eg resurfacing, trench digging, duct and pipe laying) will be co-ordinated toensure that they are carried out in the least disruptive and most efficient way. A strengthened legislative framework may berequired to give local authorities the necessary powers of enforcement, especially in relation to telecommunication utilitieswhose numbers have increased significantly and who are in competition with each other. Consideration will be given to thepossible use of economic instruments, such as lane rental, to regulate roadworks.
Traffic Management PolicySegregation of ModesIn a situation where all modes are mixed as a single stream of traffic on the road network, it is difficult to provide an optimalbalance of facilities and priority for each mode. Therefore a key requirement is to continue, where practical, to create separatenetworks for each mode, ie public transport, cycling, walking, private cars and goods vehicles.For each mode, the key challenge is to ensure that:
• standards are consistent along the complete network;
• the network is continuous, rather than a series of discrete links;
• the network provides the most direct route for that mode.
62

PedestriansThe guiding principle for pedestrian facilities will continue to be that pedestrians should be attracted to (rather than constrainedinto) using pedestrian facilities. It is anticipated that potential walking speeds of 5kph should be possible, inclusive of junctiondelays, along pedestrian routes. There will be a vast improvement in the quality of pedestrian facilities. In the city centre, newwalking corridors will form the basis of a primary pedestrian network serving commerce, business, leisure and tourism trips, andlinking primary commuter destinations with public transport.
The following general improvements will be provided:
• reduced waiting times and crossing distances at junctions;
• level crossing for pedestrians across junctions and accesses in built up areas;
• additional pedestrian crossing facilities, such as pedestrian refuges;
• widening of footpaths where there are high pedestrian flows, particularly accessing public transport nodes;
• footpaths cleared of unnecessary street furniture;
• improved surface quality (addressing trip hazards, surface materials etc).
In keeping with the overall Strategy, all pedestrian facilities will be designed to be suitable for mobility-impaired and disabledpersons.
Cycle Mode Completion of the Strategic Cycle network and links to public transport remains the principal objective for the cycling mode.The short-term focus of the cycling element of the Strategy will be to:
• continue to develop the emerging network of strategic cycleways;
• provide cycleway links to rail stations and LUAS and bus stops, as well as main employment and retail destinations;
• ensure adequate cycle parking facilities;
• provide tourist and recreational cycling facilities;
• promote cycling as an efficient, fast, healthy, safe and sustainable means of transport.
Under this Strategy, a 350km network comprising strategic, local and recreational cycle facilities, will be completed by 2006. Apermanent monitoring system will be installed across the strategic network, together with a schools database, to givemanagement feedback on cycling usage.
The overall objective of the cycling element of the Strategy will be to increase the proportion of short trips (up to 6km) made bybicycle to 30% by 2016. Trips to places of education and commuting trips of up to 10km in length will be particularly targetedas suitable for cycling.
Quality Bus Network (QBN) Traffic management will provide for the prioritised operation of bus services by:
• continuing to provide the physical infrastructure to give priority to the bus on the road network
• better monitoring of the bus network performance
• targeted priority at junctions, to deliver the required level of service
• provision of facilities for bus passengers.
The Car ModeThis Strategy is concerned with maintaining a high level of service for the private car, by providing shorter delays, reliablejourney times and better information for those motorists who choose to use the private car.
The short-term objective regarding general traffic will continue to be to manage the excess demand for car based travel untilalternatives come on stream. This will include:
63

• preventing key junction overloads on the distributor network, shifting queues away from sensitive areas, maintaining uniform
flows and reducing "turbulence" (uncontrolled merging of two traffic streams) to the greatest extent possible;
• continuing and expanding the on-street parking control policy.
Freight ModeA Regional Freight Study will be undertaken to determine the origin and destination patterns of Heavy Goods Vehicles (HGVs),and to forecast future demand. It will identify appropriate routes and restrictions for general goods distribution and for freighttrips to and from Dublin Port, Dún Laoghaire Port and Dublin Airport. It will also review the scope for improved goodsdistribution strategies, including consolidation centres, night-time deliveries, as well as considering pricing strategies, loading,layover and general distribution management.
Auditing Transport DesignsTransport proposals are often designed with the primary objective of increasing capacity for cars and goods vehicles. The DTOand its agencies will develop checklists and procedures to assess the designs of transport proposals from the point of view ofsafety, pedestrians, cyclists, buses, light rail vehicles, cars and goods vehicles.
Safer Routes to School (SRTS) PolicyA Safer Routes to School (SRTS) programme will deal with children’s journeys to and from school. The key objective is topromote health and safety as well as a move towards sustainable transport. Pilot SRTS projects will be completed in 2001.These will include the production of guidance documents for teachers, parents and pupils. In addition, a survey will beconducted across all schools, to set a baseline to monitor progress under this programme. The SRTS programme is envisagedto become part of general school management.
CellsCells are areas where through car traffic is removed, but access traffic is allowed. By removing through traffic, it is possible toprovide vastly improved facilities for pedestrians, cyclists and public transport. The development of the city centre cells willcontinue. Further attention will be given to the following issues:
• severance at cell boundaries;
• access to car parks inside cells or at cell boundaries;
• the provision of links between cells for cyclists, pedestrians and public transport;
• the requirement to maintain and foster urban villages;
• the enhancement of the unique character of some principal streets in the city.
Information PolicyTravel information systems (maps, kiosks, internet, phones etc) will be developed to provide information to enable people tomake appropriate travel choices before they start their journeys.
Within the transport networks, effective and comprehensive direction signing, passenger and traffic information will be essential.The systems will be developed so that traffic–related information will move from being passive (informing what has occurred) toactive (informing what to do instead).
The shape of these systems and their interaction with other transport-related systems will be examined through a TravelInformation Needs Study.
Motorway Management in the DTO AreaWhile motorways are the safest type of road, the high-speed environment requires that motorways must be managed in adifferent way to other roads. There will be one regional control centre for all the motorways within the Greater Dublin Area. Thecentre will have an integrated suite of systems for the management and maintenance of the motorway system. The motorwaycontrol centre will also manage grade-separated motorway interchanges.
64

DEMAND MANAGEMENT Earlier sections of this chapter have described the first element of the Strategy, the supply of infrastructure projects and serviceimprovements. The second, interdependent element of the Strategy is demand management, which seeks to reduce thegrowth in the demand for travel while maintaining economic progress, and which is designed to encourage a transfer of trips tosustainable modes.
It is appropriate here to recap the scale of the challenge that presents itself in the design of the demand managementproposals for the Strategy. Between 1991 and 1997, the number of trips made in the DTI area in the am peak increased from172,000 to 250,000, an increase of 45%, or over 7% each year. It is estimated that the average trip length in the DTI studyarea has grown from 7.3km in 1991 to over 12km in 1997, an increase of almost 70%. The modal split was 73% in favour ofprivate transport in 1997, up from 64% in 1991. DTO model projections show that total peak hour trip demand is expected torise from 250,000 trips in 1997 to 488,000 trips in 2016, an increase of 95%. Without policy interventions, average trip lengthscan also be expected to grow further in the period up to 2016.
Sensitivity tests carried out in Phase 7 of the technical tasks described in Chapter 4 demonstrates that the transport outcome ofimplementing the infrastructure strategy without demand management measures will not satisfy the strategic objectives of theStrategy. If the DTO Strategy is to be effective, it must achieve a significant modal shift to public transport, reduce congestionand raise journey speeds and levels of road service to essential traffic. This means that demand for travel must be managed.This was recognised by the Strategic Planning Guidelines in recommending the adoption of measures to reduce the growth indemand for travel and to encourage a higher market share of commuting travel for public transport. The Guidelines state that thesuccess of the land use strategy for the development of the Greater Dublin Area is contingent on the introduction of effectivedemand management measures, since physical planning policies and measures can only partially reduce demand for travel.
A demand management strategy is therefore a critical element of the DTO Strategy, and a comprehensive DemandManagement Study is necessary to develop this. The goals of the demand management strategy will be defined in theproposed study, and will include the following:
• to reduce the growth in demand for travel by motorised modes;
• to encourage further modal transfer from private car to public transport modes at congested times, over and above that
achievable through infrastructural and service enhancement measures. Specifically, the measures proposed in the strategy
should achieve a reduction in the number of peak hour car trips from 250,000 to 180,000 (ie by 28%) in the design year
2016;
• to reduce the level of congestion on the road network to 1991 levels, when the average speed in the morning peak hour was
22kph.
Specifically, the Demand Management Study should identify and rank measures that will:
• complement the infrastructure elements of the Strategy;
• reflect the true costs of all forms of travel, including environmental costs;
• be effective in achieving modal transfer;
• support land use policy in terms of reducing the growth in demand for travel, and facilitate appropriate development of the
Hinterland Area;
• be equitable, feasible and implementable, and be perceived as such.
Available MechanismsThe following mechanisms exist in other countries and cities to manage travel demand, and are among those that will beexamined during the Demand Management Study.
• Land Use Policies: Location of development near public transport and local services; design, density and layout of
development; mixed-use development; parking standards applied to development.
• Economic/Fiscal Instruments: Vehicle and fuel charges and taxes, public transport fares structures and levels; charging
for the use of road space especially during congested periods; parking charges, including charging for workplace parking.
65

• Parking control: management of the supply of parking, Park and Ride sites.
• Mobility Management: the use and benefit of mobility management plans for individual centres of employment.
• Information Technology measures: mechanisms designed to replace travel to work (eg teleworking).
• Reorganisation of work: measures to reduce the number of trips or to transfer trips outside the peak periods (eg flexitime,
4-day working week, more working from home).
Expected OutcomesEach demand management mechanism will generate different types and levels of behavioural reaction. Travellers may:
• retime journeys to travel outside busy periods;
• transfer to a mode with sufficient capacity to ensure arrival at the preferred time;
• change trip origin or destination (more likely over the longer term;
• link trips to other trips that they wish to make, to avoid travelling twice;
• share a private vehicle with others for some or all of the trip;
• decide to forego the trip entirely.
The Demand Management Study will quantify the likely impact on traveller behaviour and assess the feasibility of a package ofmechanisms. Work on the study will be initiated as quickly as possible, to complement progress in the infrastructure andservice enhancement programme set out earlier in this chapter.
GUIDANCE ON COMPLEMENTARY LAND USE POLICIESThe Strategic Planning Guidelines have determined that development will be consolidated within the Metropolitan Area and intodefined development centres in the Hinterland Area. In principle, development outside of these centres is to be restricted tonatural growth in the locality. The DTO Strategy described above complements this land use strategy. The following issuesneed to be addressed by the implementation agencies with the assistance of the DTO where appropriate.
Concentration of Development at the Local LevelDevelopment should seek to maximise the use of walking and cycling as key transportation modes while providing a highquality living environment. This implies that land use patterns should be promoted which encourage the following:
• neighbourhood centres should be located with good access to public transport;
• detailed layouts and design of developments which reflect the importance of walking and cycling as transportation modes by
providing safe and direct access to local services (retailing, schools, employment and leisure) and public transport nodes;
• increased density should be promoted close to public transport nodes;
• mixed use developments should be encouraged.
The resultant land use patterns will be consistent with the aim of consolidating development as proposed in the StrategicPlanning Guidelines and will support the development of alternative modes of travel to the private car.
Consolidating developmentIn order to counter development dispersal tendencies, new development should be concentrated within the Metropolitan Area(in particular within major centres as defined in the Strategic Planning Guidelines), and within the Hinterland developmentcentres. The DTO recommends that these development centres should not be considered homogenous. Rather, publictransport accessibility should be a primary determinant of location, development density and land use types. New developmentshould therefore be concentrated in discrete settlements within defined public transport corridors. However the approach to thedevelopment of the Metropolitan Area and the Hinterland development centres differs, mainly because development patterns inthe built up part of the Metropolitan Area has already been largely determined.
66

67
Metropolitan Area
• The resource of public transport corridors should be maximised by concentrating development along these corridors at
public transport nodes (rail stations, bus stops and interchanges).
• Development should be phased to maximise the utility of existing public transport services and to avail of new services as
they come on stream.
• Reservations for public transport should be protected in the design of new developments.
• A study should be undertaken which identifies at the outset the appropriate locations for additional public transport nodes.
• Local Area Plans should be prepared around rail stations and along Quality Bus Corridors, and should identify the
appropriate development potential for these areas.
• Development near public transportation nodes should comply with the principles set out under “Concentration of
Development at the Local Level” above.
• A number of key interchange nodes will exist where strategic rail corridors intersect. Development near interchange nodes
should be primarily reserved for large trip attractors such as major employers or town/district centres.
• Development of rail stations should support local residential areas by providing local services.
• Integrated Framework Plans for Land Use and Transportation should be developed for each of the Major Centres within the
Metropolitan Area.
Hinterland Development Centres
• Development within the designated development centres should be consistent with the objective of achieving self-
sufficiency.
• Priority should be given to complementary development that supports the local transportation network and is consistent
with the objective of providing predominantly self sustaining development centres.
• An Integrated Framework Plan for Land Use and Transportation which will determine the future development of these areas
should be prepared for each development centre.
• Primarily people based employment activities should be located close to existing and future public transport nodes.
ParkingParking policies and standards should promote the use of sustainable modes of transport, so providing a competitiveadvantage for public transport. Parking policies need to be developed which address this issue and include the following:
• there should be a consistent approach to parking policies and standards within the region;
• parking policies should complement the provision of public transport and should be considered in the overall development
of areas;
• existing parking policies and standards should be reviewed to ensure that they reflect the provision of public transport
services and are consistent with the DTO policy of reducing car dependency;
• parking standards must be set as a maximum for each land use within the relevant development plan;
• provision of parking should not necessarily be considered permanent and where possible local authorities should maintain
control of all public parking;
• the location of parking should not compromise the policies set out under “Concentration of Development at the Local Level”
above.
Local authorities, as the primary implementing agencies of land use policy, should take full account of the issues set out abovein the development plan review process. Commensurate with the indicative implementation time frames detailed in the Strategy,development plans should phase new development accordingly. There needs to be consistency across the development planswithin the Greater Dublin Area.

Strategic ProvisionDublin Airport and Dublin Port are of strategic importance as both regional and national gateways. Development near thesefacilities should reflect their respective functions. Further studies need to be undertaken in order to identify appropriate land useand transportation planning objectives for the areas concerned.
There are a number of issues that should be addressed in any review of the Strategic Planning Guidelines.
• How public transport infrastructure can be exploited to its maximum within the context of the overall objectives of the
regional planning guidelines.
• How to facilitate high-density development by accelerating the provision of public transport.
• Have development plans been reviewed to reflect the DTO Strategy? That review should disaggregate the Metropolitan Area
into appropriate development zones and clarify the acceptable levels of commuting between each of the designated
Hinterland development centres and the Metropolitan Area.
Guidance NotesThe DTO will provide advice notes on relevant issues relating to land use and transportation. These will provide guidance onspecific issues that cannot be addressed in a strategic document. These will be aimed primarily at local authorities, but alsodesigners and developers. The issues to be covered include:
• Integrated Framework Plans for Land Use and Transportation;
• development at public transport interchange between different rail systems;
• development at public transport nodes along each type of rail system;
• implications of development densities for public transport (in the context of the Guidelines for Planning Authorities on
Residential Density);
• transportation issues in the design and layout for residential, services and employment developments;
• traffic impact assessments;
• mobility management plans.
68

6. The CostsMost of the costs of the Strategy relate to the infrastructure and service improvements element of the Strategy. The costsinclude the capital costs of providing the infrastructure, and the operating costs of maintaining the infrastructure and providingpublic transport services. The demand management element of the Strategy will have some set-up costs, but these are likelyto be relatively small.
The table below shows the capital costs of the infrastructural element of the Strategy. The costs are in 2001 prices and includeland costs, contingencies and VAT, which is assumed to be at 15% on average. The costs for traffic management includecosts for cycling, walking, technical advice, and monitoring and promotion of the Strategy. Where information is available, thecosts are broken down into the two time periods, 2001-2006 and 2007 – 2016. In the cases of integration and trafficmanagement, the total cost is divided equally between the two time periods. The figure for METRO between 2001 and 2006 isan estimate of the cost of the construction which can be completed by the end of 2006.
Capital Costs (IR£Million)2001 – 2006 2007 – 2016 Total
METRO 1,000 (€1,270) 4,687 (€5,951) 5,687 (€7,221)LUAS 1,037 (€1,317) 636 (€808) 1,673 (€2,124)DART/Suburban Rail 1,817 (€2,307) 2,579 (€3,275) 4,396 (€5,582)QBN/Bus Priority 486 (€617) 150 (€190) 636 (€808)Integration 155 (€197) 155 (€197) 309 (€392)Roads 3,256 (€4,134) 972 (€1,234) 4,228 (€5,368)Traffic Management 145 (€184) 145 (€184) 289 (€367)Total 7,896 (€10,026) 9,323 (€11,838) 17,218 (€21,862)
The total capital expenditure is IR£17,218m (€21,862). The expenditure is front-loaded with 46% occurring in the first 6 years andthe remaining 54% occurring in the final 10 years. Expenditure on roads is particularly heavily front-loaded with 77% occurring inthe first 6 years and the remaining 23% occurring in the final 10 years. This is largely because some major National Roads projectsare already at an advanced stage of design and/or construction. In total, public transport accounts for 72% of expenditure.
Operating CostsThere will be significant operating and maintenance costs associated with the public transport infrastructure and serviceimprovements in the Strategy. There will be operating costs associated with the roads infrastructure and demand managementelements of the Strategy.The revenues from tolled road schemes, such as the Dublin Port Tunnel, will cover their operating and maintenance costs.Revenue from possible economic and fiscal instruments of demand management, such as increased parking charges and roadpricing, would cover their costs and could provide significant surplus revenue.
As part of the Strategy work, we have estimated the operating costs and anticipated revenue for the public transport elementsof the Strategy in 2016. The anticipated revenue assumes that average fares remain the same in real terms as today. Theoperating costs and fare revenues will grow between now and 2016 as each new public transport service in the Strategy isadded, and as public transport patronage increases.
The rail operating costs are derived from the "Dublin Suburban Rail Strategic Review" produced for CIE by Arup ConsultingEngineers in March 2000 and the "DTO Strategy, Cost and Programme Review" prepared for the DTO by Arup ConsultingEngineers in July 2000. They have been further updated by additional information received from Iarnród Éireann. Operatingcosts for METRO, DART/Suburban Rail and LUAS include train operation and maintenance, track and station maintenance andticketing costs.
Bus operating costs are based on the operating costs contained in the 1999 Dublin Bus Annual Report, with an allowance forthe extra buses required in 2016, compared to 1999. Vehicle depreciation costs are included for bus (assuming a 10-yearvehicle life) and for rail rolling stock (assuming a 20-year rolling stock life).
69
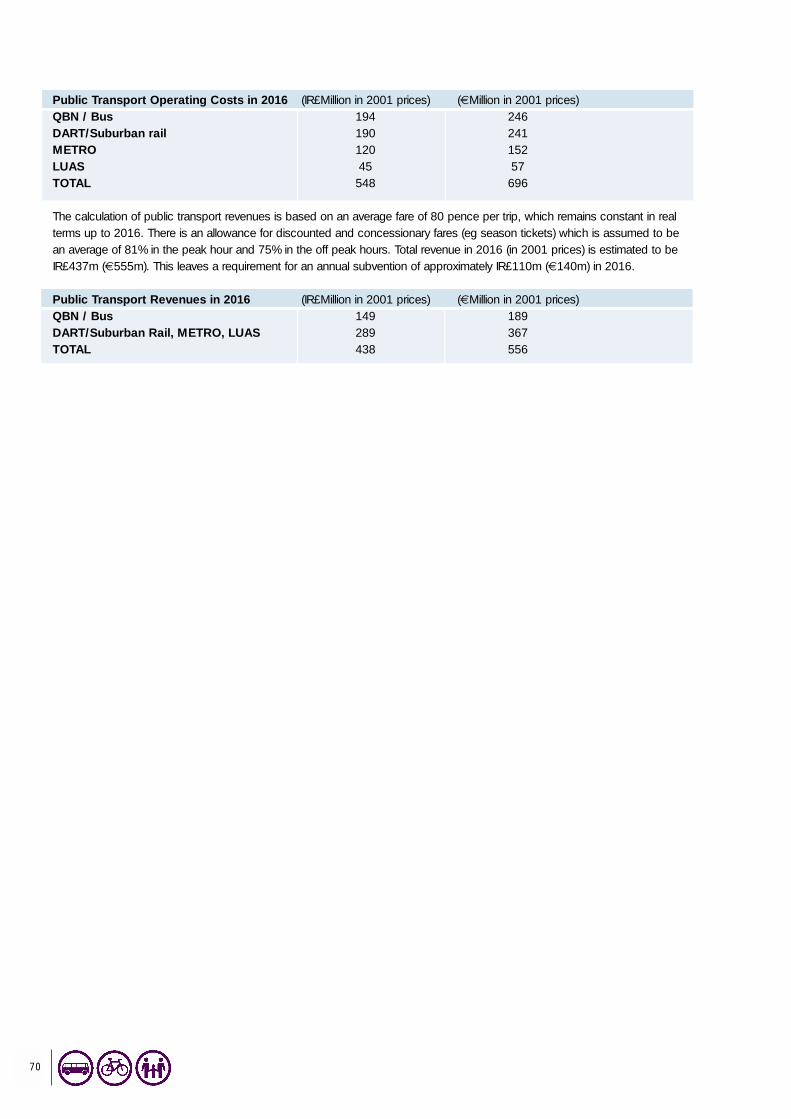
70
Public Transport Operating Costs in 2016 (IR£Million in 2001 prices) (€Million in 2001 prices)QBN / Bus 194 246DART/Suburban rail 190 241METRO 120 152LUAS 45 57TOTAL 548 696
The calculation of public transport revenues is based on an average fare of 80 pence per trip, which remains constant in realterms up to 2016. There is an allowance for discounted and concessionary fares (eg season tickets) which is assumed to bean average of 81% in the peak hour and 75% in the off peak hours. Total revenue in 2016 (in 2001 prices) is estimated to beIR£437m (€555m). This leaves a requirement for an annual subvention of approximately IR£110m (€140m) in 2016.
Public Transport Revenues in 2016 (IR£Million in 2001 prices) (€Million in 2001 prices)QBN / Bus 149 189DART/Suburban Rail, METRO, LUAS 289 367TOTAL 438 556
71
7. The BenefitsThe function of the Strategy is to meet the objectives set out under the Vision Statement in Chapter 2 and the additionalobjectives added by the Steering Committee. The benefits of the Strategy derive from meeting those objectives.
During the development of the Strategy, a number of alternative strategies were evaluated and compared. Because of theimportance of having an objective analysis of the alternative strategies, the DTO employed independent consultants, GoodbodyEconomic Consultants, to carry out this work.
The objectives for the development of transport in Dublin are wide-ranging. Consequently, the consultant adopted a multi-criteria analysis procedure, incorporating a conventional cost-benefit analysis. Multi-criteria analysis incorporates broaderimpacts that cannot be quantified in monetary terms (eg sustainability, integration with land use policies). Cost-benefit analysisis concerned with costs and benefits that can be quantified in monetary terms (eg capital costs, monetary value of timesavings). Most major transport investment projects in Ireland are now subject to a cost-benefit analysis and it is thus possible tocompare the results of their cost-benefit analyses and gain insights into their relative worth.
MULTI-CRITERIA ANALYSIS METHODOLOGY Multi-criteria analysis (MCA) involves a number of stages. The first stage is to identify the objectives to which the Strategy is tocontribute. In the case of the DTO Strategy, the objectives are set out in the Vision Statement under five headings. For thepurposes of the multi-criteria analysis, the objectives were regrouped under four effects. The second stage is to establishcriteria by which these objectives can be measured. Within multi-criteria analysis, the criteria should be relatively few innumber and they must be mutually exclusive (ie there must be no overlap between them). Measurement may include moneyvaluation (eg Net Present Value) and quantification (eg accessibility). Where neither money valuation nor quantification ispossible (eg integration with land use policy), a qualitative assessment must be made.
Identifying Objectives The DTO Steering Committee adopted a number of objectives to which the Strategy is expected to contribute. The objectiveswere formed under the following headings:
• The Regional Economy;
• Quality of Life;
• International and National Context;
• Development of the City and the Regions;
• Efficiency in Implementation.

72
Under these headings, twenty-five objectives were initially identified, and two more were added during the course of developingthe Strategy. For the purposes of the multi-criteria analysis, the 25 objectives were regrouped into four broad categories:
• Economy: to support the growth of the economy of the region in an effective and efficient manner. The effect on the
economy is assessed under three headings: effectiveness, efficiency and safety.
• Accessibility: to promote equity in access to transport, by enhancing accessibility for those without a car and across the
entire Greater Dublin Area. This category is assessed under two headings: social inclusion and regional balance.
• Sustainability: to ensure that the local economy develops in a sustainable way by enhancing the natural and built
environment, and safeguarding non-renewable resources. Sustainability is assessed under three headings: pollutants,
environmental quality and energy resources.
• Policy Integration: to promote the integration of the transport system with land use policies and with long term transport needs.
This is assessed under two headings: integration with land use policies and compatibility with future transport needs.
RESULTS OF THE MULTI-CRITERIA ANALYSISThe results of the multi-criteria evaluation of the Strategy on Economy, Accessibility, Sustainability and Policy Integration areconsidered in turn.
Effect on Economy The effects of the Strategy on Economy were measured using a cost-benefit analysis. The Strategy gives rise to discounted benefits of IR£27,622m (€35,073m) as compared with discounted costs of IR£8,977m(€11,398m). The net present value is thus very substantial at IR£18,645m (€23,674m), indicating that the Strategy is highlyeffective. The efficiency of the Strategy may be measured by the cost-benefit ratio and the internal rate of return. Both of theseare very high at 3.08 and 15.8% respectively. The internal rate of return is well in excess of the test discount rate of 5%, whichis advocated by the Department of Finance. The safety of the Strategy is shown by a net present value of accident savings ofIR£1,272m (€1,615m).
SUMMARY OF DISCOUNTED COSTS AND BENEFITS OF THE STRATEGYBenefits IR£million (€million) Costs IR£million (€million)User Benefits 25,594 (32,498) Capital Costs 7,014 (8,906)Accident Savings 1,272 (1,615) Rail Operating Costs 1,493 (1,896)Air Pollution Savings 728 (924) Bus Operating Costs 470 (597)Noise Pollution Savings 28 (36)Total Benefits 27,622 (35,072) Total Costs 8,977 (11,398)
RESULTS OF COST-BENEFIT ANALYSISCriterion ResultNet Present Value IR£18,645m (€23,674m)Cost-Benefit Ratio 3.08Internal Rate of Return 15.8%
Effect on AccessibilitySocial inclusion requires a measure that estimates accessibility for those people who only have access to public transport. The DTI model’s ‘car not-available’ accessibility index for trip origins was used for this purpose. This measures the accessibilityof each origin zone to all destination zones, for those who do not have a car available to them. It does this by calculating theaverage generalised cost of travel on public transport, weighted by the number of trips to each destination zone.
The table below sets out the level of car-not-available accessibility from the North, West and South suburbs to all other areas.The data shows that the Strategy improves accessibility of all areas relative to the Do-minimum situation.

IMPACT OF THE STRATEGY ON ACCESSIBILITY OF CAR-NOT-AVAILABLE PERSONSDistrict Accessibility IndexNorth Suburbs 109West Suburbs 125South Suburbs 109Outlying Areas 132
Note: values higher than 100 indicate improved accessibility compared with the Do-minimum situation
Regional balance is measured by the accessibility of different zones within the Greater Dublin Area. The more uniformaccessibility is across zones, the better the regional balance. Estimation of regional balance is based on the overall indices ofaccessibility (car-available and car-not-available). One means of measuring the relative dispersion of accessibility is to estimatethe co-efficient of variation of the accessibility index values for all the districts in the Greater Dublin Area. The lower the co-efficient of variation, the closer are the zonal accessibility levels to each other. The table below sets out the co-efficient ofvariation for zonal accessibility for origins and destinations separately. The Strategy performs well on this criterion.
IMPACT OF THE STRATEGY ON REGIONAL BALANCEAccessibility Index Co-efficient of variationOrigins 0.1649Destinations 0.1960
Effect on SustainabilityThe analysis of emissions covered carbon dioxide (CO2), carbon monoxide (CO), volatile organic compounds (VOC), nitrousoxides (NOx), particulate matter (PM), and sulphur dioxide (SO2).
Although the demand for travel is predicted to almost double between the base year of 1997 and the forecast year of 2016,emissions of local pollutants are not expected to increase. This is largely because of predicted improvements in vehicletechnology. While technological change will also tend to reduce greenhouse gas emissions, this is offset by large increase inthe demand for travel. The Strategy leads to a significant modal shift from the private car to public transport, which is lesspolluting and consumes less energy.
The analysis shows that Strategy is successful in reducing emissions. For example, emissions of CO2 fall from 2,611kT to1,551kT or by 41% under the Strategy.
The sum of the discounted noise pollution benefits is IR£28m (€36m) for the Strategy.
Energy consumption is anticipated to double by 2016 from its 1997 level. This reflects the growth in demand for travel, which ispartly mitigated by improvements in vehicle fuel efficiency. The Strategy is successful in increasing the public transport modalshare, which yields substantial energy savings. The Strategy provides a 40% reduction in energy consumption relative to theDo-minimum situation.
EMISSIONS AND ENERGY CONSUMPTION Unit of 1997 2016 without 2016 with
Emission Measurement Baseline the Strategy the StrategyCO2 Kilo Tonne 1,328 2,611 1,551CO Tonne 75,649 32,058 18,780VOC Tonne 12,209 5,321 3,142NOX Tonne 6,699 1,936 1,288PM Tonne 204 43 25SO2 Tonne 611 810 464Energy Tera Joule 18,356 36,694 21,830
73

Effect on Policy IntegrationThis criterion for compatibility with land use plans assesses the compatibility of the Strategy with the Strategic PlanningGuidelines for the Greater Dublin Area. These Guidelines are based on the principle of consolidation of land uses and separateapproaches have been devised for the Dublin Metropolitan Area and the Dublin Hinterland Area. The Strategy is based onforecasts of the demand for travel that were derived from the land use patterns in the Guidelines. It follows that the Strategy iscompatible with, and supportive of, the Guidelines.
This assessment of future transport needs involves evaluating the Strategy based on the spare capacity available in theforecast year 2016 in the DART/suburban rail, METRO and LUAS networks, and consequently the ability of the Strategy to offergreater capacity beyond 2016. The capacity utilisation of the Strategy was evaluated on a service by service basis bycomparing line capacity with peak hour service frequencies in 2016. The LUAS lines within the Strategy are close to capacity inyear 2016. However, the METRO network has significant spare capacity. The capacity utilisation of suburban rail lines is abovethat of the METRO but below that of the LRT. There is significant spare capacity on the rail interconnector.
SUMMARY OF THE BENEFITS OF THE STRATEGYThe multi-criteria evaluation shows that:
• the Strategy is very effective in terms of its contribution to the economy. The economic benefits of the Strategy are very
substantial at IR£18.6bn (€23.7bn) in net present value terms. With a cost-benefit ratio of 3.08 and a rate of return of 15.8%,
the Strategy is efficient and provides good value for money;
• it improves social inclusion by providing a transport system that is accessible to all sectors of society and all geographic
districts in the Greater Dublin Area;
• it promotes sustainability by reducing polluting emissions, noise impacts and energy consumption;
• it supports the Strategic Planning Guidelines and caters for longer-term transport needs.
It is worthwhile to describe some of the benefits in practical terms outside the strict terms of the multi-criteria analysis.
• The transport system will have adequate capacity to cater for all journeys, in particular for all journeys to work and
education in the morning peak hour.
• There will be an extensive high-quality public transport system extending over a large catchment area. Most people will live
within 10 minutes walking distance of DART/suburban rail, METRO, LUAS or the Quality Bus Network.
• There will be an integrated public transport system. Most journeys will be possible on public transport with, at most, one
interchange and all journeys will be possible with only one ticket.
• The level of road congestion will be less than half what it would be if the Strategy were not implemented. The average
speed on the road network in the morning peak hour will be increased to 20kph, compared with 8kph without the Strategy.
• Average journey times will reduce dramatically. The average journey time by bus and rail will be 37% and 53% respectively
less than the situation if the Strategy were not implemented. The average journey time reduction for car will be 39%.
AVERAGE JOURNEY TIMES IN 2016 AM PEAK (Minutes)Without the Strategy With the Strategy
Bus 47 29Rail 38 18Car 94 57Weighted Average 76 34
• Public transport will gain an improved share of the market for travel. Public transport will have 63% of the total market for
travel in the Greater Dublin Area and 85% of those trips with destinations in the city centre. This compares very favourably
to the situation if the Strategy were not implemented, where public transport would carry only 35% of the total market, and
72% of those trips with destinations in the city centre.
74
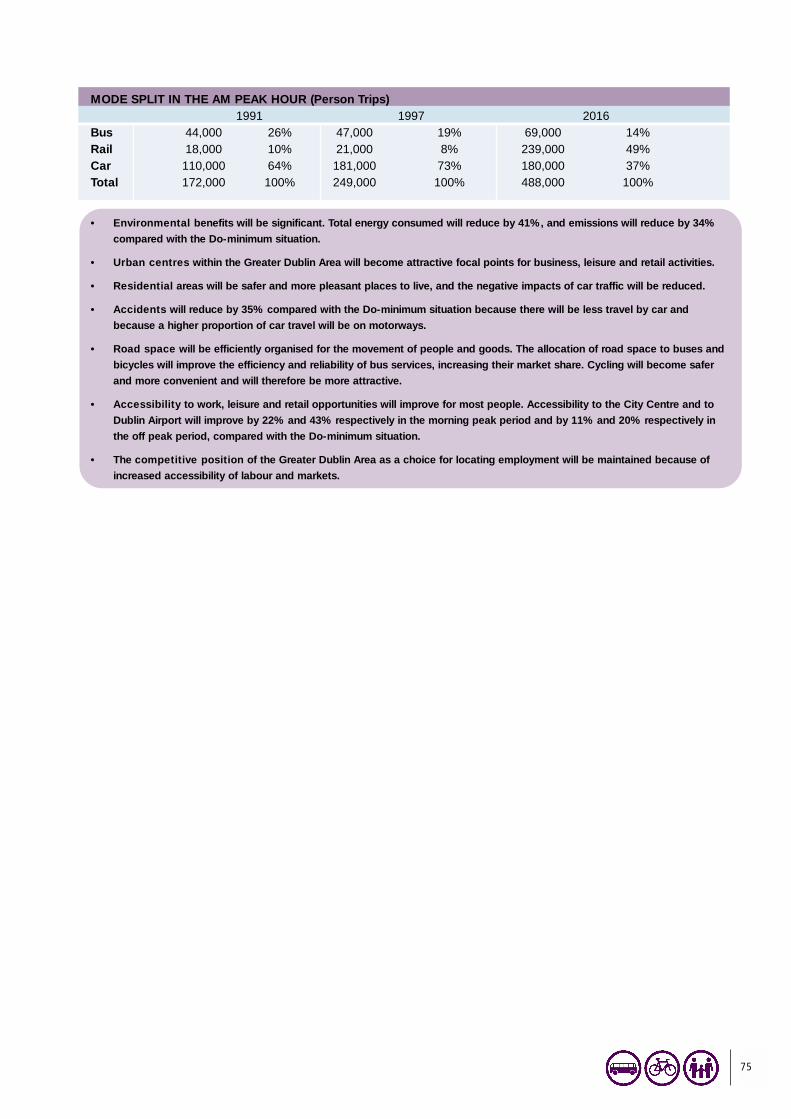
75
MODE SPLIT IN THE AM PEAK HOUR (Person Trips)1991 1997 2016
Bus 44,000 26% 47,000 19% 69,000 14%Rail 18,000 10% 21,000 8% 239,000 49%Car 110,000 64% 181,000 73% 180,000 37%Total 172,000 100% 249,000 100% 488,000 100%
• Environmental benefits will be significant. Total energy consumed will reduce by 41%, and emissions will reduce by 34%
compared with the Do-minimum situation.
• Urban centres within the Greater Dublin Area will become attractive focal points for business, leisure and retail activities.
• Residential areas will be safer and more pleasant places to live, and the negative impacts of car traffic will be reduced.
• Accidents will reduce by 35% compared with the Do-minimum situation because there will be less travel by car and
because a higher proportion of car travel will be on motorways.
• Road space will be efficiently organised for the movement of people and goods. The allocation of road space to buses and
bicycles will improve the efficiency and reliability of bus services, increasing their market share. Cycling will become safer
and more convenient and will therefore be more attractive.
• Accessibility to work, leisure and retail opportunities will improve for most people. Accessibility to the City Centre and to
Dublin Airport will improve by 22% and 43% respectively in the morning peak period and by 11% and 20% respectively in
the off peak period, compared with the Do-minimum situation.
• The competitive position of the Greater Dublin Area as a choice for locating employment will be maintained because of
increased accessibility of labour and markets.
76
8. The ProgrammeThe phasing of the Strategy is designed to address short term transportation needs and to put in place an integratedtransportation system which will meet the medium to longer term requirements of the Greater Dublin Area.
In the short term, the aim is to provide additional public transport capacity, primarily on the bus network, and to improve trafficmanagement, including better bus priority. In the medium to longer term, the emphasis will switch to rail–based public transport(LUAS, METRO and DART/Suburban rail) and demand management. The aim is to create an integrated transport network,which has sufficient capacity to meet the transportation requirements of the Greater Dublin Area well beyond the 2016 horizonof this Strategy.
The programme is divided into four phases:
• PHASE 1: from the beginning 2001 to the end of 2003;
• PHASE 2: from the beginning 2004 to the end of 2006 (the end of the National Development Plan);
• PHASE 3: from the beginning 2007 to the end of 2010;
• PHASE 4: from the beginning 2011 to the end of 2016 (the horizon year of the Strategy).
The phasing of the programme is influenced by a range of factors, including:
• the urgency of the transportation demand (is the investment required to address a demand for transport that exists now or
one that will exist at some future date?);
• land use considerations (is the investment required to serve an existing development, a new development or to influence the
pattern of future development?);
• the current state of preparedness of the project (is the project only at the conceptual stage or has detailed planning and
design been completed?);
• operational issues (will the construction of the project interfere with existing transport services?)
• the physical scale and capital cost of the particular project;
• the lead time required for the planning, design, consultation and statutory approval process;
• whether the project involves the improvement of an existing infrastructure, facility or service or the provision of a new one.
The following table sets out an indicative programme for the period 2001-2016. A more detailed implementation programme forthe period 2001 to 2003 will be included in a Short Term Action Plan.

Indicative Implementation Programme 2000 to 2016
National Development Plan/Blueprint Additional DTO Strategy projects
�2003 �2006 �2010 �2016
QBC/Bus Priority Projects
Establish QBN Project Office and develop implementation plan
Planning of bus services
Completion of original 11 QBCs and Ballymun QBC
Completion of City Centre QBN
Bus Priority links between rail and QBC networks and major suburban employment
centres including Sandyford, Tallaght West, Blanchardstown and Mulhuddart
Bus shelters
Local bus services and bus priority in Metropolitan and
Hinterland town/retail/development centres
Additional orbital and radial QBN measures
Additional buses for the Metropolitan Area
Additional buses for the Hinterland Area
Replacement buses for the Metropolitan Area and the Hinterland Area
Additional bus depots
DART/Suburban Rail
DART and coastal suburban upgrade project
Maynooth line upgrade project
Kildare suburban line upgrade project
Construct additional track from Connolly to north of Howth Junction
Restrict level crossings south of Grand Canal Dock and resignal
Greystones to Arklow upgrade
Plan and design (to Railway Order stage) the Interconnector Tunnel from Heuston
via Pearse to Docklands
Construct Interconnector Tunnel from Heuston via Pearse to Docklands
Plan and design the Navan rail line to Railway Order stage
Construct rail line from Clonsilla to Dunboyne (Navan line phase 1)
Extend rail line from Dunboyne to Navan
Electrify the Maynooth and Sallins rail lines for suburban services
Construct extra tracks west of Hazelhatch to Sallins
Purchase additional DART/Arrow cars
Provide additional stabling and depot facilities
LUAS
Construct Tallaght to Connolly line via city centre
Construct Sandyford to St Stephen’s Green line via Dundrum
Construct line from south inner city to Ballymun
Develop new LUAS lines to Light Rail Order stage
Extend Tallaght line to Point Depot
Extend line from Sandyford to Cherrywood
Purchase additional rolling stock for Lines A,B and C
Construct line from Lucan to Docklands via south city
Extend line from Ballymun to Sillogue
Construct branch line from Whitehall to Kilbarrack DART Station
Extend Ballymun line southwards from south inner city to Rathfarnham and Dundrum
77
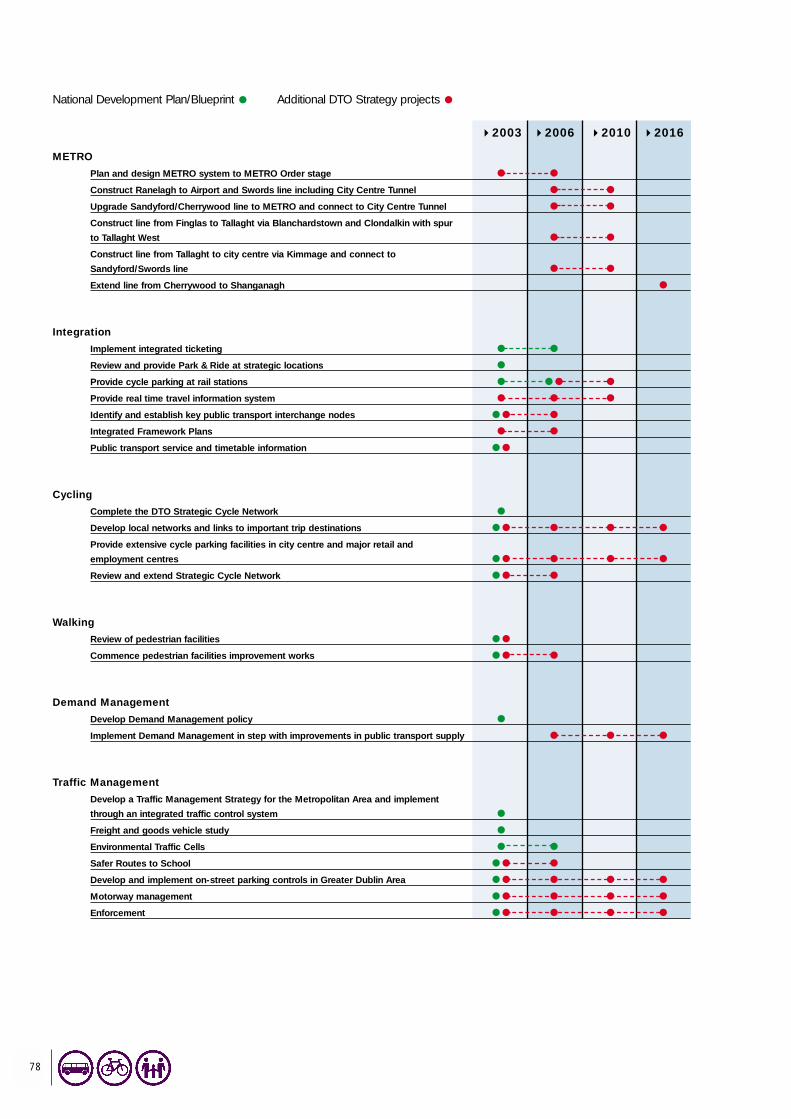
78
National Development Plan/Blueprint Additional DTO Strategy projects
�2003 �2006 �2010 �2016
METRO
Plan and design METRO system to METRO Order stage
Construct Ranelagh to Airport and Swords line including City Centre Tunnel
Upgrade Sandyford/Cherrywood line to METRO and connect to City Centre Tunnel
Construct line from Finglas to Tallaght via Blanchardstown and Clondalkin with spur
to Tallaght West
Construct line from Tallaght to city centre via Kimmage and connect to
Sandyford/Swords line
Extend line from Cherrywood to Shanganagh
Integration
Implement integrated ticketing
Review and provide Park & Ride at strategic locations
Provide cycle parking at rail stations
Provide real time travel information system
Identify and establish key public transport interchange nodes
Integrated Framework Plans
Public transport service and timetable information
Cycling
Complete the DTO Strategic Cycle Network
Develop local networks and links to important trip destinations
Provide extensive cycle parking facilities in city centre and major retail and
employment centres
Review and extend Strategic Cycle Network
Walking
Review of pedestrian facilities
Commence pedestrian facilities improvement works
Demand Management
Develop Demand Management policy
Implement Demand Management in step with improvements in public transport supply
Traffic Management
Develop a Traffic Management Strategy for the Metropolitan Area and implement
through an integrated traffic control system
Freight and goods vehicle study
Environmental Traffic Cells
Safer Routes to School
Develop and implement on-street parking controls in Greater Dublin Area
Motorway management
Enforcement

79
National Development Plan/Blueprint Additional DTO Strategy projects
�2003 �2006 �2010 �2016
Advice and Strategy Promotion
Strategy promotion campaigns
Advice Notes and manuals for local authorities
Monitoring Projects
Monitoring of implementation of DTO Strategy on a quarterly basis
Monitoring the performance of DTO Strategy measures
Surveys and data collection
National Road Projects - Metropolitan Area
M1 Northern Motorway (Airport to Five Roads)
N2 improvement from M50 to north of Ashbourne
N4 Leixlip to M50
N7 Naas Road improvements
N11 junction improvements
M50 South Eastern Motorway
M50 upgrade and junction improvements
N81 Tallaght By-pass to N82 improvement
Dublin Port Tunnel
Eastern By-pass
National Road Projects - Hinterland Area
M1 Drogheda By-pass
N3 Clonee to north of Kells
M4 Kinnegad to Kilcock
N7 Naas Road improvements (Kildare)
M7 Kildare By-pass
M7 Monasterevin By-pass
N9 Kilcullen to Carlow
N11 Glen of the Downs
N11 Rathnew to Newtownmountkennedy
N11 Arklow By-pass to Rathnew
N51 Slane to Navan
N78 Athy Relief Road
N81 Blessington to N82 improvement
Drogheda/Navan/Newbridge Orbital - establish alignment and construct

80
National Development Plan/Blueprint Additional DTO Strategy projects
�2003 �2006 �2010 �2016
Non-National Road Projects - Metropolitan Area
Blackhall Place Bridge
Cork Street/The Coombe
East Wall Road (Tolka Quay to Sheriff Street)
Macken Street Bridge
North King Street
Cruiserath Road
Donabate By-pass
Jamestown Road to St Margaret’s Road
Ongar Road
Outer Ring Road - Lucan to N2
Ballycullen Road to Killinniny
Ballyboden Road to county boundary
Firhouse Road improvement
Greenhills Road improvement
Outer Ring Road - Cheeverstown to Lucan
Walkinstown to Saggart via Ballymount and Cookstown
Church Road Phase 3
Dundrum Main Street By-pass
Dún Laoghaire Port - improve access
Monkstown Ring Road
Wyckham By-pass extension
Celbridge interchange and ancillary roads
Greystones Southern Access
Ballymore-Pretty Bush-Mill Road
Non-National Road Projects - Hinterland Area
Lusk By-pass
Balbriggan Inner Relief Road (Stage 2)
Trim-Dublin improvement scheme (R154)
Trim-Navan improvement scheme (R161)
Athlumney (phase 1) (R161)
Plattin-Colp
Trim-Kilcock (R158)
Naas Ring Road/Inner Relief Road
Clane Inner Relief Road
Enfield - Edenderry (R402) improvement scheme
Barberstown Cross - Maynooth (R406) improvement scheme
Sallins - Killcock (R407) improvement scheme
Newtown Relief Road
Blessington Relief Road
Kilcoole Western Relief Road
Wicklow Port Access Route

9. The Next StepsProposed New Institutional Arrangements for Land Use and TransportThe Ministers for the Environment and Local Government and Public Enterprise recently published a Government consultationpaper in relation to the institutional arrangements for land use and transport in the Greater Dublin Area.
The consultation paper proposes the establishment of a Strategic Body for the Greater Dublin Area which will prepare long-termstrategies for land use and transport, monitor and enforce compliance with these strategies by the implementing agencies andallocate Exchequer finance for transport, other than national roads.
The new Strategic Body will act as the independent regulator of all Dublin public transport, setting detailed service requirementsand standards and procuring the provision of services through franchising, public service contracts and licensing. Thegovernance structure of the proposed Body will be similar to the Dublin Docklands Development Authority. A 3 to 5 memberExecutive Board is proposed which will be responsible for the day-to-day work of the Body, including the regulation of publictransport, and there will be a larger representative Council responsible for policy.
The planned Railway Procurement Agency will operate on a stand-alone basis but will only undertake projects which areconsistent with the strategy adopted by the new Strategic Body and in accordance with the regulatory framework set by it.
The National Roads Authority will continue to carry out all its national road functions in the Greater Dublin Area, but will beobliged to adopt and implement a programme which is consistent with the strategy adopted by the new Strategic Body.
The paper also proposes a number of important reforms relating to programme and project implementation, particularly inrelation to traffic management and enforcement and suburban rail.
• Traffic/demand management policy would be decided by the new Strategic Body. This would include the demand
management strategy and traffic management strategy that the DTO will develop following more detailed studies.
• The paper endorses the decision of the DTO and the Dublin local authorities that a single dedicated QBN project team be
established by the Director of Traffic to implement the Quality Bus Network on a ‘whole route’ basis for the Dublin area.
• Implementation of some other strategic or regional traffic management measures will be allocated to the Director of Traffic
(acting for the Greater Dublin Area or just Dublin City and County as appropriate). A review will be conducted to identify
appropriate functions.
• Local traffic management functions will remain with the local authorities but they will be asked to review their
implementation arrangements, having regard to the experience of the Director of Traffic.
• Measures to increase enforcement resources are proposed including more use of contracting-out, automated systems and
administrative sanctions and the ring fencing of Garda manpower. The Strategic Body will regularly report to the
Government on the adequacy of enforcement.
• A number of initiatives are already underway to address suburban rail delivery (including a high level review of Iarnród
Éireann, an internal Iarnród Éireann restructuring programme and the recruitment of project management expertise).
A cross Departmental team has been established to consider the outcome of the consultation process, prepare the necessarylegislation and address the detailed administrative arrangements for the new Strategic Body.
The Dublin Transportation Office welcomes the Government proposals which are broadly in line with the recommendations it setout in the outline document ‘A Platform for Change’, published in September 2000. The DTO will work with Government in thedevelopment and implementation of these proposals and will do everything it can to ensure a smooth transition to the newStrategic Body.
ImplementationThe DTO Strategy provides an overall planning framework for the development of the transport system in the Greater DublinArea. It is not, nor was it ever intended to be, a detailed blueprint for each of the individual projects and programmesrecommended for implementation. Each project will now have to be taken through a detailed planning process involving, as
81

appropriate, route selection, technical feasibility studies, economic and environmental evaluations, detailed design, publicconsultation and statutory approval procedures.
The Short Term Action Plan, which is being prepared by the DTO, will set out a detailed planning and implementationprogramme for the major projects in the Strategy. In addition, the Government consultation paper proposes significantinstitutional and administrative reforms that will strengthen the arrangements for project planning and delivery.
The Short Term Action Plan will identify a lead agency for each major project and programme. A dedicated project team hasbeen, or will be appointed, with responsibility for planning and implementing individual projects.
This Strategy contains five major infrastructural projects and it is proposed that each should have a project team led by aparticular agency:
DART/Suburban Rail Iarnród ÉireannMETRO Light Rail Project Office / Railway Procurement AgencyLUAS Light Rail Project Office / Railway Procurement AgencyQBC/Bus priority QBN Project Team (Director of Traffic)Roads National Roads Authority (national roads) and Local Authorities (non-national roads).
Public Private Partnership (PPP)A number of major projects are suitable for implementation on a public private partnership (PPP) basis involving an appropriatecombination of design, build, maintain, operate and finance. It will be important for the PPP procurement process to ensure thatproject design, operation and management is consistent with the DTO Strategy. The Government has published legislation thatprovides for the establishment of a Railway Procurement Agency to procure PPPs for public transport. In the meantime, theDepartment of Public Enterprise and the Light Rail Project Office are carrying out preparatory work. The NRA has already put inplace effective arrangements for the delivery of PPPs for national roads.
The Government has already decided that the following projects should be implemented on a PPP basis:
• LUAS lines from Tallaght to Abbey Street and from Sandyford to St Stephen’s Green (operation only);
• METRO (a combination of design, build, finance and/or operate).
The following projects are also recommended by the DTO as PPP projects:
• the Eastern By-pass;
• N3 – Clonee to Kells;
• M4 – Enfield to Kinnegad;
• the additional LUAS lines;
• the rail link to Navan;
• integrated ticketing and information systems.
82

Appendix 1: DTO CommitteesDTO Steering CommitteeMr. Conor McCarthy (Chair) Dublin Transportation OfficeMr. Derek Brady Dún Laoghaire-Rathdown County CouncilMr. Niall Callan Department of the Environment and Local GovernmentMr. John Henry Dublin Transportation OfficeMr. Joe Horan Meath County CouncilMr. Frank Kavanagh South Dublin County CouncilMr. Owen Keegan Dublin CorporationAsst. Commissioner Jim McHugh Garda SíochánaMr. Pat Mangan Department of Public EnterpriseCllr. Olivia Mitchel TD DTO Advisory CommitteeProf. Simon Perry DTO Advisory Committee Mr. William Soffe Fingal County CouncilMr. Michael Tobin National Roads AuthorityDr. Alan Westwell Córas Iompair Éireann
Steering Group for Strategy UpdateMr. Pat Mangan (Chair) Department of Public EnterpriseMr. Tim Brick Dublin Corporation Mr. Michael Cahill National Roads Authority Mr. John Devlin Department of the Environment and Local GovernmentMr. Owen Keegan Dublin CorporationMr. Conor McCarthy Dublin Transportation OfficeMr. Peter McEvoy Department of the Environment and Local GovernmentMr. Donal Mangan Córas Iompair ÉireannMr. William Murray Dún Laoghaire-Rathdown County Council Mr. Jim O'Brien Department of FinanceMr. Michael Reidy Córas Iompair ÉireannMr. Fintan Towey Department of Public Enterprise
DTO Advisory CommitteeProf. Simon Perry (Chair) Transport Studies Group – TCDAlderman Martin Brady Dublin CorporationCllr. Sean Kenny Dublin CorporationCllr. Gerry Lynam Fingal County CouncilCllr. Margaret Richardson Fingal County CouncilCllr. Paul Gogarty South Dublin County CouncilCllr. Charles O’Connor South Dublin County CouncilCllr. Maria Corrigan Dún Laoghaire-Rathdown County CouncilCllr. Olivia Mitchell TD Dún Laoghaire-Rathdown County CouncilCllr. Oliver Brooks Meath County CouncilCllr. Patsy O’Neill Meath County CouncilCllr. Michael Lawlor Wicklow County CouncilCllr. Derek Mitchell Wicklow County CouncilMr. Clive Brownlee Dublin Chamber of CommerceMr. Tom Coffey Dublin City Centre Business AssociationMs. Karen Gannon IBECMr. Hugh Geraghty ICTUMr. Joe Jones Dublin PortMr. Frank King Federation of Road Transport Operators
83

Ms. Tonia McMahon Earthwatch/VOICECllr. Eamon Ryan Dublin Cycling CampaignMs. Julie Twoomey Irish Wheelchair AssociationMs. Mary Warren-Darley Royal Town Planning InstituteMs. Christine Whyte National Disability Authority
84