Quark: A Purely-Functional Scala DSL for Data Processing & Analytics
Upload
nguyennhanCategory
view
213download
0
A pipeline for functional and visual analytics of
microbial genetic networks
Leandro Corrêa1, Ronnie Alves1,2, Fabiana Goés1, Cristian Chaparro2 andLucinéia Thom3
1 PPGCC - Federal University of Pará, Belém, [email protected]
2 Vale Institute of Technology, Belém, [email protected], [email protected]
3 PPGC - Federal University of Rio Grande do Sul, Porto Alegre, [email protected]
Abstract. Microorganisms abound everywhere. Though we know theyplay key roles in several ecosystems, too little is known about how thesecomplex communities work. To act as a community they must interactwith each other in order to achieve such community stability in whichproper functions could help to adapt and survive to unbearable condi-tions. Thus, to e�ectively understand microbial genetic networks it isnecessary to explore them by means of systems biology. An importantchallenge in systems biology is to determine the structures and mech-anisms by which these complex networks control cell processes. In thispaper, we present the FUNN-MG pipeline for functional and visual an-alytics of microbial genetic networks allowing to uncover strong interac-tions inside microbial communities.
Keywords: systems biology, gene and pathway enrichment analysis, graph represen-tation, graph visualization, metagenomics
1 Introduction
Microorganisms abound in every part of the biosphere including soil, hot springs,on the ocean floor, high in the atmosphere, deep inside rocks within the Earth’scrust and in human tissues. They are extremely adaptable to conditions whereno one else could be able to survive.
Their adaptability is mainly due to the fact that they live in complex commu-nities. Interactions inside the microbial networks plays essential functions for themaintenance and survival of the community. Unfortunately, too little is knownabout microbial interactions.
With the recent advent of High-Throughput Sequencing (HTS) technologies,metagenomic 1 sequencing approaches have been applied to investigate charac-terizations of diverse microbial communities, including target sequencing of thephylogenetic marker gene encoding 16S rRNA and whole-metagenome shotgun1 Metagenomics is a discipline that enables the study of the (meta)genomes of uncul-
tured microorganisms [5].
sequencing [1]. Additionally, the rapid development of numerous computationaltools and methodologies have been explored for e�ective interpretation and vi-sualization of taxonomic and metabolic profiling of complex microbial communi-ties. Putting into perspective applications in several domains such as agriculture[2], medicine [3] and biomineralization [4].
Despite the large advance in computational technologies for metagenomicsanalysis there is still a lack of proper tools to highlight the key interactionsin microbial communities, and consequently the genes associated to essentialmetabolic pathways [5]. This task is usually referred as functional analysis ofmicrobial genetic networks and most of the available pipelines deal with a listof microbial genes rather than interactions. Thus, the genomics highlight the“static” view of the genes available in a metagenome, but the interaction aswell as the function that will be performed must be evaluated by an enrichmentanalysis over a proper database of metabolic pathways such as KEEG.
Metagenomics data analysis poses challenges that could be handled by theutilization of Machine Learning (ML) techniques. In fact, ML has been appliedsuccesfully in several genomics problems. In the context of functional analysis itcan provide new ways to explore graphs by using robust statistics, dealing withuncertainty in the data and boosting the search for "hot spots" in large microbialgenetic networks.
In this work we propose a computational pipeline to evaluate functional en-richment of microbial genetic networks. A weighted graph is built with its basison the genes and pathways properly induced from the relative abundance of themetabolic pathways enriched by the associated metagenomic data. In addition,non-supervised ML is applied to enumerate network components (clusters) ofmicrobial genes presenting strong evidence of both interaction and functionalenrichment.
The main contribution of the proposed strategy are:
– A functional enrichment analysis which takes into account microbial geneinteractions;
– A new visual analytics system to explore interactively the enriched metabolicpathways in microbial genetic networks;
– the FUNN-MG R pipeline for the identification of network components (clus-ters) having strong functional enrichment in microbial communities.
2 Metagenomic pathway-centric network analysis
Metagenomic data analysis is a complex analytical tasks in both biological andcomputational senses. In sequence-based metagenomics, researchers focus onfinding the entire genetic sequence, the pattern of the four di�erent nucleotidebases (A, C, G, and T) in the DNA strands found in a sample. The sequencecan then be analyzed in many di�erent ways. For instance, researchers can usethe sequence to analyze the genome of the community as a whole, which cano�er insights about population ecology, evolution and functioning. In this work,we propose the FUNN-MG pipeline (Figure 1) which provides a functional and
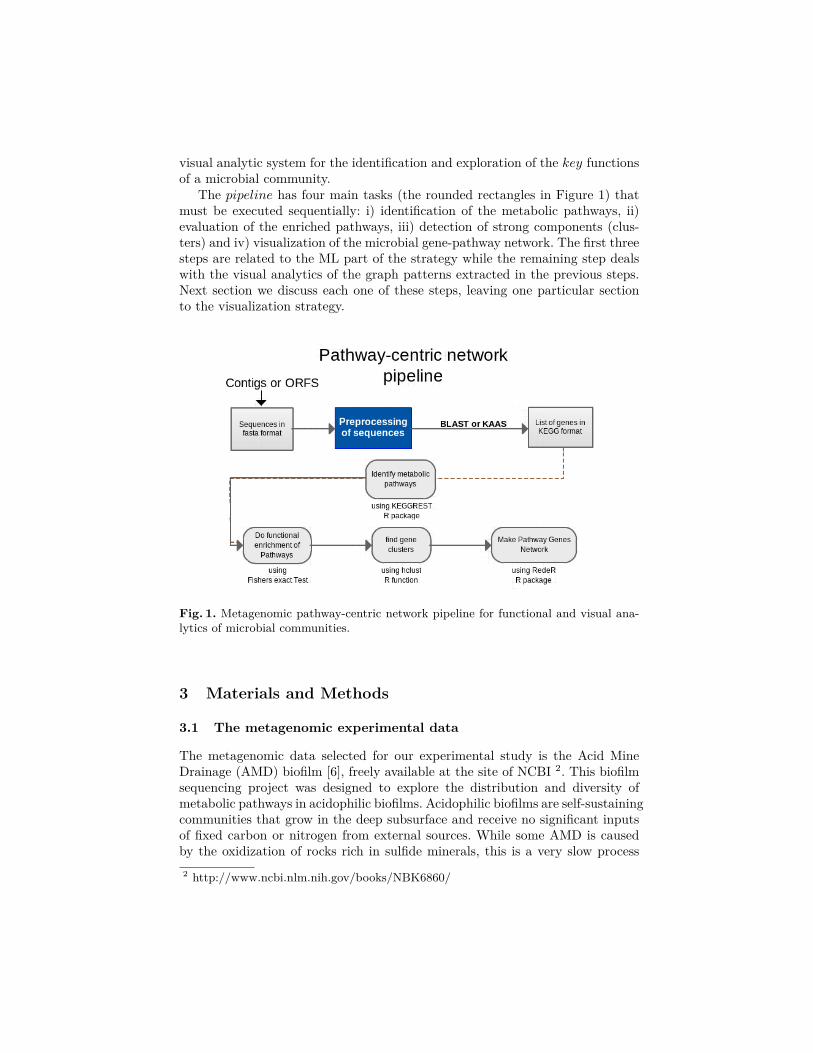
visual analytic system for the identification and exploration of the key functionsof a microbial community.
The pipeline has four main tasks (the rounded rectangles in Figure 1) thatmust be executed sequentially: i) identification of the metabolic pathways, ii)evaluation of the enriched pathways, iii) detection of strong components (clus-ters) and iv) visualization of the microbial gene-pathway network. The first threesteps are related to the ML part of the strategy while the remaining step dealswith the visual analytics of the graph patterns extracted in the previous steps.Next section we discuss each one of these steps, leaving one particular sectionto the visualization strategy.
Fig. 1. Metagenomic pathway-centric network pipeline for functional and visual ana-lytics of microbial communities.
3 Materials and Methods
3.1 The metagenomic experimental data
The metagenomic data selected for our experimental study is the Acid MineDrainage (AMD) biofilm [6], freely available at the site of NCBI 2. This biofilmsequencing project was designed to explore the distribution and diversity ofmetabolic pathways in acidophilic biofilms. Acidophilic biofilms are self-sustainingcommunities that grow in the deep subsurface and receive no significant inputsof fixed carbon or nitrogen from external sources. While some AMD is causedby the oxidization of rocks rich in sulfide minerals, this is a very slow process2 http://www.ncbi.nlm.nih.gov/books/NBK6860/
and most AMD is due directly to microbial activity. The AMD metagenome wasassembled into 2425 contigs distributed along five main species (see Table 1).
More information regarding the AMD study as well as environmental se-quences, metadata and analysis can be obtained at [7].
Species name Number of contigs
Ferroplasma acidarmanus Type I 412Ferroplasma sp. Type II 118Leptospirillum sp. Group II 5-way CG 79Leptospirillum sp. Group III 959Thermoplasmatales archaeon Gpl 857
Table 1. The distribution of assembled contigs per species in the AMD metagenome.
3.2 Preprocessing of the metagenomic sequences
We have used the KAAS tool [8] for the identification of 477 microbial genes.This identification was based on the nucleotide percent homology of the groupsof orthologous genes 3 found in the KEGG database [9].
The search for microbial genes was carried out in several steps. First, themetagenomic data was split into several groups accordingly to (Table 1), followedby a validation stage of each group within the corresponding species in the KEGGdatabase [7]. KAAS tool was employed sequentially in four steps (Table 2) toobtain the final set of 477 genes:
– Step 1, finding groups of orthologous genes: for each specie in theAMD sample we search all its orthologous genes in the KEGG database. Forexample, the AMD species Ferroplasma acidarmanus Type I and Type II arenamed in KEGG as Ferroplasma acidarmanus. So, we use the 530 contigs
of the associated AMD species as a reference into the KASS tool, retrieving290 orthologous genes;
– Step 2, identifying associated species in KEGG: it basically filters outorthologous genes that are not associated to the reference species. Takingthe previous example in Step 1 only 226 genes were kept for the Ferroplasma
acidarmanus species;– Step 3, getting functional annotation in KEGG: it retrieves the genes
associated to pathways in KEGG by using the gene list obtained in Step2. For instance, 149 genes were retrieved for the Ferroplasma acidarmanus
specie;– Step 4, eliminating duplicated genes: since pathways are usually associ-
ated to one or more genes we deduplicate these genes found in Step 3. So,for the Ferroplasma acidarmanus specie we obtained 119 genes.
3 Orthologous genes are genes in di�erent species that originated by vertical descentfrom a single gene of the last common ancestor (Homology section on Wikepedia)
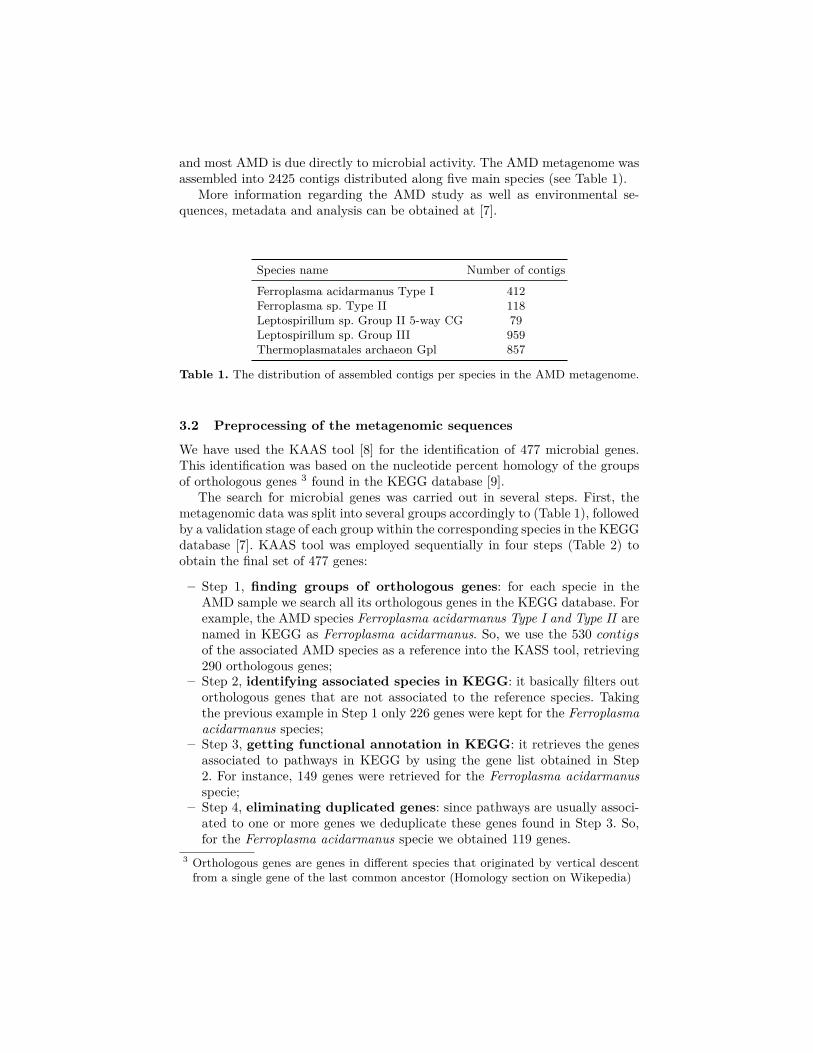
All the steps above were executed for all reference species in the AMD sam-ple, taking into account its associated target species in the KEGG database. In(Figure 2) we present this association as well as the distribution of the genesfound in the related metagenome.
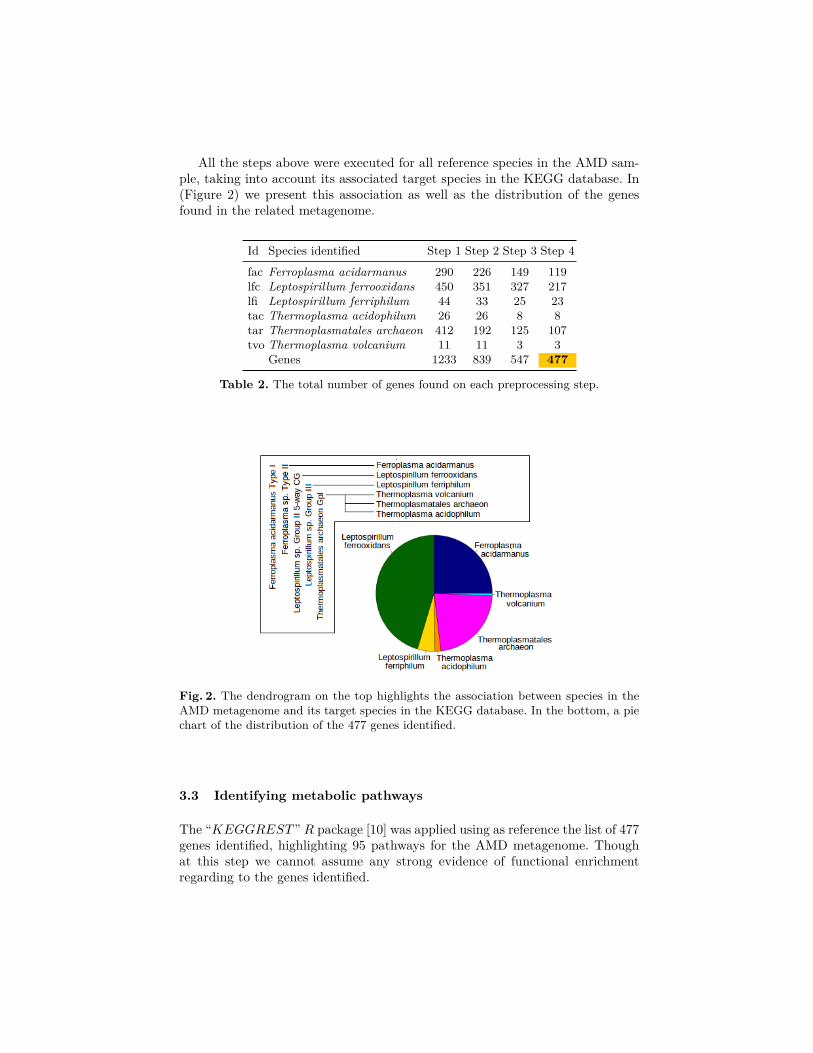
Id Species identified Step 1 Step 2 Step 3 Step 4
fac Ferroplasma acidarmanus 290 226 149 119lfc Leptospirillum ferrooxidans 450 351 327 217lfi Leptospirillum ferriphilum 44 33 25 23tac Thermoplasma acidophilum 26 26 8 8tar Thermoplasmatales archaeon 412 192 125 107tvo Thermoplasma volcanium 11 11 3 3
Genes 1233 839 547 477
Table 2. The total number of genes found on each preprocessing step.
Fig. 2. The dendrogram on the top highlights the association between species in theAMD metagenome and its target species in the KEGG database. In the bottom, a piechart of the distribution of the 477 genes identified.
3.3 Identifying metabolic pathways
The “KEGGREST” R package [10] was applied using as reference the list of 477genes identified, highlighting 95 pathways for the AMD metagenome. Thoughat this step we cannot assume any strong evidence of functional enrichmentregarding to the genes identified.

3.4 Functional enrichment analysis
We devised a functional enrichment strategy based on [11], in which contigencytables are properly set to further apply Fisher’s exact test for statistical sig-nificance of the enriched metabolic pathways. Fisher’s exact test4 is one of aclass of exact tests, so called because the significance of the deviation from anull hypothesis (e.g.: P-value) can be calculated exactly, rather than relying onan approximation that becomes exact in the limit as the sample size grows toinfinity, as with many statistical tests.
The main challenge in evaluating the enrichment of a metabolic pathwaysis the calculation of the probability of finding species covered on each pathwayacross samples, given that, eventually, only a selected group of species will havean associated pathway. This is also due to the fact that species play distinct rolesin the microbial community. As an example, the metabolic pathway Glutathione
metabolism is annotated for five out of six species identified in the samples (Ta-ble 2): Ferroplasma acidarmanus, Leptospirillum ferrooxidans, Leptospirillum
ferriphilum, Thermoplasma acidophilum e Thermoplasma volcanium. So, KEG-GREST will only take into account these five species for the enrichment score(Fisher’s exact test).
Gene associatedwith a pathway
Gene not associatedwith a pathway
Totalgene
Sample a
(6)
b
(364)
a+b(370)
Population c
(15)
d
(2768)
c+d(2783)
Total in KEGG a+c(21)
b+d(3132)
n(3153)
Table 3. The contigency table of the Glutathione metabolism pathway which is requiredfor the calculation of the enrichment score.
In Table 3 we present the contigency table required to calculate the enrich-ment of the Glutathione metabolism pathway with respect to the microbial genesfound in the samples and its corresponding annotations in KEGG. Having thistable, we use the phyper function in the “stats” R package for the enrichmentscore, followed by a test of significance using the “Firsher’s exact test for count
data” R package. Finally, we obtained an enrichment score of 0.0077 (p-value =0.0292) for the the Glutathionemetabolism pathway.
After completing the functional analysis for the 95 metabolic pathways, weobtained a list with only 11 enriched pathways (see Table 4) (p-value Æ 0.05)corresponding to 329 genes. Furthermore, we explore functional modules pre-senting strong gene interactions by the utilization of a bipartite graph struc-ture MGP = (G, P, E). We called this bipartite graph Microbial Gene Pathway
(Figure 3. a). MGP vertices are divided into two disjoint sets (G)enes and4 http://en.wikipedia.org/wiki/Fishers_exact_test

function Enrichment p.valuePurine metabolism 0.033 0.04Geraniol degradation 6.95e-05 0.01Cyanoamino acid metabolism 0.008 0.05Glutathione metabolism 0.007 0.02Porphyrin and chlorophyll metabolism 0.023 0.03Metabolic pathways 0.0002 0.0003Microbial metabolism in diverse environments 0.042 0.05Carbon metabolism 0.039 0.05Biosynthesis of amino acids 0.017 0.02RNA degradation 0.01 0.03Nucleotide excision repair 0.01 0.03
Table 4. The eleven most significant enriched pathways.
Fig. 3. a) The MGP bipartite graph with (G)enes and (P )athways . b) the associatedcommunity matrix with the gene-to-gene interaction augmented with the enrichmentscore.
(P )athways, such that every edge (E) connects a vertex in (G) to one in (P ).The enrichment score is annotated in the vertice (P ).
3.5 Finding gene clusters
Several groups of genes interact in microbial communities, and some of theseinteraction are stronger than others. In addition, these interactions usually cor-relate to the environment in which they are living. We called these strong geneinteractions community patterns, and potentially they may play a key role inthe stability of the microbial genetic network. We have a hypotheses that anyperturbation in such patterns could impact directly in the maintenance of thenetwork. We propose a structural graph clustering strategy which takes into ac-count a bipartite graph (MGP ).
The structural graph clustering uses a community matrix (Figure 3.b) basedon the genes and its enriched pathways represented in MGP . The communitymatrix observes three main aspects regarding gene-to-gene interactions:
– The existence of one or more metabolic pathways shared by the genes;– The amount of metabolic pathways in which genes play;
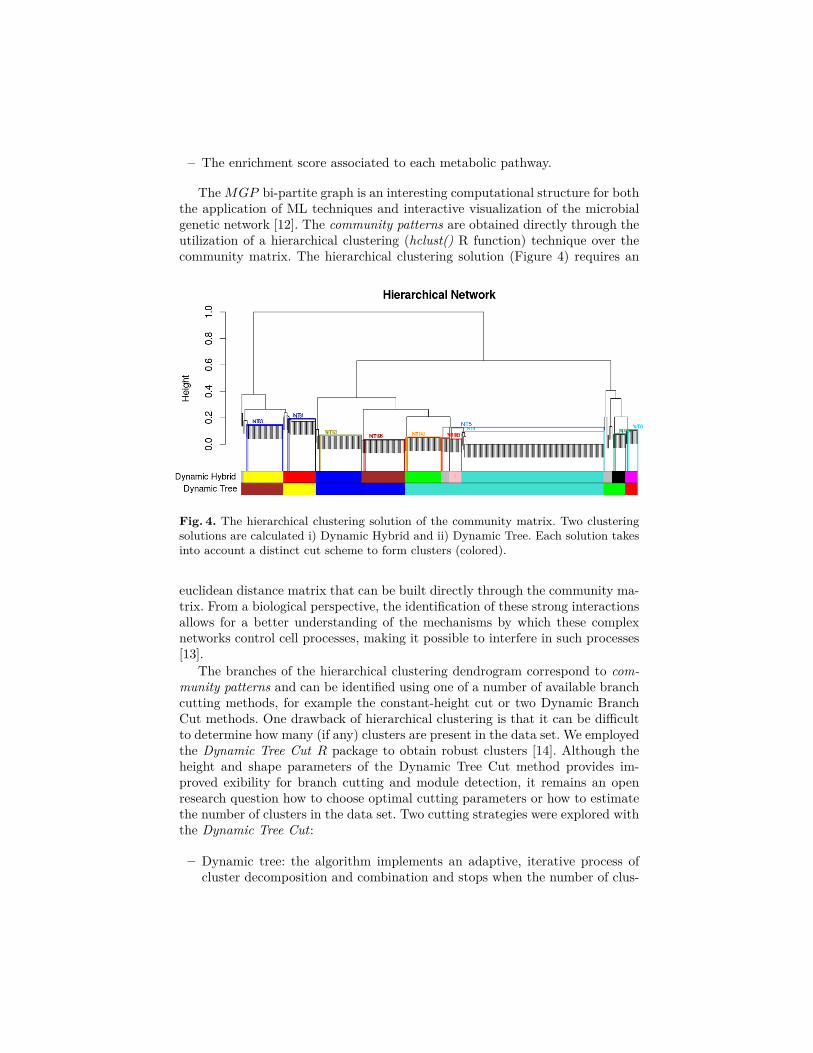
– The enrichment score associated to each metabolic pathway.
The MGP bi-partite graph is an interesting computational structure for boththe application of ML techniques and interactive visualization of the microbialgenetic network [12]. The community patterns are obtained directly through theutilization of a hierarchical clustering (hclust() R function) technique over thecommunity matrix. The hierarchical clustering solution (Figure 4) requires an
Fig. 4. The hierarchical clustering solution of the community matrix. Two clusteringsolutions are calculated i) Dynamic Hybrid and ii) Dynamic Tree. Each solution takesinto account a distinct cut scheme to form clusters (colored).
euclidean distance matrix that can be built directly through the community ma-trix. From a biological perspective, the identification of these strong interactionsallows for a better understanding of the mechanisms by which these complexnetworks control cell processes, making it possible to interfere in such processes[13].
The branches of the hierarchical clustering dendrogram correspond to com-
munity patterns and can be identified using one of a number of available branchcutting methods, for example the constant-height cut or two Dynamic BranchCut methods. One drawback of hierarchical clustering is that it can be di�cultto determine how many (if any) clusters are present in the data set. We employedthe Dynamic Tree Cut R package to obtain robust clusters [14]. Although theheight and shape parameters of the Dynamic Tree Cut method provides im-proved exibility for branch cutting and module detection, it remains an openresearch question how to choose optimal cutting parameters or how to estimatethe number of clusters in the data set. Two cutting strategies were explored withthe Dynamic Tree Cut:
– Dynamic tree: the algorithm implements an adaptive, iterative process ofcluster decomposition and combination and stops when the number of clus-
ters becomes stable. To avoid over-splitting, very small clusters are joinedto their neighboring major clusters;
– Dynamic hybrid: the algorithm can be considered a hybrid of hierarchicalclustering and modified Partitioning Around Medoids (PAM), since it in-volves assigning objects to their closest medoids.
Given that we were looking for compact clusters we decided to use the cuttingresult obtained with the Dynamic hybrid approach. Thus, 9 clusters and 10nested subclusters were enumerated. All clusters have the prefix “NT" followedby a sequential number (Table 5). The nested subclusters were calculated withthe guide of the RedeR R package, and it o�ered an interesting alternative forthe interactive visualization of the microbial genetic networks.
In summary, 308 genes were clustered, corresponding to 96.61% of the en-riched pathways related to AMD biofilm. These clusters enclose on average 30genes, having 6 genes in the most compact cluster and 128 in the largest one.Next, we explore the visual analytic systems over the MGP bipartite graph al-lowing free manipulation of the community patterns as well as the explorationof key hub genes and pathways inside this microbial network.
4 Results and discussion
4.1 Visual analytics system
Given the linked information associated with the concept of microbial commu-nities, it is strongly advised to explore it by graph visualization [15]. The MGP
bipartite graph fits properly the graph structure required for visualization bythe RedeR R package. This network visualization system allows several interac-tive and graph functions such as: zoom, pan, neighborhood highlighting, search,flows, labeling, addition and deletion of graph components.
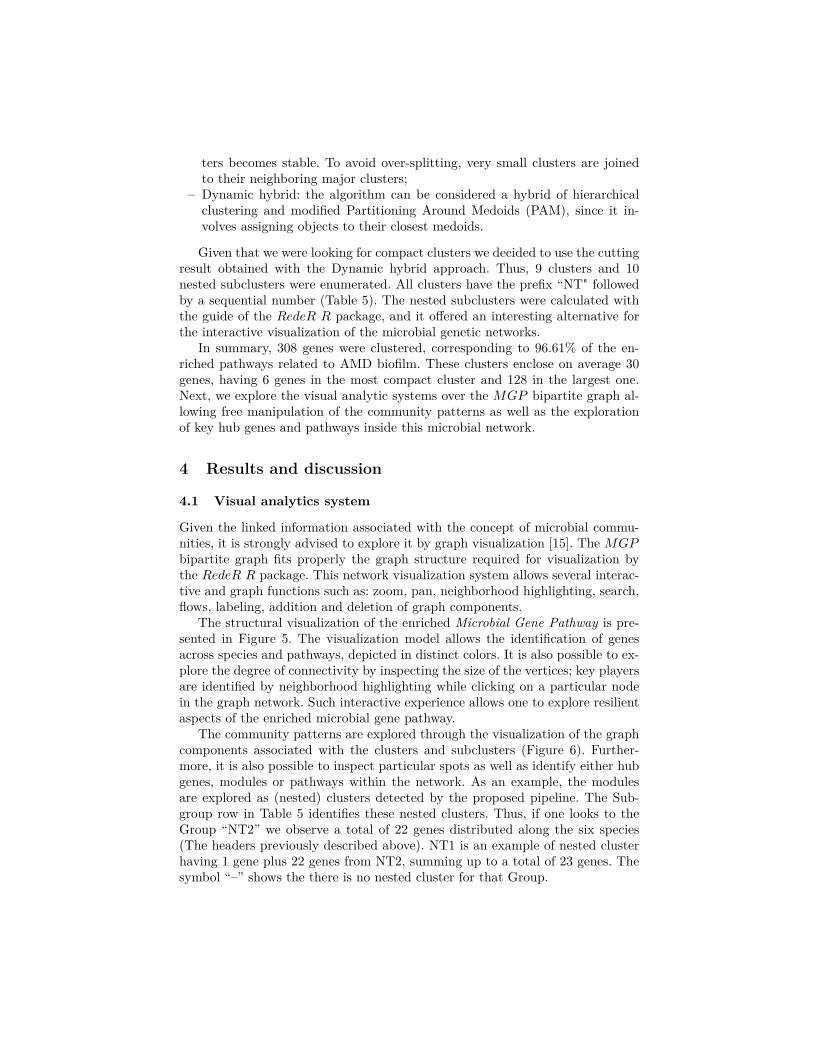
The structural visualization of the enriched Microbial Gene Pathway is pre-sented in Figure 5. The visualization model allows the identification of genesacross species and pathways, depicted in distinct colors. It is also possible to ex-plore the degree of connectivity by inspecting the size of the vertices; key playersare identified by neighborhood highlighting while clicking on a particular nodein the graph network. Such interactive experience allows one to explore resilientaspects of the enriched microbial gene pathway.
The community patterns are explored through the visualization of the graphcomponents associated with the clusters and subclusters (Figure 6). Further-more, it is also possible to inspect particular spots as well as identify either hubgenes, modules or pathways within the network. As an example, the modulesare explored as (nested) clusters detected by the proposed pipeline. The Sub-group row in Table 5 identifies these nested clusters. Thus, if one looks to theGroup “NT2” we observe a total of 22 genes distributed along the six species(The headers previously described above). NT1 is an example of nested clusterhaving 1 gene plus 22 genes from NT2, summing up to a total of 23 genes. Thesymbol “–” shows the there is no nested cluster for that Group.
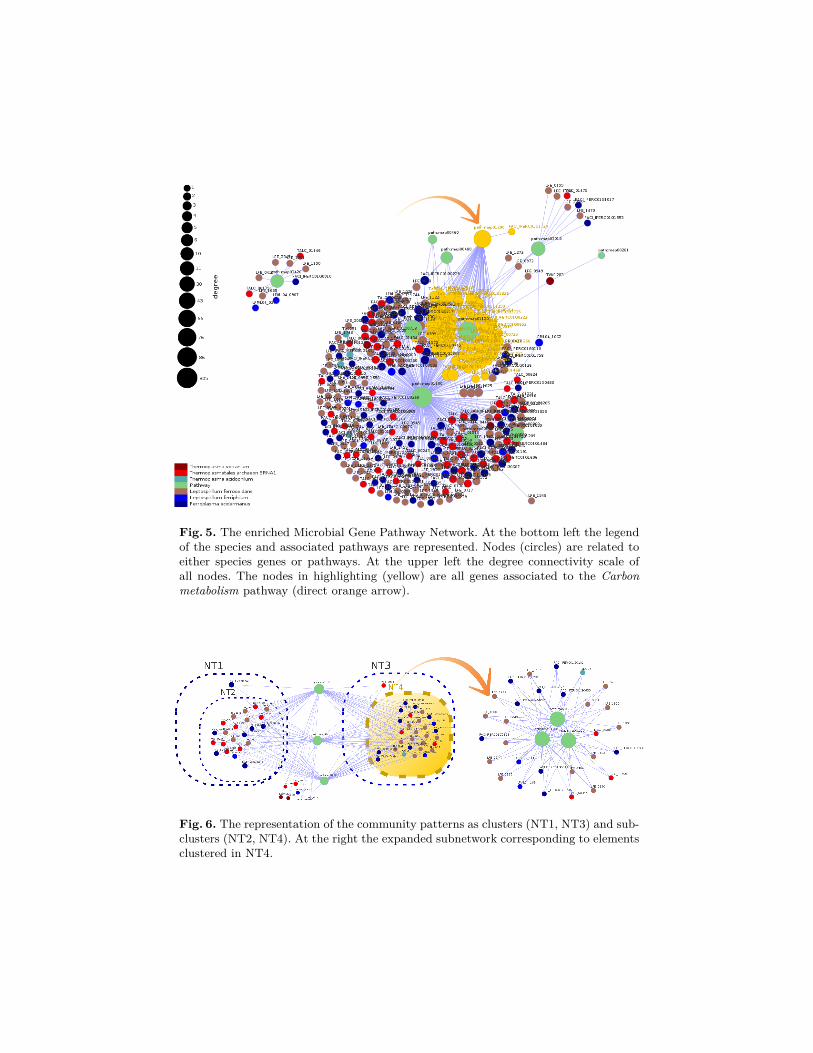
Fig. 5. The enriched Microbial Gene Pathway Network. At the bottom left the legendof the species and associated pathways are represented. Nodes (circles) are related toeither species genes or pathways. At the upper left the degree connectivity scale ofall nodes. The nodes in highlighting (yellow) are all genes associated to the Carbon
metabolism pathway (direct orange arrow).
Fig. 6. The representation of the community patterns as clusters (NT1, NT3) and sub-clusters (NT2, NT4). At the right the expanded subnetwork corresponding to elementsclustered in NT4.

Group name NT1 NT2 NT3 NT4 NT5 NT6 NT7 NT8 NT9 NT10
Subgroup NT2 — NT4 — NT17; NT8 NT7 — — NT10 —fac 1 6 0 9 0 0 5 29 0 3lfc 0 7 0 14 0 1 3 56 1 5lfi 0 1 0 2 0 0 0 5 0 0tac 0 0 0 1 0 0 0 4 0 0tar 0 8 1 3 0 0 0 24 0 0tvo 0 0 0 0 0 0 0 0 0 1Total of genes 23 22 30 29 128 9 8 118 10 9
Group name NT11 NT12 NT13 NT14 NT15 NT16 NT17 NT18 NT19 Total
Subgroup NT12 — NT14 — NT16 — — NT19 — 10fac 0 9 0 7 0 2 1 0 8 80lfc 0 13 0 12 0 4 5 0 15 136lfi 0 2 0 2 0 0 2 0 2 16tac 0 0 0 0 0 0 0 0 0 5tar 1 10 1 7 1 0 5 1 8 70tvo 0 0 0 0 0 0 0 0 0 1Total of genes 35 34 29 28 7 6 10 34 33 —
Table 5. Number of species genes associated to each cluster (Group) and subcluster(Subgroup) calculated by the Dynamic Hybrid cutting strategy.
As an illustration of the visualization, the nested cluster “NT3” having 30genes is depicted in the middle of Figure 6. As it can be observed the nestedcluster “NT3” has 1 gene plus the 29 genes (from “NT4”). The most abundantspecie is the “lfc” (colored in brown). Finally, it is presented the eleven enrichedpathways (colored in green) connecting all the enumerated nested clusters.
5 Conclusions
The enrichment analysis of microbial genetic networks poses an interesting com-putational challenge. It is not practical to enumerate all gene-to-gene interactionof a microbial community, so the pathway-centric analysis sound a promisingstrategy to smooth this combinatorial problem. This strategy has it basis onnon-supervised machine learning over a bipartite graph properly built to evalu-ate the enriched microbial gene pathways.
Interactive visualization of the resulting microbial gene pathway networksallows for the exploration of network metrics enhancing the enrichment anal-ysis. Once all the topological network aspects are understood for a particularmetagenome, we envisage the possibility of using such profiles for metagenomecomparison as well as classification of unknown microbial genetic network.
Author’s contributions
LC and RA performed the analysis and developped the pipeline. RA and CCsupervised the study. LC, RA, CC and LT wrote the manuscript.

Acknowledgements
This work is partially supported by the Brazilian National Research Council(CNPq – Universal calls) under the BIOFLOWS project [475620/2012-7].
References
1. Hugenholtz, P., Tyson, G.W.: Microbiology: Metagenomics. Nature 455(7212)(September 2008) 481–483
2. Fierer, N., Le�, J.W., Adams, B.J., Nielsen, U.N., Bates, S.T., Lauber, C.L.,Owens, S., Gilbert, J.A., Wall, D.H., Caporaso, J.G.: Cross-biome metagenomicanalyses of soil microbial communities and their functional attributes. Proceedingsof the National Academy of Sciences 109(52) (December 2012) 21390–21395
3. Bäckhed, F., Ley, R.E., Sonnenburg, J.L., Peterson, D.A., Gordon, J.I.: Host-Bacterial Mutualism in the Human Intestine. Science 307(5717) (March 2005)1915–1920
4. Johnston, C.W., Wyatt, M.A., Li, X., Ibrahim, A., Shuster, J., Southam, G., Ma-garvey, N.A.: Gold biomineralization by a metallophore from a gold-associatedmicrobe. Nat Chem Biol advance online publication (February 2013)
5. Wooley, J.C., Godzik, A., Friedberg, I.: A Primer on Metagenomics. PLoS ComputBiol 6(2) (February 2010) e1000667+
6. NCBI: Metagenomics: Sequences from the environment [internet]. Sequences fromthe Environment, Tyson (2013)
7. Tyson, G.W., Chapman, J., Hugenholtz, P., Allen, E.E., Ram, R.J., Richardson,P.M., Solovyev, V.V., Rubin, E.M., Rokhsar, D.S., Banfield, J.F.: Communitystructure and metabolism through reconstruction of microbial genomes from theenvironment. Nature 428(6978) (March 2004) 37–43
8. Moriya, Y., Itoh, M., Okuda, S., Yoshizawa, A.C., Kanehisa, M.: KAAS: an au-tomatic genome annotation and pathway reconstruction server. Nucleic acids re-search 35(Web Server issue) (July 2007) W182–W185
9. Kanehisa, M., Goto, S., Sato, Y., Furumichi, M., Tanabe, M.: KEGG for integra-tion and interpretation of large-scale molecular data sets. Nucleic acids research40(Database issue) (January 2012) D109–D114
10. Tenenbaum, D.: KEGGREST: Client-side REST access to KEGG. R packageversion 1.0.1.
11. Sreenivasaiah, P.K.K., Rani, S., Cayetano, J., Arul, N., Kim, D.H.o..H.: IPAVS:Integrated Pathway Resources, Analysis and Visualization System. Nucleic acidsresearch 40(Database issue) (January 2012) D803–D808
12. Goh, K.I., Cusick, M.E., Valle, D., Childs, B., Vidal, M., Barabási, A.L.: Thehuman disease network. Proceedings of the National Academy of Sciences 104(21)(May 2007) 8685–8690
13. A.L. LEHNINGER, N., D.L: Principios da bioquímica. 5 edn. Volume 1. (2005)14. Langfelder, P., Zhang, B., Horvath, S.: Defining clusters from a hierarchical cluster
tree: the dynamic tree cut package for r. Bioinformatics 24(5) (2008) 719–72015. Herman, I., Melancon, G., Marshall, M.S.: Graph visualization and navigation in
information visualization: A survey. Visualization and Computer Graphics, IEEETransactions on 6(1) (January 2000) 24–43