A Physically-Based Abrasive Wear Model for … Physically-Based Abrasive Wear Model for Composite...
29
1 A Physically-Based Abrasive Wear Model for Composite Materials Gun Y. Lee 1,3 , C. K. H. Dharan 1 , and R. O. Ritchie 2,3 1 Department of Mechanical Engineering, University of California, Berkeley, CA 94720 -1750 2 Department of Materials Science & Engineering, University of California, Berkeley, CA 94720-1760 3 Materials Sciences Division, Lawrence Berkeley National Laboratory, Berkeley, CA 94720 SUMMARY: A simple physically-based model for the abrasive wear of composite materials is presented based on the mechanics and mechanisms associated with sliding wear in soft (ductile) matrix composites containing hard (brittle) reinforcement particles. The model is based on the assumption that any portion of the reinforcement that is removed as wear debris cannot contribute to the wear resistance of the matrix material. The size of this non-contributing portion of reinforcement is estimated by modeling three primary wear mechanisms, specifically, plowing, cracking at the matrix/reinforcement interface or in the reinforcement, and particle removal. Critical variables describing the role of the reinforcement, such as relative size, fracture toughness and the nature of the matrix/reinforcement interface, are characterized by a single contribution coefficient, C. Predictions are compared with the results of experimental two-body (pin-on-drum) abrasive wear tests performed on a model aluminum particulate-reinforced epoxy-matrix composite material. KEYWORDS : Composites, abrasive wear, fracture toughness, reinforcement size INTRODUCTION As advanced engineering materials, composites are used in many applications where high wear resistance is required; these include electrical contact brushes, cylinder liners, artificial joints, and helicopter blades. Indeed, compared to monolithic materials, wear resistance can generally be enhanced by introducing a secondary phase(s) into the matrix material [1-6]. In this fashion, the wear properties can be varied substantially through changes in the microstructure, the morphology, volume fraction and mechanical properties of the reinforcing phase, and the nature of the interface between matrix and reinforcement. In order to obtain optimal wear properties without compromising the beneficial properties of the matrix material, an accurate prediction of the wear of composites is essential. Unfortunately, for abrasive wear, existing models for composites are highly simplified and do not readily predict the role of the composite microstructure. In general, they are based on two simplified equations, the first of which, the inverse rule of mixtures, was introduced for two-phase composites by Khruschov [7]:
Transcript of A Physically-Based Abrasive Wear Model for … Physically-Based Abrasive Wear Model for Composite...
1
A Physically-Based Abrasive Wear Modelfor Composite Materials
Gun Y. Lee1,3, C. K. H. Dharan1, and R. O. Ritchie2,3
1Department of Mechanical Engineering, University of California, Berkeley, CA 94720 -17502Department of Materials Science & Engineering, University of California, Berkeley, CA 94720-1760
3Materials Sciences Division, Lawrence Berkeley National Laboratory, Berkeley, CA 94720
SUMMARY: A simple physically-based model for the abrasive wear of compositematerials is presented based on the mechanics and mechanisms associated with slidingwear in soft (ductile) matrix composites containing hard (brittle) reinforcement particles.The model is based on the assumption that any portion of the reinforcement that isremoved as wear debris cannot contribute to the wear resistance of the matrix material.The size of this non-contributing portion of reinforcement is estimated by modeling threeprimary wear mechanisms, specifically, plowing, cracking at the matrix/reinforcementinterface or in the reinforcement, and particle removal. Critical variables describing therole of the reinforcement, such as relative size, fracture toughness and the nature of thematrix/reinforcement interface, are characterized by a single contribution coefficient, C.Predictions are compared with the results of experimental two-body (pin-on-drum)abrasive wear tests performed on a model aluminum particulate-reinforced epoxy-matrixcomposite material.
KEYWORDS : Composites, abrasive wear, fracture toughness, reinforcement size
INTRODUCTION
As advanced engineering materials, composites are used in many applications wherehigh wear resistance is required; these include electrical contact brushes, cylinder liners,artificial joints, and helicopter blades. Indeed, compared to monolithic materials, wearresistance can generally be enhanced by introducing a secondary phase(s) into the matrixmaterial [1-6]. In this fashion, the wear properties can be varied substantially throughchanges in the microstructure, the morphology, volume fraction and mechanicalproperties of the reinforcing phase, and the nature of the interface between matrix andreinforcement.
In order to obtain optimal wear properties without compromising the beneficialproperties of the matrix material, an accurate prediction of the wear of composites isessential. Unfortunately, for abrasive wear, existing models for composites are highlysimplified and do not readily predict the role of the composite microstructure. In general,they are based on two simplified equations, the first of which, the inverse rule ofmixtures, was introduced for two-phase composites by Khruschov [7]:
2
1 1
1
2
2WVW
VWC
M
M
M
M= + , (1)
where W and V are, respectively, the wear rates and volume fractions of the matrix(designated by subscript M1) and reinforcement (designated by M2). Note that the wearresistance, R, in Khruschov’s original formulation is given by the reciprocal of the wearrate, R = 1/W.
Eq. (1) is based on the assumption that the components of the composite wear at anequal rate. Consequently, Khruschov’s equation predicts that the abrasive wearresistance is linearly additive and that the wear resistance of the composite is simply thesum of the products of wear resistance and volume fraction for each component. Eq. (1)for a two-phase composite is plotted in Fig. 1. Since the wear rate of the harderreinforcement is typically much smaller than that of the matrix, this relationship predictsthat the abrasive wear behavior of a composite will be governed primarily by thereinforcement.
The second wear equation for multiphase materials, introduced by Zum-Gahr toexplain experimental data, is the linear rule of mixtures; here, the wear behavior of acomposite is not dominated by a single phase [6]. Instead, the contribution from eachcomponent is linearly proportional to its volume fraction in the composite:
W V W V WC M M M M= ⋅ + ⋅1 1 2 2 , (2)
and is also plotted in Fig. 1. In this model, the abrasive wear rate of the compositedecreases linearly with increasing volume fraction of reinforcement. This expression wasalso derived by Axen and Jacobson using the equal pressure assumption that allcomponents of a composite carry the same specific load [8]. A cyclic wear model fororiented fiber composites that predicted narrower bounds for abrasive wear behavior wasproposed by Yen and Dharan [9]. In their paper, fiber instability due to preferential wearof the softer matrix resulted in cyclic generation of wear debris during the wear process.However, interface toughness and other physically-based factors were not considered intheir model.
While Eqs. (1) and (2) are presumed to provide upper and lower limits for abrasivewear rates in a composite, this is not confirmed by some experimental results due to thesimplified, non-physically based nature of the two models. Indeed, this can beappreciated in Fig. 1, which shows experimental results for composites that are reinforcedwith hard particles [1,10-14]. Both models rely on the notion that all components in thecomposite wear in the same way as they would in a bulk material; consequently, thecontribution of each component can depend only on its volume fraction and wear rate.The effects of other important factors, such as interfacial properties between thedistinctive phases, relative sizes, and the fracture toughness of these phases, are notconsidered, even though it is clear that they have a significant influence on abrasion incomposites [1,5,15-21]. Specifically, the wear rates of composites can exceed the upperbound given by Eq. (2) in that they are higher than that of the pure matrix material [1,10-
3
14]; this implies that the presence of reinforcement enhances the wear rate instead ofreducing it – the negative reinforcement effect. Experimental data showing the negativereinforcement fall in the area denoted by region A in Fig. 1. The inability to predict sucheffects represents a major limitation of existing abrasive wear models for compositematerials.
In the present study, a new physically-based abrasive wear model for compositematerials with hard reinforcements is developed based on three primary wearmechanisms: plowing, cracking at the interface or in the reinforcement, and particleremoval. The effects of critical factors, such as, interfacial properties, and geometricaland mechanical properties of the reinforcement, are specifically considered. The modelintroduces a factor related to the fracture toughness of the matrix/reinforcement interfaceand the reinforcement, and the relative size of the reinforcement relative to the abrasivegrains. It predicts the negative reinforcement effect and is useful for interpreting weardata in terms of the role of the interface and reinforcement size. The model may alsoassist in the design of abrasive wear-resistant composite materials. The predictions of theproposed model are verified by experimental abrasive wear studies conducted on a modelaluminum particulate-reinforced epoxy matrix composite.
DUCTILE- AND BRITTLE-MATRIX COMPOSITES
The sliding of abrasives on a solid surface results in volume removal. Themechanism of wear depends on the mechanical properties of the solid [22,23]. In aductile solid, the primary wear mechanism is related to plastic deformation;correspondingly, the hardness of the material is a key parameter in governing the amountof material removal. However, the dominant mechanism in a brittle solid depends onfracture at, or near, the surface such that the governing property is the toughness of thematerial.
To improve wear resistance, additional phase(s) can be introduced to either a ductileor a brittle matrix material. However, the required mechanical properties of thereinforcement and the role of the reinforcement will be different in ductile vs. brittlematrices. For a ductile matrix, a hard secondary phase is needed to reduce wear, suchthat the presence of the hard reinforcement increases the effective hardness of the matrix,thereby reducing the penetration of the abrasive medium. Consequently, increasing theeffective hardness acts to reduce the amount of material removed. Here, we term such amultiphase system composed of a ductile matrix and a hard reinforcement as a hard-reinforcement or hardened composite. On the other hand, a tough reinforcement phase isneeded for a brittle matrix to increase wear resistance. The presence of a toughsecondary phase reduces the tendency for fracture at, or near, the surface, and thereforetends to decrease the wear rate. In certain ceramic-matrix composites, i.e., brittle matrixmaterials, the addition of a relatively ductile second phase can result in synergisticallyfavorable wear behavior in which the composite wear rate can be less than the wear ratesof the individual constituents. This behavior is denoted by region B in Fig. 1 and hasbeen observed in ceramic composites [2,3]. A multiphase system composed of a brittle
4
matrix and a tough reinforcement may be termed a ductile-reinforcement or toughenedcomposite.
The present study is focused on hard-reinforcement particulate composites, whichhave been the object of most modeling studies of the wear of composites in the past (e.g.,[6,7]). We will consider reinforcement volume fractions in the range 0 to 0.5, since athigher volume fractions one can expect significant particle-particle interactions.Moreover, from a practical standpoint, it is difficult to manufacture particulatecomposites at volume fractions greater than 0.5 due to void formation resulting fromimperfect wetting and agglomeration.
ABRASIVE WEAR MODEL
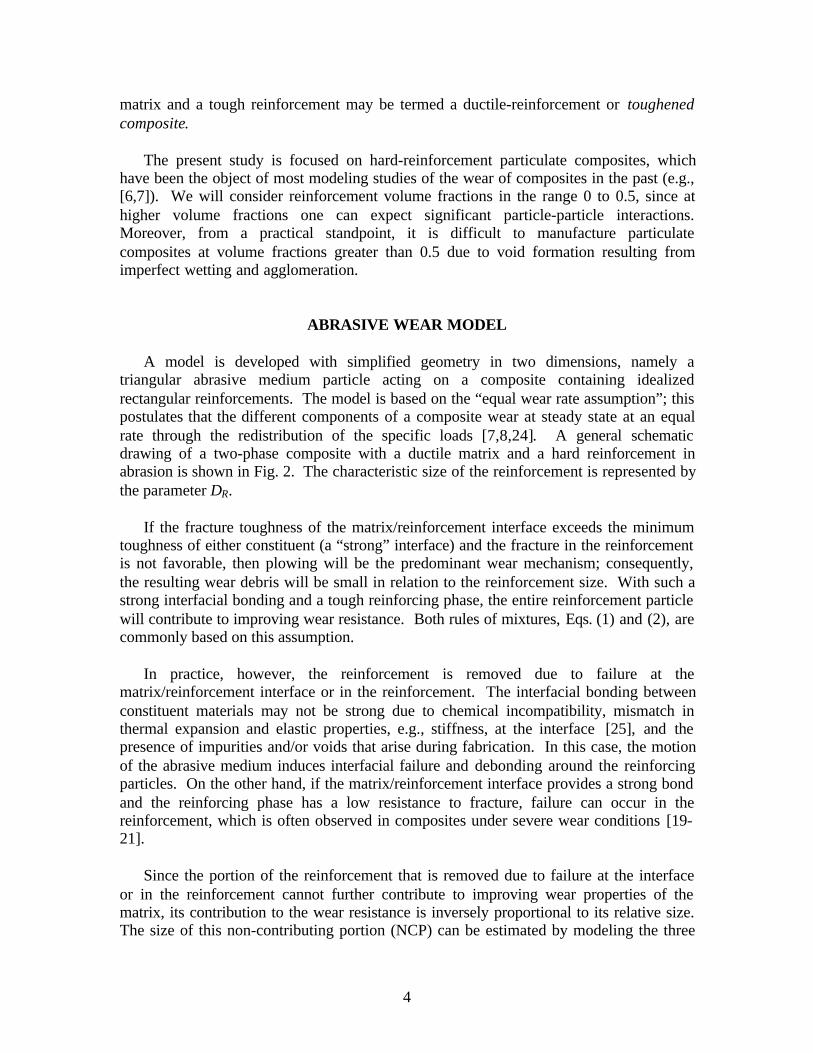
A model is developed with simplified geometry in two dimensions, namely atriangular abrasive medium particle acting on a composite containing idealizedrectangular reinforcements. The model is based on the “equal wear rate assumption”; thispostulates that the different components of a composite wear at steady state at an equalrate through the redistribution of the specific loads [7,8,24]. A general schematicdrawing of a two-phase composite with a ductile matrix and a hard reinforcement inabrasion is shown in Fig. 2. The characteristic size of the reinforcement is represented bythe parameter DR.
If the fracture toughness of the matrix/reinforcement interface exceeds the minimumtoughness of either constituent (a “strong” interface) and the fracture in the reinforcementis not favorable, then plowing will be the predominant wear mechanism; consequently,the resulting wear debris will be small in relation to the reinforcement size. With such astrong interfacial bonding and a tough reinforcing phase, the entire reinforcement particlewill contribute to improving wear resistance. Both rules of mixtures, Eqs. (1) and (2), arecommonly based on this assumption.
In practice, however, the reinforcement is removed due to failure at thematrix/reinforcement interface or in the reinforcement. The interfacial bonding betweenconstituent materials may not be strong due to chemical incompatibility, mismatch inthermal expansion and elastic properties, e.g., stiffness, at the interface [25], and thepresence of impurities and/or voids that arise during fabrication. In this case, the motionof the abrasive medium induces interfacial failure and debonding around the reinforcingparticles. On the other hand, if the matrix/reinforcement interface provides a strong bondand the reinforcing phase has a low resistance to fracture, failure can occur in thereinforcement, which is often observed in composites under severe wear conditions [19-21].
Since the portion of the reinforcement that is removed due to failure at the interfaceor in the reinforcement cannot further contribute to improving wear properties of thematrix, its contribution to the wear resistance is inversely proportional to its relative size.The size of this non-contributing portion (NCP) can be estimated by modeling the three
5
primary abrasive wear mechanisms, namely plowing, cracking at the interface or in thereinforcement, and particle removal. Based on this information, a new relationship forthe abrasive wear rate of a composite is developed.
A. Plowing mechanism
The depth of penetration, x, of the abrasive medium depends on its geometry, theapplied normal load, and the mechanical properties of a composite (relative to theabrasive medium). While the abrasive medium is moving, contact with the substrateoccurs only over its half-front surface. Under an indentation load L, the depth ofpenetration of the abrasive particle can be written as:
( )L w b HC= ⋅ ⋅12
2 and xw
= tanθ ,
xL
b HC=
⋅tanθ , (3)
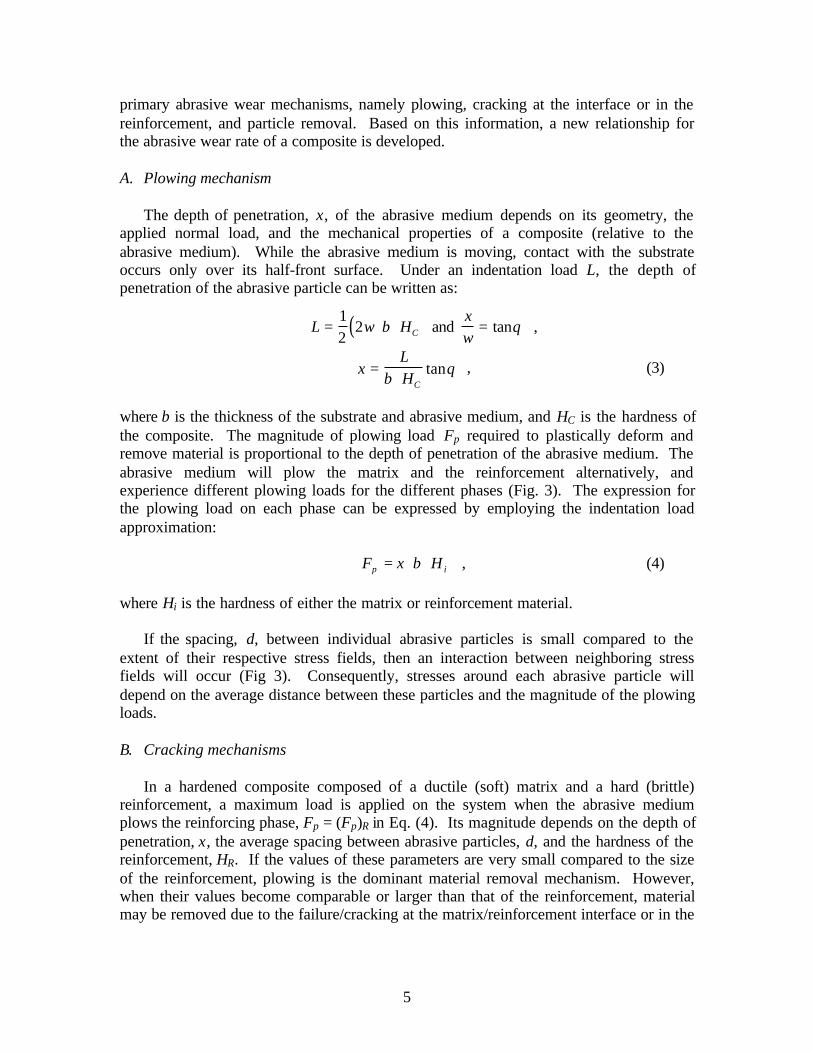
where b is the thickness of the substrate and abrasive medium, and HC is the hardness ofthe composite. The magnitude of plowing load Fp required to plastically deform andremove material is proportional to the depth of penetration of the abrasive medium. Theabrasive medium will plow the matrix and the reinforcement alternatively, andexperience different plowing loads for the different phases (Fig. 3). The expression forthe plowing load on each phase can be expressed by employing the indentation loadapproximation:
ip HbxF ⋅⋅= , (4)
where Hi is the hardness of either the matrix or reinforcement material.
If the spacing, d, between individual abrasive particles is small compared to theextent of their respective stress fields, then an interaction between neighboring stressfields will occur (Fig 3). Consequently, stresses around each abrasive particle willdepend on the average distance between these particles and the magnitude of the plowingloads.
B. Cracking mechanisms
In a hardened composite composed of a ductile (soft) matrix and a hard (brittle)reinforcement, a maximum load is applied on the system when the abrasive mediumplows the reinforcing phase, Fp = (Fp)R in Eq. (4). Its magnitude depends on the depth ofpenetration, x, the average spacing between abrasive particles, d, and the hardness of thereinforcement, HR. If the values of these parameters are very small compared to the sizeof the reinforcement, plowing is the dominant material removal mechanism. However,when their values become comparable or larger than that of the reinforcement, materialmay be removed due to the failure/cracking at the matrix/reinforcement interface or in the
6
reinforcing phase (Fig. 4). The trajectory of the crack depends on the relative toughnessof the interface to that of the reinforcing material.
a. Cracking at the matrix/reinforcement interface
When the ratio of the fracture toughness of the interface, Gif, and the reinforcingmaterial, GR, is less than approximately 0.25 for this geometry (this ratio does vary withthe orientation of the crack [26]), plowing by the abrasive medium can lead to thepropagation of a crack in the “weak” interface. (Fig. 4(a)), i.e., when [26]:
41
<R
if
G
G. (5)
b. Cracking in the reinforcement
On the other hand, i f the in terfacia l bonding between the matr ix and the reinforcementis good (a “strong” interface), the crack will propagate into the reinforcing phase (Fig.4(b)). In this case, the ratio of the interfacial fracture toughness to that of the reinforcingphase must be higher than 0.25 (for a crack normal to the interface):
41
≥R
if
G
G . (6)
The lengths of the interfacial crack, aint, and the crack in the reinforcement, aR,depend on the fracture toughness and parameters such as the average distance, d, betweenabrasive the medium and the plowing loads, viz:
crack size = ( ) ( ){ }1,,, +nPRPi FdFGf , (7)
where Gi represents either the interfacial fracture toughness, Gif, for the case of aninterfacial crack of length aint, or the fracture toughness of the reinforcing material, GR,for a crack of length aR in the reinforcement.
C. Particle removal
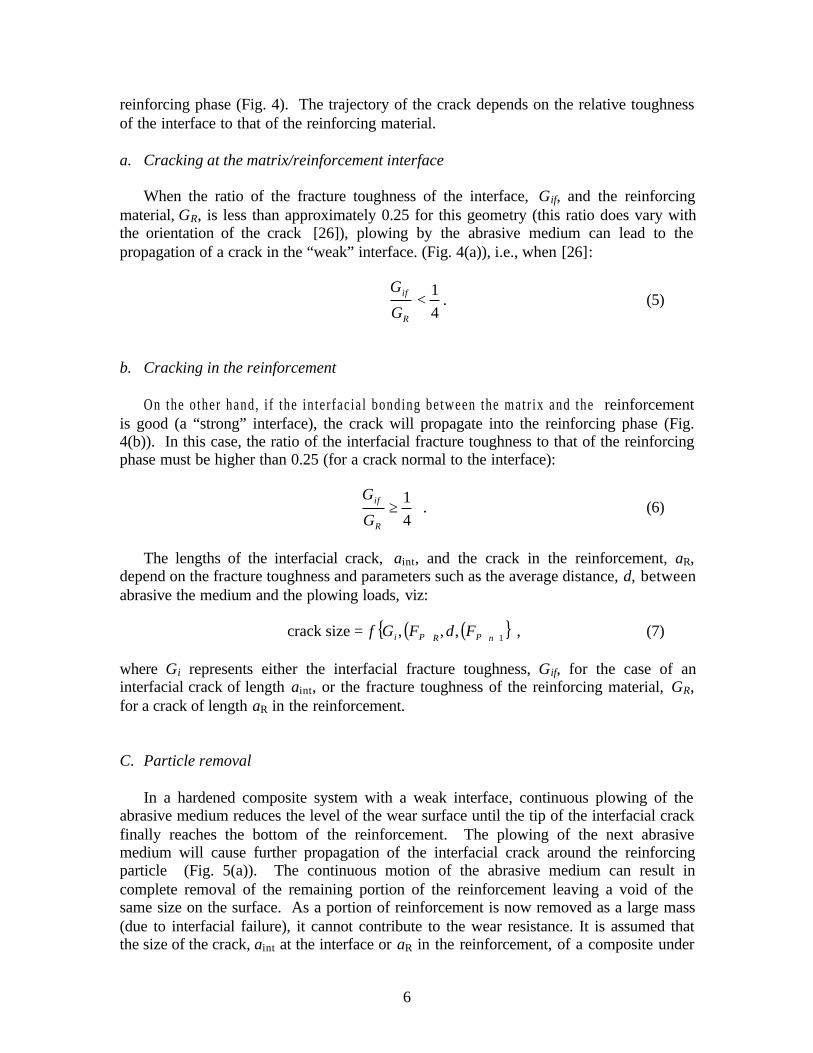
In a hardened composite system with a weak interface, continuous plowing of theabrasive medium reduces the level of the wear surface until the tip of the interfacial crackfinally reaches the bottom of the reinforcement. The plowing of the next abrasivemedium will cause further propagation of the interfacial crack around the reinforcingparticle (Fig. 5(a)). The continuous motion of the abrasive medium can result incomplete removal of the remaining portion of the reinforcement leaving a void of thesame size on the surface. As a portion of reinforcement is now removed as a large mass(due to interfacial failure), it cannot contribute to the wear resistance. It is assumed thatthe size of the crack, aint at the interface or aR in the reinforcement, of a composite under
7
given wear conditions is constant. The fraction of this “non-contributing portion (NCP)”is:
NCP = RDax )( int+
(crack at interface) , (8)
where x is the depth of penetration of the abrasive medium, aint is the size of theinterfacial crack, and DR is the size of the reinforcement (Fig. 5(b)).
However, with a relatively strong interface, plowing of the abrasive medium will leadto crack growth in the reinforcement (Fig. 4(b)). It is assumed that the crack, aR,propagates parallel to the wear surface. While the abrasive medium is moving throughthe reinforcing phase, the crack, aR, stays in front of it. When the tip of the crack reachesthe reinforcement/matrix interface, further motion of the abrasive medium will causeremoval of a portion of the reinforcement as a wear particle (Fig. 6(a)). As the size ofthis non-contributing portion (NCP) with respect to the path of abrasive medium is theproduct of the depth of penetration, x, and the size of crack, aR, as shown in Fig. 6(b), thefraction of the non-contribution portion of the reinforcement can be estimated by:
NCP = 2R
RDNax ⋅⋅
= RD
aR (crack in reinforcement ) , (9)
where aR is the size of the crack in the reinforcement, x is the depth of penetration of theabrasive medium, and DR is the size of the reinforcement.
In terms of these three primary wear mechanisms, the wear behavior of a two-phasecomposite is akin to that of a three-phase composite composed of a matrix, reinforcementand pores. The volume fraction of the porous section is equal to the volume fraction ofthe non-contribution portion of the reinforcement, which is the product of volumefraction of reinforcement VR and the fraction of the non-contributing portion (Eq. (10)):
( )
+⋅=
RRpore D
axVV int (crack at interface) ,
⋅=
RRpore D
aVV R (crack in reinforcement) . VR ≤ 0.5 (10)
Thus, the net volume fraction of the reinforcement, which contributes to the wearresistance, can be written as:
poreRnet VVV −= . VR ≤ 0.5 (11)
The wear rate of the three-phase composite can again be obtained based on the “equalwear rate assumption”:
8
( )pore
R
R
R
m
m
C WV
CWV
CWV
W⋅−+⋅+= 1
1, VR ≤ 0.5 (12)
where Wc,Wm, WR and Wpore are the wear rates of composite, matrix, reinforcement andpores, Vm and VR are the volume fractions of the matrix and the reinforcement, and C is anew parameter, which we term the contribution coefficient of the reinforcement. Thisparameter describes the relative contribution of each of the primary wear mechanismsand is defined as:
( )
+−=
RDax
C int1 (crack at interface) ,
−=
RDa
C R1 (crack in reinforcement) . (13)
Since the third term on the right side of Eq. (12) will vanish because the wear resistanceof pores is equal to zero, 1/Wpore = 0, we can obtain a final expression for the abrasivewear rate of a composite from this physically-based mechanistic model as:
R
R
m
m
C WV
CWV
W⋅+=
1. VR ≤ 0.5 (14)
The contribution coefficient parameter, C, represents the effects of critical factors,including the fracture toughness and the relative size of the reinforcement; its magnitudevaries from zero to unity.
EXPERIMENTS
A. Materials
To provide some degree of experimental verification of the proposed model, abrasivewear tests were conducted with a model composite system involving an epoxy matrixwith spherical aluminum alloy particulate reinforcement. In order to minimize the effectof the mismatch in coefficient of thermal expansion, a room temperature curing epoxywas selected as the matrix material; this was DER 331 epoxy resin and DEH 24 hardenerfrom Dow Chemical, Midland, MI USA. The epoxy was reinforced with 6061aluminummetal particles provided by Valimet Inc., Stockton, CA USA; the particles werenominally spherical with an average size of ~100 µm (Fig. 7).
In order to vary the contribution coefficient C in Eq. (14), tests were performed oncomposites with different matrix/reinforcement interfacial toughnesses and with differentrelative sizes of reinforcement. A “strong” interface was achieved by reinforcing theepoxy with uncontaminated particles, whereas a “weak” interface was achieved by priorcoating of the particles with a thin layer of silicone. The relative sizes of the
9
reinforcement were varied by conducting tests on different abrasive sizes (35 ~ 326 µm),as shown in Fig. 8.
Tests were performed for specimens containing 0, 20, 40 and 100 percent by volumeof reinforcement. The composites were fabricated by vacuum stir-casting. This processconsists of mixing metal particles in a catalyzed liquid epoxy followed by casting in anopen mold (9.5 mm diameter and 20 mm length) in a vacuum. The mixture was cured for7 days at room temperature.
B. Abrasive wear test
Two-body abrasive wear tests were conducted on a pin-on-drum abrasive wear tester,designed for standard wear tests described in ASTM Standard D5963-97a. In thismethod, the test specimen translates over the surface of an abrasive paper, which ismounted on a revolving drum, with the resulting wear of the material expressed asvolume loss [27]. The test setup is schematically illustrated in Fig. 9.
An alumina (Al2O3) abrasive which is substantially harder than either the matrix orthe reinforcement was used. The pin specimen, 0.95 mm in diameter and 20 mm long,was placed on the top of the drum, which was then rotated at a fixed angular speed of 25RPM; this gives a tangential velocity at the contact surface of 0.2 m/s. While the drumwas rotating, the specimen is translated at the speed of 4.2 mm/rev along the axis ofrotation. Thus, the specimen is continuously in contact with new abrasive surface. Astatic normal load, L, was applied directly on the specimen to press it against the center ofthe drum (Fig. 9); its magnitude was varied from 1 to 5 N, corresponding to a normalstress ranging from ~14 to 69 kPa. Throughout the test, the sliding distance was fixed at39.2 m (80 revolutions). Table 1 shows roughness and typical grove depths in the neatresin for the abrasive sizes used in the experiments. Peak-to-valley distances ranged from5 to 90 µm and were measured using a Talysurf 10 profilometer. All tests were carriedout in dry ambient air laboratory conditions.
RESULTS AND DISCUSSION
A. Model Predictionsl
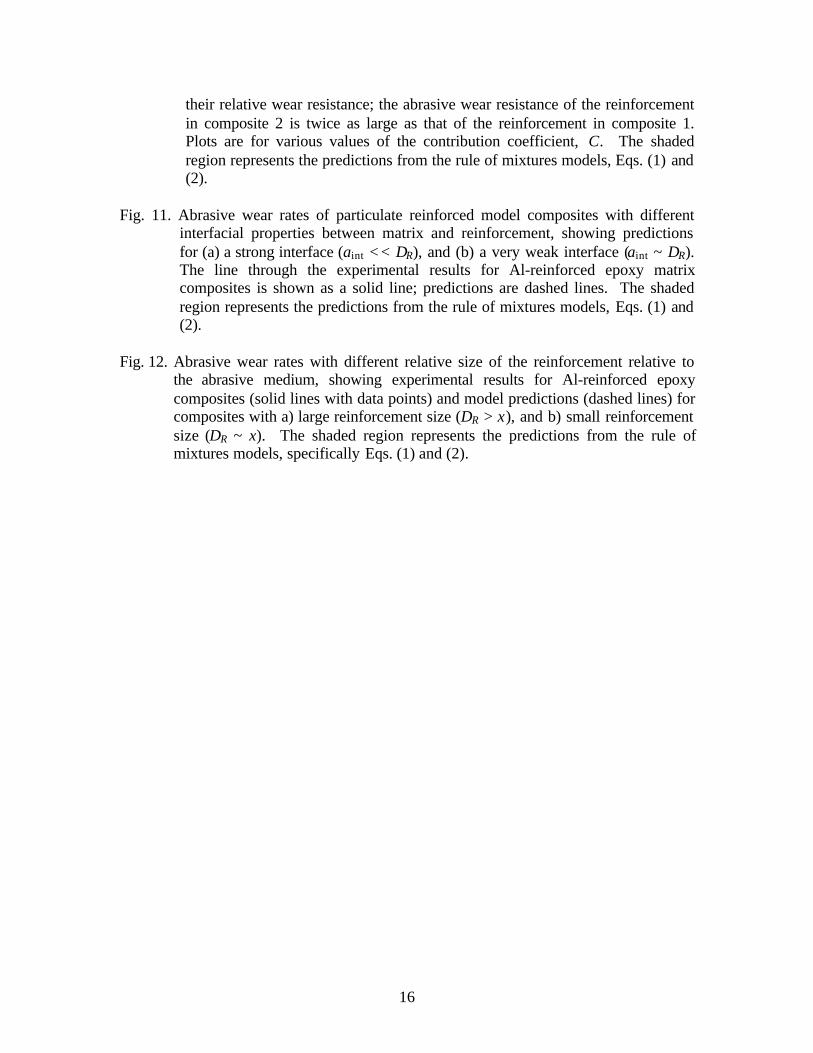
Predicted wear rates from Eq. (14) for the two ideal composites with differentcontribution coefficients and volume fractions are shown in Fig. 10. The two composites,termed composite 1 and 2, differ in their relative wear resistance; the abrasive wearresistance of the reinforcement in composite 2 is twice as large as that of thereinforcement in composite 1.
From Fig. 10, predictions of the wear rates of the composites at a fixed volumefraction can be obtained. These wear rates depend strongly on the contributioncoefficient, C, of the reinforcement. When C = 1, i.e., in the absence of particle removalsuch that the reinforcement wears in the same way as if it were in bulk, the size of the
10
non-contributing portion of the reinforcement, (x + aint) in Fig. 5 (b) and aR in Fig. 6(b),becomes small compared to the total size of the reinforcement DR. Under theseconditions, the model predicts wear rates that are equal to the lower limit of the inverselaw of mixtures model (Eq. (1)). As the contribution coefficient is reduced, wear ratesare predicted to increase above this lower limit. Indeed, as C → 0, predicted wear ratesof the composites become higher than that of the matrix, demonstrating the negativereinforcement effect.
The value of C depends strongly on the penetration of the abrasive medium, x, andthe interfacial crack size, aint. Thus for the case of interfacial cracking, the toughness ofthe matrix/reinforcement interface is a crucial factor governing the magnitude of aint. Ifthe interfacial toughness is reduced, the size of the interfacial crack increases and thus thevalue of C is decreased. Consequently, the model predicts that the wear rate of thecomposite will be increased by any reduction in the interfacial toughness. Acorresponding increase in the depth of penetration will effectively reduce the relative sizeof the reinforcement. This lowers the value of C and consequently increases the wearrate of the composite. In contrast, raising the interfacial toughness and decreasing thedepth of penetration will enhance the contribution of the reinforcement and thus reducethe wear rate of the composite. Similar features will be observed in the case ofreinforcement fracture as well because the contribution coefficient C is also a function ofthe factors governing the crack size, aR. The fracture toughness of the reinforcement andthe depth of penetration are primary factors. Thus, raising the fracture toughness ofreinforcing material and reducing the depth of penetration, x, will increase thecontribution coefficient, and vice versa.
Another notable observation from these predictions is that even though composite 2has a more wear-resistant reinforcement, the overall wear resistance of the compositedepends also on factors such as the toughness and relative reinforcement size, i.e., on thevalue of C. Thus, the present model highlights the fact that choosing a reinforcementsolely on its bulk wear resistance without consideration of these other factors will notguarantee the optimal wear characteristics of the composite itself. For example, at areinforcement volume fraction, VR = 0.5, the critical value of C below which the wearrate exceeds the upper bound is about C = 0.28 in the composite with the more wear-resistant reinforcement (Composite 2, Fig. 10 (b)), while C can be a large as 0.5 for thecomposite containing the less wear-resistant reinforcement for the wear rate to exceed theupper bound. That is, a composite with a more wear-resistant reinforcement can toleratea lower level of toughness than a composite containing a less wear-resistantreinforcement. This result is consistent with experimental observations made by otherinvestigators [1,8-12], and indicates that the proposed coefficient C has a strong physicalbasis for the class of hard reinforcement composites considered here.
B. Experimental results
The results of the pin-on-drum two-body abrasive wear tests are shown in Figs. 11and 12. The interfacial toughness and the relative size of the reinforcement were changedto effect a variation in the contribution coefficient C. Test results for the composites with
11
different interfacial conditions, in the form of “strong” and “weak” interfaces, aredisplayed in Fig. 11.
For both composites, the experimental results are in reasonable agreement with themodel predictions using a value for the contribution coefficient of C = 0.4 for the “stronginterface” composite, and C = 0 for the “weak interface” material. Such predictions areconsistent with observations that poor interfacial toughness induces large interfacial cracksizes corresponding to a low contribution by the reinforcement.
Since the relative size of the reinforcement is small in particulate-reinforcedcomposites, the effect of the interfacial toughness on the wear rate can be significant. Forexample, when the interface is weak, the reinforcement can be readily removed duringabrasive wear conditions, such that a negative reinforcement effect is observed. Indeed,as shown in Fig. 11 (b), the wear rates in the composite were higher than those in theunreinforced matrix; moreover, with increasing reinforcement volume fraction, the wearrates were further increased.
The abrasive wear rates of composites with different relative sizes of thereinforcement (relative to the abrasive medium) are plotted in Fig. 12. It can be seen thatfor the case of a large reinforcement particle size relative to abrasive size, whichcorresponds to classical abrasive wear conditions, a value of C = 0.4 shows goodagreement with the experimental results (Fig. 12 (a)). The experimental data fall withinthe rules of mixtures bounds, exceeding the upper bound at a reinforcement volumefraction of about 0.5. When the reinforcement particle is small relative to the abrasivesize, however, the wear rates increase considerably for the same composite material (Fig.12 (b)). This is due to plowing by the abrasive medium, leading to a higher wear rateassociated with debonding and particle removal mechanisms. This physically-basedconsideration is not in the rules of mixtures formulations. Once again, test results areconsistent with the current model’s predictions.
CONCLUSIONS
A simple framework for a physically based model for abrasive wear in ductilecomposites reinforced with a hard second phase is presented based on the salientmechanisms of sliding wear, namely plowing, cracking at the matrix/reinforcementinterface or in the reinforcement, and particle removal. The model relies on thestraightforward notion that any portion of reinforcement that is removed as wear debriscannot contribute to the wear resistance of the material; the size of this non-contributingportion (NCP) of the reinforcement is estimated from the mechanistic descriptions. Themodel provides a rationale for the contribution coefficient, C. The limitations inherent insuch a model are that it does not take into account additional mechanisms possible in athree-dimensional model, such as torsional and out-of-plane particle removal modes.However, since the abrasive wear data were obtained from pin-on-drum tests where thewear path is essentially linear, one would expect that the predominant wear mechanismsto lie along the two-dimensional plane represented by the proposed model. While the
12
torsional and out-of-plane particle pull-out mechanisms are certainly likely, thiscontributions to the overall wear rate are expected to be secondary. Critical variablesdescribing the role of the reinforcement are identified in terms of the relative size of thereinforcement, the depth of plowing and the toughness of the matrix/reinforcementinterface or the reinforcement. The model provides a reasonable description of thevariation in abrasive wear rates with reinforcement volume fraction and provides ajustification for the “negative reinforcement” effect.
ACKNOWLEDGMENTS
Support for one of the authors (ROR) was provided by the Director, Office ofScience, Office of Basic Energy Sciences, Materials Sciences Division of the U.S.Department of Energy under Contract No. DE-AC03-76SF00098.
13
REFERENCES
1. K.J. Bhansali and R. Mehrabian, Abrasive wear of aluminum-matrix composites,Journal of Metals, 34 (1982) 30-34.
2. C.P. Dogan and J.A. Hawk, Role of zirconia toughening in the abrasive wear ofintermetallic and ceramic composites, Wear, 212 (1997) 110-118.
3. D.Holz, R. Janssen, K. Friedrich and N. Claussen, Abrasive wear of ceramic-matrixcomposites, Journal of the European Ceramic Society, 5 (1989) 229-232.
4. M.M. Khruschov, Principles of abrasive wear, Wear, 28 (1974) 69-88.5. S. Skoliannos and T.Z. Kattamis, Tribological properties of SiC/sub p/-reinforced Al-
4.5% Cu-1.5% Mg alloy composites, Materials Science & Engineering A (StructuralMaterials: Properties, Microstructure and Processing), 163 (1993) 107-113.
6. K.H. Zum-Gahr, Abrasive wear of two-phase metallic materials with a coarsemicrostructure, in: K.C. Ludema (ed.), International Conference on Wear ofMaterials, American Society of Material Engineering, Vancouver, 1985, 793 p.
7. M.M. Khruschov and M.A. Babichev, Resistance to abrasive wear of structurallyheterogeneous materials, Friction and Wear in Machinery, 12 (1958) 5-24.
8. N. Axen and S. Jacobson, A model for the abrasive wear resistance of multiphasematerials, Wear, 174 (1994) 187-199.
9. B. Yen and C. K. H. Dharan, A model for the abrasive wear of fiber-reinforcedpolymer composites, Wear, 195 (1996) 123-127.
10. N. Axen and K.H. Zum-Gahr, Abrasive wear of TiC-steel composite clad layers ontool steel, Wear, 157 (1992) 189-201.
11. N. Axen, A. Alahelisten, and S. Jacobson, Abrasive wear of alumina fibre-reinforcedaluminium, Wear, 173 (1994) 95-104.
12. N. Axen and S. Jacobson, Transitions in the abrasive wear resistance of fibre- andparticle- reinforced aluminium, Wear, 178 (1994) 1-7.
13. F.M. Hosking, F. Folgar Portillo, R. Wunderlin and R. Mehrabian, Composites ofaluminium alloys: fabrication and wear behaviour, Journal of Materials Science, 17(1982) 477-498.
14. S.V. Prasad and P.D. Calvert, Abrasive wear of particle-filled polymers, Journal ofMaterials Science, 15 (1980) 1746-1754.
15. S.-J. Liu, and K.-S. Lin, Effect of aging on abrasion rate in an Al-Zn-Mg-SiCcomposite, Wear, 121 (1988) 1-14.
16. S.V. Prasad and P.K. Rohatgi, Tribological properties of Al alloy particle composites,Journal of Metals, 39 (1987) 22-26.
17. W. Simm and S. Freti, Abrasive wear of multiphase materials, Wear, 129 (1989) 105-121.
18. A.C.M. Yang, J.E. Ayala, A. Bell and J.C. Scott, Effects of filler particles on abrasivewear of elastomer-based composites, Wear, 146 (1991) 349-366.
19. Z.F. Zhang, L.C. Zhang, and Y.W. Mai, Wear of ceramic particle-reinforced metal-matrix composites. I. Wear mechanisms, Journal of Materials Science, 30 (1995)1961-1966.
20. Z.F. Zhang, L.C. Zhang, and Y.W. Mai, Particle effects on friction and wear ofaluminum matrix composites, Journal of Materials Science, 30 (1995) 5999-6004.
14
21. B.K. Prasad, et al., Abrasive wear characteristics of Zn-37.2Al-2.5Cu-0.2Mg alloydispersed with silicon carbide particles, Materials Transactions, 36 (1995) 1048-1057.
22. I.M. Hutchings, Tribology; Friction and wear of engineering materials, Arnold,London, 1992, 273 p.
23. K.-H. Zum-Gahr, Microstructure and wear of materials. Tribology Series 10, ElsevierScience, New York, 1987, 560 p.
24. W.M. Garrison, Khruschov's rule and the abrasive wear resistance of multiphasesolids, Wear, 82 (1982) 213-220.
25. S.R. White and R.G. Albers, Experimental investigation of aluminum/epoxyinterfacial properties in shear and tension, Journal of Adhesion, 55 (1996) 303-316.
26. M.-Y. He and J.W. Hutchinson, Crack deflection at an interface between dissimilarelastic materials, International Journal of Solids Structures, 25 (1989) 1053-1067.
27. Annual Book of ASTM Standards, American Society for Metals, WestConshohocken, PA, 1999, 544 p.
15
FIGURE CAPTIONS
Fig. 1. Predicted abrasive wear rates of composites. Eqs. (1) and (2) represent the lowerand upper limits of the existing methods. Experimental results (region A) ofcomposites reinforced with hard particles often lie outside these bounds [1,10-14].
Fig. 2. General schematic drawing of a two-phase composite in abrasion with simplifiedgeometry in two-dimensions: a triangular abrasive medium and rectangularreinforcements.
Fig. 3.Abrasive particles plow the matrix and reinforcement alternatively forming stressfields around them; compressive stresses are created in front and tensile stressesbehind the abrasive particle.
Fig. 4.With a “weak” interface between the matrix and the reinforcement, the motion ofabrasive medium leads the crack propagation along the interface (a). When thematrix/reinforcement interface is relatively “strong" in that the ratio of the fracturetoughness between interface and reinforcement is larger than ~0.25 for this geometry,the crack penetrates into the reinforcement (b) [26].
Fig. 5. (a) The tip of the interfacial crack reaches the bottom of the reinforcing particleand continues to propagate around the particle. (b) The size of the non-contributing portion (NCP) of reinforcement due to the failure at thematrix/reinforcement interface is (x + aint).
Fig. 6. (a) When the tip of the crack reaches the reinforcement/matrix interface,continuous motion of abrasive medium causes removal of a portion of thereinforcement as a large mass. (b) The size of the non-contributing portion (NCP)of the reinforcement per path of each abrasive medium is (aR × x)/path.
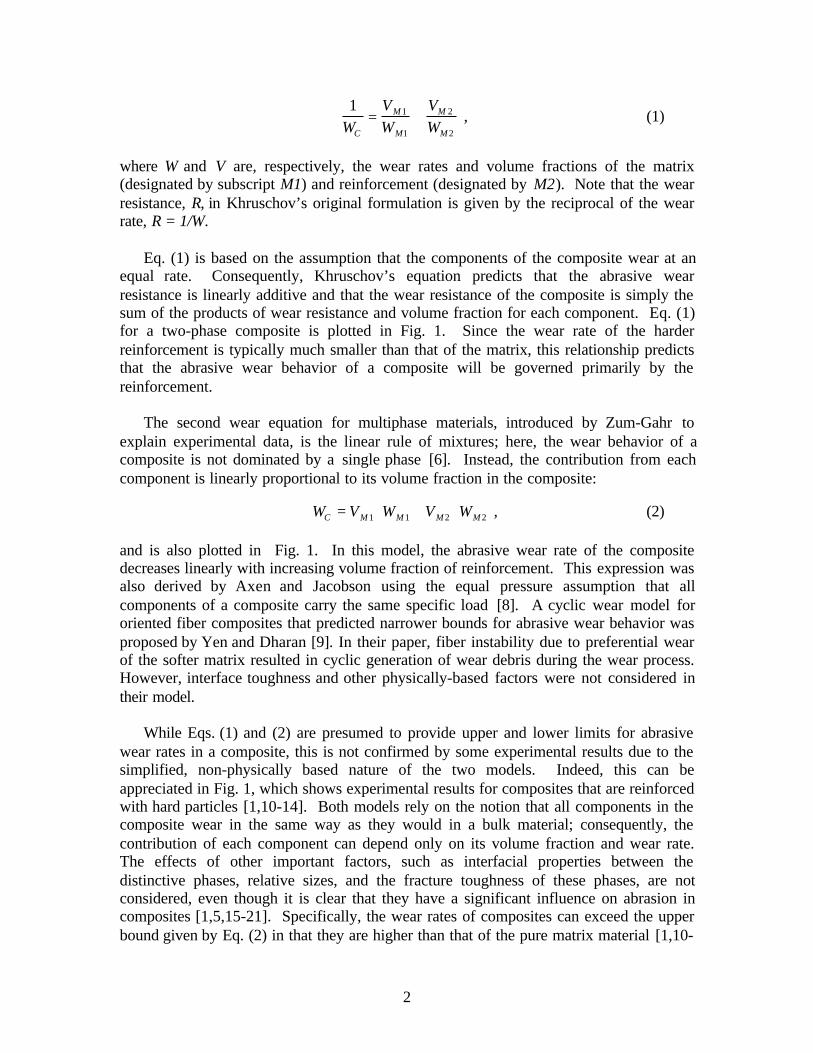
Fig. 7.Scanning electron micrograph of aluminum particulate-reinforced epoxycomposite with 40 vol.% of the reinforcement. The average size of the reinforcingparticles is ~100 µm.
Fig. 8.Scanning electron micrographs of alumina abrasive: (a) coarse abrasive with anaverage size of 326 µm (p50 grit), (b) with an average size of 127 µm (p120 grit),and (c) fine abrasive with an average size of 35 µm (p400 grit).
Fig. 9.Pin-on-drum abrasive wear test set-up. The drum is 150 mm in diameter androtates at 25 rpm resulting in a tangential velocity of 0.2 m/s. The longitudinaltraverse is 4.2 mm/rev of the drum. A counter records the number of revolutions.The composite specimen is loaded onto the drum with a specified weight.
Fig. 10. Prediction of abrasive wear rates, normalized to the wear rate of thereinforcement, for two ideal composites with different contribution coefficientsand volume fractions. The two composites, termed composite 1 and 2, differ in
16
their relative wear resistance; the abrasive wear resistance of the reinforcementin composite 2 is twice as large as that of the reinforcement in composite 1.Plots are for various values of the contribution coefficient, C. The shadedregion represents the predictions from the rule of mixtures models, Eqs. (1) and(2).
Fig. 11. Abrasive wear rates of particulate reinforced model composites with differentinterfacial properties between matrix and reinforcement, showing predictionsfor (a) a strong interface (aint << DR), and (b) a very weak interface (aint ~ DR).The line through the experimental results for Al-reinforced epoxy matrixcomposites is shown as a solid line; predictions are dashed lines. The shadedregion represents the predictions from the rule of mixtures models, Eqs. (1) and(2).
Fig. 12. Abrasive wear rates with different relative size of the reinforcement relative tothe abrasive medium, showing experimental results for Al-reinforced epoxycomposites (solid lines with data points) and model predictions (dashed lines) forcomposites with a) large reinforcement size (DR > x), and b) small reinforcementsize (DR ~ x). The shaded region represents the predictions from the rule ofmixtures models, specifically Eqs. (1) and (2).
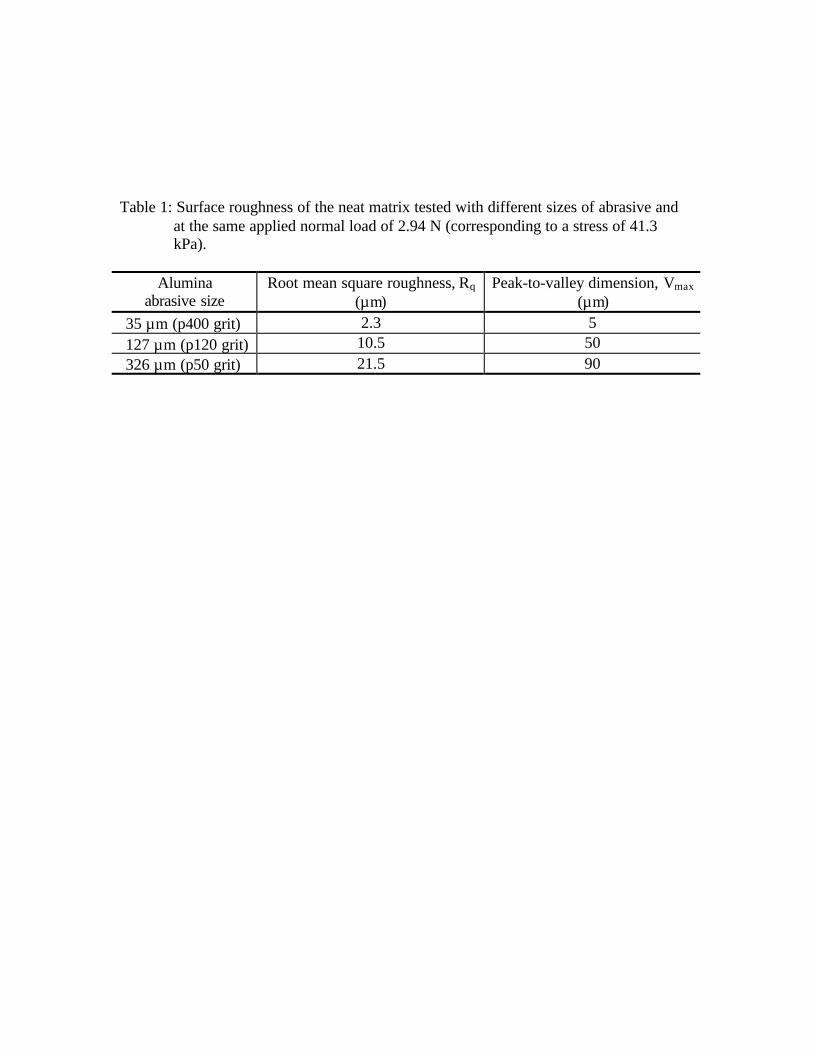
Table 1: Surface roughness of the neat matrix tested with different sizes of abrasive andat the same applied normal load of 2.94 N (corresponding to a stress of 41.3kPa).
Aluminaabrasive size
Root mean square roughness, Rq
(µm)Peak-to-valley dimension, Vmax
(µm)35 µm (p400 grit) 2.3 5127 µm (p120 grit) 10.5 50326 µm (p50 grit) 21.5 90
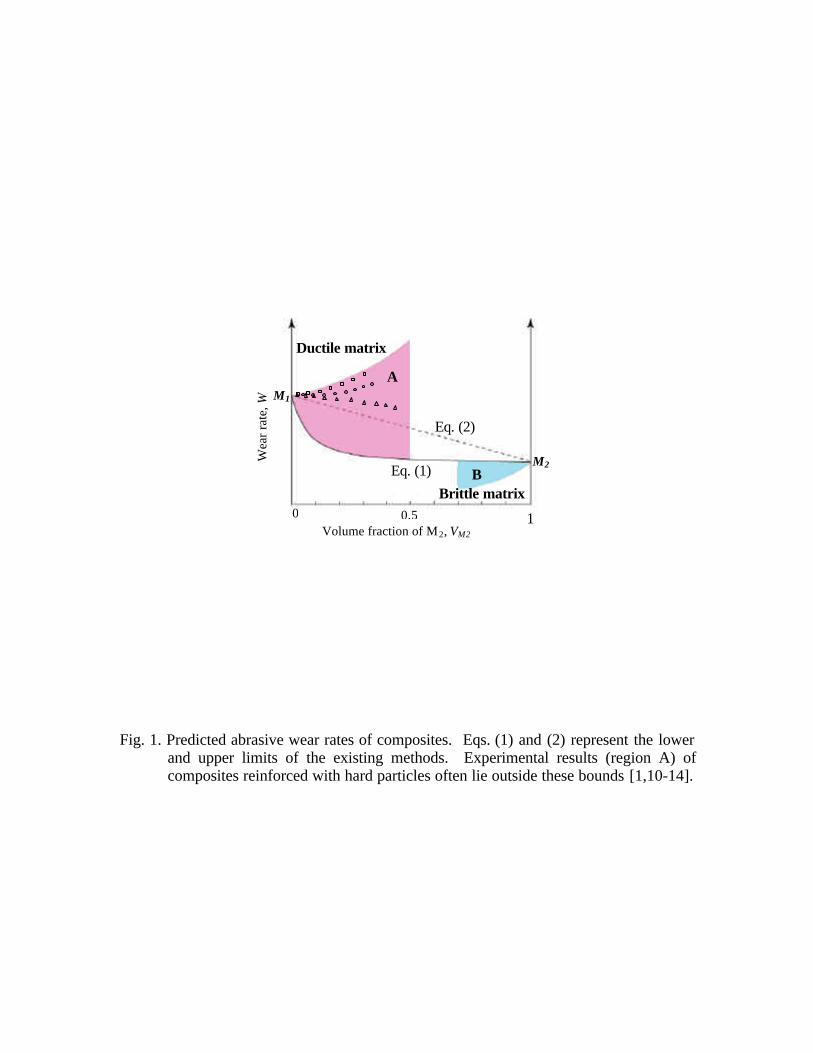
Fig. 1. Predicted abrasive wear rates of composites. Eqs. (1) and (2) represent the lowerand upper limits of the existing methods. Experimental results (region A) ofcomposites reinforced with hard particles often lie outside these bounds [1,10-14].
Wea
r rat
e, W
Volume fraction of M2, VM2
0 0.5 1
M1
M2Eq. (1)
Eq. (2)
A
B
Ductile matrix
Brittle matrix
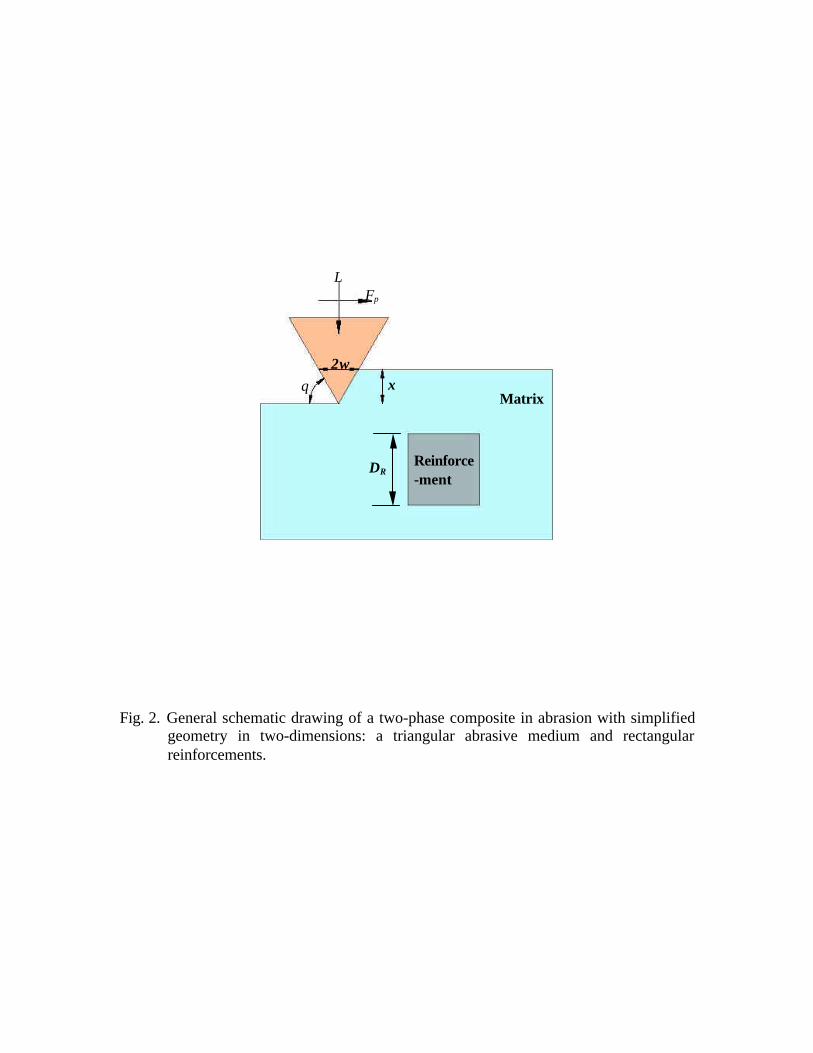
Fig. 2. General schematic drawing of a two-phase composite in abrasion with simplifiedgeometry in two-dimensions: a triangular abrasive medium and rectangularreinforcements.
Fp
x2w
DR
θMatrix
Reinforce-ment
L
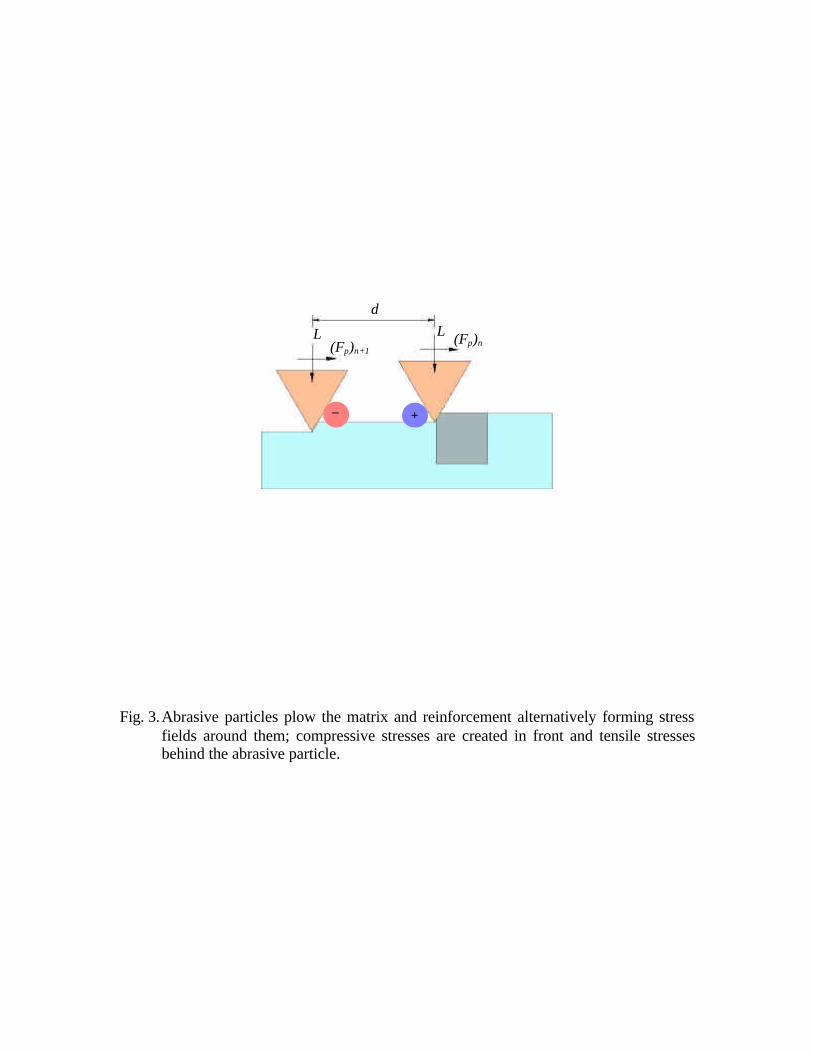
Fig. 3.Abrasive particles plow the matrix and reinforcement alternatively forming stressfields around them; compressive stresses are created in front and tensile stressesbehind the abrasive particle.
L (Fp)n
d
_+
L(Fp)n+1
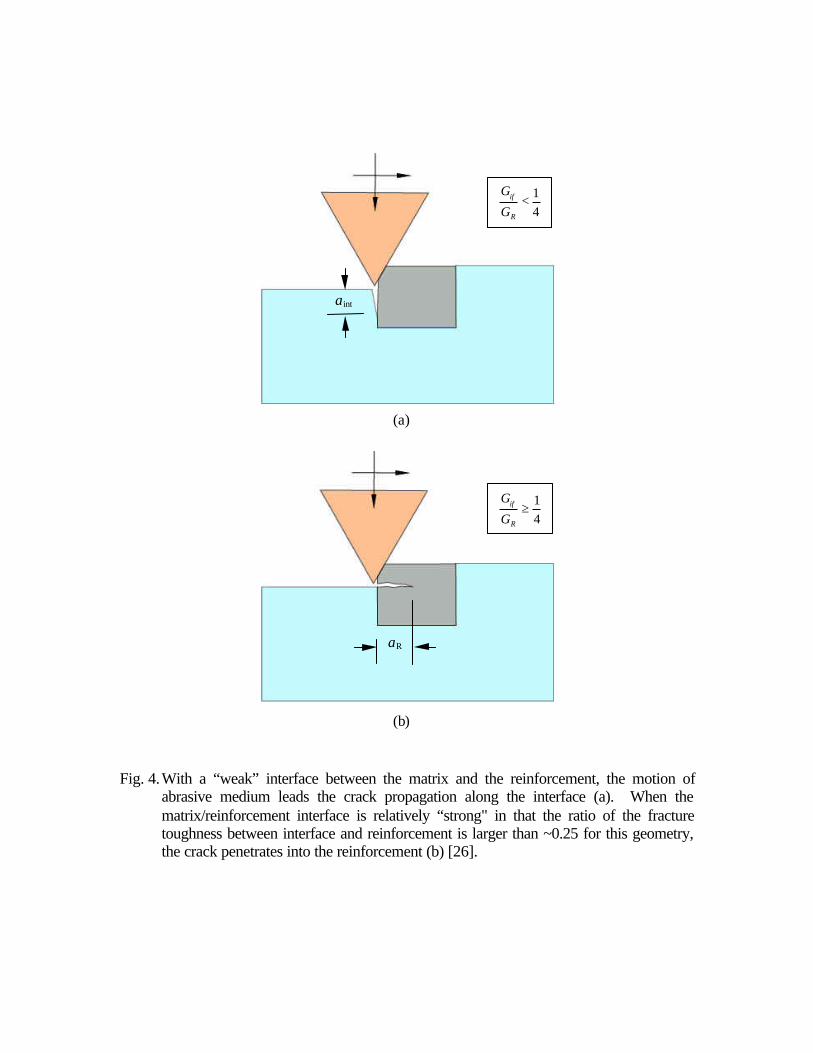
Fig. 4.With a “weak” interface between the matrix and the reinforcement, the motion ofabrasive medium leads the crack propagation along the interface (a). When thematrix/reinforcement interface is relatively “strong" in that the ratio of the fracturetoughness between interface and reinforcement is larger than ~0.25 for this geometry,the crack penetrates into the reinforcement (b) [26].
(b)
41≥
R
if
G
G
aR
(a)
41<
R
if
G
G
aint
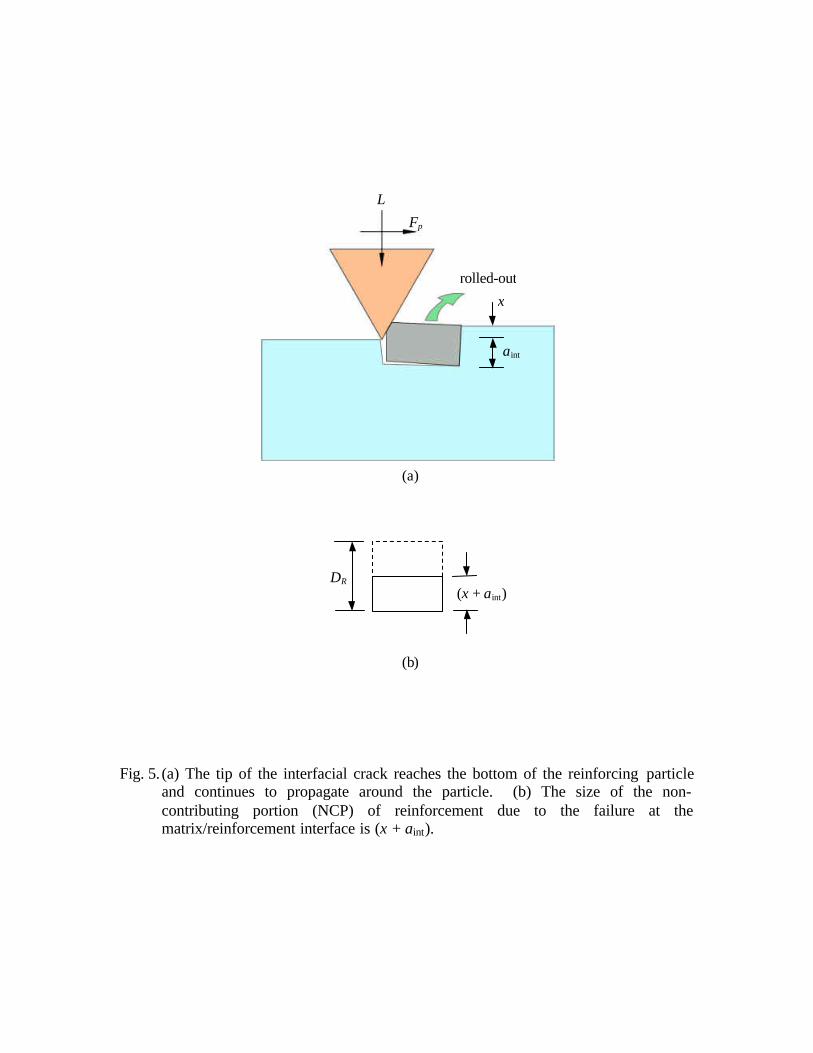
Fig. 5. (a) The tip of the interfacial crack reaches the bottom of the reinforcing particleand continues to propagate around the particle. (b) The size of the non-contributing portion (NCP) of reinforcement due to the failure at thematrix/reinforcement interface is (x + aint).
DR
(x + aint)
(a)
(b)
x
aint
rolled-out
L
Fp
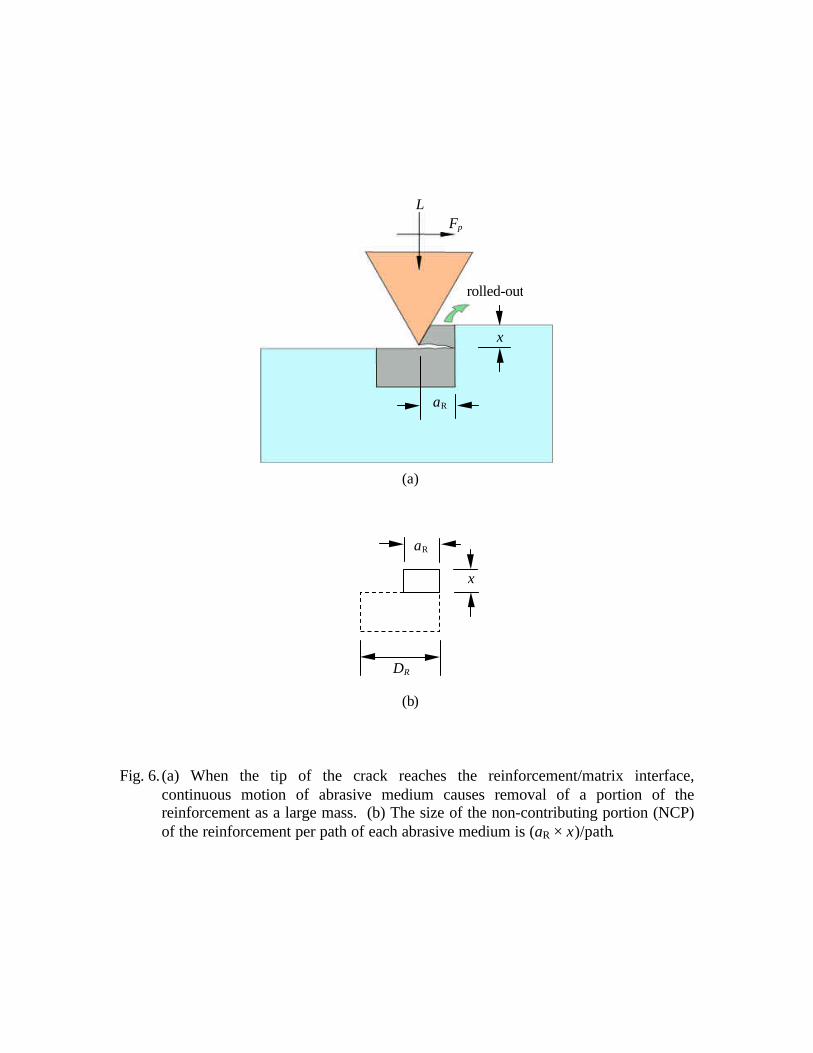
Fig. 6. (a) When the tip of the crack reaches the reinforcement/matrix interface,continuous motion of abrasive medium causes removal of a portion of thereinforcement as a large mass. (b) The size of the non-contributing portion (NCP)of the reinforcement per path of each abrasive medium is (aR × x)/path.
x
(a)
(b)
DR
aR
LFp
rolled-out
aR
x
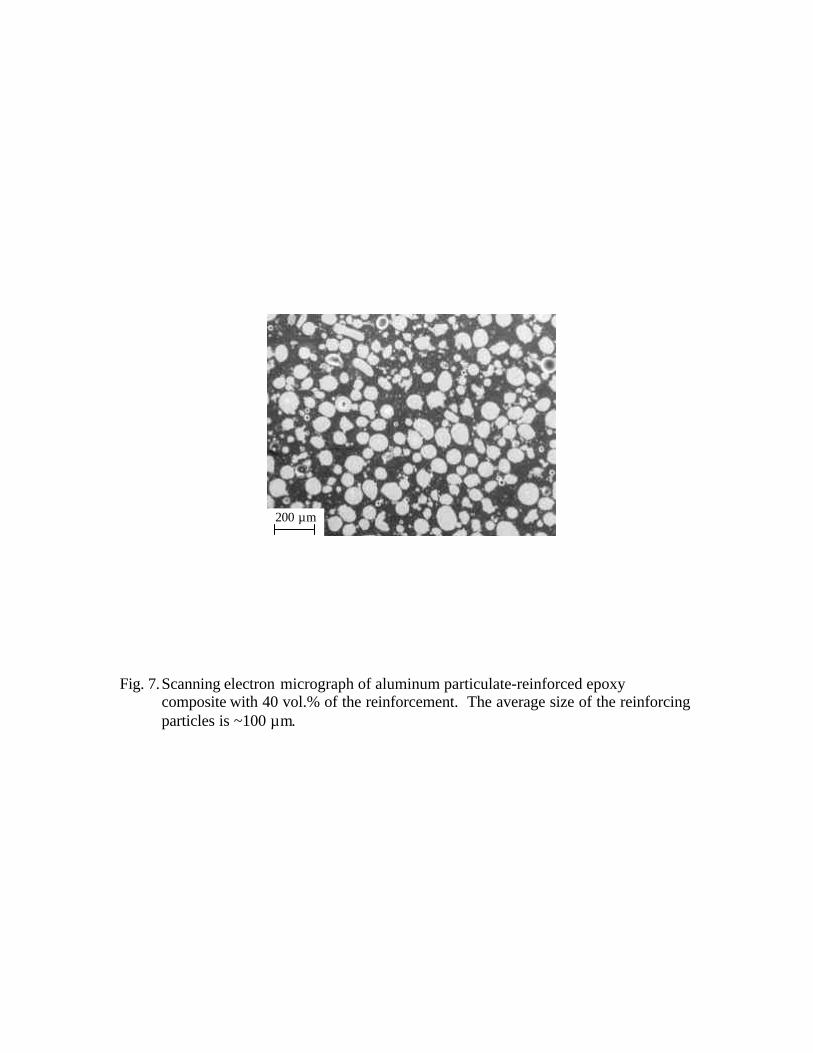
Fig. 7.Scanning electron micrograph of aluminum particulate-reinforced epoxycomposite with 40 vol.% of the reinforcement. The average size of the reinforcingparticles is ~100 µm.
200 µm
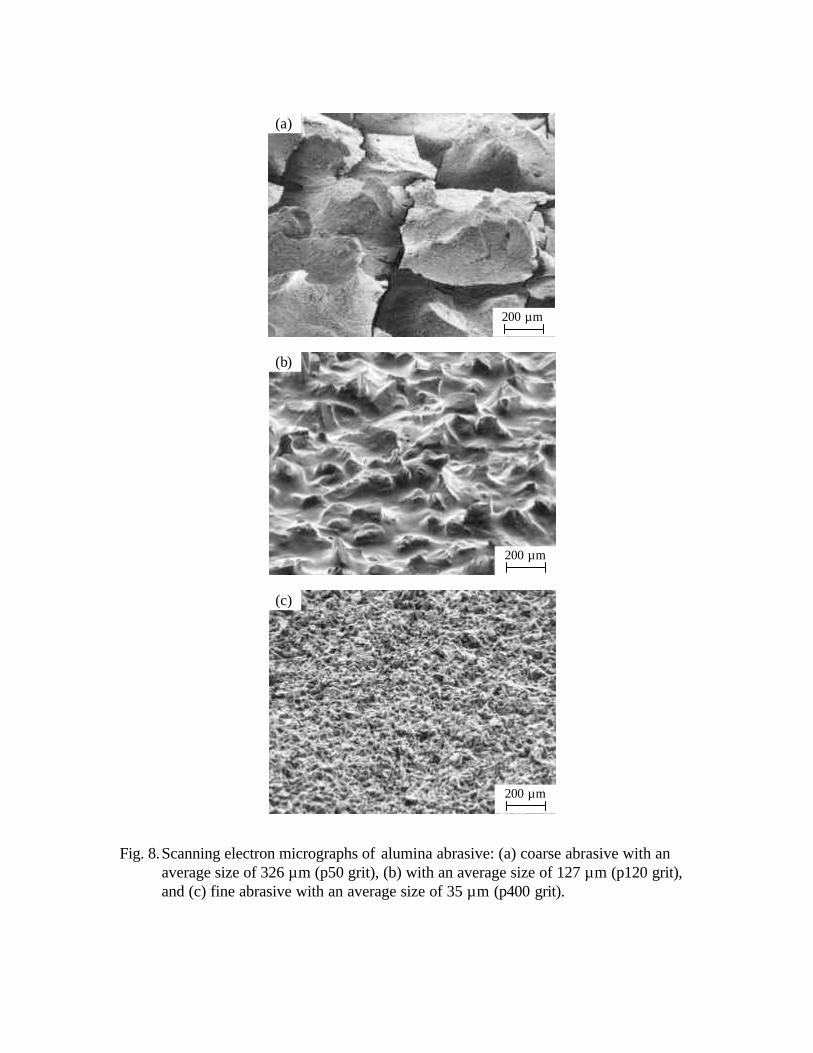
Fig. 8.Scanning electron micrographs of alumina abrasive: (a) coarse abrasive with anaverage size of 326 µm (p50 grit), (b) with an average size of 127 µm (p120 grit),and (c) fine abrasive with an average size of 35 µm (p400 grit).
200 µm
200 µm
200 µm
(a)
(b)
(c)
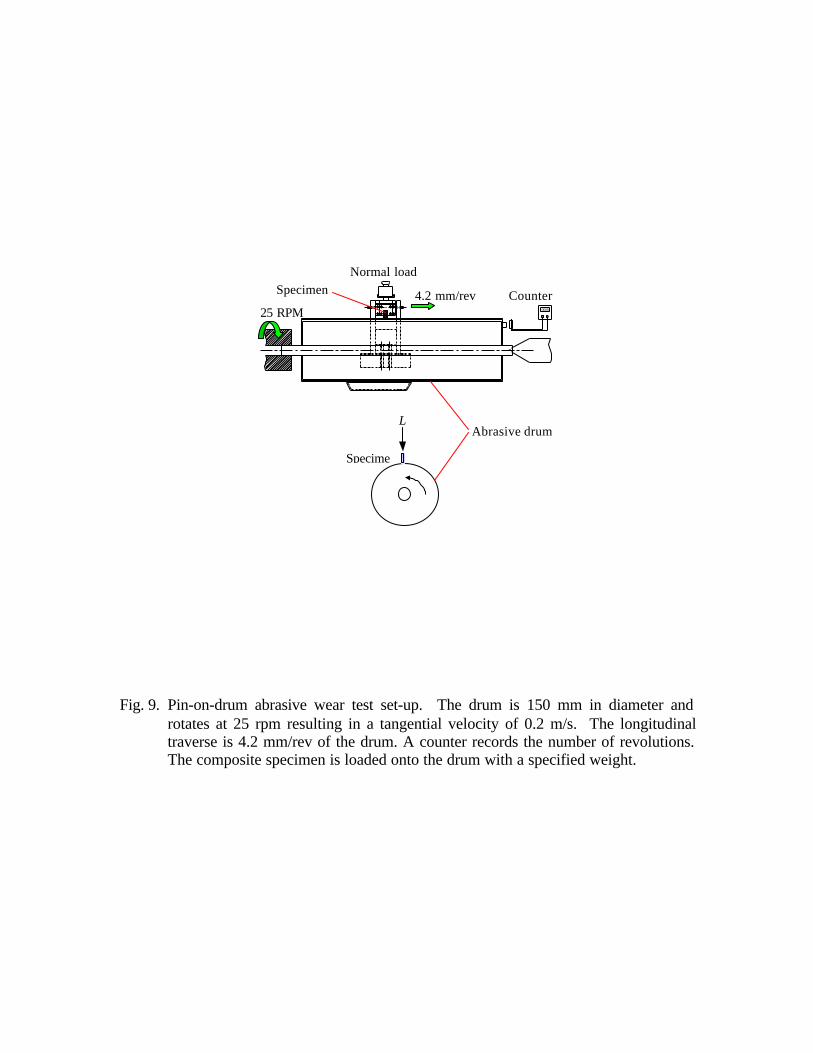
Fig. 9. Pin-on-drum abrasive wear test set-up. The drum is 150 mm in diameter androtates at 25 rpm resulting in a tangential velocity of 0.2 m/s. The longitudinaltraverse is 4.2 mm/rev of the drum. A counter records the number of revolutions.The composite specimen is loaded onto the drum with a specified weight.
008025 RPM4.2 mm/rev
Normal loadSpecimen Counter
Specime
Abrasive drumL
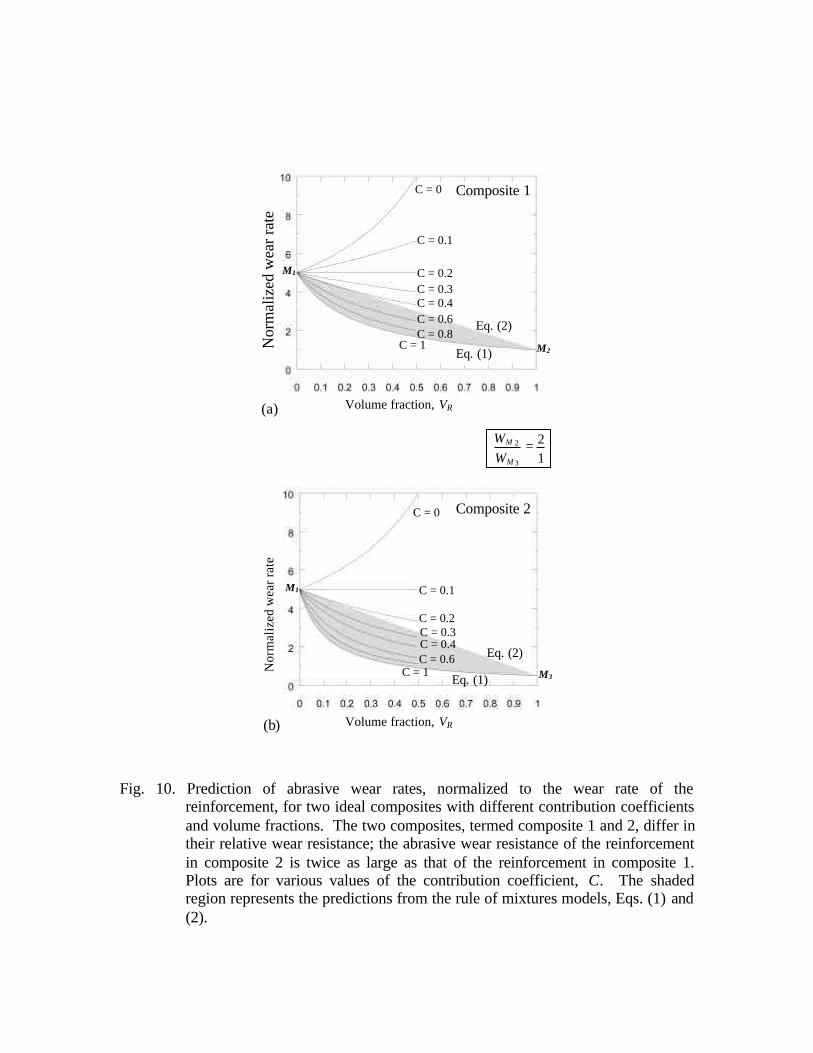
Fig. 10. Prediction of abrasive wear rates, normalized to the wear rate of thereinforcement, for two ideal composites with different contribution coefficientsand volume fractions. The two composites, termed composite 1 and 2, differ intheir relative wear resistance; the abrasive wear resistance of the reinforcementin composite 2 is twice as large as that of the reinforcement in composite 1.Plots are for various values of the contribution coefficient, C. The shadedregion represents the predictions from the rule of mixtures models, Eqs. (1) and(2).
Composite 1C = 0
C = 0.1
C = 0.2C = 0.3C = 0.4C = 0.6C = 0.8
C = 1Eq. (1)
Nor
mal
ized
wea
r rat
eM1
M2
Volume fraction, VR
C = 0
C = 0.1
C = 0.2C = 0.3C = 0.4C = 0.6
C = 1Eq. (1)
Nor
mal
ized
wea
r rat
e
M1
M3
Volume fraction, VR
Composite 2
12
3
2 =M
M
WW
(a)
(b)
Eq. (2)
Eq. (2)
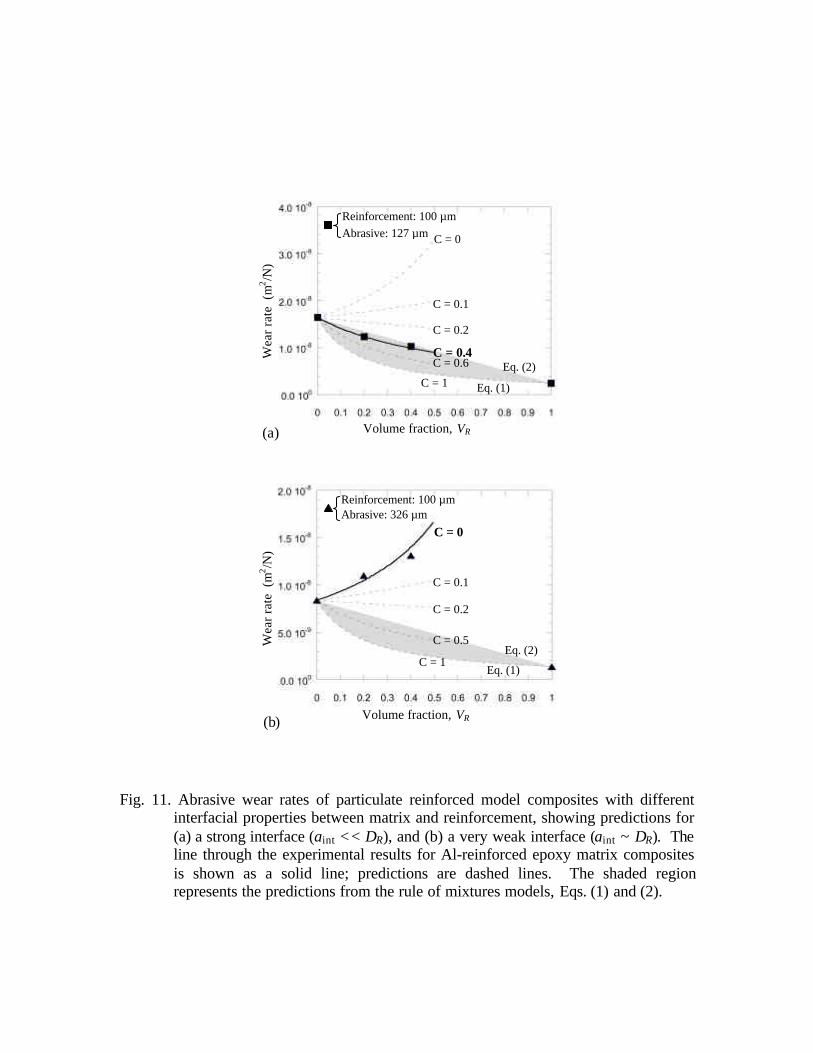
Fig. 11. Abrasive wear rates of particulate reinforced model composites with differentinterfacial properties between matrix and reinforcement, showing predictions for(a) a strong interface (aint << DR), and (b) a very weak interface (aint ~ DR). Theline through the experimental results for Al-reinforced epoxy matrix compositesis shown as a solid line; predictions are dashed lines. The shaded regionrepresents the predictions from the rule of mixtures models, Eqs. (1) and (2).
C = 0
C = 0.1
C = 0.2
C = 0.4
C = 1
C = 0.1
C = 0.2
C = 1
Wea
r rat
e (m
2 /N)
Volume fraction, VR
C = 0.6
(a)
C = 0
C = 0.5Wea
r rat
e (m
2 /N)
Volume fraction, VR(b)
Eq. (2)
Eq. (1)
Eq. (2)
Eq. (1)
Reinforcement: 100 µmAbrasive: 127 µm
Reinforcement: 100 µmAbrasive: 326 µm
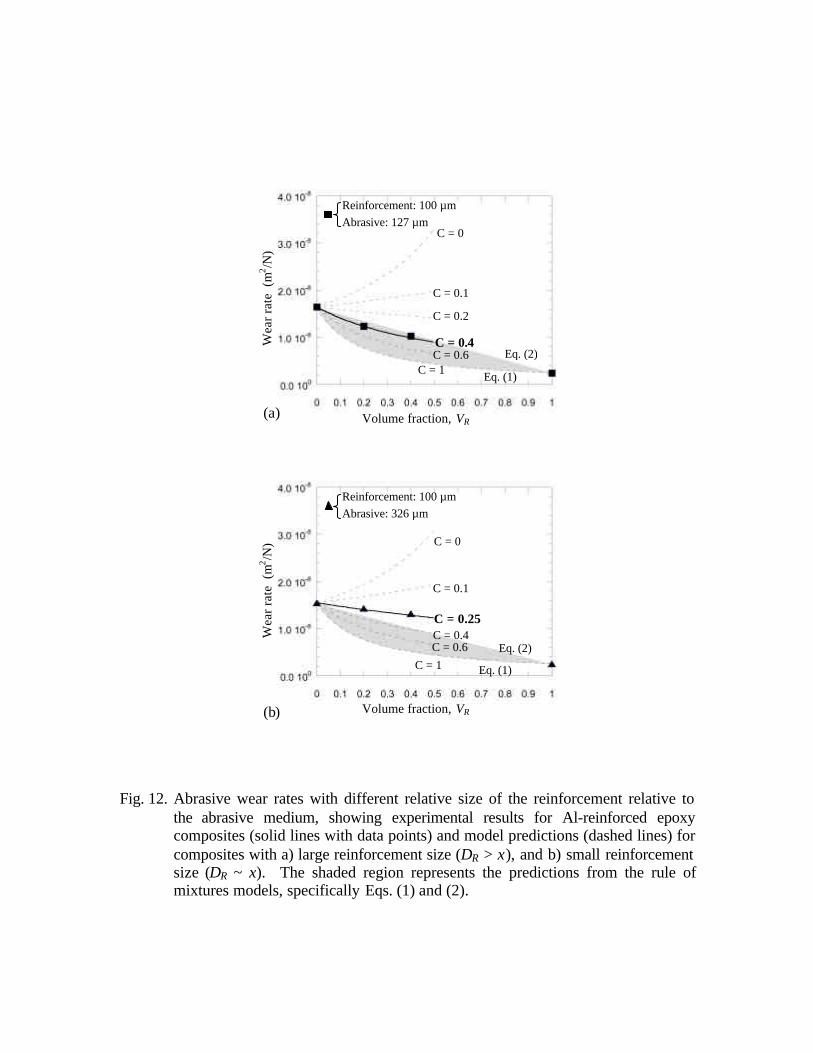
Fig. 12. Abrasive wear rates with different relative size of the reinforcement relative tothe abrasive medium, showing experimental results for Al-reinforced epoxycomposites (solid lines with data points) and model predictions (dashed lines) forcomposites with a) large reinforcement size (DR > x), and b) small reinforcementsize (DR ~ x). The shaded region represents the predictions from the rule ofmixtures models, specifically Eqs. (1) and (2).
C = 0.1
C = 0.25
C = 0.6
C = 0
C = 0.4Wea
r rat
e (m
2 /N)
(b)
C = 0
C = 0.1
C = 0.2
C = 0.4
C = 1
Wea
r rat
e (m
2 /N)
Volume fraction, VR
C = 0.6
(a)
Volume fraction, VR
C = 1Eq. (2)
Eq. (1)
Eq. (2)
Eq. (1)
Reinforcement: 100 µmAbrasive: 127 µm
Reinforcement: 100 µmAbrasive: 326 µm

![Effect of Abrasive Particle Size on Abrasive Wear ... · size effect encountered in all abrasive wear mechanisms (for example erosive wear) [15-18]. The focus of this study is to](https://static.fdocuments.in/doc/165x107/604611f4ea7149605f651819/effect-of-abrasive-particle-size-on-abrasive-wear-size-effect-encountered-in.jpg)