A PHOTOMETER FOR THE INVESTIGATION OF THE … Bound...reproduction of various light sources ., by p....
7
66 PHILIPS TECHNICAL REVIEW Vol. ,4, No. 3 where there are many switches, 0.1' where different parts of trains are customarily ranged alongside 'of each other, At such places it is usually necessary to. place the lanterns closer together, not primarily to. obtain a stronger illumination, but mainly to. neutralize the shadows occurring in the co.mpass of one lantern hy the light of another lantern. There- fore the po.wer installed will he increased at such a spot to. 0.1 to. 0.15 watt per sq.m. ' On the ground plan of the railway yard in Breda (fig. 5) it may be seen that the ends of the yard, where relatively many switches are located, are more thickly occupied by lanterns than the middle section with straight continuous tracks. The light distrihution of the 'reflecto.rs for sodium lamps is not symmetrical in all directions. The maximum light intensities lie in the plane perpendicular to.the axis of the lamp. The reflectors must therefore in general he mounted perpendicular to. the length of the yard. In a railway yard, as already suggested, the lan- terns will quickly become dirty because of the large quantities of smoke and soot in the air. Regular cleaning is therefore essential. To.facilitate this the fixtures are hest mounted in s~ch a way that they can easily he lowered, In fig. 6 the method of hanging the lanterns, used by the Netherlands Railways is shown, while in the text under the figure further particulars are given. Finally fig. 7 is a photograph of a railway yard in Amsterdam which is lighted with sodium lamps in the, fixtures shown in fig. 6. A PHOTOMETER FOR THE INVESTIGATION OF THE COLOUR RENDERING REPRODUCTION OF VARIOUS LIGHT SOURCES . , by P. M. VAN ALPHEN. 535.247.4 : 535.62 : 628.93 For the investigation of the colour reproduetion obtained with different kinds of light a photometer has been developed in 'this Iaboratory with which it is possible to measure the light flux in definite wave-length regions of the spectrum. The photometer is desc- ribed in this article. Special attention is paid to the circuit which'is used for the measure- ment of very small photocurrents. Finally it is shown by means of several examples what type of investigations can be carried out with this instrument. The colour 'repro.ductio.n of various sources of more 0.1' less white light has been repeatedly dis- cussed in this periodical. It, was always pointed out that Jt is impossible to. conclude from the colour of the light radiated, how the colours of illuminated' objects will be reproduced under the light in question, In order to. judge this one must know how the intensity of the source of light varies as a func- tion' of the wavelength. A complete description of a light source therefore must include a curve , I 0.1' an elaborate table. It is of course desirable to. be able to. characterize a light source by means of ,a' smaller number of values, and it was actually found possible to. divide the spectrum into. eight different blocks in such a ~ way, that the colour reproduetion of a ~nd of light is sufficiently accurately characterized by the ~alue of the light flux which is emitted in each of these eight blocks, This block metho.d is often ap- plied in this Iaboratory in the investigatio.n of light ,so.urces and has+often been -mentiöned+in th~s periodieal ê) . , The following will be a description of the photom- eter which was designed especially for these measurements. Several examples will then be dis- cussed which serve to. give an impreesion of the usefulness of the instrument. The choice of the blocks The 'blo.cks must be chosen so. small that the colour of commonly used pigments does not change significantly under the light when shifted within one block, In order to. attain this requirement to. the same degree for every colour it was found necessary to. choose the intervals smaller in the blue than elsewhere. The following division proved satisfactory: 4 000-4 200-4 400-4 600-5 000- 5500-6 000-6 500-7 000 Á. Later, in connection with the photometry of , mercury light, a so.me~hat different division was . I'" 1) See for example the articles: P. J. Bouma, Colour re- production in the use of different sources of "white light", Philips techno Rev. 2, J, :1.937:W. Uyterhoeven and G. Zecher, Low-pressure mercury discharge within a luminescent tube, Philips techno Rev. 3, 277, 1938; G. Heller, A film projection installation with water- cooled mercury lamps, Philips techno Rev. 4, 2, 1939.
Transcript of A PHOTOMETER FOR THE INVESTIGATION OF THE … Bound...reproduction of various light sources ., by p....

66 PHILIPS TECHNICAL REVIEW Vol. ,4, No. 3
where there are many switches, 0.1' where differentparts of trains are customarily ranged alongside'of each other, At such places it is usually necessaryto. place the lanterns closer together, not primarilyto. obtain a stronger illumination, but mainly to.neutralize the shadows occurring in the co.mpass ofone lantern hy the light of another lantern. There-fore the po.wer installed will he increased at sucha spot to. 0.1 to. 0.15watt per sq.m. '
On the ground plan of the railway yard in Breda(fig. 5) it may be seen that the ends of the yard,where relatively many switches are located, aremore thickly occupied by lanterns than the middlesection with straight continuous tracks.
The light distrihution of the 'reflecto.rs forsodium lamps is not symmetrical in all directions.
The maximum light intensities lie in the planeperpendicular to. the axis of the lamp. The reflectorsmust therefore in general he mounted perpendicularto. the length of the yard.
In a railway yard, as already suggested, the lan-terns will quickly become dirty because of the largequantities of smoke and soot in the air. Regularcleaning is therefore essential. To. facilitate this thefixtures are hest mounted in s~ch a way that theycan easily he lowered, In fig. 6 the method ofhanging the lanterns, used by the NetherlandsRailways is shown, while in the text under thefigure further particulars are given. Finally fig. 7is a photograph of a railway yard in Amsterdamwhich is lighted with sodium lamps in the, fixturesshown in fig. 6.
A PHOTOMETER FOR THE INVESTIGATION OF THE COLOUR RENDERINGREPRODUCTION OF VARIOUS LIGHT SOURCES
. , by P. M. VAN ALPHEN. 535.247.4 : 535.62 : 628.93
For the investigation of the colour reproduetion obtained with different kinds of lighta photometer has been developed in 'this Iaboratory with which it is possible to measurethe light flux in definite wave-length regions of the spectrum. The photometer is desc-ribed in this article. Special attention is paid to the circuit which'is used for the measure-ment of very small photocurrents. Finally it is shown by means of several examples whattype of investigations can be carried out with this instrument.
The colour 'repro.ductio.n of various sources ofmore 0.1' less white light has been repeatedly dis-cussed in this periodical. It, was always pointedout that Jt is impossible to. conclude from the colourof the light radiated, how the colours of illuminated'objects will be reproduced under the light inquestion, In order to. judge this one must know howthe intensity of the source of light varies as a func-tion' of the wavelength. A complete descriptionof a light source therefore must include a curve
, I
0.1' an elaborate table.It is of course desirable to. be able to. characterize
a light source by means of ,a' smaller number ofvalues, and it was actually found possible to. dividethe spectrum into. eight different blocks in such a~way, that the colour reproduetion of a ~nd of lightis sufficiently accurately characterized by the~alue of the light flux which is emitted in each ofthese eight blocks, This block metho.d is often ap-plied in this Iaboratory in the investigatio.n of light
,so.urces and has+often been -mentiöned+in th~speriodieal ê) ., The following will be a description of the photom-
eter which was designed especially for thesemeasurements. Several examples will then be dis-cussed which serve to. give an impreesion of theusefulness of the instrument.
The choice of the blocks
The 'blo.cks must be chosen so. small that thecolour of commonly used pigments does not changesignificantly under the light when shifted withinone block, In order to. attain this requirement to.the same degree for every colour it was foundnecessary to. choose the intervals smaller in theblue than elsewhere. The following division provedsatisfactory: 4 000-4 200-4 400-4 600-5 000-5 500-6 000-6 500-7 000Á.
Later, in connection with the photometry of, mercury light, a so.me~hat different division was
. I'"
1) See for example the articles: P. J. Bouma, Colour re-production in the use of different sources of "white light",Philips techno Rev. 2, J, :1.937:W. Uyterhoeven andG. Zecher, Low-pressure mercury discharge within aluminescent tube, Philips techno Rev. 3, 277, 1938;G. Heller, A film projection installation with water-cooled mercury lamps, Philips techno Rev. 4, 2, 1939.

MARCH 1939 PHOTOMETER FOR COLOURRENDERING REPRODUCTION OF LIGHTSOURCES , 67
S0403
Fig. 2. Arrangement of a spectrometer-on the same principle as in fig. ,1. In order to avoidscattered light the set up of fig. 1 is elaborated to a double monochromator. The lightsource is placed in an Ulbricht sphere A.
adopted, namely: 4 000 -, 4 200 - 4 400 - 4 600 -5 100 - 5 600 - 6100 - 6600 -,7200 Á., In the first-mentioned division the green.mercury
line of 5 461 Á would have fallen practicallyon theboundary between two blocks, which is undesirablepractically because a small error in the adjustmentof the blocks would lead to the light flux of thatline being divided between two blocks in quitedifferent ways: As to the value of the blocks forcolour impression, the new division is practicallyequivalent to the one first chosen.
The principle of the measuring process
The principle of the measuring process is illu-strated in fig. 1. Light from, the source being in-vestigated falls on a slit 8 'of a prism spectroscope.By means of lens L and .prism P a spectrum isthrown on the window D., In this Window there isan opening at the point where the block of lightbeing measured is Incident. The radiation trans-
A
mitted is nieasured by means of a photocell F.The height of the opening ~ the window,D has beenmade to correspond to the sensitivity of the eyefor that wave length for every wave length of thespectrulll, and in such a way that the photocurrent,which with a given i~tensity also depends uponthe wave length, is a direct measure of the lightflux which is emitted in the block of the spectrumunder consideration. By using different screenswith openings at different parts of the spectrumcorresponding with the different blocks, the 'lightflux can hè measured in the eight blocks of thespectrum.Although the principle is very simple" the tech-
,nical execution presents' difficulties which we shallhere discuss briefly. The light flux available, as willbe shown later, is extremely small, so that for ac-curate measurement it is necessary to exclude ab-solutely any influence from scattered light, especiallyfrom scattered light with undesired wave lengths.For this purpose it is desirable to 'use a double
monochromator, by which the already small lightflux is reduced, even more. Á description of themeasuring arrangement will preeeed the estimationof the light flux.
\,,:%::'\.S
Fig. 1. Diagram of a. spectrometer for the determination ofthe light flux in a certain section of the spectrum. A spectrumof the light which passes through the slit S is formed by meansof the lens L and the prism P on the window D:This windowhas an' opening which transmits only a certain part of thespectrum. The light flux transmitted is measured by meansof the photocell F.
30402
.The measuring arrangement
Fig. 2 is a diagram of the complete measuring
arrangement. In an Ulbricht sphere A, 50 cmin diameter, the lamp to be tested is placed. Thewalls of the sphere illuminate the slit 81 which is0.3 mm wide. By means of the achromatic lensesL1 and L2 and the prism P a spectrum is formedon the plane DD'. In this plane there is a diaphragmwhich transmits a certain block of the spectrum.The function of this plane is to cut off scattered,light. The plane DD' is situated between two'lenses V1 and V2 which form an image of lens L2
on lens La, so that every ray of light ~hich leaveslens L2 also passes through lens La. ,
The paths of the rays for all non-scattered rayson both sides of DD', are mirror images of eachother. It follows from this that the rays of differentwavelengths which pass through á slit in the screen81 are again focussed on a slit in the screen 82 andfinally reach the photocell F. If, however, due. toreflection or scattering, light of a given wave lengthpasses through the Wrong block opening in DD'then this light is so refracted by prism P2 that it

68 PHILIPS TECHNICAL REVIEW Vol. 4, No. 3
does not strike the slit and cannot therefore act onthe photocell.
Because of the arrangement described the photo-cell receives light only from a certain block of thespectrum. We shall now discuss the photocurrentswhich may be expected as a result ofthis illumination.
The available light flux in a block.
The total light flux which passes through theapparatus is the following:
(jJ = K· 11; • B . O· sin2 1/2 cp lumen (1)
where cp is the angle of divergence of the mono-chromator; 0 the area 'of the first slit, B the bright-ness of the first slit, and K the loss factor.
The light strength of the spectrograph is deter-mined bythe relative aperture of the lens Lr In ourcase this is 1 : 3·5 (i.e. 1/2 'cp = 8°), which may heconsidered a high value. The image of the slit is 'focussed on the plane DD' in actual size, and aspectrum is formed in that plane whose total widthis about 15 mm, so that each block is 1.5 to 2 mm
_ long. If the wave length regions are to be fairlyaccurately defined, the width of the first slit mustbe sufficiently small compared with this 1.5 mm.The height of the slit is limited by the' appearanceof aberration for object points ouside J the axis.We chose a width of 0.3 mm and a height of 17 mm,so that the area 0 was equal to 0.051 sq.cm.In order to be able to 'measure the light flux of
small lamps with an Ulbricht sphere it is desir-able to be able to work with à low brightness in theplane of the slit, for example B = 0.1 o.p.jsq.cm,
The loss factor K is quite considerable becausethe light must pass through nine glass bodies (sixlenses, two prismas, and the window DD', since thediaphragm in this plane is deposited on glassphotographically). The loss in the glass is causedchiefly by reflection. The average transmission ofeach glass body is about 90 per cent, so that thetotal transmission will be:
K = ,0.99 = 40 per cent.
For the light' flux (jJ according to equation (1)we find:
(/J = 0.4 11; X 0.1 X 0.051 X sin2 8° = 125 X 10-4lumen.
Only a small part of this light flux is found inthe blue block from 4 000 - 4 200 Á. In the caseof sunlight this part is about 0.01 per cent; in thecase of many sources of artificiallight, which usually
contain less blue, the amo,unt of blue radiation willbe ten times as small.
If it is desired to measure this amount of blueradiation of 0.001 per cent with an accuracy of5 per cent, it is necessary' to be able to distinguishdifferences in light flux of 0.6 X 10⁻¹⁰ lumen.A vacuum photocell was' chosen with potassiumas the photo-sensitive material. These cells are veryconstant and have a sensitivity of 40 !L A/lumenin the light of an ordinary electric lamp. In the firstblue block the sensitivity is about 100 times greaterthan this. When this cell is used and light differencesof 10-10 lumen must be registred it must be possibleto measure a current difference of about 10-13 A.
. How such small photocurrents are measured
The very small photocurrent can easily he meas-ured by changing the charge on a condenser bymeans of this current, and measuring the differencein voltage between the plates of the condenserelectrostatically. This can for instance be done bymeans of a so-called electrometer triode, i.e. atriode whose control grid is very carefully insulatedfrom the other electrodes.
In fig. 3 the circuit is given which was used formeasuring the photocurrent. The photocurrentflows from the photocell F to the covering 1 of thecondenser C. The grid of the electrometer triode T(type 4060) is connected to the same covering.When the voltage of this grid changes, the anode
current, which can b~ read off on the micro-am-meter B, also changes.
The other plate of the condenser is connectedwith a potentiometer. By moving the contact ofthe potentiometer toward the right the grid voltageof the triode, which is about 1volt negative at thebeginning of the measurement, can be made morenegative. In this way, the increase of the grid
50404
Fig. 3. Circuit for the measurement of the photocurrent. Thephotocurrent from the cell F changes the charge on the con-denser C and consequently also the voltage on the grid g ofthe electrometer triode T. This voltage is kept constant whilethe photocurrent flows by moving the potentiometer so thatthe anode current (instrument B) remains constant. The time "t in which the voltage on the potentiometer changes by a cer-tain value Vis a measure of the photocurrent i, since i = CV/to

MARCH 1939 PHOTOMETER FOR COLOUR RENDERING REPRODUCTION OF LIGHTSOURCES 69
voltage which is due to the photocurrent can becontinually compensated and the anode currentremains constant.
The measurement is begun by opening theswitch S. The grid thus has the potentialof theearth terminal E at the beginning of the measure-ment, and is kept at this potential during the mea-surement by sliding the potentiometer contact.The time is measured in which the voltage on thepotentiometer is changed by a certain value V.If C is the capacity of the condenser and t the timemeasured, the photocurrent is
i = C Vit.
If we choose the voltage to be compensatedV = 1 volt, and if the capacity C = 100 f1.f1.F,thenwith a current of 10-12 A the charging time is 100sec. Since this charging time is easily measuredreproducibly with an accuracy of 1 sec, the accuracyof measurement is 10-14 A, which is quite sufficient.If the capacity C is made smaller the sensrtivitybecomes even greater. The limit is given by theirregularity of the ever present grid current andlies at about 10-17 A.
In order to attain this great accuracy variousprecautionary measures must be taken. In thefirst place the apparatus must be shielded fromexternal disturbances by placing the whole thingin an earthed container. Care must also betaken that the voltage of the battery of the photo-cell remains quite constant, since variations in thisvoltage can act on the system via the capacityof the photocell. Finally care must be taken thatno leakage currents are able to flow from the partof the circuit drawn with heavy lines.One advantage of the arrangement is that this
last requirement can be easily satisfied. Theportion of the circuit which is sensitive to leakagecurrents remains at earth potential during theentire measurement so that leakage can be avoidedby placing screening plates at dangerous points andconnecting them with the earth terminal E. More-over the air in the metal container in which theapparatus is situated is carefully dried with phos-phorus pentoxide. Only three parts then requirea very high insulation: the cathode of the photocellwith respect to the anode, the plate of the condenserwith respect to the other plate, and the grid of theelectrometer triode with respect to the anode. Inthe photocell and the triode the insulating mediumis a high vacuum; it was found desirable to placethe condenser also in a vacuum in order to avoidleakage current due to the presence of ionized aubetween the plates when this was not done.
The calibration of the photometer
The apparatus was calibrated by placing a tung-sten band lamp with known spectral distributionin front of the slit SI' and then moving a narrowslit slowly across the spectrum DD'. In this waythe strength of the photocurrent was measuredfor every wave length. The curve resulting doesnot agree with the spectral distribution curve ofthe lamp because the sensitivity of the photocellvaries in quite a different way with the wave length(it changes much more slowly with the wave length)from the sensitivity of the eye which we assumeto be given by the international eye-sensitivitycurve.If we wish the photocurrent to be a direct meas-
ure of the light flux, the height of the openingin the screen DD' can be so chosen for every wavelength that with equal intensity of radiation thephotocurrent of the radiation transmitted isproportional for every wave length to the eye sen-sitivity for the wave length in question.The proportionality factor need not be constant
for the whole spectrum, but can be chosen separatelyfor each of the eight blocks. This has the advantagethat in the blue blocks, although the eye sensitivityis very low here, we nevertheless can obtain fairlylarge photocurrents in order to measure the smallquantities of light in the blue with sufficient ac-curacy. In the calculation of the photocurrent thisis taken into account by assuming that the sen-sitivity of the photocell in the blue block is 100times as great as for ordinary electric light wherethe greater part of the light flux lies in blocks5 and 6.
Making the blocks
The shape of the blocks which is determinedby the above described calibration is shown infig. 4. In the middle of the spectral region (blocks5 and 6), where the sensitivity of the cell showsalmost the same variation as the sensitivity ofthe eye, the height of the blocks is practically
30406
1 2 3 4 5 6 7 8Fig. 4,. Shape of the blocks which transmit the eight wavelength divisions of the spectrum.

'10 PHILIPS TECHNICAL REVIEW Vol. 4, No. 3
constant, but in the red and blue sections the topand bottom are cut away, because in these blocksthe eye sensitivity decreases more strongly thanthe sensitivity of the cell with increasing or de-creasing wave length. The wave length boundariesof the blocks are curved because the spectral linesare also curved in the spectrograph.A tenfold enlarged drawing is made of the cal-
culated shape of the blocks. This is photographedin a tenfold reduction on a plate and from thenegative so obtained a positive copy is made on asecond plate. In the choice of the kind of plate andthe developer, fine grain and great hardness wassought. In this way the transparent region of theblock was absolutely clear: no grains could beobserved under the microscope. These prints weremounted in metal slides and are used immediatelyas diaphragms for the corresponding blocks.
Fig. 5. Formation of the image of the first slit SI on thescreen DD' (see fig. 2). The middle R of the slit is focussedon the screen with a greater intensity than the upper or lowerend (S) because a vignette effect occurs in the focussing of theends of the beam.
In order to be able to adjust the blocks accuratelyin relation to the spectrum, a small dot was madeon each block at the point where, when correctlyplaced, a known spectral line should fall (a lineof mercury or helium for example). The adjustmentcould now be checked by examining the block andthe spectrum projected upon it with a magnifyingglass. By means of a setting screw the block was-given the correct position.
In calculating the shape of the blocks the fol-lowing must be kept in mind. If it is necessary toreduce the light flux by a factor 1/2 for a certainwave length, it is not enough to decrease the heightof the slit by one half. Even though the illuminationof the first slit is absolutely uniform over its entireheight, this is not the case for the highest part ofthe spectrum. This is due to the vignette effect ofthe lenses Ll and L2 (see fig. 5). Since there is aprism between these lenses, the lenses are about8 cm apart. The whole of the cone of light whichpasses from the middle R of the slit 51 throughlens Ll also passes through L2, but the beamwhich passes through Ll from the point near theend 5 is only partially incident on L2• The resultis that the upper and lower edge of the spectrum
are more weakly illuminated than the middle.This variation in illumination is determined ex-perimentally (see fig. 6) and taken into accountin fixing the shape of the blocks.
%100
80
60
4[)
20
0-8 6 4 2 0 2 4
.W4C6
6 8 mm
Fig. 6. Variation of the intensity as a function of the heightof a spectral line when the first slit is uniformly illuminated.
Checking the photometer
It is possible to check the position of the blocksby examining the light leaving the last slit by meansof a spectroscope. Infig. 7 the spectra are reproducedwhich were obtained by photographing the spectrumof the electric lamp in the eight blocks. The eighttransmitting regions are seen to succeed each othercontinuously from 4 200 to 7 200 Á.The res ults obtained with the photometer were
checked by investigating three standardized lightsources whose spectral distributions are known.These sources of light are obtained with an electriclamp of 2840° colour temperature with differentliquid filters. Light sources are obtained in this waywhich correspond as to colour: A with an ordinarygas-filled tungsten filament lamp, B with sunlight(colour temperature 4800°) and C with averagedaylight (colour temperature 6500°).The light flux of these sources was measured
ooo"<f<
o 0 0o 0 Ol
~ :::!: ~o 0 00 ~Cl 0 = 001""""1 \0 1""""1 \0 C'\I\..I") l.I') \O\Ot-
Fig. 7. Spectrum of the light which is transmitted throughthe eight blocks of the spectrometer,
MARCH 1939 PHOTOMETER FOR COLOUR RENDERING REPRODUCTION OF LIGHTSOURCES 71
Table J.
Rclative light flux (% of the total light flux) ·radiatcd by different standard light sources in the different blocks of thespectrum,
Wave length limits of the Iblocks in Á 40ÓO 4400 7200
. I '4200
I4600
I66005100 5630 6100
Strong mercury lines inblocks 4047 4358 5461 5780
Nuniber of block 1 2 3 4 5 6 7 8
Colour violet blue' •• blue/green redgreen yellow/orange
I.Standard A
~calculated 0.005 0.06 0.25 5.4 33.5 42.7 16.6 1.54measured 0.006 0.06 0.25 5.1 34.3 42.8 16.1 1.42
Standard B' ~ calculated 0.016 0.18 0.64 9.2 39.3 38.2 116 0.91
measured 0.018 0.19 0.72 9.3 40.5 37.4 11.0 0.86
Standard C~
calculated 0.025 0.2Q_ 0.91 11.1 40.8 36.2 9.9 0.73measured 0.029 0.29 1.04 11.4 42.1 35.4 9.2 0.70
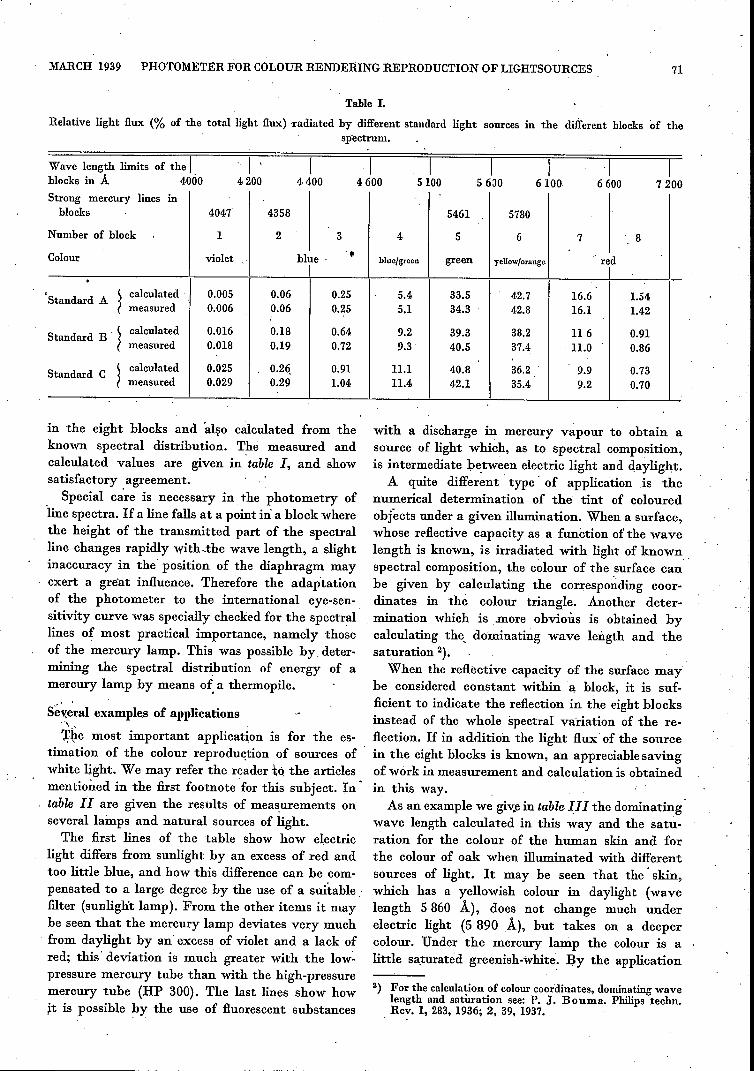
in the eight blocks and also calculated from theknown spectral distribution. The measured andcalculated values are given in table I, and showsatisfactor;y agreement.
Special care is necessary in the photometry of'line spectra. If a line falls at a point in' a block wherethe height of the transmitted part of the spectralline changes rapidly with ..the wave length, a slightinaccuracy in the position of the diaphragm mayexert a great influence. Therefore thè _adaptationof the photometer to the international eye-sen-sitivity curve was specially checked for the spectrallines of most practical importance, namely thoseof the mercury lamp. This was possible by deter-mining the spectral distribution of energy of amercury lamp by means of. a thermopile.
Sé~~ral examples of applications\"'.Çl;lemost important application is for the es-
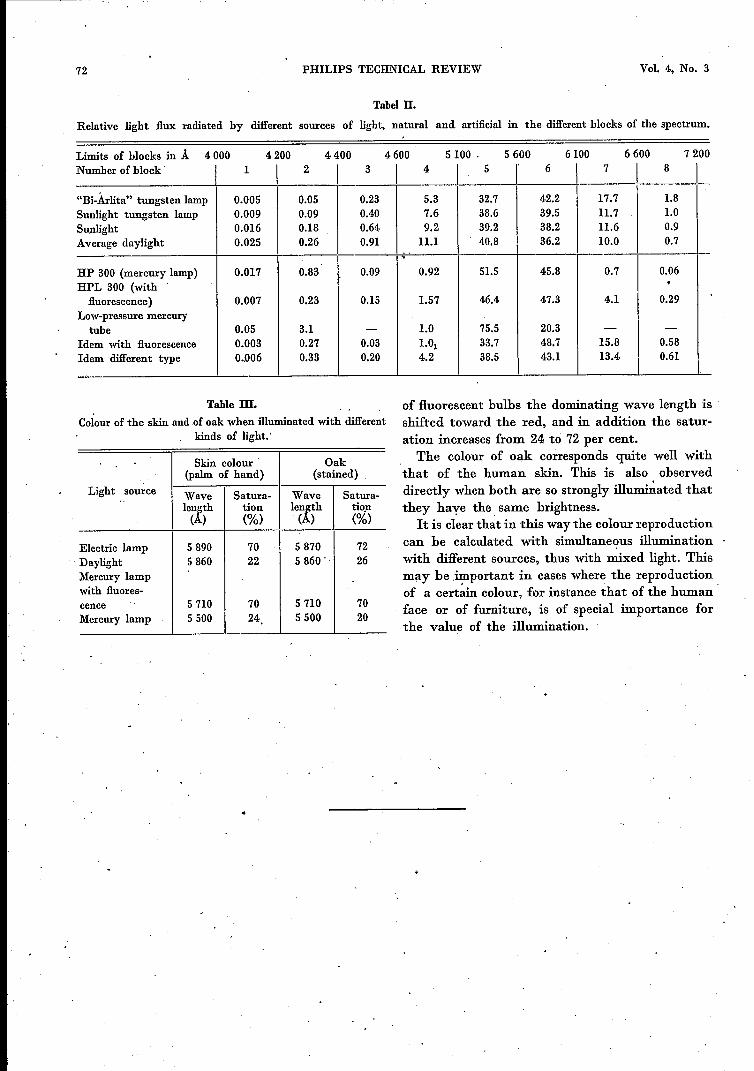
timation of the colour reproduetion of sources ofwhite light. We may refer the reader 1;Q the articlesmentioned in the first footnote for this subject. In .table II are given the results of measurements onseveral lamps and natural sources of light.The first lines of the table show how electric
light differs from sunlight by an excess of red andtoo little blue, and how this difference can be com-pensated to a large degree by the use of a sui1:able_.filter (sunlight lamp). From the other items it maybe seen that the mercury lamp deviates very muehfrom daylight by an excess of violet and a lack ofred; this' deviation is much greater with the low~pressure mercury tube than with the high-pressuremercury tube (HP 300). The last lines show how~t is possible by the use of fluorescent substances
with a discharge in mercury vapour to obtain asource of light which, as to spectral composition,is intermediate hetween electric light and daylight.
A quite different' type' of application .is thenumerical determination of the tint of colouredobjects under a given illumination. When a surface,whose reflective capacity as a function of the wavelength is known, is irradiated with light of known,spectral composition, the colour of the surface canbe given by calculating the corresponding coor-dinates in the colour triangle. Another deter-mination which is .more obvious is obtained bycalculating the, dominating wave length and thesaturation 2).
When the reflective capacity of the surface maybe considered constant within a block, it is suf-ficient to indicate the reflection in the eight blocksinstead of the whole spectral variation of the re-flection. If in addition the light flux' of the sourcein the eight blocks is known, an appreciable savingof work in measurement and calculatión is obtainedin this way.
As an example we giv.ein table III the dominatingwave length calculated in this way and the satu-ration for the colour of the human skin and forthe colour of oak when illuminated with differentsources of light. It may be seen that the - skin,which has a yellowish colour in daylight (wavelength 5860 Á), does not change much underelectric light (5890 Á), but takes on a deepercolour. Under the mercury lamp the colour is alittle saturated greenish-white: By the application
2) For the calculation of colour coordinates, dominating wavelength and saturation see: P. J. Bouma. Philips techn,Rev. 1, 283, 1936; 2, 39, 1937.
72 PHILIPS TECHNICAL REVIEW Vol. 4, No. 3
Tabel n.
Limits of blocks in A 4 000 4200 4400
Relative light flux radiated by different sources of light, natural and. artificial in the different blocks of the spectrum.
4600 5100 . 5600 6600 72006100Number of block I 1 I 2 I 3 I 4 5 r 6 7 I 8 I"Bi-Árlita" tungsten lamp 0.005 0.05 0.23 5.3 32.7 42.2 17.7 1.8Sunlight tungsten lamp 0.009 0.09 0.40 7.6 38.6 39.5 11.7 1.0Sunlight 0.016 0.18 0.64 9.2 39.2 38.2 11.6 0.9Average daylight 0.025 0.26 0.91 11.1 40.8 36.2 10.0 0.7
,
HP 300 (mercury lamp) 0.017 0.83 0.09 0.92 51.5 45.8 0.7 0.06HPL 300 (with .fluorescence) 0.007 0.23 0.15 1.57 46.4 47.3 4.1 0.29
,
Low-pressure mercurytube 0.05 3.1 - 1.0 75.5 20.3 - -
Idem with fluorescence 0.003 0.27 0.03 1.01 33.7 48.7 15.8 0.58Idem different type 0..006 0.33 0.20 4.2 38.5 43.1 13.4 0.61
Table m.Colour of the skin and .of oak when illuminated with different
kinds of light.'
Skin colour Oak(palm of hand) (stained)
Light source Wave Satura- Wave Satura-..leïth tion lenth tion() (%) ( ) (%)
Electric lamp 5890 70 5870 72Daylight 5860 22 5860 . 26Mercury lampwith fluores-cence 5710 70 5710 70Mercury lamp 5500 24 5500 20
of fluorescent bulbs the dominating wave length isshifted toward the red. and in addition the satur-ation increases from 24 to 72 per cent.The colour of oak corresponds quite well with
that of the human skin. This is also observeddirectly when both are so strongly illumi~ated thatthey haye the same brightness.
It is clear that in this way the colour reproduetioncan be calculated with simultaneous illuminationwith different sources. thus with mixed light. Thismay he .important in cases where the reproductionof a certain colour, for instance that of the human -face or of furniture. is of special importance forthe value of the illumination.


![Ouders in de sport - WOC Alphen aan den Rijn · • Atletiek & Volleybal • Jongens & meisjes ... Microsoft PowerPoint - 2009 WOC Alphen ad Rijn 24 juni ouders.ppt [Compatibiliteitsmodus]](https://static.fdocuments.in/doc/165x107/5c75357109d3f2ba1a8c6952/ouders-in-de-sport-woc-alphen-aan-den-atletiek-volleybal-jongens.jpg)