A Phonetic Distance Approach to Intelligibility between ...
81
San Jose State University San Jose State University SJSU ScholarWorks SJSU ScholarWorks Master's Theses Master's Theses and Graduate Research Summer 2019 A Phonetic Distance Approach to Intelligibility between Mam A Phonetic Distance Approach to Intelligibility between Mam Regional Dialects Regional Dialects Megan Simon San Jose State University Follow this and additional works at: https://scholarworks.sjsu.edu/etd_theses Recommended Citation Recommended Citation Simon, Megan, "A Phonetic Distance Approach to Intelligibility between Mam Regional Dialects" (2019). Master's Theses. 5045. DOI: https://doi.org/10.31979/etd.pmmr-jvs6 https://scholarworks.sjsu.edu/etd_theses/5045 This Thesis is brought to you for free and open access by the Master's Theses and Graduate Research at SJSU ScholarWorks. It has been accepted for inclusion in Master's Theses by an authorized administrator of SJSU ScholarWorks. For more information, please contact [email protected].
Transcript of A Phonetic Distance Approach to Intelligibility between ...
San Jose State University San Jose State University
SJSU ScholarWorks SJSU ScholarWorks
Master's Theses Master's Theses and Graduate Research
Summer 2019
A Phonetic Distance Approach to Intelligibility between Mam A Phonetic Distance Approach to Intelligibility between Mam
Regional Dialects Regional Dialects
Megan Simon San Jose State University
Follow this and additional works at: https://scholarworks.sjsu.edu/etd_theses
Recommended Citation Recommended Citation Simon, Megan, "A Phonetic Distance Approach to Intelligibility between Mam Regional Dialects" (2019). Master's Theses. 5045. DOI: https://doi.org/10.31979/etd.pmmr-jvs6 https://scholarworks.sjsu.edu/etd_theses/5045
This Thesis is brought to you for free and open access by the Master's Theses and Graduate Research at SJSU ScholarWorks. It has been accepted for inclusion in Master's Theses by an authorized administrator of SJSU ScholarWorks. For more information, please contact [email protected].
A PHONETIC DISTANCE APPROACH TO INTELLIGIBILITY BETWEEN MAM REGIONAL DIALECTS
A Thesis
Presented to
The Faculty of the Department of Linguistics and Language Development
San José State University
In Partial Fulfillment
of the Requirements for the Degree
Master of Arts
By
Megan Simon
August 2019

© 2019
Megan Simon
ALL RIGHTS RESERVED

The Designated Thesis Committee Approves the Thesis Titled
A PHONETIC DISTANCE APPROACH TO INTELLIGIBILITY BETWEEN MAM REGIONAL DIALECTS
by
Megan Simon
APPROVED FOR THE DEPARTMENT OF LINGUISTICS AND LANGUAGE DEVELOPMENT
SAN JOSÉ STATE UNIVERSITY
August 2019
Hahn Koo, Ph.D.
Department of Linguistics and Language Development
Chris Donlay, Ph.D.
Department of Linguistics and Language Development
Julia Swan, Ph.D. Department of Linguistics and Language Development

ABSTRACT
A PHONETIC DISTANCE APPROACH TO INTELLIGIBILITY BETWEEN MAM REGIONAL DIALECTS
by Megan Simon
Mam, an indigenous Mayan language spoken primarily in Guatemala, has
considerable internal diversity among its regional dialects. The purpose of this thesis is
to estimate their varying degrees of intelligibility and to present groups of dialects
whose speakers can be reasonably expected to understand one another. The analysis
consists of two parts, the computation of a phonetic distance network and a series of
sociocultural interviews. Phonetic distance was measured by Levenshtein distance
between cognates in word lists and analyzed with a Neighbor-Net network. Interviews
with Mam speakers focused on subjective judgments of intelligibility, contact, and
social attitudes. Four main dialect groups were found: Western, Southern, Todos Santos,
and Seleguá. Intelligibility is projected to be high within groups and reduced across
groups. With the recent wave of immigration from Guatemala to the United States,
many monolingual speakers of Mam are interacting with US court, school, and hospital
systems by way of an interpreter, but interpreters and clients from different regions do
not always understand one another well. Dialect groupings based on intelligibility can
inform the interpreter matching process, especially in high-stakes and time-sensitive
environments such as the court system.

v
TABLE OF CONTENTS
List of Tables .......................................................................................................... List of Figures ........................................................................................................ List of Abbreviations .............................................................................................. 1. Introduction ........................................................................................................ 2. Intelligibility studies ...........................................................................................
2.1. Factors affecting intelligibility .................................................................. 2.2. Definitions of dialect ................................................................................. 2.3. Test and survey-based approaches to measuring intelligibility................. 2.4. Statistical and computational predictors of intelligibility.......................... 2.5. Representing distances visually.................................................................
3. Research on Mam ............................................................................................... 3.1. Typological profile .................................................................................... 3.2. Dialectal variation......................................................................................
4. Phonetic distance analysis ..................................................................................
4.1. Methods ..................................................................................................... 4.2. Data preparation ........................................................................................ 4.3. Calculation of the phonetic distance matrix ............................................. 4.4. Clustering dialects ..................................................................................... 4.5. Contextualizing distances and clusters .....................................................
5. Sociocultural Interviews ..................................................................................... 5.1. Methods ..................................................................................................... 5.2. Participants ................................................................................................ 5.3. Patterns of intra- and inter-regional contact ............................................. 5.4. Perceptions of dialectal differences .......................................................... 5.5. Positive attitudes and solidarity within the Mam community .................. 5.6. Dialectal differences in interpretation settings in the United States ........
6. Discussion ........................................................................................................... 6.1. Summary .................................................................................................... 6.2. Use of Levenshtein distance in dialectology ............................................ 6.3. Recommendations for Mam interpreters in the United States .................
7. Conclusion ......................................................................................................... References .............................................................................................................. Appendices ............................................................................................................. Appendix A. Phonetic distance matrix ............................................................. Appendix B. Number of cognate pairs compared in each distance score ....... Appendix C. Matrix of Cronbach alpha values ............................................... Appendix D. Sociocultural interview questions and audio clip prompts ........
vii
viii
ix
1
6 6 9 9
11 18
19 19 21
26 26 27 31 33 40
45 46 47 48 51 52 55
57 57 59 61
62
64
68 68 69 70 71
vi
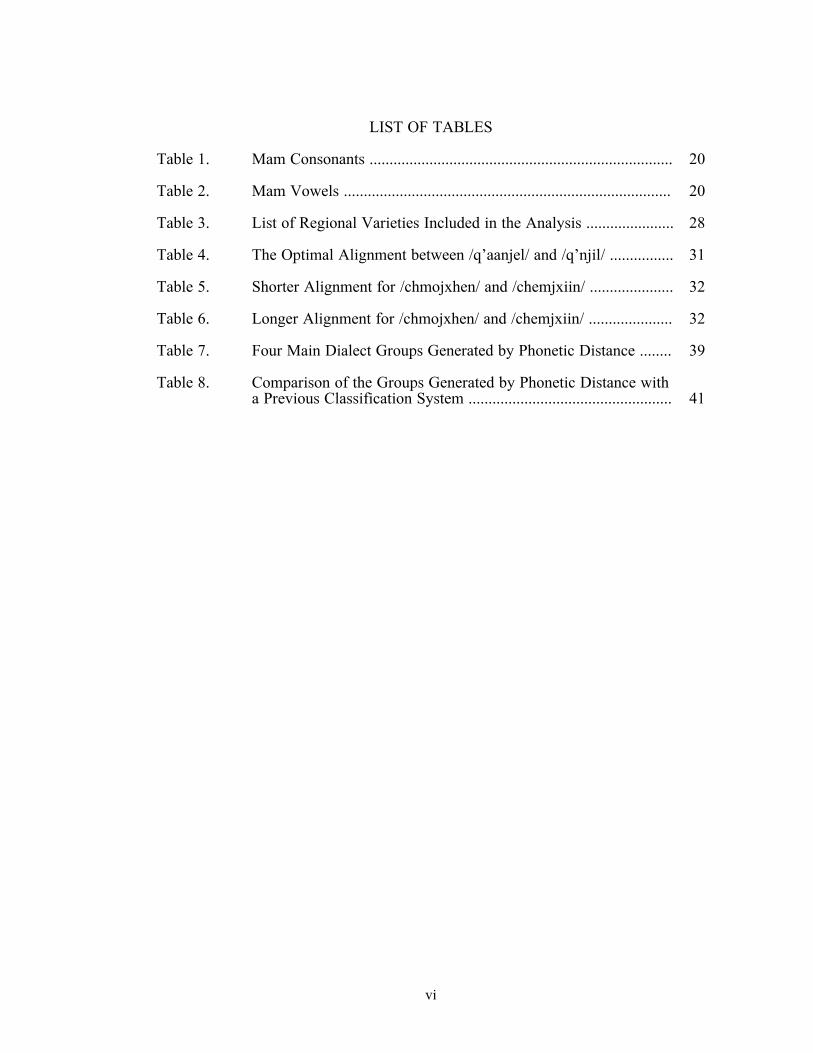
LIST OF TABLES
Table 1. Table 2. Table 3. Table 4. Table 5. Table 6. Table 7. Table 8.
Mam Consonants ............................................................................ Mam Vowels .................................................................................. List of Regional Varieties Included in the Analysis ...................... The Optimal Alignment between /q’aanjel/ and /q’njil/ ................ Shorter Alignment for /chmojxhen/ and /chemjxiin/ ..................... Longer Alignment for /chmojxhen/ and /chemjxiin/ ..................... Four Main Dialect Groups Generated by Phonetic Distance ........ Comparison of the Groups Generated by Phonetic Distance with a Previous Classification System ...................................................
20
20
28
31
32
32
39
41

vii
LIST OF FIGURES
Figure 1. Figure 2. Figure 3. Figure 4. .
Map of included municipalities in western Guatemala..................... Distance matrices and Neighbor-Nets for two subsets of the data .. Neighbor-Net diagram of the phonetic distances between all varieties .............................................................................................. Two bootstrapped trials of the phonetic distance network ...............
29
34 36
38
viii
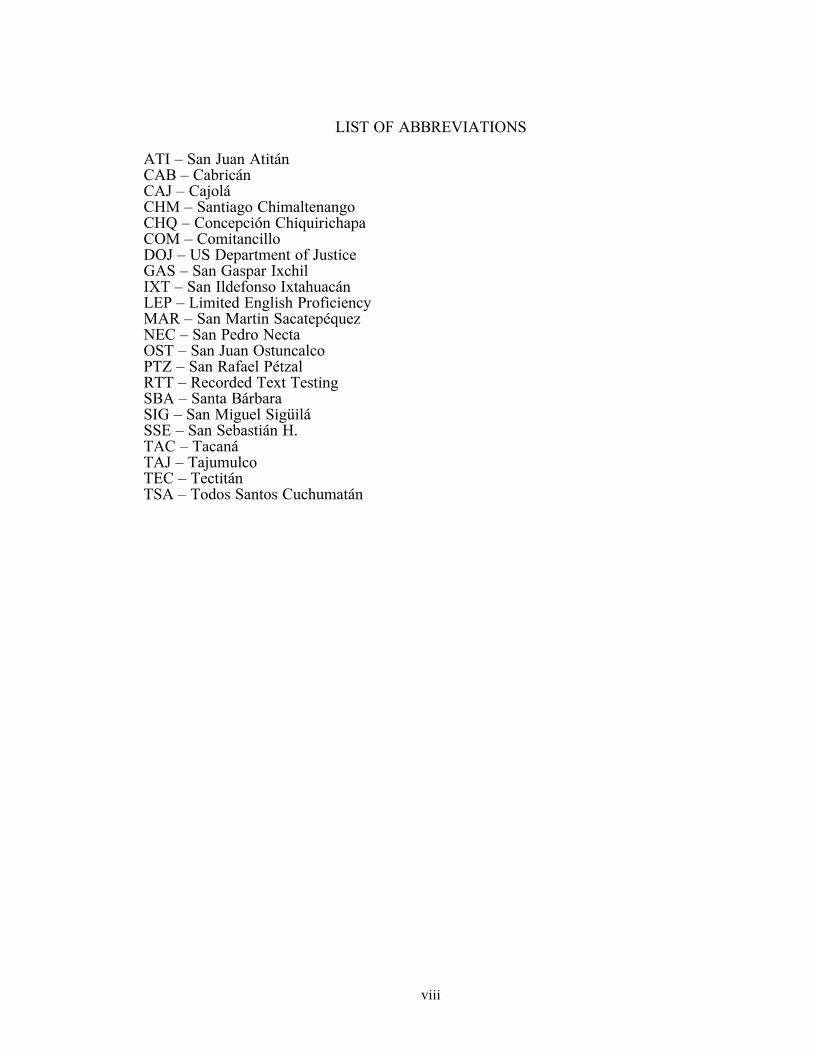
LIST OF ABBREVIATIONS
ATI – San Juan Atitán CAB – Cabricán CAJ – Cajolá CHM – Santiago Chimaltenango CHQ – Concepción Chiquirichapa COM – Comitancillo DOJ – US Department of Justice GAS – San Gaspar Ixchil IXT – San Ildefonso Ixtahuacán LEP – Limited English Proficiency MAR – San Martin Sacatepéquez NEC – San Pedro Necta OST – San Juan Ostuncalco PTZ – San Rafael Pétzal RTT – Recorded Text Testing SBA – Santa Bárbara SIG – San Miguel Sigüilá SSE – San Sebastián H. TAC – Tacaná TAJ – Tajumulco TEC – Tectitán TSA – Todos Santos Cuchumatán
1
1. INTRODUCTION. In 2000, President Clinton signed Executive Order 13166, which
requires all federal agencies and agencies receiving federal assistance to develop a plan
for providing people with limited English proficiency (LEP) access to their services. All
agencies involved in the immigration system, including the Department of Homeland
Security and its sub-agencies, the Department of Justice (DOJ), and local law
enforcement agencies and courts are bound by this executive order (Gentry 2015:6). A
DOJ guidance document recommends that agencies investigate which languages are
likely to be encountered in the region that they serve, using census, school system, local
and state government, and community organization data to do so. For frequently
encountered languages, an agency may need to hire bilingual staff or in-house
interpreters. For rarer languages, an agency’s plan may be as simple as identifying over-
the-phone interpretation services that they are prepared to use (DOJ 2002:41461).
There are a number of challenges in implementing Executive Order 13166, in
particular regarding fair access for speakers of indigenous languages and other small
language communities. The most easily accessible census data on language use are
aggregated into 42 language categories, under which all Central and South American
indigenous languages are classified as ‘other’ (US Census Bureau 2018). Even the most
detailed level of analysis, which includes 380 language varieties, does not distinguish
between individual languages in the Mayan family (US Census Bureau 2015).
When data and scholarship are available, agencies can develop detailed language
access plans that reflect the needs of diverse communities. For example, a 2010
information document prepared by the Administrative Office of the New Jersey Courts
lays out guidelines and requirements for becoming an Arabic court interpreter, with an
informed and nuanced understanding of the linguistic landscape in mind (Lee, Bergman,
& Ismail 2010). It outlines the diglossic nature of Arabic, requiring that prospective

2
interpreters be fluent in both Modern Standard Arabic and a colloquial variety, and
acknowledges that the linguistic differences between colloquial varieties are
considerable and should not be assumed to be mutually intelligible. The guidelines
include a table dividing Arabic varieties from 20 countries of origin into four dialect
groupings, which are used to certify interpreters and match them with clients
appropriately. They also include the following caveat:
The New Jersey Judiciary has invested considerable effort since April 1995 to understand the special needs of Arabic speakers and the linguistic diversity of the Arabic-speaking world so it can develop appropriate approaches for providing equal access to its courts for Arabic speakers who have limited English proficiency. These efforts are based on the expert advice of scholarly linguists and practicing interpreters. The fact that Ethnologue, a preeminent authority on the world’s languages, identifies some 40 major varieties of Arabic illustrates the nature of the problem. It is simply not possible to develop court interpreter certification exams in 40 varieties of Arabic or to attempt to match every person needing Arabic interpreting services with an Arabic interpreter from the exact same dialect group. (Lee, Bergman, & Ismail 2010:4)
These guidelines, co-authored by two court interpreters and an Arabic linguist, balance
the challenges of adapting to linguistic diversity with the constraints of finding qualified
people to provide services. However, the extent of linguistic scholarship available for
forming such a recommendation is not widespread across languages; research on dialect
clustering and mutual intelligibility is not currently available for many minority
indigenous languages. Such an analysis could inform individual language access plans
for agencies, in particular those related to the immigration and court systems, and help
them fulfill their legal responsibility to ensure ‘meaningful access by LEP persons to
critical services’ without imposing ‘undue burdens’ (DOJ 2002:41459).
This investigation focuses on the Mayan language Mam. There is a growing
population of Mam speakers in the United States, in particular in Alameda County,
California, as many people are fleeing violence, poverty, and discrimination in
Guatemala. Exact numbers are not available, but The Mercury News and Los Angeles

3
Times both report a quickly growing community, where Mam can now be heard
regularly in markets, churches, and schools (Carcamo 2016, Sanchez 2018). This rapid
growth is reflected in data from the DOJ; in 2013, Mam was not included in the list of
the top 25 languages for immigration court cases, but by 2015, it was ranked ninth (US
DOJ Executive Office for Immigration Review 2017).
Awareness of Mam and other indigenous languages of Latin America in the US
judicial system is limited but growing. According to The Mercury News, just a few
years ago Alameda County court interpreter Naomi Adelson had to educate county staff
on the need for Mam interpreters—not Spanish interpreters—for Mam speakers,
dispelling the persistent myth that Mam was a local variant of Spanish instead of a
completely unrelated language. Now that there is a stronger presence of Mam speakers
in the community and a larger pool of interpreters who work with the courts, she does
not need to have that conversation anymore (Sanchez 2018). However, awareness that
the language exists is still only a first step. The linguistic scholarship on Mam suggests
that speakers from different regions may have difficulty understanding one another, and
that perhaps a Mam interpreter who is from a different region than the client would not
have the language skills to be qualified to interpret for him or her.
Nora England, in the introduction to her grammar on Mam, notes that despite being
spoken in a relatively small geographic region, there is ‘considerable variation within ...
dialects. Intelligibility between the principal dialect divisions is reduced, although
possible with practice’ (1983:6). In a later work, she describes Mam as ‘the Mayan
language with the greatest degree of internal diversity’ (2017:500). She attributes this
diversity to two main factors, the Mam people’s long history in the region, and isolation
between towns. The Mam people may have resided in the area since as early as 500 CE,
and many of the current towns have existed since before the colonial area.
4
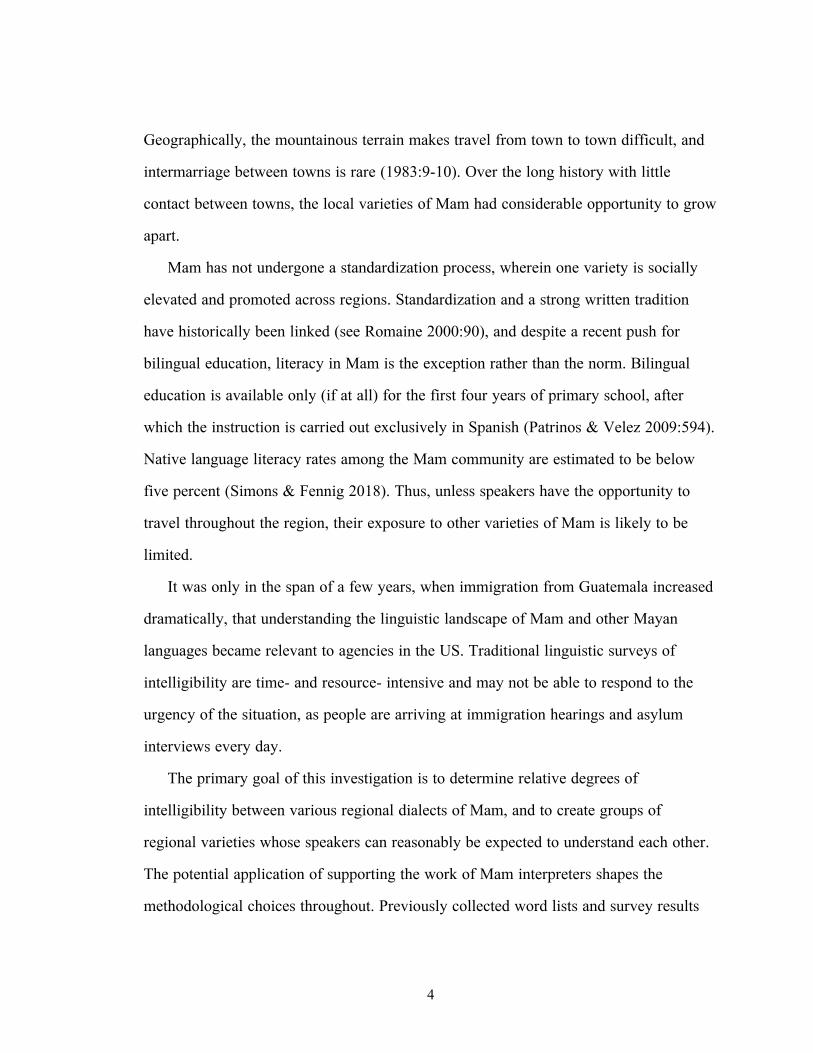
Geographically, the mountainous terrain makes travel from town to town difficult, and
intermarriage between towns is rare (1983:9-10). Over the long history with little
contact between towns, the local varieties of Mam had considerable opportunity to grow
apart.
Mam has not undergone a standardization process, wherein one variety is socially
elevated and promoted across regions. Standardization and a strong written tradition
have historically been linked (see Romaine 2000:90), and despite a recent push for
bilingual education, literacy in Mam is the exception rather than the norm. Bilingual
education is available only (if at all) for the first four years of primary school, after
which the instruction is carried out exclusively in Spanish (Patrinos & Velez 2009:594).
Native language literacy rates among the Mam community are estimated to be below
five percent (Simons & Fennig 2018). Thus, unless speakers have the opportunity to
travel throughout the region, their exposure to other varieties of Mam is likely to be
limited.
It was only in the span of a few years, when immigration from Guatemala increased
dramatically, that understanding the linguistic landscape of Mam and other Mayan
languages became relevant to agencies in the US. Traditional linguistic surveys of
intelligibility are time- and resource- intensive and may not be able to respond to the
urgency of the situation, as people are arriving at immigration hearings and asylum
interviews every day.
The primary goal of this investigation is to determine relative degrees of
intelligibility between various regional dialects of Mam, and to create groups of
regional varieties whose speakers can reasonably be expected to understand each other.
The potential application of supporting the work of Mam interpreters shapes the
methodological choices throughout. Previously collected word lists and survey results
5
are reanalyzed using a more recently developed computational method: phonetic
distance. This is less time- and resource-intensive than comprehension test-based
approaches to intelligibility studies and has been found to have a moderately strong
correlation with the results of such tests. Phonetic distance may give a less direct
estimation of intelligibility than test-based approaches, but can also be implemented
relatively quickly, allowing for more timely recommendations to interpretation services
and courts who are encountering indigenous languages for the first time. To
contextualize the findings, sociocultural interviews are conducted with Mam speakers,
many of whom confront dialectal differences in their professional capacities as teachers
and interpreters. An interview with an immigration officer in the United States is also
included, to provide a perspective from the immigration system.
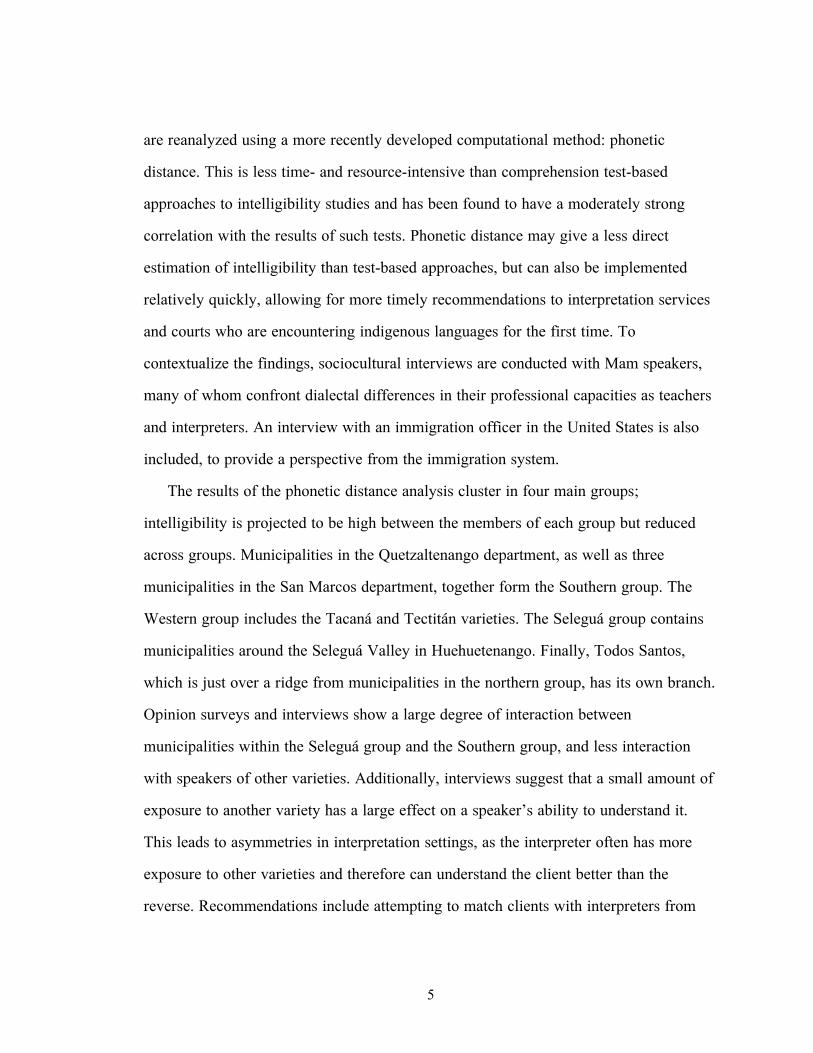
The results of the phonetic distance analysis cluster in four main groups;
intelligibility is projected to be high between the members of each group but reduced
across groups. Municipalities in the Quetzaltenango department, as well as three
municipalities in the San Marcos department, together form the Southern group. The
Western group includes the Tacaná and Tectitán varieties. The Seleguá group contains
municipalities around the Seleguá Valley in Huehuetenango. Finally, Todos Santos,
which is just over a ridge from municipalities in the northern group, has its own branch.
Opinion surveys and interviews show a large degree of interaction between
municipalities within the Seleguá group and the Southern group, and less interaction
with speakers of other varieties. Additionally, interviews suggest that a small amount of
exposure to another variety has a large effect on a speaker’s ability to understand it.
This leads to asymmetries in interpretation settings, as the interpreter often has more
exposure to other varieties and therefore can understand the client better than the
reverse. Recommendations include attempting to match clients with interpreters from

6
the same dialect group and providing training for interpreters to reproduce the speech
patterns of clients from various regions.
The rest of the thesis is organized as follows. Section 2 contains an overview of the
relevant previous research in intelligibility studies and phonetic distance algorithms.
Section 3 briefly describes the typological profile of Mam and reviews previous
investigations of dialect groups. Section 4 details the implementation of the phonetic
distance algorithm and clustering analysis using a Neighbor-Net program. The resulting
network is compared and contextualized with the results of previously published
opinion surveys. In Section 5, sociocultural interviews with Mam speakers, as well as
an immigration officer in the United States, are presented. Findings and potential
applications are discussed in Section 6.
2. INTELLIGIBILITY STUDIES. This section contains a review of the methods used in
intelligibility studies, including comprehension tests, opinion surveys, lexical similarity
measures, and phonetic distance. Section 2.1 introduces the factors, both social and
structural, that affect intelligibility, and Section 2.2 continues with a discussion of how
the term ‘dialect’ is used in this context. Test- and survey-based methods for measuring
intelligibility between regional dialects are discussed in Section 2.3. Section 2.4 traces
the development of using the Levenshtein distance algorithm to quantify the distance
between language varieties, and its usefulness in predicting both diachronic
relationships and synchronic intelligibility. Finally, Section 2.5 discusses the use of a
network diagram to represent distances visually.
2.1. FACTORS AFFECTING INTELLIGIBILITY. Intelligibility, or the degree to which
speakers of one language variety can comprehend speakers of another, is a notoriously
difficult concept to measure and quantify. It is influenced by differences in the structure
of the language varieties themselves, such as the phonology, lexicon, and syntax, as

7
well as the degree of exposure and social attitudes between speakers of different
varieties. Intelligibility is not symmetric. Structurally, one variety may be able to use
cognates to understand a word in another variety, but the reverse need not be true. For
example, Swedish has the words förvånade and förbluffade to express ‘surprised’.
Danish has a cognate with the latter example: forbløffede. If a Danish speaker uses
forbløffede, a Swedish speaker would be able to use their cognate to understand the
meaning, but a Danish speaker hearing the Swedish word förvånade has no helpful
cognates and therefore is unlikely to understand it (Gooskens 2006:109). The level of
exposure that speakers of one variety have to another is also often asymmetric. To
continue with the example of the Scandinavian countries, Danes and Norwegians visit
Sweden with more frequency than Swedes visit Denmark and Norway, and over four
times as many Danes and Norwegians listen to Swedish radio than Swedes listen to
Norwegian or Danish radio (Romaine 2000:13). Sweden is the largest and wealthiest
country of the three, and the other countries make more accommodations to understand
Swedish than Swedes do to understand speakers from other countries (Gooskens
2006:109).
Degree of exposure to a regional variety has been shown experimentally to have an
effect on speech processing. In a study on French regional accents, Floccia et al. find a
significant increase in reaction time for a word identification task when a participant is
presented with a sentence spoken in an unfamiliar regional accent, as opposed to his or
her home accent or an otherwise familiar one (2006:1280). Sumner and Samuel (2009)
find that a participant’s exposure to an r-dropping New York City dialect, independent
of the participant’s own production patterns, has an effect on a lexical priming task.
Both studies conclude that a lack of familiarity with a variety leads to a higher speech
processing cost.

8
Social hierarchies also affect intelligibility. As summarized by Simons: ‘If the social
situation is favorable, contact and learning will lead to a boost in intelligibility. If the
social situation is not favorable, it will tend to limit intelligibility’ (1979:62). In
particular, a listener’s attitude is biased by factors such as race, ethnicity, and social
status (Rickford & King 2016:976). For example, Rubin found that American
undergraduates rated a four minute audio sample as harder to comprehend when paired
with video of an Asian speaker than when paired with video of a Caucasian speaker
(1992:518). This effect has been studied in regard to the justice system previously.
Matsuda (1991) discusses the accent discrimination case Fragante v. City and County of
Honolulu, in which Filipino-American Manuel Fragante sued the city for employment
discrimination after the DMV denied him a clerk job because his accent was difficult to
understand. A linguist testified at the trial:
There is a history, in Hawaii and elsewhere, of prejudice against this accent … that will cause some listeners to ‘turn off’ and not comprehend it. The degree of phonological—or sound-deviation in Fragante’s speech was not, however, so far afield from other accents of English-speakers in Hawaii that he would not be understood. (1991:1337)
The testimony and the fact that Fragante lost his case on several appeals demonstrate
how social prejudice can supersede structural distance between varieties.
2.2. DEFINITIONS OF DIALECT. Linguists conducting fieldwork have attempted to
construct objective tests to measure intelligibility between varieties in order to classify
languages and dialects. When varieties are not mutually intelligible, they are classified
as separate languages; closer subgroupings are classified as dialects (Simons 1979:5). In
practice, popular definitions of language and dialect have as much to do with political
boundaries as they do linguistic similarity. Swedish, Danish, and Norwegian are
considered separate languages rather than related dialects in large part because of their
separate national identities. Many non-mutually intelligible varieties in China are often

9
considered the same language because of their shared writing system (Romaine
2000:13). As described by Romaine, ‘Any variety is part of a continuum in social and
geographical space and time. The discontinuities that do occur, however, often reflect
geographical and social boundaries and weaknesses in communication networks’
(2000:2). In Simons’ investigation of mutual intelligibility measures on language
varieties in the Solomon Islands, he defines dialect as a ‘group of similar idiolects’ and
states that although social dialects do of course exist, he is focusing on regional or
community dialects: ‘the local community actually serves as the minimal unit in
defining the dialects considered in this thesis. That is, dialect refers to the variety of
speech common to a local community or a more inclusive grouping of communities’
(1979:3). I adopt his definitions here, as they match the scope of my investigation well.
2.3. TEST AND SURVEY-BASED APPROACHES TO MEASURING INTELLIGIBILITY. A
systematic method for measuring mutual intelligibility of regional dialects was first laid
out by Voegelin and Harris in 1951. In this method, a speaker from Community A
records a text, the linguist breaks it into small segments, and another speaker from the
same community does an ‘interpreter translation’ of each segment into a common or
trade language. The recording is then played for speakers in Community B, who also
provide translations of the individual segments. The linguist then compares the
translation of A’s text from A and B, and judges how many aspects of the text B did not
capture. The procedure can be repeated for any number of dialect pairs. Such
comprehension tests have since been refined and widely used to measure intelligibility.
Casad (1974) lays out a variation on this procedure for language surveys; the major
change is that comprehension is measured by scoring a series of comprehension
questions about the text, rather than evaluating the quality of a translation, because the
previous method was criticized for being just as sensitive to a listener’s ability to
10
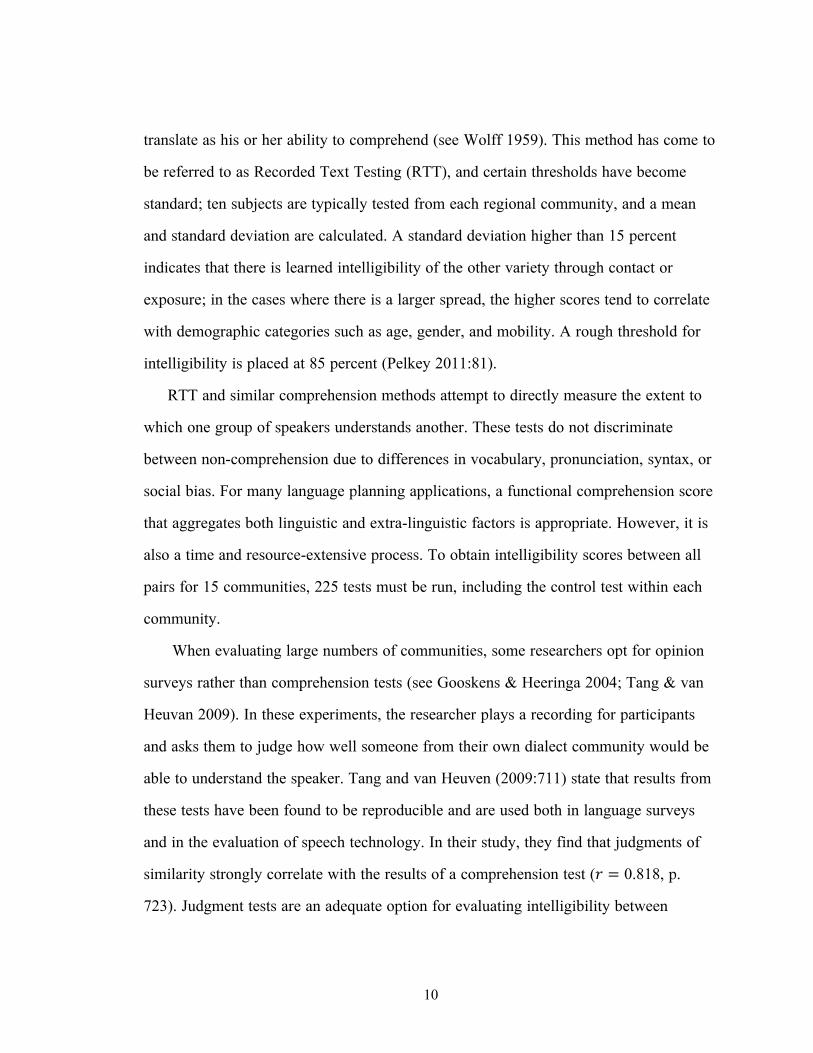
translate as his or her ability to comprehend (see Wolff 1959). This method has come to
be referred to as Recorded Text Testing (RTT), and certain thresholds have become
standard; ten subjects are typically tested from each regional community, and a mean
and standard deviation are calculated. A standard deviation higher than 15 percent
indicates that there is learned intelligibility of the other variety through contact or
exposure; in the cases where there is a larger spread, the higher scores tend to correlate
with demographic categories such as age, gender, and mobility. A rough threshold for
intelligibility is placed at 85 percent (Pelkey 2011:81).
RTT and similar comprehension methods attempt to directly measure the extent to
which one group of speakers understands another. These tests do not discriminate
between non-comprehension due to differences in vocabulary, pronunciation, syntax, or
social bias. For many language planning applications, a functional comprehension score
that aggregates both linguistic and extra-linguistic factors is appropriate. However, it is
also a time and resource-extensive process. To obtain intelligibility scores between all
pairs for 15 communities, 225 tests must be run, including the control test within each
community.
When evaluating large numbers of communities, some researchers opt for opinion
surveys rather than comprehension tests (see Gooskens & Heeringa 2004; Tang & van
Heuvan 2009). In these experiments, the researcher plays a recording for participants
and asks them to judge how well someone from their own dialect community would be
able to understand the speaker. Tang and van Heuven (2009:711) state that results from
these tests have been found to be reproducible and are used both in language surveys
and in the evaluation of speech technology. In their study, they find that judgments of
similarity strongly correlate with the results of a comprehension test (𝑟 = 0.818, p.
723). Judgment tests are an adequate option for evaluating intelligibility between

11
language variants, but still require extensive perceptual experiments with large numbers
of participants.
2.4. STATISTICAL AND COMPUTATIONAL PREDICTORS OF INTELLIGIBILITY.
Dialectologists have therefore looked to predict intelligibility using more convenient
proxies. Chief among these is a measure of lexical similarity, or a ratio of cognates to
non-cognates in a word list. Swadesh (1952) introduced the idea of comparing core
vocabulary lists of language varieties and using the number of shared items as a metric
of distance, drawing conclusions about historical relationships. Lexical similarity has
also been seen as a promising method for predicting intelligibility. Simons (1979:78)
compiles field studies from unrelated language groups correlating lexical similarity and
comprehension tests and concludes that the former can explain 65 percent of the
variation in the latter. However, Grimes (1992:32) finds only a weak correlation in a
study of dialect pairs in the Philippines, and after a re-analysis of Simons’ data,
recommends simply that if lexical similarity is below 60 percent, intelligibility is
unlikely.
Meanwhile, dialectologists have continued developing computational methods for
measuring distance between dialects, hoping to make the tedious process of determining
phylogenetic relationships easier and more efficient. Traditional methods involve
mapping isoglosses, which are defined as ‘the boundary of any linguistic feature or set
of features which separate one speech variety from another’ (Romaine 2000:136).
Isoglosses can be linguistic features at any level, for example, different lexemes to
represent a concept or different pronunciations of a particular word. Hundreds or
thousands of isoglosses are mapped, and where multiple isogloss boundaries overlap, a
dialect region can be defined (Heeringa 2004:10). However, isogloss boundaries are
rarely so tidy. As Kessler (1995:60) describes:

12
At best, isoglosses for different features approach each other, forming vague bundles; at worst, isoglosses may cut across each other, describing completely contradictory binary divisions of the dialect area. That is, language may vary geographically in many dimensions, but the requirements we usually impose require that a specific site be placed in a unique dialect. Traditional dialectological methodology gives little guidance as to how to perform such reduction to one dimension.
Additionally, dialect continua pose a significant problem for this type of analysis; each
adjacent pair of villages may be very similar in their linguistic features, and the choice
for where to split up the continua in dialects becomes largely arbitrary (Kessler
1995:60).
Kessler was the first to propose the use of a string edit distance algorithm on a
phonetic transcription in the field of dialectology. He considers it a way to ‘build
accurate distance matrices that minimize editorial decisions without discarding relevant
data’ (1995:61). He uses Irish Gaelic as a test case, basing his analysis on a dataset of
51 words transcribed in 86 sites in 1956, collected as part of the Linguistic Atlas and
Survey of Irish Dialects.
Kessler implements two versions of the Levenshtein distance algorithm. Levenshtein
distance is the minimal edit cost of transforming one string into another, using only
insertions, deletions, and substitutions, each of which have an associated cost. The
simplest version of this, which Kessler terms ‘phone string comparison’, gives each edit
an equal cost of one, and the edits are summed to give a total score to the pair of words.
For example, two variants of eallaigh ‘cattle’ in Irish Gaelic are [AL:i] and [aLi]. These
have a cost of two, one for the substitution of [a] for [A] and the other for the
substitution of [L] for [L:]. Recognizing that some phoneme substitutions are more
dramatic than others, and that the previous algorithm assigns the same cost for replacing
a [t] with a slightly more palatalized [t] as an [e], he runs another version of the
algorithm that breaks each phone into a bundle of twelve features, such as place,
13
rounding, and stricture, and assigns ordinal values to the features on a scale from 0 to 1.
For example, place has a value of 0 for glottal, 1 for bilabial, 0.5 for palatal, et cetera.
Instead of assigning all substitutions a cost of 1, he assigns them the difference between
the feature values of the two phones, averaged across the twelve features. He terms this
method feature string comparison. Under both methods, the scores for each of the
individual word-pairs are averaged, resulting in one distance score for the pair of
dialects. Using a bottom-up clustering method, he then converts his distance matrix into
a tree structure.
Kessler calculates the correlations between both versions of the Levenshtein
distance algorithm and the results of a traditional isogloss method and determines that
the phone string method has more predictive power (𝑟 = 0.95, p. 63). He attributes the
lack of success of the feature-based model to the arbitrariness with which the distance
between phones was determined; under his system, [s] was closer to [g] than to [h], but
[s] to [h] is a commonly attested sound change. He proposes that feature system could
be made more scientific, but in the meantime declares that simple phone string
comparison does quite well. Comparing the Levenshtein distance results to a lexical
similarity approach, etymon identity, he writes:
That phonetic comparison is more precise is not particularly surprising, since etymon identity ignores a wealth of phonetic, phonological, and morphological data, whereas comparing phones has the side effect of also counting higher-level variation: if words differ in morphemes, their phonetic difference is going to be high. (1995:66)
The trees created by his method match established tree relations well on the top levels,
but differ on the more granular levels, which he attributes to the small dataset he uses:
less than 60 words per dialect. Regardless, the isogloss approach to identifying dialect
boundaries is quite a manual and intensive process, and the success of a relatively
14
simple dynamic programming algorithm in achieving very similar results was an
exciting development.
In his widely cited dissertation, Wilbert Heeringa (2004) refines, validates, and
applies the Levenshtein distance algorithm to data from Norwegian and Dutch dialects.
He tries a simple phone based representation, as well as three systems for weighting
costs based on phonetic features. He also tries using acoustic representations, spectra,
and formant bundles as input for the algorithm. The acoustic representations are based
on only two speakers, and he concludes that ‘the use of acoustic representations is
useful, but recommend future work to verify the conclusion on the basis of more
speakers, and if necessary to refine the acoustic processing’ (280). Using a subjective
dialect distance judgment experiment to validate the new methodology, he concludes
that among transcription-based methods, the best results come from using either simple
phones or acoustic representations with logarithmic Levenshtein distance. He speculates
that these two methods ‘share the property that small segment distances are relatively
heavily weighted, which is perhaps also the case in perception’ (281).
Heeringa also discusses a length normalization function, which is important so that
longer words are not given higher edit costs than shorter words. He proposes that the
cost be divided by the length of the alignment. This has the effect of favoring longer
alignments when there are multiple possible options with the same edit cost. Longer
alignments tend to have more exact matches, which he posits is consistent with human
intuition in the comparison of two strings (2004:130-131).
Heeringa et al. (2006) also evaluate various versions of string edit algorithms for the
purpose of determining dialect distances. They evaluate algorithms with no linear
sensitivity (i.e. ratio of shared segments to all segments) versus the Levenshtein distance
algorithm, normalizing by length or not, using n-grams as input, requiring that vowels

15
align with vowels and consonants align with consonants, and weighting n-gram
alignments by degree of match. They apply these to Norwegian and German datasets,
with 58 words in 15 dialects for Norwegian and 201 words in 186 dialects for German.
They compare their results to the results of a perceived dialect distance experiment done
by Gooskens on Norwegian dialects and use geographic consistency (i.e. the idea that
geographically contiguous dialects are generally more similar) for German. With the
various combinations of the components listed above, the researchers run the data
through 40 algorithms to create different distance matrices. They conclude that the
various string edit distances account for 43.6 to 53.3 percent of the variance in the
matrix created by the judgment experiment, and the correlation coefficients are all
significant (𝑝 < 0.001) but do not differ significantly from one another.
Charlotte Gooskens was the first to deploy this new dialectology method specifically
in an intelligibility study. In her 2006 paper, she builds upon an existing investigation
into mutual intelligibility between speakers in Denmark, Norway, Sweden and the
Swedish-speaking part of Finland. Participants from nine towns had listened to a news
segment translated into one of the languages and answered a series of questions about
what they heard. Intelligibility was measured by the percentage of questions answered
correctly. The results indicated that mutual intelligibility was highest between
Norwegians and Swedes, and Danish was the least intelligible to speakers in other
countries. Participants had also been asked about their attitude toward the language (e.g.
How beautiful is the language? Would you like to live in that country?) as well as the
amount of contact that they had with it.
Gooskens uses a set of this data, as well as her own adaptation of the experiment, to
see if linguistic distance is a significant explanatory factor for the comprehension
results. She has a news segment translated and read in the regional dialect of each of the
16
nine towns, and then aligns the texts and calculates the Levenshtein distance between
pairs of related words. She does not publish the number of related words that she uses
in the calculation but does note that the mean length of the news segments is 257 words.
She uses an edit cost of one for insertions, deletions, and substitutions of vowel for
consonant or the reverse. Substituting vowel for vowel or consonant for consonant is an
edit cost of 0.5, and a mismatched diacritic (e.g. length) is an extra 0.25. The sum is
divided by the length of the alignment for normalization purposes.
Gooskens also calculates the lexical similarity between the languages, looking only
at the words that the participants heard during the comprehension test. She aligns the
texts and uses the following system to calculate distance:
A non-cognate was given one point, a compound that is partly cognate was given half a point, and a cognate was given zero points. In some cases a word pair consisted of non-cognates, but still a common synonym cognate existed in the native language of the listeners which would make it possible for them to understand the word in the other language. In such cases the word pair was also given zero points, since what matters is how well the listeners would be able to understand the word. (2006:108)
Unlike Levenshtein distance, this particular linguistic similarity metric is asymmetrical,
as a cognate synonym can exist in one language but not the other.
She correlates the intelligibility scores from the original study with her own
measures of phonetic and lexical distance, as well as the measures of contact and
attitude from the original, to see which has more predictive power. The only two factors
that are significant are phonetic distance (𝑟 = -0.82) and the judgment of how beautiful
the language is (𝑟 = 0.56). She says it is unclear whether considering a language
beautiful makes it more intelligible or if understanding a language makes it more
beautiful, but asserts that phonetic similarity will influence intelligibility but
intelligibility will not influence phonetic distance. Overall, she concludes that the high
17
correlation between phonetic distance and a functional test of intelligibility validates the
Levenshtein distance-based method as a predictive tool.
Continuing on the work of Gooskens’ 2006 study, Beijering, Gooskens, and
Heeringa (2008) conduct an intelligibility study with Danish listeners and Faroese,
Swedish, Norwegian, and Danish speakers. The Levenshtein edit costs are weighted by
distances determined by spectrograms of the segments, and 58 cognate forms are
compared. The distance matrix is compared to the results of a translation-based
comprehension test, and the results have a strong negative correlation (𝑟 = -0.86). Yang
and Castro (2008) correlate phonetic distance and the results of a question-based
listening comprehension test on both Bai (Sino-Tibetan) and Hongshuihe Zhuang (Kra-
Dai). All edits have a cost of one, and 500 cognates are compared for each. The
correlation coefficients are also strongly negative (Bai: 𝑟 = -0.75, Hongshuihe Zhuang:
𝑟 = -0.72). Yang (2012) uses the same methodology on 955 cognate pairs between
dialects of the Lalo language cluster (Sino-Tibetan), and finds a correlation of 𝑟 =-0.88.
These results provide cross-linguistic evidence supporting Gooskens’ initial findings
that average Levenshtein distance of cognate pairs is a good predictor of intelligibility
between dialects.
A frequent criticism of the use of phonetic distance in dialectology is that the
method is not sensitive to whether lexical items are similar because of a shared history
or more recent shared innovations (see Campbell 2013:453). This is not an issue in
measuring intelligibility, because speakers can use all similarities—not just historically
connected ones—to understand each other. Thus, phonetic distance is more suitable as a
proxy for intelligibility than it is for mapping historical relationships between dialects.
However, there are still limitations that bear mentioning. Levenshtein distance is
symmetric and will never capture the asymmetric nature of intelligibility discussed

18
above. It ignores social factors such as degree of contact and attitudes or bias. At best, it
can estimate the theoretical advantage that a speaker of one variety has in learning
another variety due to structural elements that they share, a concept sometimes called
‘inherent intelligibility’ (Simons, 1979:86, Grimes 1992:18, Bouwer 2007:6). Because
of the pervasive influence of social factors, inherent intelligibility is never directly
isolated in the real world. However, a number of researchers have correlated phonetic
distance with functional comprehension tests in unrelated language families, and the
correlations are strong enough that the measure can be used as a predictor of real world
intelligibility (see Gooskens 2006, Beijering et al. 2008, Yang & Castro 2008, Yang
2012).
2.5. REPRESENTING DISTANCES VISUALLY. As described in Section 2.4, Levenshtein
distance returns a distance between two word forms, which when averaged with all of
the cognates in a word list, becomes a matrix of distances between dialect pairs. The
next stage in the analysis is clustering. Clustering is traditionally approached as a top-
down partitioning or bottom-up agglomerating process, resulting in a hierarchical tree
(see Kessler 1995). More recently, dialectologists and intelligibility researchers alike are
using unrooted networks, rather than trees, to more accurately display relationships
between language variants. One such option is a visualization called a Neighbor-Net,
developed by Bryant and Moulton (2004) for use in molecular biology. This performs a
cluster analysis on a distance matrix:
The [Neighbor-Net] generates splits graphs from pairwise distances between the taxa (objects under study). A split is a partition of the set of taxa into two non-empty subsets. When all possible splits are computed over a set of taxa, they can either be compatible or incompatible with one another. In the first case, there is a single way of connecting the taxa, which is a perfectly tree-like branching pattern. In the latter case, there are multiple ways of connecting the taxa, resulting locally in a network. The [Neighbor-Net] summarizes the branching parts (edges) and the local networks (boxes) in a single graphical representation. (Hamed 2005:1016)
19
Hamed uses a Neighbor-Net to cluster the results of a lexical similarity study on
Chinese variants and finds that the result is both highly consistent between different
word lists and corresponds with existing knowledge of Chinese linguistics, geography,
and demic history. Yang (2012) uses the Neighbor-Net approach as well in her work on
intelligibility within the Lalo language cluster.
McMahon et al. (2007) uses a Neighbor-Net to analyze the results of a phonetic
distance study that includes variants of German, Icelandic, and English. They criticize
the traditional tree approach for forcing the data into an incompatible shape.
The essential problem here is that relationships between varieties are multidimensional, and when such complexity is forced into two dimensions, which are all we are permitted given a binary branching tree structure with no connections between branches, then distortions may occur. (128)
The Neighbor-Net, on the other hand, can clearly display when a variant is intermediate
between many other variants—a situation where a binary tree would be forced to make
a choice of which cluster to place it in.
3. RESEARCH ON MAM. The previous section discussed methods for measuring
intelligibility that have been developed throughout the past century on a variety of
language groups. In this section, the focus shifts to the work that has been done on the
Mam language: its typology, dialectal variation, and available data. Section 3.1 provides
a brief outline of the typological background of Mam. Section 3.2 describes some of the
documented regional variation and reviews previously proposed dialect groups.
3.1. TYPOLOGICAL PROFILE. Mam is a member of the Mayan language family,
categorized under the Eastern, and further, Mamean branch. It is primarily spoken in the
Western Guatemalan highlands (England 1983:6). As of the 2003 census, there were
478,000 speakers in Guatemala, many of whom also use Spanish (Simons & Fennig
2018).

20
In terms of phonemic inventory, Mam has 27 native consonants shared by all
dialects, as well as /b d g/, which appear in Spanish loans. Additionally, there are three
apico-post-alveolar consonants /tʃ̺ ̺tʃ̺’̺ ʃ/̺ that are only contrastive in the Todos Santos
dialect. There are ten vowels: five cardinal positions with length distinctions (England
2017:501). Tables 1 and 2 list the consonants and vowels in IPA and the practical
orthography utilized by B’aayil, Jiménez, and Ajb’ee (2000:29).
TABLE 1. Mam Consonants
TABLE 2. Mam Vowels
The parallel series of plain and glottalized consonants are typical of Mayan
languages, as is the vowel inventory (Bennett 2015:2-13). Mam has a tendency to drop
short, unstressed vowels, a morphophonemic process which often results in large
consonant clusters (England 1983:21). In general terms, this is characteristic of all
dialects, but the exact rules of how stress assignment and syncope work vary between
dialects (England 2000:501-2).
Mam is a synthetic language with a rich morphological system containing both
inflectional and derivational morphemes. There are two sets of person markers that

21
cross-reference noun phrases on the verb, Set A and Set B, which follow an ergative
pattern. Verbs can also be inflected for aspect and mood, and nouns can be inflected
with Set A markers to indicate their possessors or complements (England 2017:503).
Transitive verbs are almost always accompanied by an auxiliary called a directional,
which indicates trajectory, deictic category, or aspect. There are twelve basic
directionals that are shared by all dialects (England 2017:509-10). The sentence
structure is fairly rigidly verb-initial (VAO and VS). Mam is syntactically as well as
morphologically ergative, with a complex voice system (England 1983:22-23). Split
ergativity, wherein both subject and object are cross-referenced using Set A markers, is
triggered in some circumstances (England 2017:516).
3.2. DIALECTAL VARIATION. Variation between regional dialects exists on all
linguistic levels. As mentioned above, there are three apico-post-alveolar consonants
that are only contrastive in the Todos Santos dialect. Another example of a phonological
variation is in stress assignment; stress falls on the penultimate syllable in Southern
Mam, the final syllable in Western Mam, and the last heavy syllable in Northern Mam.
In turn, these stress differences interact with various syncope rules that tend to shorten
or drop unstressed vowels (England 2017:501). Person enclitics vary from region to
region. For example, the Set A 1SG enclitic following a vowel tends to be /-ye’/ in the
south, /-∅/ in the west, and /-a/ or /-a’/ in the north and central regions (B’aayil et al.
2000:58-60). There are syntactic differences as well; an adjective typically precedes the
noun in all dialects, but in the west and north it can follow the noun if the noun is
preceded by a demonstrative or quantifier. However, in the south, an adjective that
follows a noun is interpreted as the base of a relative clause (England 2017:506-7).
Contact with bordering Mayan languages has introduced variations in both the lexicon
and syntax. Northern Mam has acquired a system of noun classifiers from the

22
Q’anjob’alan languages, which it borders, but these have not entered usage in Western
Mam (England 2017:508). In general, Northern Mam dialects have more borrowings
from Q’anjob’al, Southern Mam dialects have borrowings from K’iche’, and Western
Mam dialects have retained the most from Proto-Mam (B’aayil et al. 2000:129).
In her widely cited grammar of San Ildefonso Ixtahuacán Mam, Nora England
mentions ‘at least 15 distinct dialects which can be divided into three major divisions’
(1983:6), shown on a map as Northern, Southern, and Western Mam. These divisions
are based on the work of Terrence Kaufman (1976) in creating an orthography for
Mayan languages. She notes that the dialect of Todos Santos, while grouped with the
north, is ‘quite different from other Northern Mam dialects’ (1983:20). Her more
recently published grammar sketch mentions two central subgroups in addition to the
three aforementioned major areas, but unfortunately the analysis she cites is unpublished
(see England 2017:500). Nevertheless, she uses the three principal divisions throughout
the grammar sketch, generally giving an example from a variety from each region for
each linguistic pattern she describes.
There is one work specifically investigating intelligibility between Mam dialects,
completed by Godfrey and Collins in 1987 as part of a Summer Institute of Linguistics
(SIL) survey. Their investigation includes lexical comparisons for 53 communities,
opinion surveys from 86 communities, and a comprehension test conducted between
eight municipalities (1987:8). They conclude that although dialect boundaries are
certainly not clear-cut nor easy to define, dialects can be broken into three large groups
(Southern, Western, and Northern) or six small groups (Huehueteco, Quetzalteco,
Central, Tacaneco, Todosantero, and Tajumulteco). Within each group, they claim,
varieties can be considered mutually intelligible, depending on the context of the
conversation or text (107-112). However, as detailed below, their classifications rely

23
heavily on the lexical similarity scores, and as mentioned in Section 2.4, using lexical
similarity to predict the results of comprehension tests has had mixed results in previous
research (see Grimes 1992, Gooskens 2006).
In their particular implementation of a lexical comparison analysis, Godfrey and
Collins elicit a Swadesh list and other key vocabulary by having bilingual consultants
translate full sentences from Spanish, thus avoiding some of the ambiguity that comes
from eliciting words in isolation. From the 80 sentences, they extract a list of 294 words
and morphemes (Godfrey & Collins 1987:9-10). Word lists are compared by computer,
and only exact matches are considered matches. In order to allow their program to
capture near matches, they do the comparison with two levels of pre-processing of the
words. ‘Complete’ forms are phonological transcriptions that only disregard stress and
vowel length distinctions. ‘Reduced’ forms delete all vowels and collapse some of the
consonants. As would be expected, the overall ratio of shared forms between lists is
higher for the reduced forms than the complete forms (22). Unfortunately, they do not
publish glossed transcriptions that include vowel length, which is phonemic in Mam,
making it difficult to utilize their collection for future investigations.
Godfrey and Collins also carry out a Recorded Text Testing-style comprehension
test between all combinations of eight large municipalities throughout the Mam-
speaking region (1987:37). They use Mam texts that had been originally written as
bilingual education resources, and have representatives from each municipality translate
and record them in their own dialect. At least eight participants from each municipality
then listen to and answer questions about the recordings. The researchers judge
comprehension on two scales; they first directly ask the participant how well they
understand the recording, and then count the number of pre-specified elements captured
correctly during a structured translation task (38-51). The complete matrices of the

24
comprehension scores and lexical comparisons have only a weak positive correlation
(𝑟 = 0.34 for complete forms, 𝑟 = 0.15 for reduced forms, p. 409), and while the
researchers are able to select subsets of the data that show a stronger correlation, the
significance level is not high (e.g. 𝑟 = 0.72, 𝑝 = 0.1 for reduced form similarity
between 75 and 84 percent, p. 61). Godfrey and Collins note that the correlations are far
from perfect and only provide very rough estimates of intelligibility, but nevertheless
utilize them to draw conclusions about municipalities that are not included in the
comprehension test portion (55-56).
While there are concerns regarding the validity of the results based on the lexical
comparison, the opinion survey results have proven to be a valuable resource. Godfrey
and Collins visit 86 communities in and around the Mam-speaking region and interview
a group of native speakers in each. They are prepared with a list of all the municipalities
and regions where Mam is spoken. They first ask the participants where the ‘true’ Mam
was spoken, in an attempt to ascertain which varieties are considered more or less
prestigious. They then work through the list of communities, asking first where Mam is
spoken exactly the same or where there are only minor differences that do not impede
communication, second where Mam is very different and it is very difficult to
understand, and finally going through the remaining communities and ranking them in
descending order of how easy it is to understand someone from that community. They
do not publish the raw responses from the surveys, but use the results in combination
with census data, a geographic survey, and personal observations to write a short
description of the linguistic attitudes and patterns of contact in 55 communities
(1987:13-17). These results are also taken into account when the authors propose the six
dialect groups.
25
An extensive work by B’aayil, Jiménez, and Ajb’ee (2000) describes dialectal
variation in Mam on phonological, morphological, lexical, and syntactic levels. The
purpose of the work is to describe and document variation, so that a standard form can
be developed for wider communication between communities, as well as for the
expansion of written works and bilingual education. The authors do not attempt to
cluster the varieties into dialect groups, though they occasionally organize patterns of
linguistic features into North, West, Central, and South throughout the work (see pages
135, 234-235 for examples). The work does not include information on intelligibility
between varieties.
In the course of their research, the authors collected 26 word lists from communities
in the Mam-speaking region. These include a Swadesh list with 112 items and a ‘special
list’ with an additional 133 items, many of which are regional plant or animal names or
terms specific to Mayan culture. The words are phonemically transcribed using the
orthography listed in Tables 1 and 2 in Section 3.1. Stress is not marked, but vowel
length, which interacts with stress in Mam, is included. This is a valuable source of
data, though a few drawbacks must be noted. Firstly, the researchers do not include any
information about how the lists were elicited and transcribed, including how many
speakers were consulted in each community. Secondly, there are two municipalities,
Tacaná and Todos Santos Cuchumatán, that have three separate lists each. The authors
do not specify if the lists were collected in different communities within and around the
municipalities, or if they differ in some other way. Finally, there are gaps in the word
lists; in particular, there are several varieties that have roughly half of the words as the
other varieties. Despite these omissions, this resource is the most complete published
source of parallel word lists between communities.

26
4. PHONETIC DISTANCE ANALYSIS. This chapter details the process of calculating,
visualizing, and interpreting phonetic distances between each of the varieties. Section
4.1 begins with an outline of the methodological choices. Section 4.2 contains details
regarding data preparation, and Section 4.3 continues with the process of calculating
Levenshtein distance and measuring internal consistency with Cronbach’s alpha. Section
4.4 covers the creation of a Neighbor-Net network and the use of statistical
bootstrapping to determine confidence. Section 4.5 contextualizes the distances and
branches produced by the computational method with results of the opinion surveys
published by Godfrey and Collins (1987).
4.1. METHODS. The present work uses previously collected data, in conjunction with
updated methodological tools, to estimate intelligibility between regional varieties of
Mam. Phonemic transcriptions of word lists published in B’aayil et al. (2000) are used
as input for a Levenshtein-based phonetic distance algorithm. The simple version of the
algorithm, in which each edit has an equal cost, is chosen because Heeringa et al.
(2006) tests more complex implementations, including using more gradient phonetic
details and weighted edit costs, and does not find that those algorithms correlate to
perceived dialect distance more closely than the simple version. Following Heeringa
(2004:130-131), the raw edit cost is normalized by dividing by the length of the longest
alignment, which counteracts the tendency of longer word pairs to have more edits. The
Neighbor-Net method is used to cluster and visually represent the distances, as in
McMahon et al. (2007) and Yang (2012).
In order to contextualize the distances represented in the Neighbor-Net, the results
of the opinion surveys conducted by Godfrey and Collins (1987) are incorporated into
the analysis. This allows for an interpretation of the network in terms of which towns
and regions Mam speakers consider to be exactly like their own, different but highly

27
intelligible, or very different and difficult to understand. Godfrey and Collins also
provide information about geography and commercial centers, which is used to compare
the results of the phonetic distance measure with patterns of contact.
4.2. DATA PREPARATION. As mentioned in Section 3.2, the appendices in B’aayil et
al. (2000) include word lists for 26 regional varieties. Five of these lists are incomplete,
with less than half the data of the others. Many of the missing lexical items for two
varieties (Comitancillo and Tajumulco) were found in the chapter on lexical variation
and incorporated into their respective word lists. However, three varieties (Génova, San
Miguel Ixtahuacán, and Concepción Tutuapa) had so few words that their average
phonetic distances were calculated using fewer than 58 cognates, the smallest number
used in a previously validated study of this type (Beijering, Gooskens, and Heeringa
2008). Therefore, these three lists were excluded from the present analysis, leaving 23
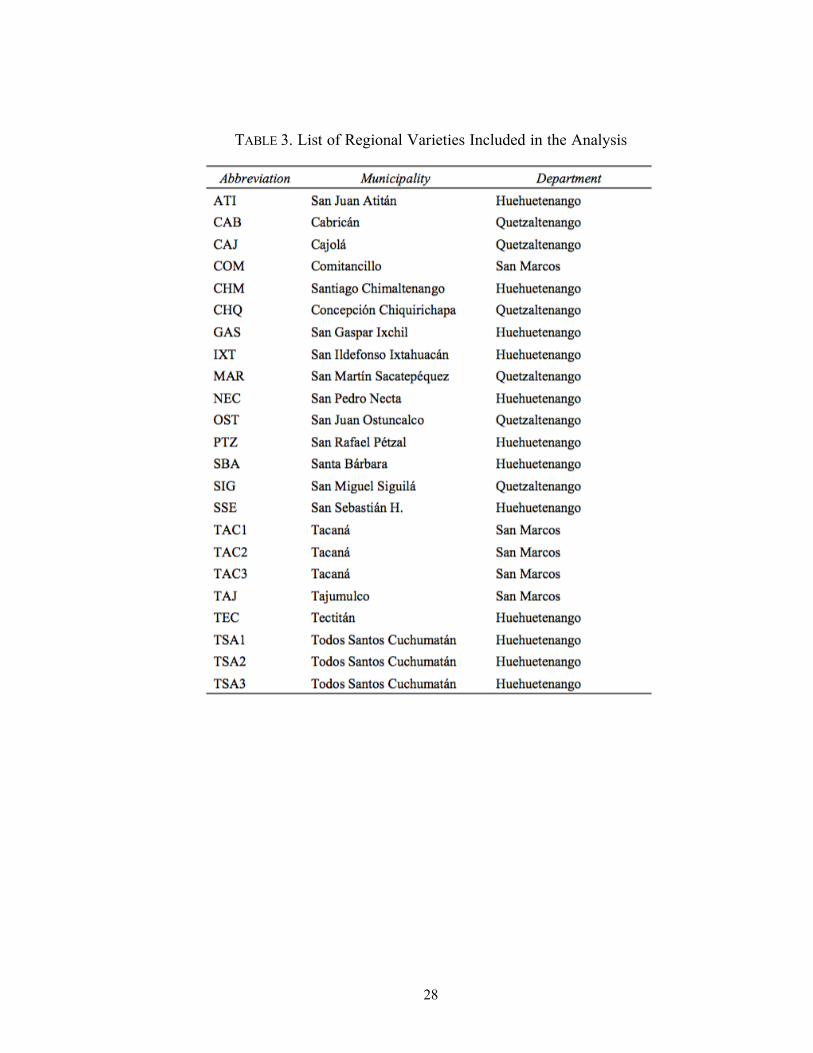
varieties in total. The varieties and their abbreviations are listed in Table 3. B’aayil et
al. unfortunately do not provide information on the distinction between TAC1, TAC2,
and TAC3, which were all collected in or near Tacaná, nor the distinction between
TSA1, TSA2, and TSA3 from Todos Santos Cuchumatán. Figure 1 shows the locations
of the municipalities on a map of western Guatemala.
28
TABLE 3. List of Regional Varieties Included in the Analysis

29
FIGURE 1. Map of included municipalities in western Guatemala.
The original word lists included 245 semantic items, but there was a significant
amount of pruning and cleaning necessary. Twenty semantic items were duplicates and
had to be combined. Additionally, a number of the Spanish translations of the semantic
items, which were presumably used for elicitation, are ambiguous in Mam. For
example, the entries for body parts were often inflected with Set A markers for
possession, but word lists differed on which person was chosen. The entries for ‘nose’
include /ntxaane/ in Santiago Chimaltenango, /qtxa’n/ in Todos Santos 3, and /ttxa’n/ in
Tacaná 3. The prefix /n-/ and enclitic /-e/ in the first indicate 1SG, the /q-/ and /-∅/ in
the second indicate 1PL inclusive, and the /t-/ and /-∅/ in the last indicate 3SG (B’aayil
et al. 2000:58-60). Were these forms to be incorporated into the phonetic distance
30
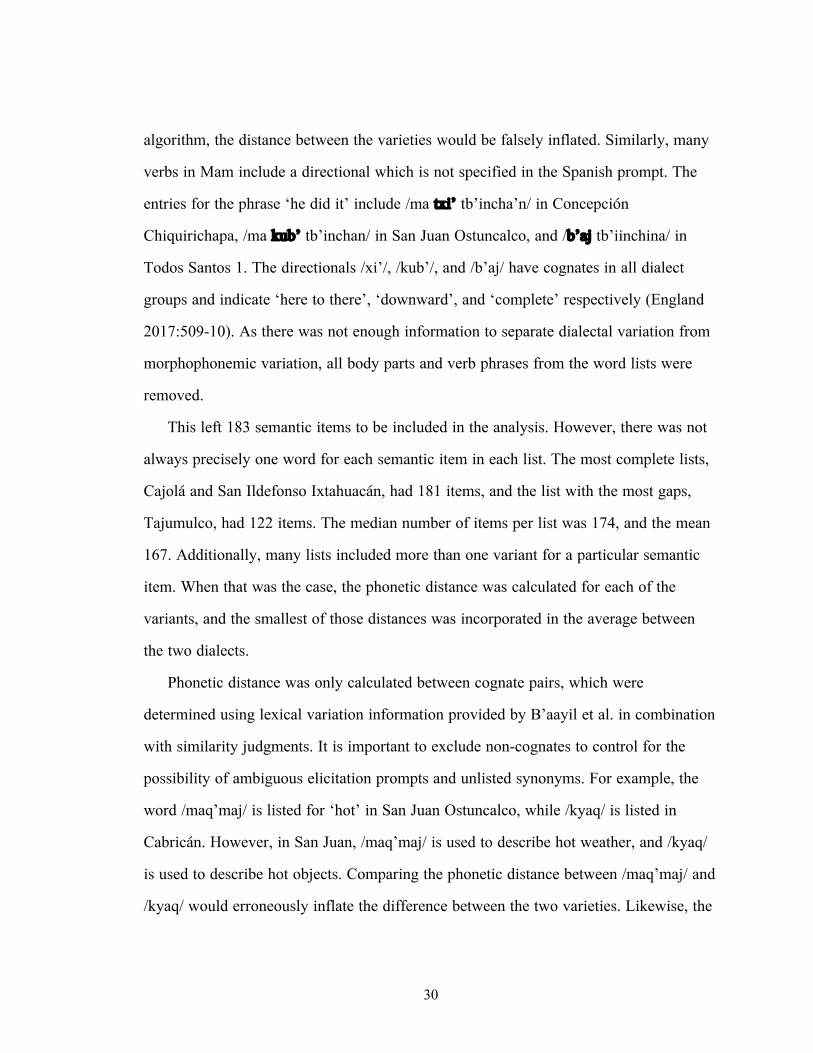
algorithm, the distance between the varieties would be falsely inflated. Similarly, many
verbs in Mam include a directional which is not specified in the Spanish prompt. The
entries for the phrase ‘he did it’ include /ma txi’ tb’incha’n/ in Concepción
Chiquirichapa, /ma kub’ tb’inchan/ in San Juan Ostuncalco, and /b’aj tb’iinchina/ in
Todos Santos 1. The directionals /xi’/, /kub’/, and /b’aj/ have cognates in all dialect
groups and indicate ‘here to there’, ‘downward’, and ‘complete’ respectively (England
2017:509-10). As there was not enough information to separate dialectal variation from
morphophonemic variation, all body parts and verb phrases from the word lists were
removed.
This left 183 semantic items to be included in the analysis. However, there was not
always precisely one word for each semantic item in each list. The most complete lists,
Cajolá and San Ildefonso Ixtahuacán, had 181 items, and the list with the most gaps,
Tajumulco, had 122 items. The median number of items per list was 174, and the mean
167. Additionally, many lists included more than one variant for a particular semantic
item. When that was the case, the phonetic distance was calculated for each of the
variants, and the smallest of those distances was incorporated in the average between
the two dialects.
Phonetic distance was only calculated between cognate pairs, which were
determined using lexical variation information provided by B’aayil et al. in combination
with similarity judgments. It is important to exclude non-cognates to control for the
possibility of ambiguous elicitation prompts and unlisted synonyms. For example, the
word /maq’maj/ is listed for ‘hot’ in San Juan Ostuncalco, while /kyaq/ is listed in
Cabricán. However, in San Juan, /maq’maj/ is used to describe hot weather, and /kyaq/
is used to describe hot objects. Comparing the phonetic distance between /maq’maj/ and
/kyaq/ would erroneously inflate the difference between the two varieties. Likewise, the

31
word lists are not comprehensive, and we cannot assume that they includes all
synonyms available in each variety. For ‘teacher’, many varieties include a variation of
the native Mam word /xnaq’tzaal/ while other varieties include a variation of the
Spanish loan /maestro/. It is unclear whether these speakers exclusively use the one
term or understand both, and therefore it is considered best to remove the potential
source of variation entirely.
4.3. CALCULATION OF THE PHONETIC DISTANCE MATRIX. Table 4 shows an example
of how the Levenshtein distance algorithm optimally aligns two words and calculates
the edit cost. The alignment is found using the process detailed in Martin and Jurafsky
(2009:73). The word for ‘eagle’ is /q’aanjel/ in Santiago Chimaltenango (CHM) and
/q’njil/ in San Juan Ostuncalco (OST). The alignment in Table 4 allows the former to be
transformed into the latter with the least number of edits. Permitted edits include
insertions, deletions, and substitutions. The long vowel /aa/ is deleted and the vowel /e/
is substituted for the vowel /i/. The rest of the segments match and therefore have zero
cost.
TABLE 4. The Optimal Alignment between /q’aanjel/ and /q’njil/
Longer words are likely to have more edits, and thus have higher edit costs. This is
avoided by applying a normalization function. The sum of the edits is divided by the
length of the longest alignment to return a normalized cost. Specifying ‘longest’ is
necessary because in some cases, there is more than one alignment that achieves the
minimal cost. For example, there are two possible alignments that have four edits for
/chmojxhen/ and /chemjxiin/, the words for ‘spider’ in Tacaná 2 and San Juan Atitán.

32
The two alignments are illustrated in Table 5 and Table 6. Both have a total of four
edits, giving a simple cost of 4. However, the length of their alignments differ and
would return different results if normalized by dividing by their own length. The longer
alignment is preferred because it has a tendency to align more of the common segments,
which mimics human perception in the comparison of two words (Heeringa 2004:131).
In this case, the length of the longest alignment is 8, and therefore the normalized cost
is 0.5. For the ‘eagle’ example in Table 4 above, the length of the longest alignment
was 6, and the normalized cost 0.33.
TABLE 5. Shorter Alignment for /chmojxhen/ and /chemjxiin/
TABLE 6. Longer Alignment for /chmojxhen/ and /chemjxiin/
For each pair of word lists, the normalized phonetic distance was calculated between
all possible cognate pairs. These were then averaged to return a single aggregate
distance score between the two varieties. The resulting distance matrix can be found in
Appendix A, and Appendix B shows a corresponding matrix with the number of
cognate comparisons included in each aggregate. The latter range from 82 to 181, with a
median of 120 and a mean of 122.2.
Following Heeringa (2004:170), internal consistency was measured using
Cronbach’s alpha, a measure that involves the average inter-correlation between
cognates and the number of cognates compared. In the distance matrix created above,
each cell contains an average of many individual distances, each based on one cognate

33
pair. It is also possible to create a whole matrix based solely on the phonetic distances
between cognates meaning ‘mother’, another for the cognates meaning ‘cloud’, and yet
another for the cognates meaning ‘red’. The first step in finding the inter-average
correlation is to do this for all sets of cognates. Then, Pearson’s correlation coefficient,
r, is found for each pair of matrices: the correlation between the ‘mother’ and the
‘cloud’ matrices, between the ‘cloud’ and ‘red’ matrices, et cetera. The mean of these
correlations is the average inter-correlation, and it indicates the degree of consistency
between the individual components. Cronbach’s alpha then is calculated as follows, in
which 𝑛 is the number of cognates, and �̅� is the average inter-correlation.
𝛼 = )×+̅,-()/,)×+̅
An acceptable lower bound for alpha when calculating phonetic distance is 0.7
(Heeringa 2004:173). As each cell in the phonetic distance matrix is comprised of a
different number of comparisons, and varies in which cognates are included, the alpha
value is different for each pairwise language comparison. In the present analysis, the
values range from 0.81 to 0.92, all well above the 0.7 threshold. A matrix with the
results is in Appendix C.
4.4. CLUSTERING DIALECTS. The distance matrix was transformed into a network
diagram using the equal angle Neighbor-Net method available in the SplitsTree 4
package (Huson and Bryant 2006). This method takes the matrix of distances between
varieties, draws weighted splits—or binary partitions between the varieties—and
represents them in a network figure (Bryant and Moulton 2004:255).
The advantage of the network approach is its ability to represent ambiguity in the
data. For example, take two subsets of the present data, shown in Figure 2. Subset A
contains SSE, NEC, GAS, and ATI, all municipalities clustered together near the
Seleguá river valley in Huehuetenango (Godfrey and Collins 1987:80). Referring to the

34
distance matrix, the phonetic distance between all pairs of varieties is roughly equal.
Subset B contains IXT, GAS, TSA1 and TSA2. In this matrix, the distance between IXT
and GAS is notably smaller, as is the distance between TSA1 and TSA2. A binary tree
could represent the relationships between varieties in Subset B well by connecting IXT
and GAS in one pair, TSA1 and TSA2 in another pair, and then connecting the two
pairs. It could not represent the data from Subset A as well; the shortest distance is
between NEC and GAS, but the distance between GAS and ATI is only marginally
longer. The networks visually represent that ambiguity.
FIGURE 2. Distance matrices and Neighbor-Nets for two subsets of the data.
The box connecting the varieties in Subset B is long and thin; the long edges
represent the strength of the partition between TSA1 & TSA2 and IXT & GAS, and the
short edges represent the weakness of the partition between IXT & TSA1 and GAS &

35
TSA2. In contrast, the box connecting the varieties of Subset A is relatively square,
indicating that the possible partitions are of somewhat comparable strength. The length
of the line connecting the inner box to a variety label represents the split between that
individual variety and the rest of the varieties. Subset B shows that TSA1, for example,
is more distinct from the rest of the varieties than GAS is. The length of the shortest
path from one variety to another is the distance between those varieties (Bryant and
Moulton 2004:256-258, Yang 2012:124).
The network diagram that includes all varieties, and all of the possible partitions
between them, is more complex. Figure 3 shows the output of the tree with the 23
varieties included. Branches formed with long, narrow boxes in the inner portion
represent clusters of varieties, and varieties connected with shorter lines are less
divergent than those connected with longer lines. Four main branches are visible: one
with NEC through SSE at the top of the figure, another with CAB through SIG on the
right, a third with TEC through TAC1 on the bottom left, and a fourth with the TSA
varieties on the left. The members of each of the four branches are circled for visual
clarity.
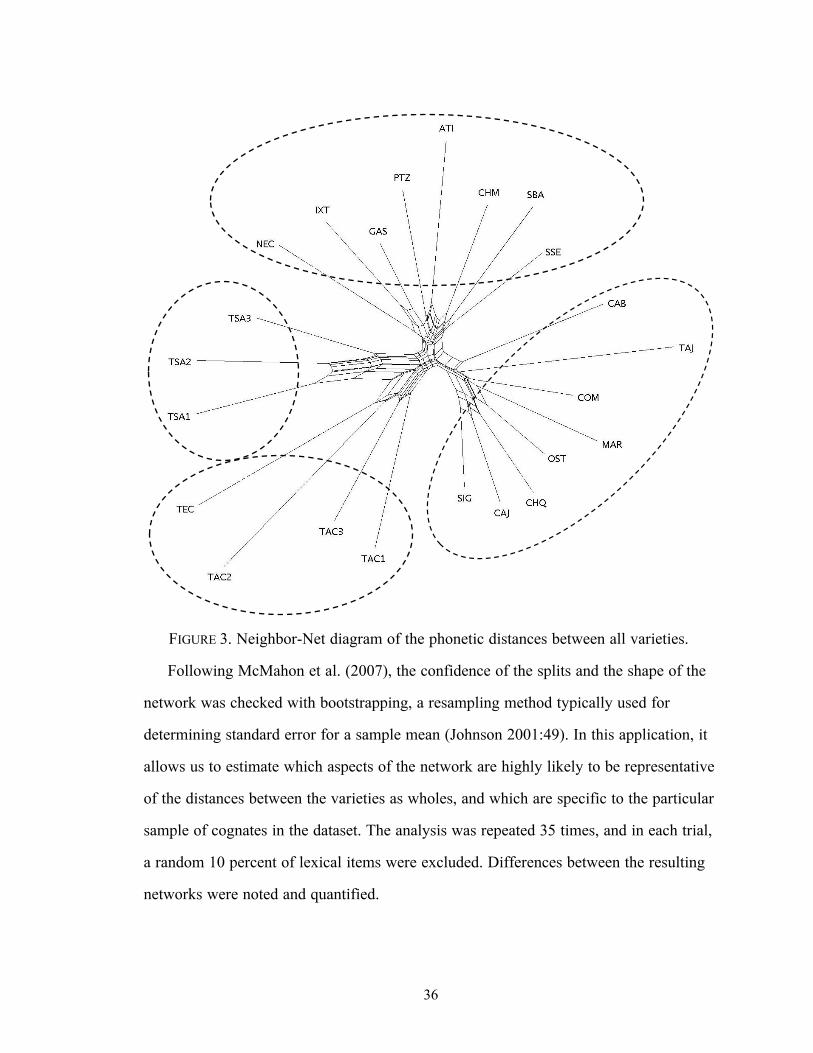
36
FIGURE 3. Neighbor-Net diagram of the phonetic distances between all varieties.
Following McMahon et al. (2007), the confidence of the splits and the shape of the
network was checked with bootstrapping, a resampling method typically used for
determining standard error for a sample mean (Johnson 2001:49). In this application, it
allows us to estimate which aspects of the network are highly likely to be representative
of the distances between the varieties as wholes, and which are specific to the particular
sample of cognates in the dataset. The analysis was repeated 35 times, and in each trial,
a random 10 percent of lexical items were excluded. Differences between the resulting
networks were noted and quantified.
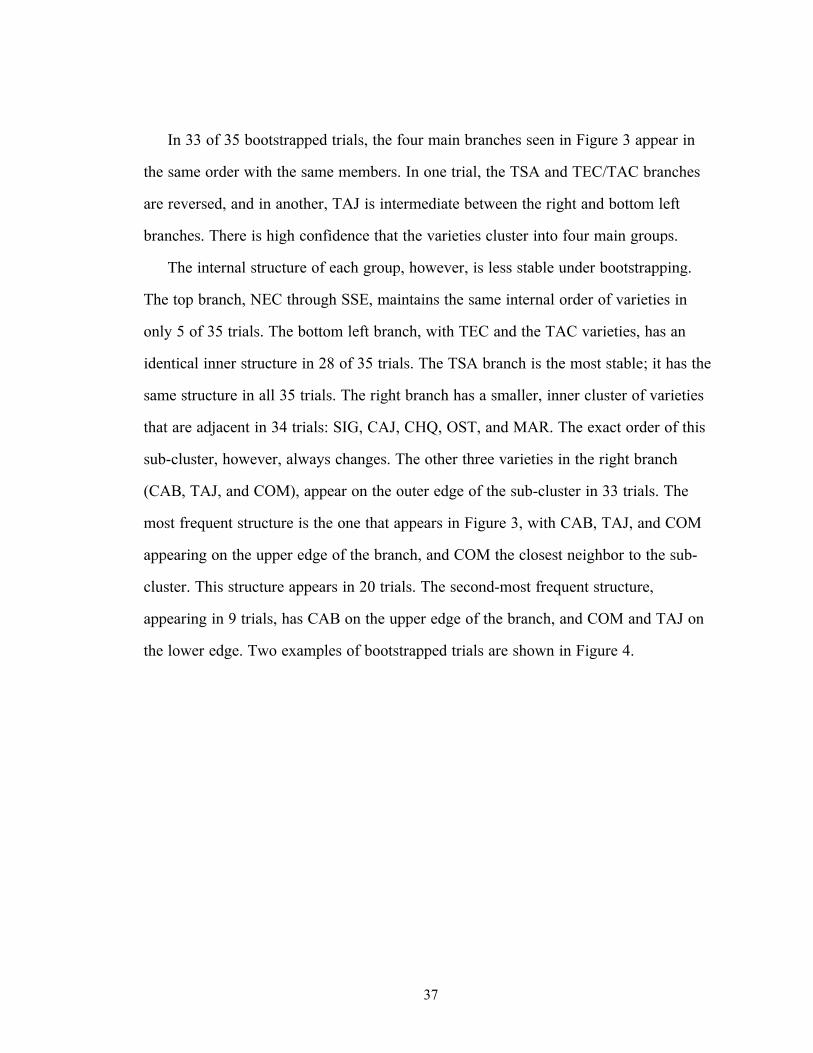
37
In 33 of 35 bootstrapped trials, the four main branches seen in Figure 3 appear in
the same order with the same members. In one trial, the TSA and TEC/TAC branches
are reversed, and in another, TAJ is intermediate between the right and bottom left
branches. There is high confidence that the varieties cluster into four main groups.
The internal structure of each group, however, is less stable under bootstrapping.
The top branch, NEC through SSE, maintains the same internal order of varieties in
only 5 of 35 trials. The bottom left branch, with TEC and the TAC varieties, has an
identical inner structure in 28 of 35 trials. The TSA branch is the most stable; it has the
same structure in all 35 trials. The right branch has a smaller, inner cluster of varieties
that are adjacent in 34 trials: SIG, CAJ, CHQ, OST, and MAR. The exact order of this
sub-cluster, however, always changes. The other three varieties in the right branch
(CAB, TAJ, and COM), appear on the outer edge of the sub-cluster in 33 trials. The
most frequent structure is the one that appears in Figure 3, with CAB, TAJ, and COM
appearing on the upper edge of the branch, and COM the closest neighbor to the sub-
cluster. This structure appears in 20 trials. The second-most frequent structure,
appearing in 9 trials, has CAB on the upper edge of the branch, and COM and TAJ on
the lower edge. Two examples of bootstrapped trials are shown in Figure 4.
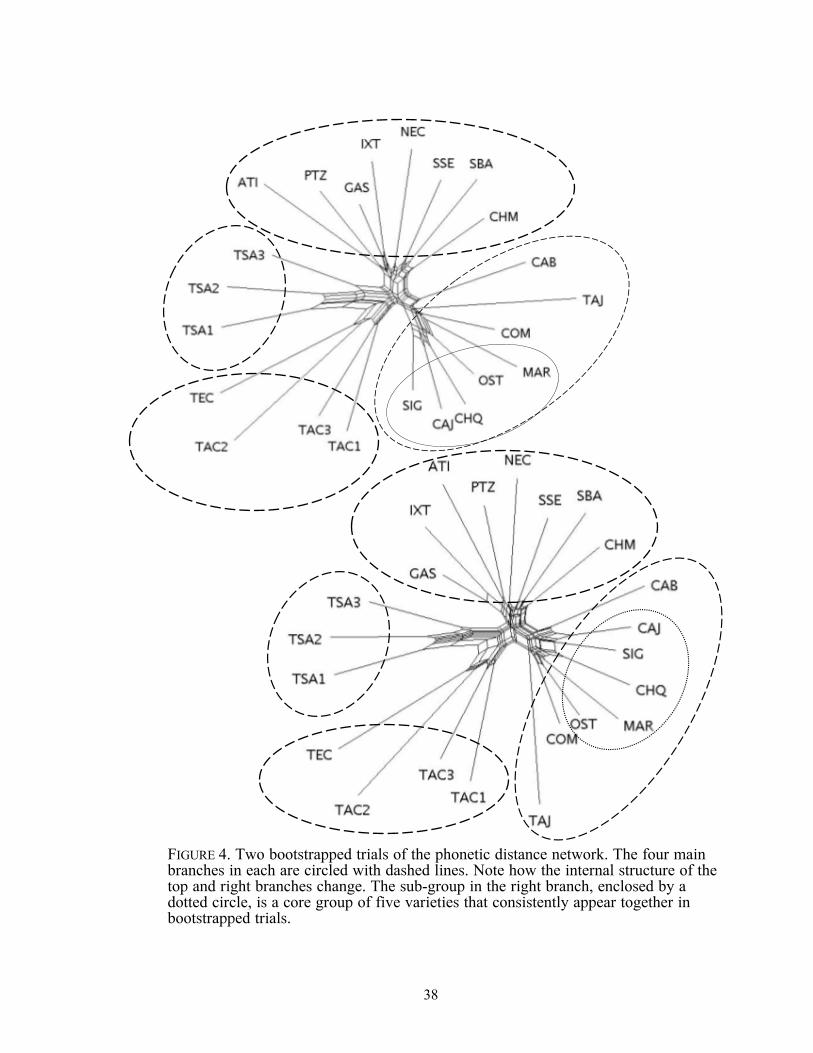
38
FIGURE 4. Two bootstrapped trials of the phonetic distance network. The four main branches in each are circled with dashed lines. Note how the internal structure of the top and right branches change. The sub-group in the right branch, enclosed by a dotted circle, is a core group of five varieties that consistently appear together in bootstrapped trials.
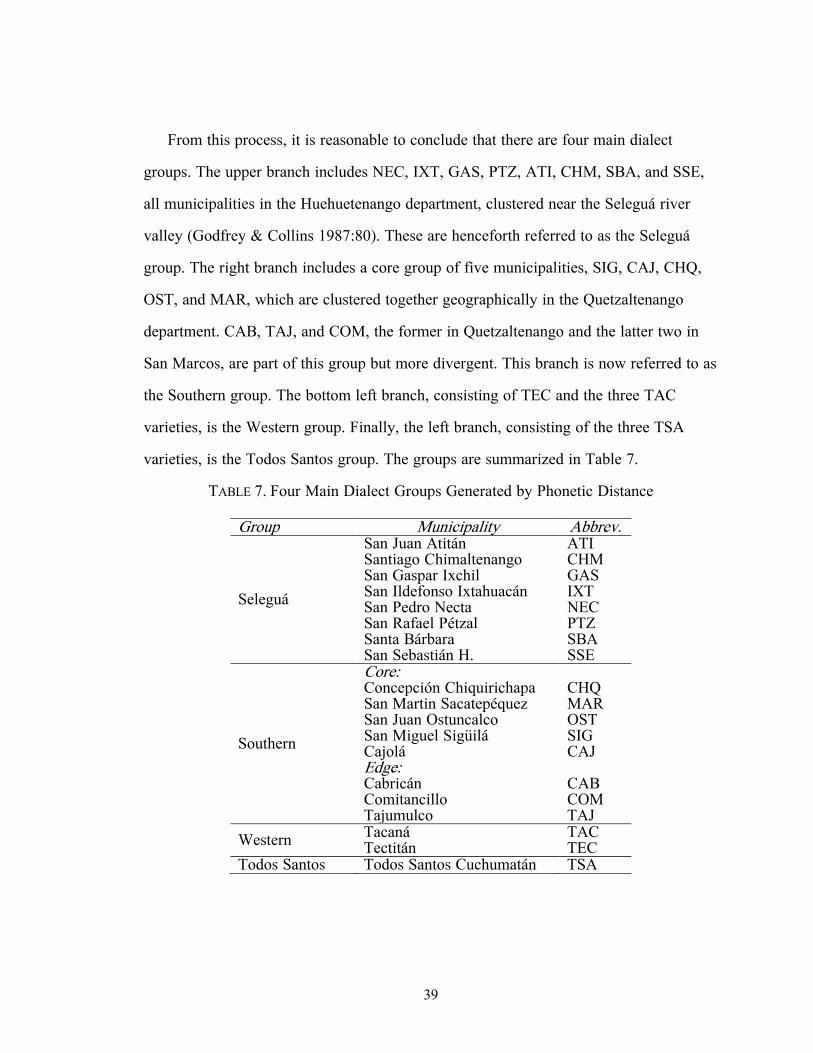
39
From this process, it is reasonable to conclude that there are four main dialect
groups. The upper branch includes NEC, IXT, GAS, PTZ, ATI, CHM, SBA, and SSE,
all municipalities in the Huehuetenango department, clustered near the Seleguá river
valley (Godfrey & Collins 1987:80). These are henceforth referred to as the Seleguá
group. The right branch includes a core group of five municipalities, SIG, CAJ, CHQ,
OST, and MAR, which are clustered together geographically in the Quetzaltenango
department. CAB, TAJ, and COM, the former in Quetzaltenango and the latter two in
San Marcos, are part of this group but more divergent. This branch is now referred to as
the Southern group. The bottom left branch, consisting of TEC and the three TAC
varieties, is the Western group. Finally, the left branch, consisting of the three TSA
varieties, is the Todos Santos group. The groups are summarized in Table 7.
TABLE 7. Four Main Dialect Groups Generated by Phonetic Distance
Group Municipality Abbrev.
Seleguá
San Juan Atitán Santiago Chimaltenango San Gaspar Ixchil San Ildefonso Ixtahuacán San Pedro Necta San Rafael Pétzal Santa Bárbara San Sebastián H.
ATI CHM GAS IXT NEC PTZ SBA SSE
Southern
Core: Concepción Chiquirichapa San Martin Sacatepéquez San Juan Ostuncalco San Miguel Sigüilá Cajolá Edge: Cabricán Comitancillo Tajumulco
CHQ MAR OST SIG CAJ CAB COM TAJ
Western Tacaná Tectitán
TAC TEC
Todos Santos Todos Santos Cuchumatán TSA
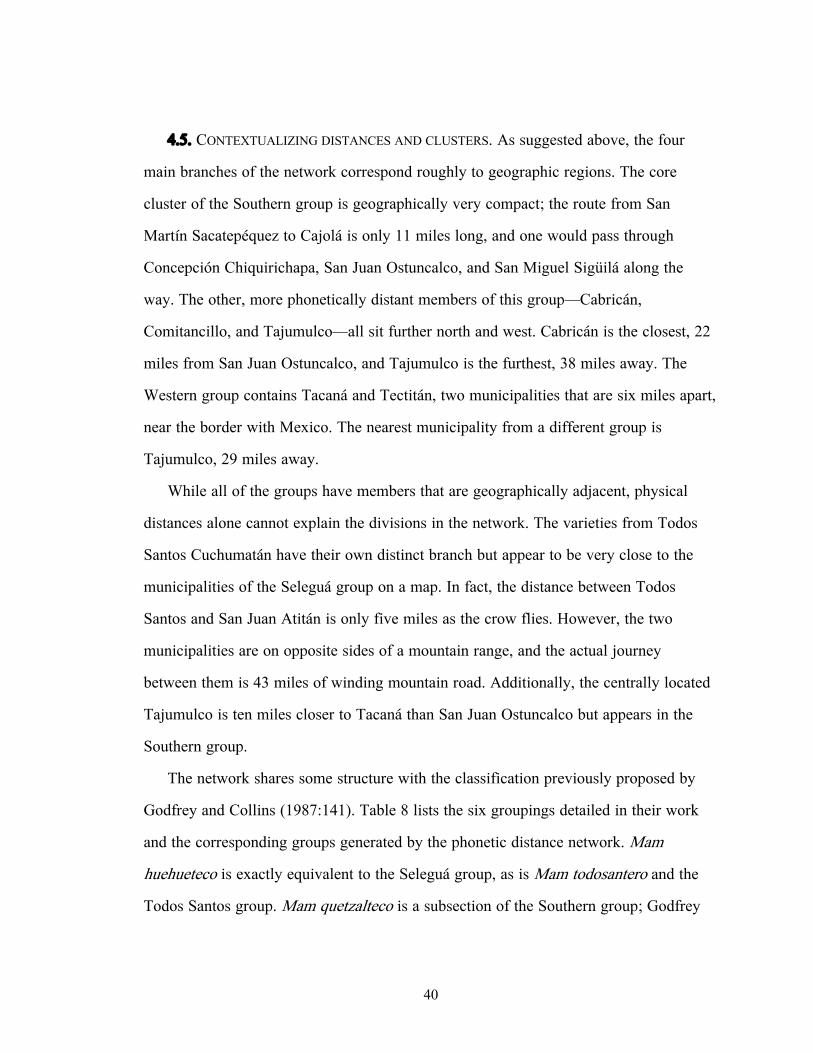
40
4.5. CONTEXTUALIZING DISTANCES AND CLUSTERS. As suggested above, the four
main branches of the network correspond roughly to geographic regions. The core
cluster of the Southern group is geographically very compact; the route from San
Martín Sacatepéquez to Cajolá is only 11 miles long, and one would pass through
Concepción Chiquirichapa, San Juan Ostuncalco, and San Miguel Sigüilá along the
way. The other, more phonetically distant members of this group—Cabricán,
Comitancillo, and Tajumulco—all sit further north and west. Cabricán is the closest, 22
miles from San Juan Ostuncalco, and Tajumulco is the furthest, 38 miles away. The
Western group contains Tacaná and Tectitán, two municipalities that are six miles apart,
near the border with Mexico. The nearest municipality from a different group is
Tajumulco, 29 miles away.
While all of the groups have members that are geographically adjacent, physical
distances alone cannot explain the divisions in the network. The varieties from Todos
Santos Cuchumatán have their own distinct branch but appear to be very close to the
municipalities of the Seleguá group on a map. In fact, the distance between Todos
Santos and San Juan Atitán is only five miles as the crow flies. However, the two
municipalities are on opposite sides of a mountain range, and the actual journey
between them is 43 miles of winding mountain road. Additionally, the centrally located
Tajumulco is ten miles closer to Tacaná than San Juan Ostuncalco but appears in the
Southern group.
The network shares some structure with the classification previously proposed by
Godfrey and Collins (1987:141). Table 8 lists the six groupings detailed in their work
and the corresponding groups generated by the phonetic distance network. Mam
huehueteco is exactly equivalent to the Seleguá group, as is Mam todosantero and the
Todos Santos group. Mam quetzalteco is a subsection of the Southern group; Godfrey
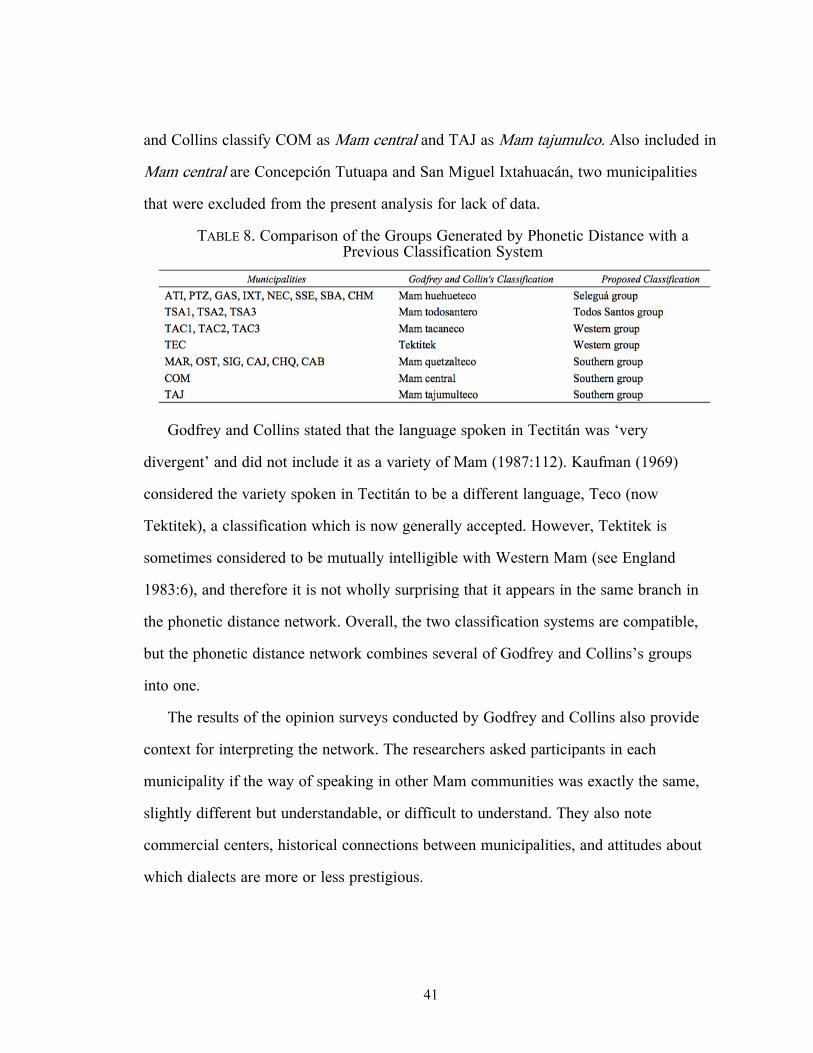
41
and Collins classify COM as Mam central and TAJ as Mam tajumulco. Also included in
Mam central are Concepción Tutuapa and San Miguel Ixtahuacán, two municipalities
that were excluded from the present analysis for lack of data.
TABLE 8. Comparison of the Groups Generated by Phonetic Distance with a Previous Classification System
Godfrey and Collins stated that the language spoken in Tectitán was ‘very
divergent’ and did not include it as a variety of Mam (1987:112). Kaufman (1969)
considered the variety spoken in Tectitán to be a different language, Teco (now
Tektitek), a classification which is now generally accepted. However, Tektitek is
sometimes considered to be mutually intelligible with Western Mam (see England
1983:6), and therefore it is not wholly surprising that it appears in the same branch in
the phonetic distance network. Overall, the two classification systems are compatible,
but the phonetic distance network combines several of Godfrey and Collins’s groups
into one.
The results of the opinion surveys conducted by Godfrey and Collins also provide
context for interpreting the network. The researchers asked participants in each
municipality if the way of speaking in other Mam communities was exactly the same,
slightly different but understandable, or difficult to understand. They also note
commercial centers, historical connections between municipalities, and attitudes about
which dialects are more or less prestigious.

42
The Seleguá group (ATI, PTZ, GAS, IXT, NEC, SSE, SBA, CHM) contains eight
municipalities that are geographically close together and connected by good highways
and commercial relationships (Godfrey & Collins 1987:80). Some of the smaller
municipalities were historically aldeas, small villages associated with a larger
municipality, of other communities in the analysis. Until the late 1940s, San Rafael
Pétzal and San Gaspar Ixchil were aldeas of Colotenango, another Mam-speaking town
in the area, and Santiago Chimaltenango was an aldea of San Pedro Necta. Speakers
from Colotenango considered the speech of all eight municipalities to be very similar to
their own, if not exactly identical, and maintained they had no problems understanding
anyone from that area. San Ildefonso Ixtahuacán is the commercial center for San Pedro
Necta, San Gaspar Ixchil, San Rafael Pétzal, Santa Bárbara, and San Sebastián H.
(Godfrey & Collins 1987:80-85). Statistically speaking, the inner structure of this
branch of the network is not stable when bootstrapped, and the smaller, internal clusters
cannot be considered significant. This mirrors the situation portrayed by the opinion
surveys, in which there are differences between municipalities, but they do not have a
significant effect on intelligibility.
The Todos Santos varieties appear in their own branch on the network, quite
separate from the cluster of other northern municipalities. Godfrey and Collins comment
on aspects of the linguistic variation that makes this dialect unique, but unfortunately do
not report the results of the opinion survey. Todos Santos has three phonemes that do
not appear in other dialects, there are a number of unique lexical variants, and many
words have an extra or missing vowel compared to cognate forms in other regions
(1987:88).
The Western group contains the varieties from Tacaná and Tectitán. According to
Godfrey and Collins, only a small percentage of people under 20 years old speak Mam

43
in Tacaná (1987:111). The language of Tectitán is considered Tektitek, a language that
is closely related to Mam (Kaufman 1969). In the opinion surveys, Tectitán participants
said that the speech in Tacaná is very different from their own. However, many people
in Tectitán, particularly men, understood and spoke the Tacaná variety. The people of
Tectitán considered the variety in Tacaná to have more prestige, and therefore were
accustomed to adopting it. This is an example of non-symmetric intelligibility; the
people of Tacaná did not typically use the Tectitán variety (Godfrey & Collins
1987:87). Overall, the shape of the network, in particular the long length of the lines
connecting these four varieties to the center, is consistent with Godfrey and Collin’s
conclusion that Tacaná has the variety that is closest to Tektitek and most distant from
all other dialects of Mam (1987:99).
B’aayil et al. observed that the western varieties of Mam have the least amount of
influence from Q’anjobal and K’iche’, and in terms of lexicon, are the most similar to
Proto-Mam (2000:129). The tight connection between the Todos Santos and Western
branches in the network suggests that the Todos Santos varieties could also have a high
number of retentions, because geographically speaking, the populations in these two
branches are unlikely to have much contact. B’aayil et al. do not directly address the
question of retention specifically in Todos Santos, but another piece of evidence in
favor of this hypothesis comes from Godfrey and Collins’s observation that in Todos
Santos, both men and women have retained their traditional dress (1987:88). In most
Mayan communities, the men have switched to wearing Western clothing, and only the
women wear Mayan clothing (England 1983:11). It may be possible that Todos Santos
has remained both culturally and linguistically more conservative, and therefore has a
closer phonetic distance to the conservative western varieties. However, this is simply a
hypothesis and more investigation should be done on this point.

44
Finally, among the municipalities of Southern group (MAR, OST, SIG, CAJ, CHQ,
COM, CAB, TAJ), the opinion surveys found that speakers have a very clear awareness
of the differences between municipalities, but minimal trouble understanding their
speech. Participants in Cajolá considered their dialect to be exactly equal to San Miguel
Sigüilá and San Juan Ostuncalco, and similar enough to Concepción Chiquirichapa to be
understood. The participants in San Juan Ostuncalco, on the other hand, maintained that
their variety of Mam was different from the surrounding municipalities. Godfrey and
Collins noted significant phonological differences between San Martín Sacatepéquez
and San Juan Ostuncalco, such as a tendency to place stress word-finally. The biggest
commercial center of this region, however, is San Juan Ostuncalco, and many from San
Martín Sacatepéquez visit regularly for the market. This high degree of exposure
explains why intelligibility is high, despite phonological differences (1987:89-92).
Additionally, the prestige that San Juan Ostuncalco gains from being the largest
commercial center helps explain why their survey responses emphasize more difference
between themselves and the surrounding municipalities than vice versa. Godfrey and
Collins do not report on the details of the survey responses from Cabricán,
Comitancillo, or Tajumulco, which are geographically more central in the Mam-
speaking region. However, they report that Tajumulco, despite having its own group in
their classification system, shares many features with southern varieties; Comitancillo
shares features with both the southern and northern varieties; and Cabricán, though
classified with the south, might need more support in adopting a proposed standard
based off of the San Juan Ostuncalco variety (1987:93-110). In the phonetic distance
network, these three municipalities are consistently in the Southern branch, but on the
edge of it. In the majority of the bootstrapped versions, they appear on the edge closest
to the Seleguá branch.

45
Overall, we can see that the results of the phonetic distance algorithm, clustered in a
Neighbor-Net, are not at odds with previous dialect groupings and geographic features.
However, the varieties from Todos Santos, which are sometimes grouped with the other
northern municipalities, are shown to be quite distinct from their neighbors. Opinion
survey results and other social and economic information published in Godfrey and
Collins (1987) help contextualize the groups and distances seen in the network. From
their results, we can conclude that intelligibility within branches is fairly high;
differences exist but can be superseded, and there is fairly high exposure between same-
branch municipalities through commercial relationships. This is mirrored by the results
from the bootstrapping process; the four main branches remain consistent with
resampled data, but the internal clusters within branches are unstable.
While the opinion surveys conducted by Godfrey and Collins were a valuable source
of contextualizing information, a number of questions remain. Firstly, while the
researchers report which regional varieties are judged mutually intelligible by the
speakers, they do not specifically report on which varieties are not. Secondly, they
exclude participants with unusual amounts of experience or exposure to other varieties
of Mam from their analysis. While this is appropriate for estimating an ‘average’ or
‘typical’ degree of intelligibility between speakers of dialects, it does not lend itself to
the investigation of how readily structural differences between regional varieties can be
overcome with practice. The next chapter aims to fill these gaps.
5. SOCIOCULTURAL INTERVIEWS. Interviews were conducted to elicit more nuanced
and contemporaneous sociocultural information about language attitudes and patterns of
contact. These also provided the opportunity to gauge participants’ reactions to
recordings of Mam from dialects that they may not have previously encountered in
Guatemala. The scope of this section is quite limited, as it includes only eight

46
interviews with Mam speakers, most of whom are highly educated and from the same
region. It should not be seen as a comprehensive account of the sociocultural landscape.
However, it provides a valuable look at the perspectives of a certain demographic of
Mam speakers in Guatemala, in particular, how they perceive and adjust to dialectal
differences that they encounter in their professional careers. Additionally, a Mam
interpreter and an immigration officer in the United States are asked directly how they
handle differences between regional dialects in their work. Section 5.1 briefly lays out
the methodology, Section 5.2 introduces the demographics of the participants, and
Sections 5.3 through 5.6 discuss common themes and key observations from their
interviews. The terms ‘inter-’ and ‘intra-regional’ in this section refer to the four dialect
groups proposed in Section 4: Seleguá, Todos Santos, Western, and Southern.
5.1. METHODS. Interviews were conducted orally and audio recorded. All interviews
with Mam speakers were conducted in Spanish, with one exception (P8) that was
conducted in English. For interviews with Mam speakers, the participants were first
asked about their demographics and linguistic histories, and more general questions
about language exposure. In order to elicit opinions about Mam dialects spoken in
regions that they may not have visited or encountered, three audio samples of Mam
speech were taken from YouTube. The first was a recording of a middle-aged female
teacher in Comitancillo, telling a story to a group of children. The second was a
recording of two older women from Todos Santos who were prompted to ‘speak in
Mam’ by a Spanish-speaker at the beginning of the video. The third recording was of a
young man from Huitán, a town three miles south of Cabricán, speaking about Mam
language and culture directly to the camera. These three clips were not intended to be
used comparatively; simplicity of language, background noise, rate of speech, and
individual speaker effects were not controlled for. While the participants were asked to
47
rate each video on how well they understood it, how well the speaker spoke Mam, how
beautiful their dialect was, and how much they would like to travel or live in the place
where it was spoken, these scale ratings were simply intended to elicit qualitative
responses. For each recording, the participant listened to 30 seconds of audio. He or she
then answered questions about that recording, and the process was repeated for the next
sample. The full set of interview questions is included in Appendix D.
Individual interviews with Mam speakers were numbered and transcribed. Results
were qualitatively analyzed, and common themes were identified using emergent
coding. As there was only one interview with an immigration officer in the US, key
points from this interview were extracted and included. The excerpts discussed below
were translated by the author. Anonymized participant numbers follow each quoted
excerpt.
5.2. PARTICIPANTS. There was a total of eight participants who were native Mam
speakers. They ranged in age from 21 to 78, and the average age was 48. Seven
participants (P1-7) were born and continued to live in Concepción Chiquirichapa, San
Juan Ostuncalco, and surrounding aldeas. These two towns are very close by, only one
mile apart, in the department of Quetzaltenango. The eighth participant (P8) was born in
Santiago Chimaltenango, near the Seleguá river valley in Huehuetenango, and lived
there until she moved to the United States as a young adult. Six of the participants were
women. With the exception of one older woman who had no formal schooling (P1), all
of the participants had experience in higher education and professional careers. Six were
teachers with bilingual classrooms (P2-7). In addition to that career, two of these six
worked for the Guatemalan Academy of Mayan Languages (P3, P7), one worked for the
General Management of Bilingual and Intercultural Education (P3), one worked as a
cartographer (P6), and one worked as a tourist hiking guide (P2). One was a nurse and

48
adult literacy coach in Guatemala who has since become a Mam interpreter for a school
district in California (P8). The immigration officer was a white male who did not speak
Mam.
All Guatemalan participants considered Mam to be their native language, and all
spoke Spanish fluently. Six reported that they first learned to speak Spanish when they
began going to school at age five or six. One exception (P6) was a man whose father
spoke Mam and whose mother spoke Kaqchikel and K’iche’. Since the parents typically
communicated in Spanish at home, he learned it as a native language as well. The other
exception was the 78-year-old woman with no formal schooling (P1), who started to
learn Spanish when her own children entered school.
5.3. PATTERNS OF INTRA- AND INTER-REGIONAL CONTACT. Within regions, inter-
town marriages and migrations are common. The participants who live and work around
San Juan Ostuncalco and Concepción Chiquirichapa described fairly consistent
communication with people from other nearby Mam-speaking communities in the
Quetzaltenango department, including San Martín Sacatepéquez, San Miguel Sigüilá,
Cajolá, and Cabricán. Three have a spouse or parent from another municipality in that
group, and six have either attended school or worked in another nearby town. Five said
that they visit another municipality in the group at least once per week.
Intra-region contact is also high due to shared access to cultural and commercial
resources. While the participants interviewed here were educated professionals who
likely traveled more than the average person in the community, they also describe
ample opportunity to hear the Mam of other nearby towns without leaving their own
community. Three said that they listen to radio programs broadcast in Mam from nearby
municipalities. One woman, an elementary school teacher, described having
schoolmates from San Martín Sacatepéquez, San Miguel, Cajolá, Huitán, and Cabricán

49
when she studied for her teaching degree in San Juan Ostuncalco. They also have
contact with people from other communities through the central market:
(1) Well, what happens is that San Juan is a very commercial municipality … Sundays and other important days people from other municipalities come to sell. They come from Comitancillo. It’s very frequent that people from other municipalities come, to do, say, commercial transactions. (P7)
The woman from Santiago Chimaltenango described having frequent contact with
other people from other towns around the Seleguá Valley, including San Pedro Necta,
San Juan Atitán, Santa Bárbara, San Sebastián H., and Colotenango. She was part of a
church group which had members from all of those towns. She also traveled around
these areas as a community health worker. She never traveled to Todos Santos
Cuchumatán, but her father had a coffee farm in that region, with many Todosantero
workers.
Exposure across dialect regions, on the other hand, is largely limited to higher
prestige educational or professional pursuits. Participants from Quetzaltenango have
significantly less frequent contact with communities in Huehuetenango than other
municipalities in their local region. They only reported traveling this far for professional
reasons; one woman went monthly to develop literacy materials with a bilingual
education leader who lived in San Sebastián H., and another woman went to
Huehuetenango a few times a year connected to her work in tourism. Two of the
teachers described having professional development meetings a few times a year in
either San Marcos or Huehuetenango. Only one participant mentioned Tacaná, on the
far western edge of the country; he was sent there as part of a cartography contract. In
response to the question ‘Would you like to travel or live where they speak Mam like
this?’ after a recording from a different department, two of the eight participants said no
specifically because they did not have any family to visit there. Travel appears to be

50
limited to business or visiting family, and none of the participants had family in a Mam-
speaking town in a different department.
Participants reported that radio programs are limited to nearby towns, and that
national and departmental television and radio is broadcast exclusively in Spanish.
However, children do have some exposure to varieties from other departments through
the literacy materials used in the schools. Four participants reported teaching from
books written in Huehuetenango or San Marcos in their classrooms or using them when
they were first learning to read themselves.
(2) But the books in the schools … are written in another version of Mam, so also you learn the Mam of other regions. Almost all of the books are from other parts, some from San Marcos, some from Huehue - it’s whoever they contracted to write the book. (P7)
(3) Some books are the dialect from here [San Juan Ostuncalco] There are others
that are from Huehue, others from San Marcos. (P6) (4) There in Huehue [they say] /wa’/ - it’s ‘toad’. And here [San Juan
Ostuncalco] is /xta’/, so they are different. We had a book that we started to read, and this word came up. ‘What is this?’ we asked the teacher. Then he told us that it was the same, that they are dialectal differences. (P5)
With one exception, all of the participants interviewed here were literate in Mam. This
is not the norm in Guatemala, as L1 literacy is estimated to be less than five percent
(Simons & Fennig 2018). Other individuals who lived in San Juan Ostuncalco and San
Martín Sacatepéquez, and did not fluently read and write in Mam, commented
anecdotally that reading in Mam was more difficult than reading in Spanish, because,
like English, the letters did not match the pronunciation. Given that the orthography for
Mam is designed to be phonetic, one can speculate that the difficulty arose from using
materials developed in a different dialect. The Mam interpreter living in California
expressed a similar challenge, regarding translation work for the local library.
(5) Sometimes they ask [me] to make flyers in Mam. But it’s a little bit confuse [sic.] because the people from Todos Santos they can ... some of them can
51
read but ... if I’m writing something in my Mam, my language, they will not understand. That’s the problem. (P8)
Even if primary school students are given some exposure to other dialects of Mam
during their first few years of learning how to read, secondary education is generally
conducted in Spanish, and students are unlikely to have significant exposure to those
more distant dialects thereafter.
5.4. PERCEPTIONS OF DIALECTAL DIFFERENCES. All participants commented on
specific dialectal differences between the speech of their hometown and those of nearby
communities. They mentioned both pronunciation and lexical differences.
(6) It’s different. They have a pronunciation that is stronger, or weaker, say, or maybe some are slower. (P5)
(7) Here in San Juan, for ‘man’, here we say /iichin/, but in Conce [Concepción
Chiquirichapa] they say /chan/, so it’s a little different. (P2) (8) Here [San Juan Ostuncalco] when something is good we say /b’a’n/. There
[Cajolá] they say /ween/. (P3)
Almost all participants from the Southern group insisted that, despite those differences,
they understood each other well.
(9) There are dialectal differences but yes it’s the same Mam, it’s Mam they speak, because although some words are not the same we still understand each other. (P3)
(10) Sometimes it’s more difficult to understand the words from other
municipalities because there are words that are very unique to that municipality. For example … in Concepción Chiquirichapa, which is nearby- Here in San Juan we say ‘no’ as /mixti/. They say /kla/, but the people understand each other. They don’t talk like that but they understand. (P7)
(11) San Marcos? Yes, we understand each other. We always have some
variations ... it’s not the same, then, but yes we understand each other, the message. (P4)
There was only one exception, the woman who did not have a formal education or a
profession outside of the home, and who mainly stayed in her aldea of San Juan
Ostuncalco. She said that sometimes she did not understand people from San Miguel

52
Sigüilá, Cajolá, or Concepción Chiquirichapa because the words and pronunciation were
different.
Even across regions, where structural differences between varieties are more
pronounced and contact is reduced, the majority of the participants emphasized that it is
still the same language and difficulty can be overcome.
(12) It’s different, different words. Sometimes you understand, sometimes you don’t. If you don’t understand, you ask the person what they meant by what they said. (P6)
The participant recognizes differences and acknowledges challenges in comprehension,
but does not view these as insurmountable challenges.
5.5. POSITIVE ATTITUDES AND SOLIDARITY WITHIN THE MAM COMMUNITY. The
majority of the participants made positive comments towards varieties of Mam that
were different from their own. Four participants made positive comments after listening
to the audio recordings, in their responses to the questions ‘How well does this person
speak?’ and ‘How beautiful do you think their dialect is?’
(13) In my opinion they speak well ... I understood like five words, but the rest I didn’t understand. I’m sure it’s a beautiful language if you understand. (P8)
(14) Beautiful for them where they are, but for us we don’t understand so four out
of five. (P4). (15) They speak this way, they understand well. This is how they speak. (P1)
One of the participants, an administrator in the government’s bilingual education
program, directly rejected the idea of a standard.
(16) Each region has its accent, so we cannot say this is the correct one. We say that all are correct, one only has to learn the different forms. There isn’t one that is better than another. (P7)
There was only one negative comment about other varieties of Mam:
(17) It always feels odd because it’s not the true Mam, one’s own true Mam, but yes, yes we understand each other. (P4)

53
None of the participants directly criticized a speaker for using a Mam word that was
different than his or her own, but two participants reported that a speaker in a recording
spoke less well and less beautifully because she used Spanish words. Collins (2005) also
finds that highly educated Mam speakers have negative attitudes towards Mam-Spanish
codeswitching. Mam teachers, in particular, often consider the act of codeswitching to
support the erroneous and discriminatory view in Guatemala that indigenous languages
are ‘inferior’ and ‘unable to articulate complex ideas’ (255). They avoid the practice as
part of a wider sociopolitical ideology oriented against oppression from the Spanish-
speaking majority (240). Although the present interviews did not directly investigate
attitudes towards non-indigenous communities, the broader sociopolitical context and
the two negative responses to codeswitching suggest that an anti-Spanish orientation
might heighten participants’ solidarity in their use of Mam. Collins’ work suggests that
this ideology is more pronounced among the highly educated, such as the majority of
participants interviewed here. It should be noted, however, that the participant without
formal education (P1) also demonstrated a pluralistic acceptance of other dialects, even
when she could not understand them.
ROLES OF EXPOSURE AND ACCOMMODATION. Four participants acknowledged the role
that practice played in their ability to understand people from different Mam speaking
regions well.
(18) In my case, I’m used to it, so I understand. (P2) (19) Because of the practice that I’ve had ... how I’ve learned other words in
other places - that makes it easier. Now when people only speak in [their] region there, sometimes it is difficult [for them] to understand the words from other municipalities. (P7)
In contrast, the one woman who had very limited contact with other varieties of Mam
(P1) spoke more about differences and difficulties in comprehension and was one of the
only participants who did not emphasize shared understanding in her interview.

54
This woman was one of two participants who admitted having trouble understanding
a different variety of Mam. After listening to the recording from Todos Santos, she
reported not understanding much at all. The interpreter from Santiago Chimaltenango
(P8), likewise, reported only understanding ‘maybe four words’ of the recording from
Comitancillo. The latter participant traveled and had exposure to Mam-speaking towns
in Huehuetenango, but not in San Marcos, where Comitancillo is. She also described an
experience with another Mam woman in California, who was from San Martín
Sacatepéquez.
(20) I went to help someone from San Martín Quetzaltenango but it’s different. We didn’t understand each other. I think it’s different Mam ... She said ‘Oh, your Mam - it’s different. I speak Mam but it’s different.’ And I said okay. But she speak [sic.] Spanish, so I didn’t work with her. (P8)
This participant reported changing her own speech patterns when speaking to people
from Todos Santos, so that they would understand her better.
(21) People from Todos Santos, some of them understand a little bit more my dialect, but some of them, nothing. Not nothing, but they say ‘Oh I don’t understand, what do you say?’ But I’m trying to talk a little bit like them because ... I learn a little bit the sounds, the names of things, and all those things. It’s helping me a lot to communicate. (P8)
As described previously, this participant had exposure to the Todos Santos dialect when
she was growing up. In general, however, there is less contact between Todos Santos
and other Mam-speaking municipalities in Huehuetenango, so Todosanteros often do
not have the same degree of exposure to a dialect like her own. As an interpreter, she
adjusts her accent and lexicon when working with clients from Todos Santos so that
they will understand her better. A teacher from San Juan Ostuncalco described doing
something similar when she taught in Cajolá.
(22) I had to adopt how it is there ... When I said words that were from San Juan the children would laugh because they didn’t understand well. Then I had to talk like they talked there. (P3)
55
Speakers who have had sufficient exposure and are highly motivated in their
communications with speakers from other dialect regions may be able to rely on
accommodation strategies to improve comprehension (see Giles 2016). Both participants
here adjusted their speech patterns in production in order to be successful in their
professional pursuits.
5.6. DIALECTAL DIFFERENCES IN INTERPRETATION SETTINGS IN THE UNITED STATES.
According to an immigration officer in the United States, the majority of Mam
monolinguals encountered in the immigration system have not traveled outside of their
own town, and it is rare that they have a formal education. The primary language of
instruction in Guatemalan secondary schools is Spanish, so if an immigrant arriving in
the US is monolingual in Mam, they most likely did not attend many years of school.
The officer reported that many times, the Mam interpreters tell him that they
understand the client, but the client does not understand them. The interpreters are
professionals, and have considerable practice listening to many different forms of Mam.
The client, on the other hand, typically does not. The officer concluded that ‘it all
comes down to exposure.’ Comparing the situation with Arabic, he said that a Yemeni
client will usually be able to understand an Egyptian interpreter because they often have
experience with Egyptian media. This is rarely the situation for indigenous languages in
Central America; he sees few monolingual Mam immigrants with any exposure to other
varieties.
If an interpreter and client do not understand each other, the interpreter informs the
immigration officer of the difficulty and he asks the translation service to provide
another interpreter. Before doing so, he will find out where the person is from, so that
they can find someone from a similar region. He has found that sometimes they could
both be from the San Marcos department, but not from the same town, and they will not

56
understand each other. He considers the variety in Todos Santos to be ‘completely
different’ from the other varieties in Huehuetenango and mentioned that he usually
needs someone who is also from Todos Santos to interpret.
The interviews with the immigration officer and the Mam interpreter both
demonstrated that regional varieties and reduced comprehension are major concerns for
them during interpreted conversations. Both make sure to ask clients where they are
from and if they understand the interpreter. They both report that geography alone is not
sufficient for predicting if a client and interpreter will be able to understand one
another. The fact that both parties come from the same department in Guatemala does
not mean that they will be able to understand one another well. The interpreter and the
officer are also both very aware of the role that exposure plays in a client’s ability to
understand the interpreter. Because clients often have less experience hearing other
regional varieties than the interpreter does, an asymmetrical situation results, in which
the interpreter can understand the client much better than the reverse.
In general, Mam-speaking participants took great pride in their language, across all
of its dialects, and reported positive attitudes towards speakers of other varieties. The
majority of participants here were well-educated and had professional careers, mostly as
teachers, that occasionally brought them in contact with people from other Mam-
speaking regions. In eight interviews, only two participants reported very low
comprehension of a recording from a different region. A participant from the Southern
group was unable to understand a speaker from Todos Santos, and a participant from
the Seleguá group was unable to understand a speaker from the Southern group. In both
cases, the participant had little or no contact with the people from the region in
question. Degree of exposure plays a large role in a speaker’s ability to understand a
variety of Mam that is not in the same group as their own, and interpreters and teachers

57
who accommodate the speech patterns of other dialects have successfully improved
comprehension with their clients and students.
6. DISCUSSION. The current analysis of Mam regional dialects was proposed in
response to a dramatic increase in the number of Mam speakers in the United States,
who are often interacting with immigration authorities, courts, schools, and hospitals
with the aid of an interpreter. Given previous observations of a high degree of variation
between dialects, it is of interest to investigate how well speakers from different regions
are able to understand each other and whether dialectal differences prevent an
interpreter from being able to successfully work with a client.
Section 6.1 summarizes the results of both the computational and sociocultural
analyses presented in this paper and discusses how they interact to build a fuller
understanding of intelligibility between dialects. Section 6.2 directly addresses some of
the criticisms of Levenshtein distance as a method in dialectology and argues that it is
an appropriate and effective tool for the present purpose. Finally, Section 6.3 contains
recommendations regarding the matching and professional development of Mam
interpreters in the United States.
6.1. SUMMARY. The results of the phonetic distance analysis show four main dialect
groups: Western, Southern, Seleguá, and Todos Santos. These groups are partially
predictable geographically, but not completely. For example, Todos Santos appears very
close to the Seleguá group on a map but has its own distinct branch in the network.
A distance matrix or network figure is meaningless without qualitative observations
that allow us to interpret and scale the quantitative information. The results of
previously published dialect opinion surveys (Godfrey & Collins 1987) indicate that
intelligibility is high between members of each of the four groups, but do not include
information about the degree of intelligibility across groups. The second part of the
58
current analysis, the sociocultural interviews with Mam speakers, addresses this
question. Participants with no exposure to an across-group dialect reported low
comprehension, but a small amount of personal experience with that dialect improved
comprehension greatly. To continue with the example from the previous paragraph,
interviews confirmed that speakers from the Todos Santos and Seleguá groups are not
easily able to understand one another unless they have had exposure to the other dialect.
The phonetic distance network is a proxy for ‘inherent intelligibility’, how similarity
between two linguistic forms can help speakers of different varieties to understand one
another. However, patterns of contact and social attitudes also play large roles in
intelligibility. High levels of contact among communities across regions would indicate
that real-world intelligibility tends to be higher than the phonetic distance network
suggests. Likewise, negative attitudes towards other Mam communities and their
language varieties would indicate that intelligibility tends to be lower than the network
suggests, i.e., that functional intelligibility could be quite low even between varieties
that are phonetically very similar. The sociocultural interviews examine the roles of
these two factors. The findings, low inter-group contact and overall positive attitudes,
suggest that intelligibility predictions based on phonetic distance will not be radically
affected by community-level social factors.
With regard to Mam interpretation in the United States, interviews with an
immigration officer and a Mam interpreter revealed that dialectal differences are a real
challenge in this setting. It is not infrequent that an interpreter and a client find that they
cannot understand each other well, and that a new interpreter from a different region
must be found. Often, the interpreter will understand the client better than the reverse,
because the interpreter has more exposure to a variety of Mam dialects.

59
6.2. USE OF LEVENSHTEIN DISTANCE IN DIALECTOLOGY. The present investigation of
intelligibility between language varieties relies on an algorithm, Levenshtein distance,
that is insensitive to many linguistic features and complexities. In Section 2.4, the
method was justified by pointing to a number of studies across language families that
correlate Levenshtein distance between cognates with results of comprehension tests.
Here, I discuss some of the criticisms of computational approaches and why
Levenshtein distance might be a more appropriate proxy for intelligibility than is
immediately apparent.
First, an algorithm that treats all edits between two words equally has been criticized
as blunt or reductionist in this application (see McMahon et al. 2007). Indeed, many
dialectology researchers have worked to refine the method by incorporating more fine-
grained articulatory or acoustic distances between particular sounds (see Heeringa 2004,
Kessler 2005, Heeringa et al. 2006). However, even complex systems of weighted edit
costs based on distances between spectrogram images have not improved the predictive
power of the algorithm (Heeringa et al. 2006).
In retrospect, these results are not surprising. A model of intelligibility should model
perceptual distances, not production ones. Linguists have a convenient proxy for
perceptual distances in the form of phonemic transcriptions. Phonemes are perceptual
categories; differences within categories are minimized and differences across
categories are amplified. An implementation of Levenshtein distance that uses phonemic
transcriptions as input is already sensitive to changes that the listener deems
meaningful. Judging from comments in the interview portion of the study, a
Levenshtein distance approach based on phonemes may even have parallels with folk
perceptions of how Mam dialects differ: ‘they have this accent, this pronunciation ....
sometimes they insert in more [sounds], and sometimes they get rid of some’ (P2). The
60
participant is describing insertions and deletions, two of the edits quantified by the
Levenshtein distance algorithm.
Second, phonetic distance algorithms are sometimes tainted by their association with
lexical similarity measures, as they are both methods that distill complex linguistic
relationships into numbers. However, as discussed in Section 2.4, researchers have
found phonetic distance to be a more consistently strong proxy for modeling
intelligibility than lexical similarity. Conceptually speaking, there are a number of
advantages. Phonetic distance captures both phonological and morphological
differences. If a morpheme is different from one variety to the next, it will lead to more
edits and increase the overall distance. Lexical similarity is limited to the lexical level.
Additionally, it can reasonably be hypothesized that phonetic distance is less sensitive to
the subjective choice of which words belong in the comparison list than lexical
similarity is. With a sufficient number of cognates, the algorithm should be able to
account for a large cross-section of different sound changes. One could further test this
hypothesis by comparing the stability of lexical similarity and phonetic distance results
with resampled word lists.
Finally, the fact that phonetic distance-based trees and networks of dialect
relationships are accurate on a broad level but not a fine-grained one is sometimes seen
as a liability, especially in applications that involve mapping historical relationships (see
Kessler 1995). However, this is largely inconsequential when determining intelligibility.
In the present analysis, the network consistently produced four main groups under
resampling, but the inner structures of some of those groups were random. From the
results of opinion surveys and interviews, the dialectal differences within those branches
were not found to be an impediment to intelligibility. Intelligibility is a multi-faceted
concept that is dependent on an individual’s background, the topic and medium of

61
conversation, attitudes and bias at both individual and social levels, and many other
factors in addition to the structural similarities between language varieties. One cannot
make strong and detailed claims about intelligibility between linguistic communities as
wholes; one can only estimate how language structure and social factors influence
comprehension in a theoretical average interaction. A blunt tool, such as a network that
shows general tendencies, is not so much limiting as it is appropriate for the application.
6.3. RECOMMENDATIONS FOR MAM INTERPRETERS IN THE UNITED STATES. Regional
dialectal variation is a challenge for Mam interpreters and those working with them in
the United States. It is not uncommon for an interpreter or client to say that they do not
understand the other party well, and for a new interpreter to be sought out. Whether or
not people from two different Mam-speaking municipalities can be reasonably expected
to understand one another is not fully predictable from geography. In interviews, both
the Mam interpreter and the immigration officer mentioned that they had noticed
dramatic differences or reduced comprehension between dialects in municipalities that
are both in the San Marcos department. Likewise, they both commented on
comprehension difficulties between speakers from Todos Santos and speakers from the
other nearby municipalities within the Huehuetenango department. Both observations
are consistent with the groupings presented in the phonetic distance analysis, which split
San Marcos into Western and Southern branches, and Huehuetenango into Seleguá and
Todos Santos branches.
Since department boundaries do not offer an adequate predictor of how well
speakers will understand one another, the officer sometimes specifically requests an
interpreter from the same hometown as the client. However, there is a shortage of Mam
interpreters working in the US and finding a professional in the first place can be a
lengthy process (Sanchez 2018). Initially assigning interpreters based on the four groups

62
outlined in Table 7 can limit the number of times that a new interpreter must be found,
and can facilitate the search for an interpreter by expanding the options to people
beyond the client’s hometown.
Both the immigration officer and Mam interpreter also commented on asymmetries
in comprehension when the interpreter and client are from different regions. The
interpreter, as a professional, tends to have exposure to and practice understanding
diverse dialects, but the client typically does not. The interpreter will understand the
client much better than the reverse. The interpreter interviewed in the present work
combats that asymmetry by adopting the words and accent of clients from another
municipality. Professional development that includes exposure to a variety of Mam
dialects, as well as coaching on reproducing non-native accents, would help interpreters
to work successfully with a wider variety of clients.
7. CONCLUSION. This investigation estimated the degree of intelligibility between
regional dialects of Mam. Using the Levenshtein distance algorithm to compare words
in previously collected word lists, a phonetic distance matrix was calculated for 23
municipalities. This was clustered and visualized in a network figure, using the
Neighbor-Net method. Four main groups emerged; the Western group included Tectitán
and Tacaná, the Southern group included municipalities in the Quetzaltenango
department as well as Comitancillo and Tajumulco, the Seleguá group included
municipalities near the Seleguá Valley in Huehuetenango, and the Todos Santos
varieties were a group by themselves. These groups can be used to make informed
decisions about matching interpreters and clients in courts, schools, and hospitals in the
US.
A Levenshtein distance-based analysis has previously been published only for
languages of the Indo-European, Sino-Tibetan, and Kra-Dai families. The method’s

63
successful implementation on Mam dialects is a promising sign that it can also provide
good results for other Mayan languages, as well as other indigenous languages of
Mesoamerica. There are populations of indigenous language speakers from many parts
of Mexico, Central, and South America living in the US, and many of these language
communities could benefit from intelligibility studies in order to make
recommendations around interpreter matching. The present method takes advantage of
Swadesh and other word lists, which exist for many language varieties already, and uses
computational tools to glean new information from them, making the possibility of a
comprehensive intelligibility study for many languages much more immediately
attainable.

64
REFERENCES
B’AAYIL, EDUARDO PERÉZ; ZOILA BLANCA LUZ GARCÍA JIMÉNEZ; and ODILIO JIMÉNEZ AJB’EE. 2000. Tx’ixpub’ente tiib’ qyool: Variación dialectal en Mam. Guatemala City: Cholsamaj.
BEIJERING, KARIN; CHARLOTTE GOOSKENS; and WILBERT HEERINGA. 2008. Predicting
intelligibility and perceived linguistic distance by means of the Levenshtein algorithm. Linguistics in the Netherlands 15.13-24.
BENNETT, RYAN. 2016. Mayan phonology. Language and Linguistics Compass 10.455-
514. BOUWER, LEONI. 2007. Intercomprehension and mutual intelligibility among southern
Malagasy languages. Language Matters 38.253-274. BRYANT, DAVID and VINCENT MOULTON. 2004. Neighbor-net: an agglomerative method
for the construction of phylogenetic networks. Molecular Biology and Evolution 21.255-265.
CAMPBELL, LYLE. 2013. Historical linguistics: An introduction. Cambridge: MIT Press. CARCAMO, CINDY. 2016. Ancient Mayan languages are creating problems for today’s
immigration courts. Los Angeles Times. August 9, 2016. Online: https://www.latimes.com/local/california/la-me-mayan-indigenous-languages-20160725-snap-story.html.
CASAD, EUGENE H. 1974. Dialect intelligibility testing. Dallas, TX: Summer Institute of
Linguistics. CHENG, CHIN-CHUAN. 1996. Quantifying dialect mutual intelligibility. New horizons in
Chinese linguistics, ed. by C-T James Huang and Audrey Li Yen Hui, 269-292. Dordrecht: Springer.
COLLINS, WESLEY M. 2005. Codeswitching avoidance as a strategy for Mam (Maya)
linguistic revitalization. International Journal of American Linguistics 71.239-276. DEPARTMENT OF JUSTICE. 2002. Guidance to Federal Financial Assistance Recipients
Regarding Title VI Prohibition Against National Origin Discrimination Affecting Limited English Proficient Persons. Federal Register 67.41455-41472. Online: https://www.govinfo.gov/content/pkg/FR-2002-06-18/pdf/02-15207.pdf
ENGLAND, NORA C. 1983. A grammar of Mam, a Mayan language. Austin: University
of Texas Press. ENGLAND, NORA C. 2017. Mam. The Mayan languages, ed. by Judith Aissen, Nora C.
England, and Roberto Zavala Maldonado, 500-532. New York: Routledge. FLOCCIA, CAROLINE; JEREMY GOSLIN; FRÉDÉRIQUE GIRARD; and GABRIELLE
KONOPCZYNSKI. 2006. Does a regional accent perturb speech processing? Journal of Experiment Psychology: Human Perception and Performance 32.1276-1293.

65
GENTRY, BLAKE. 2015. Exclusion of indigenous language speaking immigrants in the
US immigrants in system, A technical review. Ama Consultants. GILES, HOWARD. 2016. Communication accommodation theory: Negotiating personal
relationships and social identities across contexts. Cambridge: Cambridge University Press.
GODFREY, THOMAS J. and WESLEY M. COLLINS. 1987. Una encuesta dialectal en el área
Mam de Guatemala. Guatemala: Instituto Lingüístico de Verano de Centroamérica. GOOSKENS, CHARLOTTE and WILBERT HEERINGA. 2004. Perceptive evaluation of
Levenshtein dialect distance measurements using Norwegian dialect data. Language Variation and Change 16.189-207.
GOOSKENS, CHARLOTTE. 2006. Linguistic and extra-linguistic predictors of inter-
Scandinavian intelligibility. Linguistics in the Netherlands 23.101-113. GRIMES, JOSEPH E. 1992. Correlations between vocabulary similarity and intelligibility.
Windows on Bilingualism, ed. by Eugene H. Casad, 17-32. Arlington: University of Texas and Summer Institute of Linguistics.
HAMED, MAHÉ BEN. 2005. Neighbour-nets portray the Chinese dialect continuum and
the linguistic legacy of China’s demic history. Proceedings of the Royal Society B: Biological Sciences 272.1015-1022.
HEERINGA, WILBERT; PETER KLEIWEG; CHARLOTTE GOOSKENS; AND JOHN NERBONNE.
2006. Evaluation of string distance algorithms for dialectology. Proceedings of the Workshop on Linguistic Distances, Association for Computational Linguistics, 51-62.
HEERINGA, WILBERT. 2004. Measuring dialect pronunciation differences using
Levenshtein distance. Groningen: University of Gronigen dissertation. HUSON, DANIEL and DAVID BRYANT. 2005. Application of phylogenetic networks in
evolutionary studies. Molecular Biology and Evolution 23.254-267. JOHNSON, ROGER W. 2001. An introduction to the bootstrap. Teaching Statistics 23.49-
54. KAUFMAN, TERRENCE. 1969. Teco: A new Mayan language. International Journal of
American Linguistics 35.154-174. KAUFMAN, TERRENCE. 1976. Proyecto de alfabetos y ortografías para escribir las
lenguas mayances. Antigua: Proyecto Lingüístico Francisco Marroquín. KESSLER, BRETT. 1995. Computational dialectology in Irish Gaelic. Proceedings of the
seventh conference on European chapter of the Association for Computational Linguistics. Morgan Kaufmann Publishers Inc., 60-66.

66
KESSLER, BRETT. 2005. Phonetic comparison algorithms. Transactions of the Philological Society 103.243-260.
LEE, ROBERT J.; ELIZABETH M. BERGMAN; and AZIZ N. ISMAIL. 2010. Becoming an
Arabic court interpreter. National Center for State Courts. Online: https://www.ncsc.org/~/media/Files/PDF/Education%20and%20Careers/State%20Interpreter%20Certification%202/Becoming_an_Arabic_Court_Interpreter_May_2010.ashx
MARTIN, JAMES H., and DANIEL JURAFSKY. 2009. Speech and language processing: An
introduction to natural language processing, computational linguistics, and speech recognition. 2nd edn. Upper Saddle River, NJ: Pearson/Prentice Hall.
MATSUDA, MARI J. 1991. Voices of America: Accent, antidiscrimination law, and a
jurisprudence for the last reconstruction. Yale Law Journal 100.1329-1407. MCMAHON, APRIL; PAUL HEGGARTY; ROBERT MCMAHON; and WARREN MAGUIRE.
2007. The sound patterns of Englishes: Representing phonetic similarity. English Language & Linguistics 11.13-142.
PATRINOS, HARRY A. and EDUARDO VELEZ. 2009. Costs and benefits of bilingual
education in Guatemala: A partial analysis. International Journal of Educational Development 29.594-598.
PELKEY, JAMIN R. 2011. Dialectology as Dialectic: Interpreting Phula Variation. Berlin:
Walter de Gruyter. RICKFORD, JOHN R. and KING, SHARESE. 2016. Language and linguistics on trial:
Hearing Rachel Jeantel (and other vernacular speakers) in the courtroom and beyond. Language 92.948-988.
ROMAINE, SUZANNE. 2002. Language in society: An introduction to sociolinguistics. 2nd
edn. New York: Oxford University Press. RUBIN, DONALD L. 1992. Nonlanguage factors affecting undergraduates’ judgments of
nonnative English-speaking teaching assistants. Research in Higher Education 33.511-531.
SANCHEZ, TATIANA. 2018. Oakland’s growing Mayan community: ‘I can hear people
speak Mam in every corner.’ San Jose Mercury News. September 17, 2018. Online: https://www.mercurynews.com/2018/09/17/oaklands-growing-mayan-community-i-can-hear-people-speak-mam-in-every-corner/
SIMONS, GARY F. 1979. Language variation and limits to communication; Technical
report no. 3. Ithaca, NY: Cornell University dissertation. Online: https://files.eric.ed.gov/fulltext/ED181714.pdf
SIMONS, GARY F. and CHARLES D. FENNIG. 2018. Mam. Ethnologue: Languages of the
world. 21st edn. Dallas, TX: SIL International. Online: https://www.ethnologue.com/language/mam

67
SUMNER, MEGHAN, and ARTHUR G. SAMUEL. 2009. The effect of experience on the perception and representation of dialect variants. Journal of Memory and Language 60.487-501.
SWADESH, MORRIS. 1952. Lexico-statistic dating of prehistoric ethnic contacts: with
special reference to North American Indians and Eskimos. Proceedings of the American Philosophical Society 96.452-463.
TANG, CHAOJU, and VINCENT J. VAN HEUVEN. 2009. Mutual intelligibility of Chinese
dialects experimentally tested. Lingua 119.709-732. UNITED STATES CENSUS BUREAU. 2015. Detailed Languages Spoken at Home and
Ability to Speak English for the Population 5 Years and Over: 2009-2013. Online: https://www.census.gov/data/tables/2013/demo/2009-2013-lang-tables.html
UNITED STATES CENSUS BUREAU. 2018. About Language Use in the U.S. Population.
Online: https://www.census.gov/topics/population/language-use/about.html UNITED STATES DEPARTMENT OF JUSTICE EXECUTIVE OFFICE FOR IMMIGRATION REVIEW.
2017. FY 2016 Statistics Yearbook. Online: https://www.justice.gov/eoir/page/file/fysb16/download
VOEGELIN, CHARLES F., and ZELLIG S. HARRIS. 1951. Methods for determining
intelligibility among dialects of natural languages. Proceedings of the American Philosophical Society 95.322-329.
WOLFF, HANS. 1959. Intelligibility and inter-ethnic attitudes. Anthropological
linguistics 1.34-41. YANG, CATHRYN and ANDY CASTRO. 2008. Representing tone in Levenshtein distance.
International Journal of Humanities and Arts Computing 2.205-219. YANG, CATHRYN. 2012. Classifying Lalo languages: Subgrouping, phonetic distance,
and intelligibility. Linguistics of the Tibeto-Burman Area 35.113-137.

68
APPENDIX A.
Phonetic distance matrix
Source code and data available at https://github.com/m-c-simon/mam-phonetic-distance
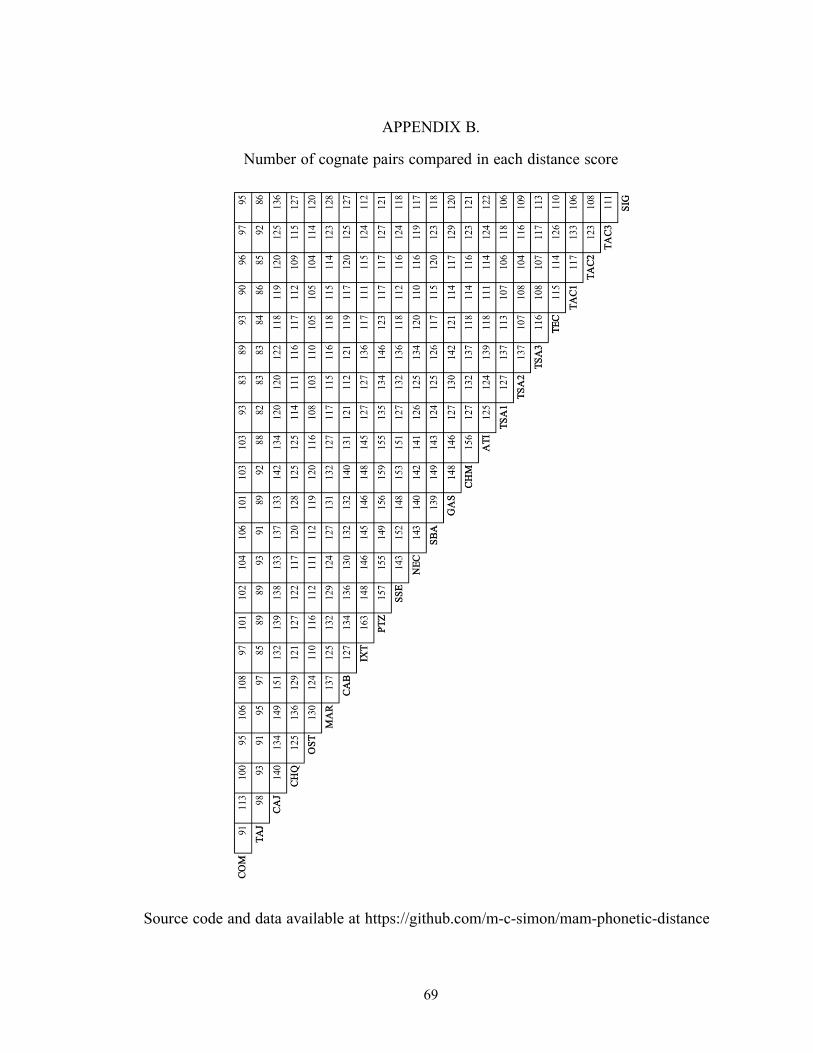
69
APPENDIX B.
Number of cognate pairs compared in each distance score
Source code and data available at https://github.com/m-c-simon/mam-phonetic-distance
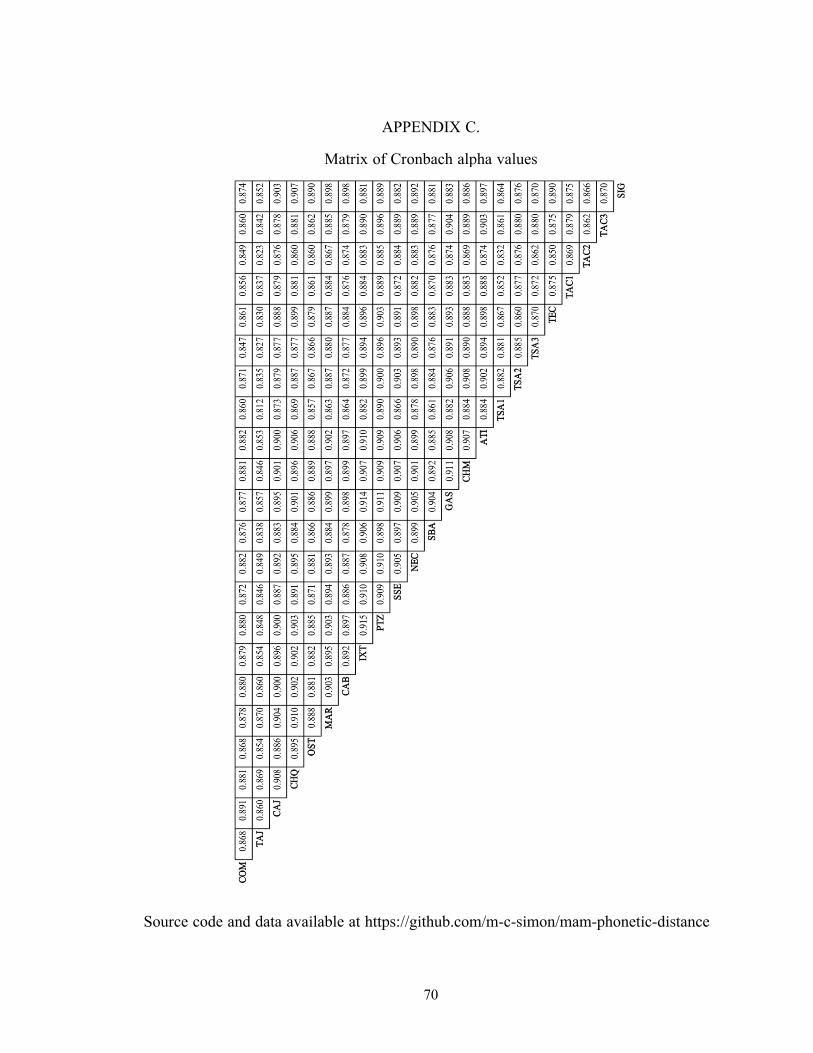
70
APPENDIX C.
Matrix of Cronbach alpha values
Source code and data available at https://github.com/m-c-simon/mam-phonetic-distance

71
APPENDIX D.
Sociocultural interview questions and audio clip prompts
MAM SPEAKERS IN GUATEMALA Do you identify as male or female? How old are you? Where were you born and where did you grow up? Where were your parents born? Your grandparents? Your partner/spouse? What is your native language? Do you speak any other languages? On a scale of 1-5, how fluent are you? Do your parents speak any other languages? How big is your hometown? Did you ever move from one town to another in Guatemala? How often do you travel to different towns? How often do you speak to someone who is not from your hometown? What is your occupation or livelihood? What languages do you speak at school? What languages do you read? What languages do you hear on the radio or television? Do the people in neighboring towns speak the same as you? How well do you understand people from the neighboring towns? In response to audio clips from three regions:
Do you know where this person is from? How do you know? On a scale of 1-5, how well does this person speak Mam? Why? On a scale of 1-5, how beautiful do you think their dialect is? Why? On a scale of 1-5, how much would you like to live where they speak that dialect? Why? On a scale of 1-5, how well do you understand their dialect? Why?
MAM INTERPRETERS IN THE UNITED STATES Do you identify as male or female? How old are you? Where were you born and where did you grow up? How old were you when you left Guatemala? When you came to the US? Where were your parents born? Your grandparents? Your partner/spouse? What is your native language? Do you speak any other languages? On a scale of 1-5, how fluent are you? Do your parents speak any other languages? How big was your hometown? Did you ever move from one town to another in Guatemala? How often did you travel to different towns? How often did you speak to someone who was not from your hometown? What was your occupation or livelihood? What languages and dialects did you speak at school? What languages and dialects did you read? What languages and dialects did you hear on the radio or television? Did the people in neighboring towns speak the same as you? How well did you understand people from the neighboring towns? In response to audio clips from three regions:
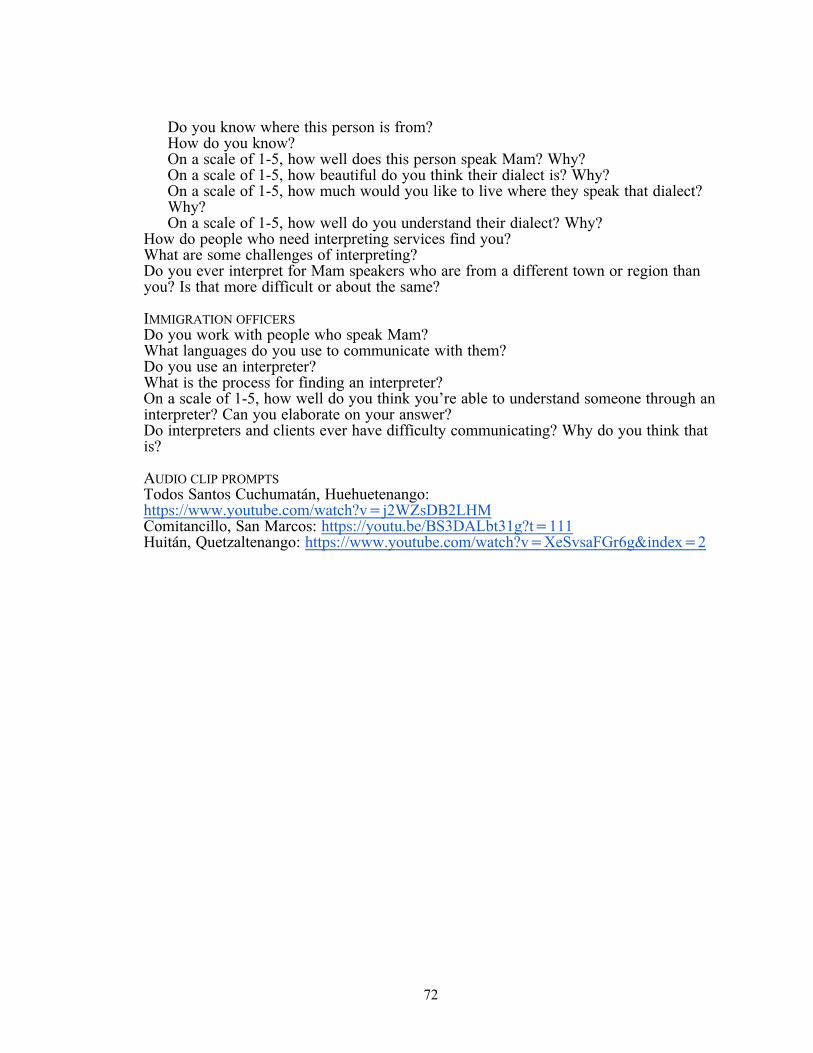
72
Do you know where this person is from? How do you know? On a scale of 1-5, how well does this person speak Mam? Why? On a scale of 1-5, how beautiful do you think their dialect is? Why? On a scale of 1-5, how much would you like to live where they speak that dialect? Why? On a scale of 1-5, how well do you understand their dialect? Why?
How do people who need interpreting services find you? What are some challenges of interpreting? Do you ever interpret for Mam speakers who are from a different town or region than you? Is that more difficult or about the same? IMMIGRATION OFFICERS Do you work with people who speak Mam? What languages do you use to communicate with them? Do you use an interpreter? What is the process for finding an interpreter? On a scale of 1-5, how well do you think you’re able to understand someone through an interpreter? Can you elaborate on your answer? Do interpreters and clients ever have difficulty communicating? Why do you think that is? AUDIO CLIP PROMPTS Todos Santos Cuchumatán, Huehuetenango: https://www.youtube.com/watch?v=j2WZsDB2LHM Comitancillo, San Marcos: https://youtu.be/BS3DALbt31g?t=111 Huitán, Quetzaltenango: https://www.youtube.com/watch?v=XeSvsaFGr6g&index=2