A Pharmacokinetic Bioequivalence Study Comparing ...
12
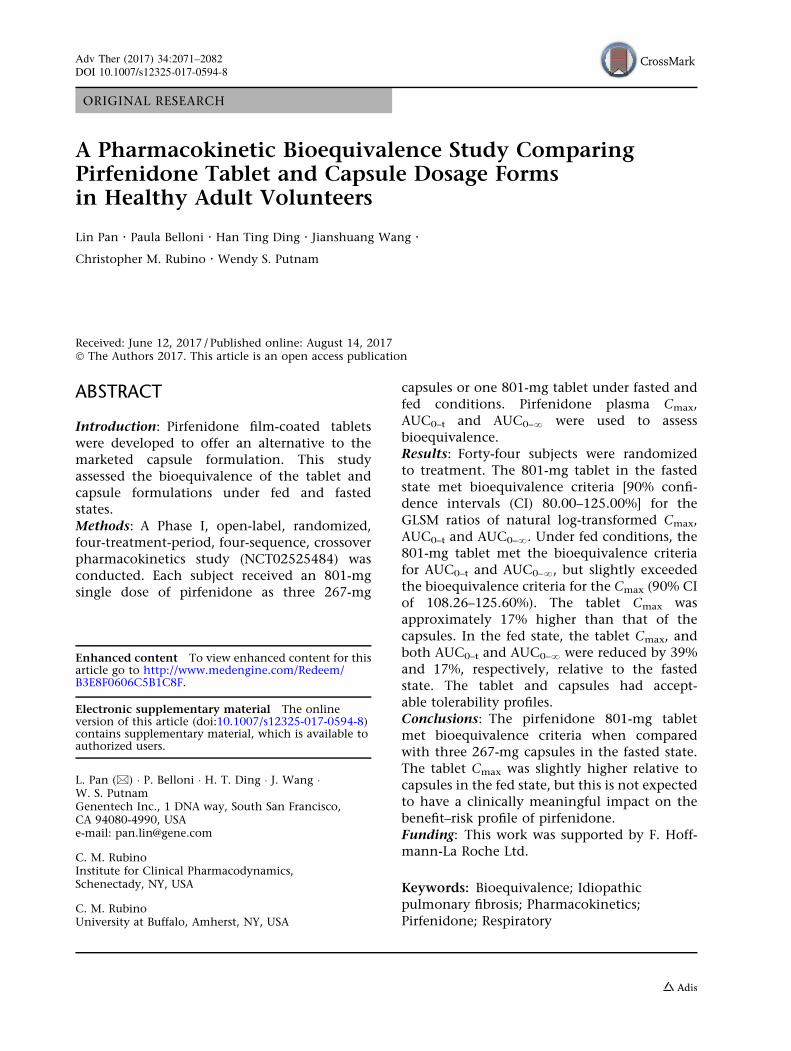
ORIGINAL RESEARCH A Pharmacokinetic Bioequivalence Study Comparing Pirfenidone Tablet and Capsule Dosage Forms in Healthy Adult Volunteers Lin Pan . Paula Belloni . Han Ting Ding . Jianshuang Wang . Christopher M. Rubino . Wendy S. Putnam Received: June 12, 2017 / Published online: August 14, 2017 Ó The Authors 2017. This article is an open access publication ABSTRACT Introduction: Pirfenidone film-coated tablets were developed to offer an alternative to the marketed capsule formulation. This study assessed the bioequivalence of the tablet and capsule formulations under fed and fasted states. Methods: A Phase I, open-label, randomized, four-treatment-period, four-sequence, crossover pharmacokinetics study (NCT02525484) was conducted. Each subject received an 801-mg single dose of pirfenidone as three 267-mg capsules or one 801-mg tablet under fasted and fed conditions. Pirfenidone plasma C max , AUC 0–t and AUC 0–? were used to assess bioequivalence. Results: Forty-four subjects were randomized to treatment. The 801-mg tablet in the fasted state met bioequivalence criteria [90% confi- dence intervals (CI) 80.00–125.00%] for the GLSM ratios of natural log-transformed C max , AUC 0–t and AUC 0–? . Under fed conditions, the 801-mg tablet met the bioequivalence criteria for AUC 0–t and AUC 0–? , but slightly exceeded the bioequivalence criteria for the C max (90% CI of 108.26–125.60%). The tablet C max was approximately 17% higher than that of the capsules. In the fed state, the tablet C max , and both AUC 0–t and AUC 0–? were reduced by 39% and 17%, respectively, relative to the fasted state. The tablet and capsules had accept- able tolerability profiles. Conclusions: The pirfenidone 801-mg tablet met bioequivalence criteria when compared with three 267-mg capsules in the fasted state. The tablet C max was slightly higher relative to capsules in the fed state, but this is not expected to have a clinically meaningful impact on the benefit–risk profile of pirfenidone. Funding: This work was supported by F. Hoff- mann-La Roche Ltd. Keywords: Bioequivalence; Idiopathic pulmonary fibrosis; Pharmacokinetics; Pirfenidone; Respiratory Enhanced content To view enhanced content for this article go to http://www.medengine.com/Redeem/ B3E8F0606C5B1C8F. Electronic supplementary material The online version of this article (doi:10.1007/s12325-017-0594-8) contains supplementary material, which is available to authorized users. L. Pan (&) Á P. Belloni Á H. T. Ding Á J. Wang Á W. S. Putnam Genentech Inc., 1 DNA way, South San Francisco, CA 94080-4990, USA e-mail: [email protected] C. M. Rubino Institute for Clinical Pharmacodynamics, Schenectady, NY, USA C. M. Rubino University at Buffalo, Amherst, NY, USA Adv Ther (2017) 34:2071–2082 DOI 10.1007/s12325-017-0594-8
Transcript of A Pharmacokinetic Bioequivalence Study Comparing ...
ORIGINAL RESEARCH
A Pharmacokinetic Bioequivalence Study ComparingPirfenidone Tablet and Capsule Dosage Formsin Healthy Adult Volunteers
Lin Pan . Paula Belloni . Han Ting Ding . Jianshuang Wang .
Christopher M. Rubino . Wendy S. Putnam
Received: June 12, 2017 / Published online: August 14, 2017� The Authors 2017. This article is an open access publication
ABSTRACT
Introduction: Pirfenidone film-coated tabletswere developed to offer an alternative to themarketed capsule formulation. This studyassessed the bioequivalence of the tablet andcapsule formulations under fed and fastedstates.Methods: A Phase I, open-label, randomized,four-treatment-period, four-sequence, crossoverpharmacokinetics study (NCT02525484) wasconducted. Each subject received an 801-mgsingle dose of pirfenidone as three 267-mg
capsules or one 801-mg tablet under fasted andfed conditions. Pirfenidone plasma Cmax,AUC0–t and AUC0–? were used to assessbioequivalence.Results: Forty-four subjects were randomizedto treatment. The 801-mg tablet in the fastedstate met bioequivalence criteria [90% confi-dence intervals (CI) 80.00–125.00%] for theGLSM ratios of natural log-transformed Cmax,AUC0–t and AUC0–?. Under fed conditions, the801-mg tablet met the bioequivalence criteriafor AUC0–t and AUC0–?, but slightly exceededthe bioequivalence criteria for the Cmax (90% CIof 108.26–125.60%). The tablet Cmax wasapproximately 17% higher than that of thecapsules. In the fed state, the tablet Cmax, andboth AUC0–t and AUC0–? were reduced by 39%and 17%, respectively, relative to the fastedstate. The tablet and capsules had accept-able tolerability profiles.Conclusions: The pirfenidone 801-mg tabletmet bioequivalence criteria when comparedwith three 267-mg capsules in the fasted state.The tablet Cmax was slightly higher relative tocapsules in the fed state, but this is not expectedto have a clinically meaningful impact on thebenefit–risk profile of pirfenidone.Funding: This work was supported by F. Hoff-mann-La Roche Ltd.
Keywords: Bioequivalence; Idiopathicpulmonary fibrosis; Pharmacokinetics;Pirfenidone; Respiratory
Enhanced content To view enhanced content for thisarticle go to http://www.medengine.com/Redeem/B3E8F0606C5B1C8F.
Electronic supplementary material The onlineversion of this article (doi:10.1007/s12325-017-0594-8)contains supplementary material, which is available toauthorized users.
L. Pan (&) � P. Belloni � H. T. Ding � J. Wang �W. S. PutnamGenentech Inc., 1 DNA way, South San Francisco,CA 94080-4990, USAe-mail: [email protected]
C. M. RubinoInstitute for Clinical Pharmacodynamics,Schenectady, NY, USA
C. M. RubinoUniversity at Buffalo, Amherst, NY, USA
Adv Ther (2017) 34:2071–2082
DOI 10.1007/s12325-017-0594-8

INTRODUCTION
Idiopathic pulmonary fibrosis (IPF) is a debili-tating, progressive and fatal lung disease [1–3].Pirfenidone (as a 267-mg capsule) is approvedby the European Medicines Agency (EMA) andthe US Food and Drug Administration (FDA),and is recommended in international treatmentguidelines for the treatment of IPF in themajority of patients [2, 4, 5].
Although the mechanism of action has notbeen fully established, pirfenidone is an antifi-brotic agent that affects multiple biologicalpathways in vivo. Pirfenidone attenuatesfibroblast proliferation and production offibrosis-associated proteins and cytokines, anddecreases biosynthesis and accumulation ofextracellular matrix in response to cytokinegrowth factors [6–8].
Clinical studies in patients with IPF haveshown that pirfenidone reduced the decline inforced vital capacity and the risk of all-causemortality versus placebo at 1 year [9, 10]. Pir-fenidone is generally well tolerated; however,gastrointestinal and skin-related adverse events(AEs) can affect tolerability in some patients,particularly within the first 6 months of treat-ment [11, 12].
Clinical pharmacokinetic (PK) studies havedemonstrated that, after oral administration ofpirfenidone in various oral formulations, peakplasma pirfenidone concentration (Cmax) andarea under the plasma concentration versustime curve (AUC) are significantly higher in afasted versus a fed state [13–15]. The observedreduction in Cmax in the fed state is of clinicalbenefit as pirfenidone-related side effects wereassociated with Cmax [14, 15]. Therefore, pre-scribing information recommends taking pir-fenidone with food [4, 5].
Gradual dose titration on initiation of pir-fenidone can help with the management of AEsand prevent treatment discontinuation [11, 12].Currently, the pirfenidone capsule is availableas a 267-mg capsule and the flexibility offeredby the capsule formulation is key to facilitatingtailored dosing until patients are established ona stable dose of pirfenidone. The recommendedstarting dose is 1 9 267-mg capsule three times
daily (tid) for 1 week, followed by 2 9 267-mgcapsules tid for 1 week, followed by the main-tenance dosage of 3 9 267-mg capsules tid[5, 11]. If AEs occur during pirfenidone treat-ment, temporary dose reduction followed byre-escalation can help to resolve AEs [11].
Once patients are on a stable maintenancedose of 2403 mg/day, they may benefit fromhaving fewer pills to take daily. This couldimprove medication adherence, which isdefined as the degree to which patients followrecommendations on the timing, dosage andfrequency of their medications [16]. Pooradherence may be associated with worse healthoutcomes [17–20] and the prescribed number ofdose units of medication daily may be animportant factor in influencing adherence, withan increasing number of doses associated withpoorer adherence [20–22].
Pirfenidone film-coated 801-mg tablets weredeveloped to provide patients who are tolerat-ing the recommended daily maintenance dosewith an alternative to the 267-mg capsule for-mation. The reduced pill burden of taking1 9 801-mg tablet tid has the potential toincrease adherence in these patients.
The aim of this study was to assess thebioequivalence of pirfenidone after asingle-dose oral administration of 1 9 801-mgtablet compared with a single-dose of3 9 267-mg capsules under fasted and fed states.
METHODS
Study Design
This single-dose, Phase I, open-label, random-ized, four-treatment-period, four-sequence,crossover PK study (NCT02525484) wasdesigned to determine the bioequivalence ofpirfenidone when administered via a tabletversus a capsule formulation in the fed andfasted states (Fig. 1).
Following a screening period of up to28 days, healthy volunteers aged 18–55 yearswere randomized to one of four treatmentsequences, during which the following treat-ments were administered as single oral doses
2072 Adv Ther (2017) 34:2071–2082

(i.e. there was no dose titration as is normallyused in patients with IPF; Fig. 1):• Treatment A = pirfenidone 3 9 267-mg
capsules in the fed state.• Treatment B = pirfenidone 1 9 801-mg
tablet in the fed state.• Treatment C = pirfenidone 3 9 267-mg
capsules in the fasted state.• Treatment D = pirfenidone 1 9 801-mg
tablet in the fasted state.Knowledge of the dosage form (i.e. tablet or
capsule) would not influence the PK assessment;hence, the study was not blinded to simplify thestudy conduct. However, persons involved inanalyzing the PK datawere blinded as towhetherthe sample was following tablet or capsuleadministration until the PK parameters weredetermined. A 4 9 4 Williams study design wasused, with the four possible treatment sequencesbeing ACBD, BADC, CDAB and DBCA (Fig. 1).Subjects remained at the clinic for 12 nights,from the day before the first dose of the studydrug until 48 h after the last dose of the studydrug following completion of safety assessments.Study drug was administered on Days 1, 4, 7 and10, with a 72-h washout period between theadministration of doses to ensure sufficientwashout based on a half-life of 2–3 h (Fig. 1).
Under fed conditions, pirfenidone wasadministered after a high-fat and high-caloriemeal, consumed after an overnight fast as per
guidance from global regulatory agencies[23, 24]. Each high-fat breakfast consisted ofapproximately 840 calories, provided from 32 gof protein, 54 gof fat, and57 gof carbohydrate. Atypical breakfast included two fried eggs, twostrips of bacon, two slices of toast, two pats ofbutter, four ounces of hash brown potatoes, andeight fluid ounces of whole milk. Under fastingconditions, pirfenidone was administered afteran overnight fast of at least 10 consecutive hours.
To be eligible for participation in the study,subjects were required to be non-smokers, ingood health, and with no significant medicalhistory (in the opinion of the investigator). Par-ticipants also agreed to abstain from alcohol,caffeine, cruciferous vegetables and strenuousexercise for the duration of the study. The studywas conducted in accordance with the Interna-tional Conference on Harmonisation Guideli-nes, the Declaration of Helsinki and relevantlocal legal and regulatory requirements. Writteninformed consent was obtained from each sub-ject before any study procedureswere performed.
Sample Collection
Blood samples (4 mL) for the harvesting ofplasma to determine plasma pirfenidone con-centrations and PK calculations were drawn inEDTA vacutainer tubes on Days 1, 4, 7 and 10:
Fig. 1 Study design. ICF informed consent, PK pharmacokinetic a Discharge after completion of PK blood draws andassessments
Adv Ther (2017) 34:2071–2082 2073

up to 3 h pre-dose and 0.25, 0.5, 1, 1.5, 2, 3, 4, 6,8, 10, 12, 16 and 24 h post-dose.
Bioanalytical Methods
A validated liquid chromatography tandemmass spectrometric (LC–MS/MS) method was
used to determine the concentration of pir-fenidone in K2EDTA-treated plasma samples.Pirfenidone and the deuterium-labeled internalstandard, pirfenidone-d5, were extracted fromplasma, by means of supported liquid extrac-tion. The LC–MS/MS analysis was carried outwith a Phenomenex (Torrance, CA, USA)
Table 1 Summary of subject demographics at baseline
Treatment sequencea
ACBD n5 11 BADC n 5 11 CDAB n5 11 DBCA n5 11 Total n5 44
Median (min, max) age, years 33.0 (20, 53) 28.0 (21, 49) 41.0 (25, 54) 38.0 (20, 50) 33.0 (20, 54)
Male, n (%) 5 (45.5) 8 (72.7) 9 (81.8) 6 (54.5) 28 (63.6)
Race, n (%)
White 6 (54.5) 6 (54.5) 5 (45.5) 7 (63.6) 24 (54.5)
Black or African American 5 (45.5) 5 (45.5) 4 (36.4) 3 (27.3) 17 (38.6)
Other 0 0 2 (18.2) 1 (9.1) 3 (6.8)
Mean (SD) weight (kg) 73.9 (13.0) 71.2 (13.4) 85.3 (14.1) 77.8 (11.0) 77.0 (13.6)
Mean (SD) height (cm) 168.6 (7.1) 168.8 (8.4) 177.4 (11.4) 170.0 (10.3) 171.2 (9.8)
Mean (SD) BMI (kg/m2) 25.9 (3.3) 24.9 (3.7) 26.9 (2.3) 26.9 (2.9) 26.1 (3.1)
BMI body mass index, SD standard deviationa Treatment A = 3 9 267-mg capsules in the fed state; treatment B = 1 9 801-mg tablet in the fed state; treatmentC = 3 9 267-mg capsules in the fasted state; treatment D = 1 9 801-mg tablet in the fasted state
Table 2 PK parameters of pirfenidone following single-dose administration in the fed and fasted states
PK parameter Geometric mean (CV%)
Fed state (n5 43) Fasted state (n 5 42)
33 267-mg capsules 1 3 801-mg tablet 33 267-mg capsules 1 3 801-mg tablet
Cmax (ng/mL) 6560 (25.5) 7640 (27.9) 12,500 (27.9) 12,600 (32.8)
AUC0–t (ng h/mL) 39,500 (36.6) 40,600 (35.0) 49,500 (34.5) 49,200 (35.1)
AUC0–? (ng h/mL) 39,800 (37.0) 40,900 (35.5) 49,700 (34.9) 49,400 (35.5)
tmax (h)a 3.00 (0.50, 6.00) 2.05 (1.00, 6.00) 0.75 (0.25, 2.00) 1.00 (0.25, 3.00)
t1/2 (h) 2.75 (0.585) 2.74 (0.579) 2.77 (0.589) 2.77 (0.571)
AUC0–? area under the plasma concentration versus time curve from time zero to infinity, AUC0–t area under the plasmaconcentration versus time curve from time zero to the time of the last quantifiable concentration, Cmax peak plasmaconcentration, CV coefficient of variation, PK pharmacokinetic, t1/2 terminal elimination half-life, tmax time to peak plasmaconcentrationa Median (minimum, maximum)
2074 Adv Ther (2017) 34:2071–2082

Gemini� C18 column on a Shimadzu (Kyoto,Japan) Prominence� HPLC system coupled witha Sciex (Framingham, MA, USA) API 4000TM
triple quadrupole mass spectrometer. Pir-fenidone concentrations were calculated using a1/x2 weighted linear regression over a rangefrom 5.00 to 3000 ng/mL. This method offeredacceptable accuracy and precision. Validationmethods confirmed that study samples with apirfenidone concentration above 3000 ng/mLcould be measured following dilution, with adilution quality control sample of 50,000 ng/mL accurately measured after a 100-fold dilu-tion with blank human plasma. There was noevidence of carryover that could adversely affectthe quantitation of pirfenidone.
PK and Bioequivalence Analyses
Primary PK parameters in this study includedthe observed maximum plasma concentration(Cmax), area under the plasma concentrationversus time curve from time zero to the time ofthe last quantifiable concentration (AUC0–t) andAUC from zero extrapolated to infinity(AUC0–?.). Secondary PK parameters includedobserved time to reach peak concentration(tmax), and elimination half-life (t1/2). PKparameters for pirfenidone were estimated fromindividual plasma concentration versus timeprofiles using a non-compartmental approachwith Phoenix� WinNonlin� 6.3 (Certara USA,St. Louis, MO, USA).
Bioequivalence between the test treatment(1 9 801-mg pirfenidone tablet) and the refer-ence treatment (3 9 267-mg pirfenidone cap-sules) was assessed by calculating two-sided 90%confidence intervals (CIs) for the geometricleast-squares means (GLSM) ratio between thetwo treatments for both the fed and fastedstates. An analysis of variance (ANOVA) wasperformed on the natural log-transformed pri-mary PK measurements: Cmax, AUC0–t andAUC0–?. The 90% CIs of the GLSM ratio of thetest treatment to the reference treatment werecalculated by taking the anti-log of the corre-sponding 90% CIs for the differences betweenthe means on the log scale. Bioequivalence wasestablished if the 90% CI for the ratio was
within bioequivalence limits of 80.00% to125.00% [23, 24].
Power calculations indicated that a total of36 subjects would provide 85% power to
Fig. 2 Mean plasma concentrationa versus time profileswith a linear and b semi-logarithmic scales. Plasmaconcentration values below limit of quantitation (BLOQ)were set to zero except when a BLOQ fell between twoquantifiable values, in which case it was treated as missingdata. One subject who was fasted and fed and one subjectwho was fasted only were excluded from descriptivestatistics calculations because of vomiting within 6 h ofdosing a Mean concentration calculated from individualplasma concentration at the same time point
Adv Ther (2017) 34:2071–2082 2075

conclude bioequivalence if the true ratiobetween the pirfenidone capsule and tablet was0.95 to 1.05 and the intra-subject coefficient ofvariation was 0.26. The intra-subject coefficientof variation value was selected based on thelargest value reported in a previous PK study ofthe pirfenidone capsule formulation [14]. Toensure that at least 36 subjects would completeall study periods with adequate PK data, 44subjects were enrolled in the study.
Safety Evaluation
All AEs (including those leading to treatmentdiscontinuation and of special interest) thatoccurred on or after the first dose of study
medication were recorded using Medical Dic-tionary for Regulatory Activities Version 18.0 andlistedbydosing condition.Changes frombaselinein laboratory parameters and vital signs were alsorecorded [please refer to the online supplementfor details]. A graphical examination of theexposure–response relationshipwas conducted toexplore a potential relationship between drugexposure and the occurrence of AEs.
RESULTS
Subjects
Of 97 subjects screened for inclusion, a total of44 subjects were randomized to one of the fourtreatment sequences (Fig. 1). All subjects com-pleted treatment and had blood samples col-lected at a minimum of 10 time points pertreatment period, with at least one sampleC16 h post-dose. One subject was excludedfrom the PK analysis for all treatments due toemesis following administration of pirfenidone1 9 801-mg tablet in the fed state and pir-fenidone 3 9 267-mg capsules in the fastedstate. Another subject experienced emesis fol-lowing administration of pirfenidone1 9 801-mg tablet in the fasted state and wasexcluded from the PK analyses in the fastedstate. Therefore, a total of 43 subjects wereincluded in the PK population in the fed state,and 42 subjects were included in the PK popu-lation in the fasted state. All 44 subjects wereincluded in the safety population. Subjectdemographics are presented in Table 1.
Table 3 Statistical assessment of bioequivalence comparing pirfenidone 3 9 267-mg capsules and 1 9 801-mg tablet in thefed and fasted states
PK parameter Tablet vs. capsules, % GLSM ratio (90% CI)
Fed state (n5 43) Fasted state (n5 42)
Cmax (ng/mL) 116.61 (108.26, 125.60) 101.26 (94.41, 108.60)
AUC0–t (ng h/mL) 103.06 (99.55, 106.69) 99.63 (96.66, 102.69)
AUC0–? (ng h/mL) 103.05 (99.54, 106.69) 99.61 (96.64, 102.68)
AUC0–? area under the plasma concentration versus time curve from time zero to infinity, AUC0–t area under the plasmaconcentration versus time curve from time zero to the time of the last quantifiable concentration, CI confidence interval,Cmax peak plasma concentration, GLSM geometric least-squares mean, PK pharmacokinetic
Table 4 Statistical assessment of bioequivalence compar-ing pirfenidone 1 9 801-mg tablet in the fed and fastedstates
PK parameter Feda vs. fastedb, % GLSMratio (90% CI)
Cmax (ng/mL) 60.54 (55.82, 65.67)
AUC0–t (ng h/mL) 82.56 (80.03, 85.17)
AUC0–? (ng h/mL) 82.68 (80.14, 85.29)
AUC0–? area under the plasma concentration versus timecurve from time zero to infinity, AUC0–t area under theplasma concentration versus time curve from time zero tothe time of the last quantifiable concentration, CI confi-dence interval, Cmax peak plasma concentration, GLSMgeometric least-squares mean, PK pharmacokinetica n = 43b n = 42
2076 Adv Ther (2017) 34:2071–2082

PK Analyses
In the fasted state, pirfenidone PK, measuredusing the geometric mean AUC0–t, AUC0–?, andCmax, was similar between the tablet and cap-sules (Table 2). Mean pirfenidone plasma con-centration–time profiles stratified by treatmentare presented in Fig. 2. Median tmax were similarbetween the tablet and capsules (Table 2).
In the fed state, pirfenidone PK, as measuredusing the geometric mean AUC0–t and AUC0–?,was similar between the pirfenidone 1 9 801-mgtablet and the pirfenidone 3 9 267-mg capsules(Table 2). The geometric mean Cmax for the pir-fenidone tablet was approximately 17% highercompared with the capsules [geometric mean (%coefficient of variation)= 7640 (27.9) vs. 6560(25.5) ng/mL, respectively) (Table 2). Mediantmax was approximately 1 h shorter with thetablet than the capsules [median (min,max)= 2.05 (1.00, 6.00) vs. 3.00 (0.50, 6.00) h,respectively] (Table 2).
Bioequivalence Analysis
Under the fasted state, standard bioequivalencecriteria were met for the GLSM ratios of natural
log-transformed Cmax, AUC0–t and AUC0–? forthe pirfenidone 1 9 801-mg tablet (Table 3). Inthe fed state, the 90% CI values for the GLSMratios of natural log-transformed AUC0–t andAUC0–? met standard bioequivalence criteria(Table 3). The upper CI value for the naturallog-transformed Cmax for the tablet slightlyexceeded the standard bioequivalence criteria(by 0.6%), with a value of 125.60% comparedwith capsules (Table 3).
Food Effect
Following administration of the pirfenidone1 9 801-mg tablet, pirfenidone PK, as mea-sured by AUC0–t and AUC0–?, was approxi-mately 17% lower in the fed state comparedwith the fasted state, with 90% CI values of80.03–85.17% and 80.14–85.29%, respectively(Table 4). Following administration of thetablet, Cmax values were approximately 39%lower in the fed state compared with the fas-ted state, with 90% CI values of 55.82–65.67%(Table 4). The effect of food on pirfenidone PKwas consistent between the tablet and capsuleformulations.
Table 5 Adverse events
n (%) Fed state Fasting state Totala
33 267-mgcapsules n5 44
1 3 801-mgtablet n5 44
3 3 267-mgcapsules n5 44
1 3 801-mgtablet n5 44
Nausea 0 3 (6.8) 8 (18.2) 10 (22.7) 13 (29.5)
Dizziness 0 1 (2.3) 4 (9.1) 6 (13.6) 8 (18.2)
Headache 0 2 (4.5) 2 (4.5) 3 (6.8) 4 (9.1)
Constipation 0 3 (6.8) 0 1 (2.3) 4 (9.1)
Vomiting 0 1 (2.3) 1 (2.3) 1 (2.3) 2 (4.5)
Dyspepsia 0 0 1 (2.3) 1 (2.3) 2 (4.5)
Oral paresthesia 0 0 1 (2.3) 0 1 (2.3)
Pollakiuria 0 1 (2.3) 0 0 1 (2.3)
Vulvovaginal pruritus 0 0 0 1 (2.3) 1 (2.3)
Hot flush 1 (2.3) 0 0 0 1 (2.3)
a Total counts are provided for the entire study with each subject counted only once
Adv Ther (2017) 34:2071–2082 2077

Fig. 3 Distribution of a Cmax and b AUC0–? in the fedtreatment period by subjects with and without AEs.Box and whisker plot defines the interquartile range; centerline is the median; symbol is the mean; whiskers are theupper and lower limits of 1.5 times the interquartile range.
Each subject is presented once within each treatment, forall subjects and by AE, reported or not. AE adverse event,AUC0–?, area under the plasma concentration versus timecurve from time zero to infinity, Cmax peak plasmaconcentration
2078 Adv Ther (2017) 34:2071–2082
Safety
A total of 22 (50.0%) subjects experienced at leastone AE during the study. All AEs were rated asmild, and no serious AEs, deaths or AEs of specialinterest (cases of potential drug-induced liverinjury and suspected transmission of an infec-tious agent by the study drug) were reported.
The most frequently (C2) reported AEs werenausea [13 (29.5%)], dizziness [8 (18.2%)],headache [4 (9.1%)], constipation [4 (9.1%)],vomiting [2 (4.5%)] and dyspepsia [2 (4.5%)](Table 5). A smaller proportion of subjectsexperienced AEs in the fed state versus the fas-ted state for both the tablet [7 (15.9%) vs. 16(36.4%), respectively] and the capsules [1 (2.3%)vs. 14 (31.8%), respectively]. There was noapparent relationship between drug exposureand AEs based on a graphical examination ofthe exposure–response relationship (Fig. 3).
DISCUSSION
The EMA bioequivalence guideline suggests thattesting under fasted conditions is more sensitivein detecting differences between formulationsthan under fed conditions. However, theguidelines also suggest that bioequivalencestudies should generally be conducted underfed conditions for products recommended foradministration with food [23]. Similarly, theFDA recommends conducting bioequivalencestudies under fasting and fed conditions for allorally administered immediate-release drugproducts [24].
In a previous PK study of the pirfenidonecapsule formulation in healthy volunteers, thepresence of food was associated with a reductionin Cmax value versus the fasted state, which wascorrelated with a reduction in gastrointestinalAEs [14]. This finding reflects clinical practice,with patients advised to take pirfenidone with orafter a meal; therefore, this study also investi-gated the PK and bioequivalence of the pir-fenidone tablet formulation under fedconditions. Consistent with the previous study,our results indicate that the presence of foodreduces the rate and extent of pirfenidoneabsorption from the tablet formulation. A
statistically significant reduction in pirfenidoneCmax was observed in the fed state versus thefasted state; whereas no statistically significantdifferences were observed for AUC0–t and AUC0–?
measurements. The results of this study demon-strate that, in the fasted state, the pirfenidone19 801-mg tablet is bioequivalent to 39 267-mgcapsules. In the fed state, the bioequivalence cri-teria were met based on AUC0–t and AUC0–?
measurements, whereas the upper bound of the90% CI values for Cmax (125.6%) was slightlyoutside the bioequivalence limits (by 0.6%).
The higher Cmax and shorter median tmax
with the tablet formulation compared with thecapsules suggest that pirfenidone undergoes fas-ter absorption following administration of thetablet compared with the capsules when food ispresent. It is possible that release of pirfenidonefrom the capsule at the site of absorption isdelayed following a high-fat meal. One hypoth-esis is that multiple lighter capsules may float inthe fed stomach, whereas a single heavier tabletmay sink and mix more readily, ultimatelydelaying gastric emptying for the more buoyantcapsules compared with the tablet [25].
The high-fat meal consumed during thisstudy represented extreme dietary conditions,with subjects consuming approximately 800–1000 calories, of which 50% were from fat. EMAand FDA guidelines recommend conducting fedbioequivalence studies using a high-fat,high-calorie meal to provide the greatest effecton gastrointestinal physiology, thereby a max-imum food effect on systemic drug bioavail-ability could be investigated [23, 24]. Inpractice, dietary conditions would likely beintermediate to the fasted and fed states utilizedin this study, and, therefore, the 17% increasesin Cmax between the tablet and capsule formu-lations are not expected to have a clinicallymeaningful impact on the benefit–risk profile ofpirfenidone in patients with IPF.
During this study, all AEs were mild, with nodiscontinuations, serious AEs or deaths repor-ted. The results are consistent with the knownsafety profile of pirfenidone [4, 5]. Overall, asmaller proportion of subjects experienced AEsin the fed state compared with the fasted statewith both the tablet and capsule formulations.The observed food effect on the AE profile is
Adv Ther (2017) 34:2071–2082 2079
consistent with that observed in previous stud-ies for pirfenidone capsules [14], and reinforcesthe importance of taking pirfenidone with food,as has been noted previously [11]. However, it isnotable that, in the fed state, only one AE of hotflush was reported with the capsule. This is incontrast to previous studies of the capsule in thefed state in which more AEs, including nauseaand dizziness, were observed [14].
Previous studies suggested that Cmax and riskof adverse gastrointestinal events were correlated[14]. In this study, under the fasted state, bothformulations had similar incidences of AEs and asimilar Cmax was observed between the twodosage forms. In the fed state, a greater propor-tion of subjects experienced AEs with the tabletformulation compared with the capsule formu-lation. Although Cmax was slightly higher withthe tablet versus the capsule formulation, therewas no apparent relationship between drugexposure and AEs based on a graphical exami-nation of the exposure–response relationship.For the tablet under fed conditions, the mean ormedian Cmax (or AUC0–?) values for the subjectswho experienced AEs were trending higher;however, the overall distribution of individualexposure values for these subjects when com-pared with the subjects without AEs is similar.Taken together, these observations indicate thatthe slightly higher Cmax observed with the tabletrelative to the capsules in the fed state in thisstudy is not expected to have a clinically mean-ingful impact on safety.
Clinical studies in patients with IPF haveshown that pirfenidone reduces the decline inforced vital capacity and the risk of all-causemortality versus placebo at 1 year [9, 10]. How-ever, IPF is a chronic, progressive condition thatrequires long-term treatment. The simplifieddosing regimen offered by the pirfenidone801-mg tablet formulation may enhance long-er-term adherence in patients once they areestablished on the recommended maintenancedose. Additional dose strengths, including 267-and 534-mg tablets, will accommodate the rec-ommended dose titration and flexible dosemodification until treatment is stabilized.Assessing the bioequivalence of the highest singledose is in accordance with the EMA and FDAguidelines, which state that it is sufficient to
establish bioequivalence with the highest dose[23, 24]. Therefore, the results from this bioe-quivalence study, together with in vitro dissolu-tion testing, support a biowaiver request for the267- and 534-mg strengths of pirfenidone tablets.
Although our study was conducted inaccordance with EMA and FDA guidelines onthe investigation of bioequivalence [23, 24], thelimitations of our methodology should beacknowledged. The subjects included in ourstudy were healthy volunteers aged 18–55 years;however, in clinical practice, IPF is most com-monly diagnosed in the seventh or eighth dec-ade of life [3, 26, 27]. Patients with IPF have alsobeen shown to have a high burden of comor-bidities and concomitant medication [26, 28].Therefore, it is possible that the AE profileobserved in our study might not be representa-tive of the real-world setting. However, itshould be noted that the safety profile of thepirfenidone capsule formulation has beenextensively characterized [29], and no signifi-cant differences in safety profile between thecapsule and tablet formulation are anticipated.
CONCLUSION
In conclusion, the results from this studydemonstrated bioequivalence between the pir-fenidone 19 801-mg tablet and pirfenidone39 267-mg capsules in the fasted state in healthyadult volunteers. The small difference in Cmax
between the tablet and the capsules observed inthe fed state is not expected to have a clinicallymeaningful impact on the benefit–risk profile ofpirfenidone, while the simplified dosing regimenwith tablets may increase adherence to treatment.
ACKNOWLEDGEMENTS
The authors would like to thank IndianaStrombom, an employee of F. Hoffmann-LaRoche Ltd., San Francisco, CA, USA, who wasthe safety scientific lead for this project. Theauthors would like to thank Fabian Schwarb andNeil Parrott, employees of F. Hoffmann-LaRoche Ltd., Basel, Switzerland, for their invalu-able technical and scientific support during the
2080 Adv Ther (2017) 34:2071–2082

development of the pirfenidone tablet formu-lation. The authors would like to thank DavidKardatzke, an employee of F. Hoffmann-LaRoche Ltd., San Francisco, CA, USA, for hiscontribution to the statistical analysis.
Funding. This work was supported by F.Hoffmann-La Roche Ltd. Journal andOpen Accessfees were provided by F. Hoffmann-La Roche Ltd.
Medical Writing. Medicalwriting supportwasprovided by Catherine Stanton and Grainne Fah-erty on behalf of Complete Medical Communica-tions Ltd, funded by F. Hoffmann-La Roche Ltd.
Authorship. All named authors meet theInternational Committee of Medical Journal Edi-tors (ICMJE) criteria for authorship for this manu-script, had full access to all of the data in the study,and take responsibility for the work as a whole,including the integrity of the data and accuracy ofthe data analysis. All named authors have givenfinal approval to the version to be published.
Disclosures. Lin Pan is an employee ofRoche-Genentech and holds Roche shares. PaulaBelloni is an employee of Roche-Genentech andholds Roche shares. Han Ting Ding is anemployee of Roche-Genentech and holds Rocheshares. Jianshuang Wang is an employee ofRoche-Genentech and holds Roche shares.Wendy S. Putnam is an employee of Roche-Ge-nentech and holds Roche shares. ChristopherM.Rubino is a consultant to Roche-Genentech, andExecutive Vice President of Pharmacometrics atthe Institute of Clinical Pharmacodynamics,which had previously received grant fundingfrom InterMune (now Roche). Lin Pan: Con-tributed to study design, interpretation of PKresults, and authoring of CSR. Paula Belloni:Contributed to the review and interpretation ofthe PK and safety data. Han Ting Ding: Con-tributed to the analysis of PK and bioequivalencedata. Jianshuang Wang: Contributed to the bio-analytical method validation and PK sampleanalysis. Christopher M. Rubino: Contributed tothe design of the study/analysismethods and theinterpretation of the results. Wendy S. Putnam:Contributed to study design, interpretationof PKresults, and authoring of CSR.
Compliance with Ethics Guidelines. Allprocedures followed were in accordance withthe ethical standards of the responsible com-mittee on human experimentation (institu-tional and national) and with the HelsinkiDeclaration of 1964, as revised in 2013.Informed consent was obtained from allpatients for being in the study.
Data Availability. All data generated oranalyzed during this study are included in thepublished article or as supplementary informa-tion files.
Open Access. This article is distributedunder the terms of the Creative CommonsAttribution-NonCommercial 4.0 InternationalLicense (http://creativecommons.org/licenses/by-nc/4.0/), which permits any noncommer-cial use, distribution, and reproduction in anymedium, provided you give appropriate creditto the original author(s) and the source, providea link to the Creative Commons license, andindicate if changes were made.
REFERENCES
1. Raghu G, Collard HR, Egan JJ, et al. An official ATS/ERS/JRS/ALAT statement: idiopathic pulmonaryfibrosis: evidence-based guidelines for diagnosisand management. Am J Respir Crit Care Med.2011;183:788–824.
2. Raghu G, Rochwerg B, Zhang Y, et al. An officialATS/ERS/JRS/ALAT clinical practice guideline:treatment of idiopathic pulmonary fibrosis. Anupdate of the 2011 clinical practice guideline. Am JRespir Crit Care Med. 2015;192:e3–19.
3. Ley B, Collard HR, King TE Jr. Clinical course andprediction of survival in idiopathic pulmonaryfibrosis. Am J Respir Crit Care Med.2011;183:431–40.
4. Food and drug administration. Highlights of pre-scribing information Esbriet. https://www.accessdata.fda.gov/drugsatfda_docs/label/2017/208780s000lbl.pdf. Accessed 1 June 2017.
5. European Medicines Agency. Summary of productcharacteristics: Esbriet. http://www.ema.europa.eu/docs/en_GB/document_library/EPAR_-_Product_
Adv Ther (2017) 34:2071–2082 2081

Information/human/002154/WC500103049.pdf.Accessed 1 June 2017.
6. Schaefer CJ, Ruhrmund DW, Pan L, Seiwert SD,Kossen K. Antifibrotic activities of pirfenidone inanimal models. Eur Respir Rev. 2011;20:85–97.
7. Didiasova M, Singh R, Wilhelm J, et al. Pirfenidoneexerts antifibrotic effects through inhibition of GLItranscription factors. FASEB J. 2017;31(5):1916–28.
8. Knuppel L, Ishikawa Y, Aichler M et al. A novelantifibrotic mechanism of nintedanib and pir-fenidone: inhibition of collagen fibril assembly. AmJ Respir Cell Mol Biol. 2017;57(1):77–90.
9. King TE Jr, Bradford WZ, Castro-Bernardini S, et al.A phase 3 trial of pirfenidone in patients withidiopathic pulmonary fibrosis. N Engl J Med.2014;370:2083–92.
10. Noble PW, Albera C, Bradford WZ, et al. Pirfenidonefor idiopathic pulmonary fibrosis: analysis ofpooled data from three multinational phase 3 trials.Eur Respir J. 2016;47:243–53.
11. Costabel U, Bendstrup E, Cottin V, et al. Pir-fenidone in idiopathic pulmonary fibrosis: expertpanel discussion on the management of drug-re-lated adverse events. Adv Ther. 2014;31:375–91.
12. Nathan S, Lancaster L, Albera C, et al. Dose modifi-cations and dose intensity during treatment withpirfenidone. Eur Respir J. 2016;48(Suppl 60):OA1764.
13. Hu J, Shang D, Xu X, et al. Effect of grapefruit juiceand food on the pharmacokinetics of pirfenidone inhealthy Chinese volunteers: a diet-drug interactionstudy. Xenobiotica. 2016;46:516–21.
14. Rubino CM, Bhavnani SM, Ambrose PG, Forrest A,Loutit JS. Effect of food and antacids on the phar-macokinetics of pirfenidone in older healthy adults.Pulm Pharmacol Ther. 2009;22:279–85.
15. Shi S, Wu J, Chen H, Chen H, Wu J, Zeng F. Single-and multiple-dose pharmacokinetics of pir-fenidone, an antifibrotic agent, in healthy Chinesevolunteers. J Clin Pharmacol. 2007;47:1268–76.
16. Cramer JA, Roy A, Burrell A, et al. Medicationcompliance and persistence: terminology and defi-nitions. Value Health. 2008;11:44–7.
17. Bansilal S, Castellano JM, Garrido E, et al. Assessingthe impact of medication adherence on long-termcardiovascular outcomes. J Am Coll Cardiol.2016;68:789–801.
18. Kim S, Shin DW, Yun JM, et al. Medication adher-ence and the risk of cardiovascular mortality andhospitalization among patients with newly
prescribed antihypertensive medications. Hyper-tension. 2016;67:506–12.
19. Tangkiatkumjai M, Walker DM, Praditpornsilpa K,Boardman H. Association between medicationadherence and clinical outcomes in patients withchronic kidney disease: a prospective cohort study.Clin Exp Nephrol. 2016;21(3):504–12.
20. World Health Organization. Adherence to long-term therapies. Evidence for action. http://apps.who.int/iris/bitstream/10665/42682/1/9241545992.pdf. Accessed 15 Mar 2017.
21. Claxton AJ, Cramer J, Pierce C. A systematic review ofthe associations between dose regimens and medica-tion compliance. Clin Ther. 2001;23:1296–310.
22. Schroeder K, Fahey T, Ebrahim S. How can weimprove adherence to blood pressure-loweringmedication in ambulatory care? Systematic reviewof randomized controlled trials. Arch Intern Med.2004;164:722–32.
23. European Medicines Agency. Guideline on theinvestigation of bioequivalence. http://www.ema.europa.eu/docs/en_GB/document_library/Scientific_guideline/2010/01/WC500070039.pdf. Accessed 15Mar 2017.
24. Food and Drug Administration. Guidance forIndustry. Food-effect bioavailability and fed bioe-quivalence studies. http://www.fda.gov/downloads/RegulatoryInformation/Guidances/UCM126833.pdf.Accessed 20 Feb 2017.
25. Washington N, Washington C, Wilson C. Thestomach. In: Washington N, Washington C, WilsonC, editors. Physiological pharmaceutics: barriers todrug absorption. London: Taylor and Francis; 2001.p. 75–108.
26. Meltzer EB, Noble PW. Idiopathic pulmonaryfibrosis. Orphanet J Rare Dis. 2008;3:8.
27. Strand MJ, Sprunger D, Cosgrove GP, et al. Pul-monary function and survival in idiopathic vs sec-ondary usual interstitial pneumonia. Chest.2014;146:775–85.
28. Wuyts W, Dahlqvist C, Slabbynck H et al. Demo-graphics and healthcare utilization of patients withidiopathic pulmonary fibrosis (IPF) in a real-worldsetting: updated findings from 277 patients in thePROOF registry. Poster A1127 presented at the ATS2017, 2017.
29. Lancaster L, Albera C, Bradford WZ, et al. Safety ofpirfenidone in patients with idiopathic pulmonaryfibrosis: integrated analysis of cumulative data from5 clinical trials. BMJ Open Respir Res.2016;3:e000105.
2082 Adv Ther (2017) 34:2071–2082