A — Personal taxation - Department of the...
146
Page 1 A — Personal taxation A1. PERSONAL INCOME TAX ....................................................................................... 3 A fair personal income tax system...............................................................................................4 A simple and transparent system ................................................................................................5 A system designed to reduce disincentives to work and save ....................................................7 A1–1 The structure of personal income tax ........................................................................................11 Personal income tax rates .........................................................................................................13 Taxing people as individuals .....................................................................................................23 The taxation of transfer payments .............................................................................................26 Tax offsets .................................................................................................................................29 A1–2 Income from work and deductions.............................................................................................37 Employee income ......................................................................................................................38 Income from self-employment ...................................................................................................50 Deductions .................................................................................................................................53 A1–3 Taxation of income from savings ...............................................................................................62 A consistent treatment of savings..............................................................................................62 Simplifying the taxation of capital gains.....................................................................................78 Taxing savings on an individual basis .......................................................................................83 Annex A1: Concessional offsets in detail ...............................................................................................86 A2. RETIREMENT INCOMES ....................................................................................... 95 A2–1 The strategic report into the retirement income system ............................................................95 A2–2 Taxing retirement incomes ........................................................................................................96 The equity, complexity and adequacy impacts of the current tax arrangements ......................98 A new arrangement for taxing superannuation contributions ................................................. 100 The taxation of earnings ......................................................................................................... 106 Effect of recommendations on retirement incomes ................................................................ 108 Effect of recommendations on overall saving......................................................................... 113 Other tax-related issues.......................................................................................................... 115 A2–3 Responding to increasing life expectancies ........................................................................... 117 Responding to higher life expectancies .................................................................................. 118 Role of longevity insurance products...................................................................................... 121 A2–4 Improving people’s awareness of the retirement income system .......................................... 128 A2–5 Other retirement income issues.............................................................................................. 130 Superannuation funds and infrastructure ............................................................................... 130 Superannuation guarantee for contractors ............................................................................. 130 Preservation ages for mandatory retirement occupations ...................................................... 131 Annex A2: Assumptions used in this section....................................................................................... 133 A3. WEALTH TRANSFER TAXES............................................................................... 137 A3–1 How a tax on bequests measures up ..................................................................................... 137 Efficiency ................................................................................................................................ 138 Equity ................................................................................................................................. 140 Simplicity................................................................................................................................. 141 Sustainability........................................................................................................................... 142 A3–2 The current system has some impact on bequests ................................................................ 143 A3–3 Parameters for a possible tax on bequests ............................................................................ 144 A tax on the whole estate or on individual inheritances? ....................................................... 144 The breadth of the base ......................................................................................................... 145 Setting sensible rates ............................................................................................................. 145 Other design issues ................................................................................................................ 146
-
Upload
nguyentruc -
Category
Documents
-
view
223 -
download
2
Transcript of A — Personal taxation - Department of the...
Page 1
A — Personal taxation
A1. PERSONAL INCOME TAX .......................................................................................3 A fair personal income tax system...............................................................................................4 A simple and transparent system ................................................................................................5 A system designed to reduce disincentives to work and save ....................................................7
A1–1 The structure of personal income tax ........................................................................................11 Personal income tax rates .........................................................................................................13 Taxing people as individuals .....................................................................................................23 The taxation of transfer payments .............................................................................................26 Tax offsets .................................................................................................................................29
A1–2 Income from work and deductions.............................................................................................37 Employee income ......................................................................................................................38 Income from self-employment ...................................................................................................50 Deductions.................................................................................................................................53
A1–3 Taxation of income from savings...............................................................................................62 A consistent treatment of savings..............................................................................................62 Simplifying the taxation of capital gains.....................................................................................78 Taxing savings on an individual basis .......................................................................................83
Annex A1: Concessional offsets in detail ...............................................................................................86
A2. RETIREMENT INCOMES.......................................................................................95 A2–1 The strategic report into the retirement income system ............................................................95 A2–2 Taxing retirement incomes ........................................................................................................96
The equity, complexity and adequacy impacts of the current tax arrangements ......................98 A new arrangement for taxing superannuation contributions................................................. 100 The taxation of earnings ......................................................................................................... 106 Effect of recommendations on retirement incomes ................................................................ 108 Effect of recommendations on overall saving......................................................................... 113 Other tax-related issues.......................................................................................................... 115
A2–3 Responding to increasing life expectancies ........................................................................... 117 Responding to higher life expectancies.................................................................................. 118 Role of longevity insurance products...................................................................................... 121
A2–4 Improving people’s awareness of the retirement income system .......................................... 128 A2–5 Other retirement income issues.............................................................................................. 130
Superannuation funds and infrastructure ............................................................................... 130 Superannuation guarantee for contractors............................................................................. 130 Preservation ages for mandatory retirement occupations...................................................... 131
Annex A2: Assumptions used in this section....................................................................................... 133
A3. WEALTH TRANSFER TAXES...............................................................................137 A3–1 How a tax on bequests measures up ..................................................................................... 137
Efficiency ................................................................................................................................ 138 Equity ................................................................................................................................. 140 Simplicity ................................................................................................................................. 141 Sustainability........................................................................................................................... 142
A3–2 The current system has some impact on bequests................................................................ 143 A3–3 Parameters for a possible tax on bequests ............................................................................ 144
A tax on the whole estate or on individual inheritances? ....................................................... 144 The breadth of the base ......................................................................................................... 145 Setting sensible rates ............................................................................................................. 145 Other design issues................................................................................................................ 146


Page 3
A1. Personal income tax
Personal income tax is Australia’s single biggest source of taxation revenue, raising 37 per cent of total tax revenue. It should raise revenue simply and transparently from a relatively efficient tax base, while maintaining incentives to work and save. Personal income tax also plays a central role in achieving a progressive tax system by raising proportionally more revenue from those who have a greater capacity to pay.
Most adult Australians are affected by the personal income tax system every year, with around 12 million people filing tax returns annually.
As a proportion of GDP, revenue from personal income tax has fallen over the past two decades, with a series of tax cuts a major contributor in the last decade. In the future, demographic change will impact on growth in personal income tax revenue because a greater proportion of the population will be in retirement. If rising debt and reductions in government services are to be avoided, action will be needed to increase the amount of revenue raised from this or other tax bases.
The share of personal income tax in Australia, at 37 per cent of total tax revenue, is high compared to the OECD average of 25 per cent. Much of this difference is explained by the fact that Australia does not levy additional social security taxes in the way that most other OECD countries do (with benefits based on a person’s previous earnings), at an average rate of 25 per cent of total tax revenue. Instead, Australia funds social security payments from general government revenues, and has a compulsory superannuation guarantee (that is, excluded from the calculation). Taking this into account, Australia’s total taxation on personal income is among the lowest in the OECD, at 41 per cent compared to an OECD average of 51 per cent.1
The tax system has a close relationship with the transfer payment system, given the large number of people who are in both systems at any given time. The two systems have different objectives, with the tax system focused on capacity to pay and the transfer system on need. The Review has considered in some depth the extent to which key structural elements of the two systems might be aligned, such as the definition of income and the unit and period of assessment. It has concluded that full integration of the two systems is neither achievable nor desirable because of the differences in their purposes, although policy in the two systems should always be developed jointly and service delivery should be coordinated.
Fairness should continue to be a key principle in the design of the personal income tax system. For the community to be willing to comply with the tax law, people need to be confident that their liability is assessed fairly and reflects their ability to pay. There is strong and widespread support for the proposition that proportionally more revenue should be raised from those with a greater ability to pay. While there are many ways to reach such outcomes, it is important they be achieved in as simple and transparent a way as possible. In
1 Total taxation on personal income includes personal income tax, social security tax and payroll tax. It does not include Australia’s compulsory superannuation guarantee, as this is not currently classified as a tax.

Australia's future tax system — Report to the Treasurer
Page 4
addition, a personal income tax system to suit an ageing population needs to be structured to reduce disincentives to work for the smaller proportion of the population who are of working age and to increase incentives for people to save and invest for their future.
Principles
The personal income tax system should raise revenue fairly — in terms of both the income on which tax is levied (the tax base) and the rates that apply — and contribute to achieving the government’s redistribution goals.
Revenue-raising through the personal income tax system should operate as simply and transparently as possible.
Revenue-raising through the personal income tax system should avoid discouraging work and saving as far as possible.
A fair personal income tax system
The fairness of personal income tax is fundamental as an expression of societal values and is a prerequisite for people to be committed to the system and prepared to meet their obligations. There are two core elements to a fair system — a progressive tax rate structure and an appropriate definition of income.
The current personal income tax system seeks to aggregate income from both work and savings to form a single measure of taxable income. In practice the major part of household savings, including owner-occupied housing and superannuation, is exempt or effectively exempt. In designing the personal income tax system, labour income and the income from savings should be considered as separate though interconnected elements.
Income from work is currently taxed in different ways, depending on the nature of the worker’s employment or their remuneration. While most people with work income have either salary and wage income or business income, which are taxed similarly, many people take some of their remuneration in the form of superannuation or fringe benefits, both of which have completely separate taxation arrangements. Some people’s income from work is entirely exempt from tax. The costs associated with earning income are also treated inconsistently. A tax system for the future would tax wages and fringe benefits in a similar way, and also tax compulsory superannuation contributions with reference to a progressive personal income tax rates scale.
Income from savings, other than lifetime savings, is also taxed in a wide variety of ways. Varying arrangements apply to interest-bearing deposits, income from domestic shares, income from foreign shares, and rents from residential properties. A tax system for the future would tax these different forms of investment as consistently as possible, and also take account of the way inflation affects the effective tax rate on savings. It could do so by providing a common discount for a range of savings income or by applying a flat rate of tax to that income. Long-term, lifetime savings in the form of superannuation and owner-occupied housing should continue to be effectively exempt from income tax.
Personal income tax is calculated by applying a marginal rates scale to a person’s combined income from work and savings. The progressive personal income tax rates scale is a strength

A1 — Personal income tax
Page 5
of the system that should be retained. At present, the great majority of tax revenue comes from higher income earners. In 2007–08, the 16 per cent of taxpayers on more than $75,000 accounted for 55 per cent of personal income tax revenue, with almost half of that coming from the three per cent of taxpayers with taxable income over $150,000.
A progressive system can be achieved in various ways. At present, Australia has a relatively low tax-free threshold and four marginal rates above it, along with a large number of tax offsets that alter the marginal rates for people in particular situations. The direction of change has been towards fewer marginal tax rates, from as many as six or seven during much of the 1980s and early 1990s. An alternative way of delivering a progressive personal income tax rates scale would be through a much higher tax-free threshold and a flat or rising rate scale. This would make the system easier to understand by removing the need for a number of tax offsets. By taking more income support recipients out of the tax system, it could also reduce the number of people who have to deal with both systems at the same time.
Chart A1–1 shows such a tax scale, with progressivity delivered through a large tax-free threshold and a constant marginal tax rate of 35 per cent for most taxpayers.
Chart A1–1: Indicative personal income tax rates scale A simple scale with a high tax-free threshold
0
5
10
15
20
25
30
35
40
45
50
0 20,000 40,000 60,000 80,000 100,000 120,000 140,000 160,000 180,000 200,000Taxable income ($pa)
0
5
10
15
20
25
30
35
40
45
50
Marginal tax rates
Average tax rates
Tax rate (%) Tax rate (%)
Source: Treasury estimates.
A simple and transparent system Many people find the personal income tax system complex, not only because of the rates scale and the lack of a coherent definition of taxable income, but also because they must deal with a large set of complex deduction rules, numerous tax offsets and different forms of exempt income.
A consequence of this is that the system is not transparent to taxpayers. It can be difficult for taxpayers to have a sense of their taxable income because of the complex rules associated with deductions, which are claimed by 80 per cent of personal income taxfilers. A common response to this and other forms of complexity in the tax system is to seek advice from a tax agent. Around three quarters of taxfilers seek such assistance. Nonetheless, in 2007–08, 86 per cent either claimed no deductions at all or only claimed work-related expenses, gifts

Australia's future tax system — Report to the Treasurer
Page 6
and the costs of managing tax affairs. This suggests that the system is too complex and the compliance burden too high.
Australia’s use of tax agents is high by international standards; only Italy’s is higher. By contrast, the Nordic countries, which have pre-filling arrangements for tax returns, have very low levels of tax agent use (see Chart A1–2). To simplify people’s interactions with the tax system and facilitate much greater levels of pre-filling of tax returns, an automatic standard deduction should be introduced. However, to ensure that individuals with more complex affairs or high expenses are not disadvantaged, taxpayers would still have the option of substantiating a claim for all eligible expenses.
Chart A1–2: Percentage of taxfilers using a tax agent, 2005
0102030405060708090
100
Slo
vak
Rep
ublic
Por
tuga
l
Cze
ch R
epub
lic
Luxe
mbo
urg
Nor
way
Den
mar
k
Sw
eden
Spa
in
Sw
itzer
land
Net
herla
nds
New
Zea
land
Icel
and
Can
ada
Kor
ea
Pol
and
Uni
ted
Kin
gdom
Uni
ted
Sta
tes
Turk
ey
Aus
tria
Irela
nd
Aus
tralia
Italy
0102030405060708090100
Taxfilers (%) Taxfilers (%)
Source: OECD (2005). A more transparent system would improve people’s ability to understand their tax rate and to predict the impact of changes in their work or savings arrangements. A key way of achieving this would be to incorporate some offsets into the personal income tax rates scale, and to limit non-structural offsets to situations where they meet an ongoing need that cannot be met in a more targeted way. The transparency of the system would also be improved by a more complete separation of the tax system from the transfer system. This could be achieved by setting the tax-free threshold at a much higher level for all taxpayers.
Longer term reforms should be made with a view to creating a simpler and more transparent system. Policy changes should support simplification by facilitating fully automated preparation of tax returns. Using information that is reported by a third party such as an employer or financial institution is an important part of this, rather than relying on information that has to be collected by the taxpayer over the course of the tax year. People of retirement age could be given the option of submitting their details on a single form with their partner, thus reducing the compliance burden where they own assets jointly. While it would be more complex, joint assessment could be considered for couples of late retirement age. Policy changes should also support transparency so that people can understand the incentives they face to work and save, and are better able to predict the impact of a change to their work or personal circumstances.
A1 — Personal income tax
Page 7
A system designed to reduce disincentives to work and save The way that personal income tax is levied can make a significant difference to how much people work and save. Incentives to work and save are influenced by the effective tax rates that individuals face. Some people’s effective rate is entirely determined by the personal income tax rates scale; although, for most adults, withdrawal rates on transfer payments and additional tax provisions also contribute to their effective tax rate.
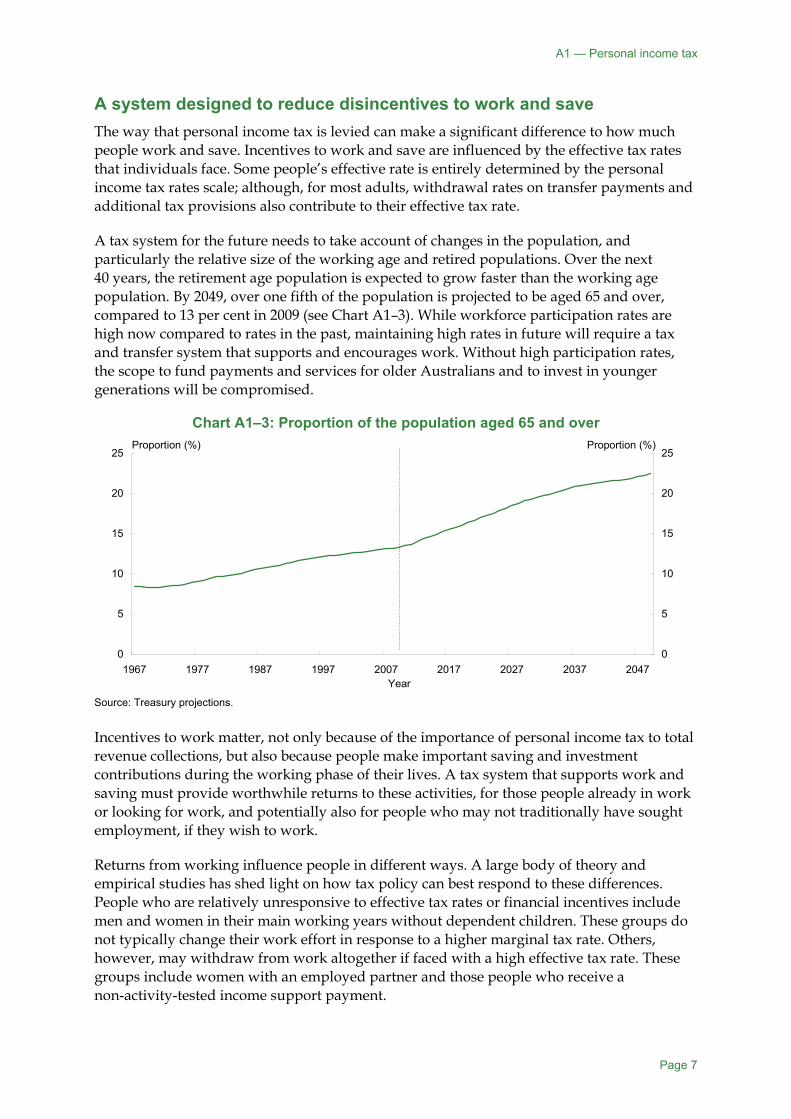
A tax system for the future needs to take account of changes in the population, and particularly the relative size of the working age and retired populations. Over the next 40 years, the retirement age population is expected to grow faster than the working age population. By 2049, over one fifth of the population is projected to be aged 65 and over, compared to 13 per cent in 2009 (see Chart A1–3). While workforce participation rates are high now compared to rates in the past, maintaining high rates in future will require a tax and transfer system that supports and encourages work. Without high participation rates, the scope to fund payments and services for older Australians and to invest in younger generations will be compromised.
Chart A1–3: Proportion of the population aged 65 and over
0
5
10
15
20
25
1967 1977 1987 1997 2007 2017 2027 2037 20470
5
10
15
20
25
Year
Proportion (%) Proportion (%)
Source: Treasury projections. Incentives to work matter, not only because of the importance of personal income tax to total revenue collections, but also because people make important saving and investment contributions during the working phase of their lives. A tax system that supports work and saving must provide worthwhile returns to these activities, for those people already in work or looking for work, and potentially also for people who may not traditionally have sought employment, if they wish to work.
Returns from working influence people in different ways. A large body of theory and empirical studies has shed light on how tax policy can best respond to these differences. People who are relatively unresponsive to effective tax rates or financial incentives include men and women in their main working years without dependent children. These groups do not typically change their work effort in response to a higher marginal tax rate. Others, however, may withdraw from work altogether if faced with a high effective tax rate. These groups include women with an employed partner and those people who receive a non-activity-tested income support payment.

Australia's future tax system — Report to the Treasurer
Page 8
The capacity of the tax system to respond to these different behaviours is limited, but it does affect incentives for people who do not receive transfer payments and it interacts with transfer payments for people who may do some work now or in the future. At present, the tax system adapts to accommodate the transfer system, by removing maximum-rate full-year income support recipients from the requirement to pay tax. It does this by providing tax offsets for income support recipients with little or no private income. A more transparent system would reverse this arrangement, with the same tax rules applying to everyone and the transfer system adapting to the tax rules. This could be achieved by exempting income support and other transfer payments from tax entirely. In addition, withdrawal rates on payments could be reduced once an individual’s income was high enough to produce a tax liability, to cap the overall effective marginal tax rate. The benefit of these changes would be more transparent effective tax rates.
While the proportion of Australians who participate in the workforce is high by international standards (76 per cent of the working age population compared to an OECD average of 71 per cent), this is partly due to Australia having the highest labour participation rate for students in the OECD. After making adjustments to account for measurement differences, the Productivity Commission found that the participation rate of Australian men aged 25 to 54 is below the OECD average. Australian women in the same age group have participation rates above the OECD average, but still curtail their engagement in the workforce during the typical child-bearing years more than is the case in New Zealand, the United Kingdom and the United States (Chart A1–4).
Chart A1–4: Female participation rates, by age, 2008
30
40
50
60
70
80
90
100
15 to 19 20 to 24 25 to 29 30 to 34 35 to 39 40 to 44 45 to 49 50 to 54 55 to 59
Age group
30
40
50
60
70
80
90
100
Canada Australia New ZealandSweden United Kingdom United States
Participation rate (%) Participation rate (%)
Source: OECD(2008b). Lower participation rates for women of child-bearing age are also reflected in employment rates. The employment rate for women with a youngest child aged between three and five years is below the average for all OECD countries that collect this data, and is 25 percentage points below the Swedish rate (ABS 2007a).
This suggests that women of child bearing age constitute one of the key groups with greater potential for paid employment. Many of these women are caring for children, and prefer to take a period out of employment while they do so. Many seek employment, but do not

A1 — Personal income tax
Page 9
always have access to satisfactory child care. The longer the period out of the workforce, the greater the risk of skills atrophying and poorer employment opportunities later on. While there are many factors at play, financial incentives cannot be ignored. One of the most effective ways to improve financial incentives for people with dependent children is to set effective tax rates that support part-time work and recognise that carers in couple families are likely to have lower earnings than their partner. Taxing people as individuals is important in terms of financial incentives, because it applies a different tax rate to each partner in a couple rather than both people facing a pooled tax rate.
For non-lifetime savings, the current tax system’s inconsistent treatment of different types of saving not only affects the level of savings but can also affect how households allocate their savings between different assets or savings vehicles. A future tax system would reduce these biases by taxing different types of saving more consistently.
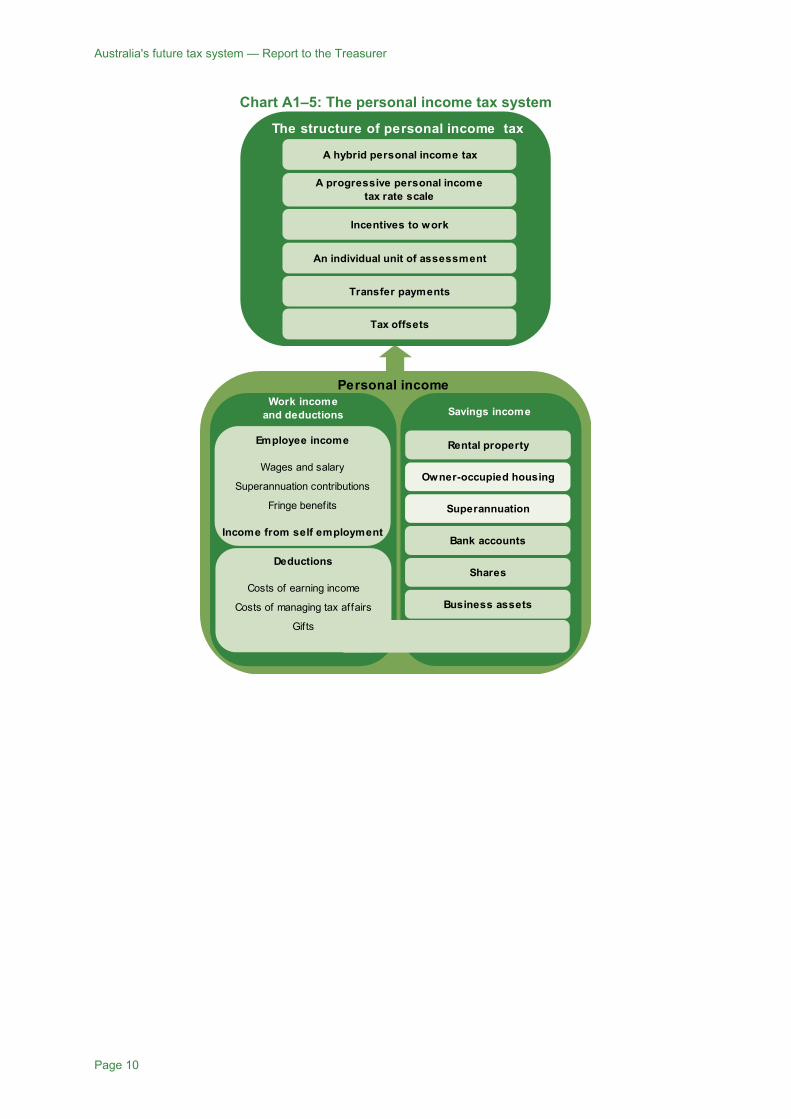
The remainder of this section discusses core elements of the personal income tax system (see Chart A1–5) in more detail:
• A1–1 The structure of personal income tax — tax rates, particularly in terms of progressivity in the tax system and incentives to work and save.
• A1–2 Income from work and deductions.
• A1–3 Taxation of income from savings — other than superannuation (see Section A2 Retirement incomes).
Australia's future tax system — Report to the Treasurer
Page 10
Chart A1–5: The personal income tax system
A hybrid personal income tax
The structure of personal income tax
A progressive personal incometax rate scale
Incentives to work
Transfer payments
Tax offsets
An individual unit of assessment
Work incomeand deductions
Employee income
Wages and salary.
Superannuation contributions.
Fringe benefits
Income from self employment
Deductions
Costs of earning income.
Costs of managing tax affairs.
Gifts
Savings income
Owner-occupied housing
Personal income
Rental property
Bank accounts
Superannuation
Business assets
Shares
A1 — Personal income tax
Page 11
A1–1 The structure of personal income tax
Key points
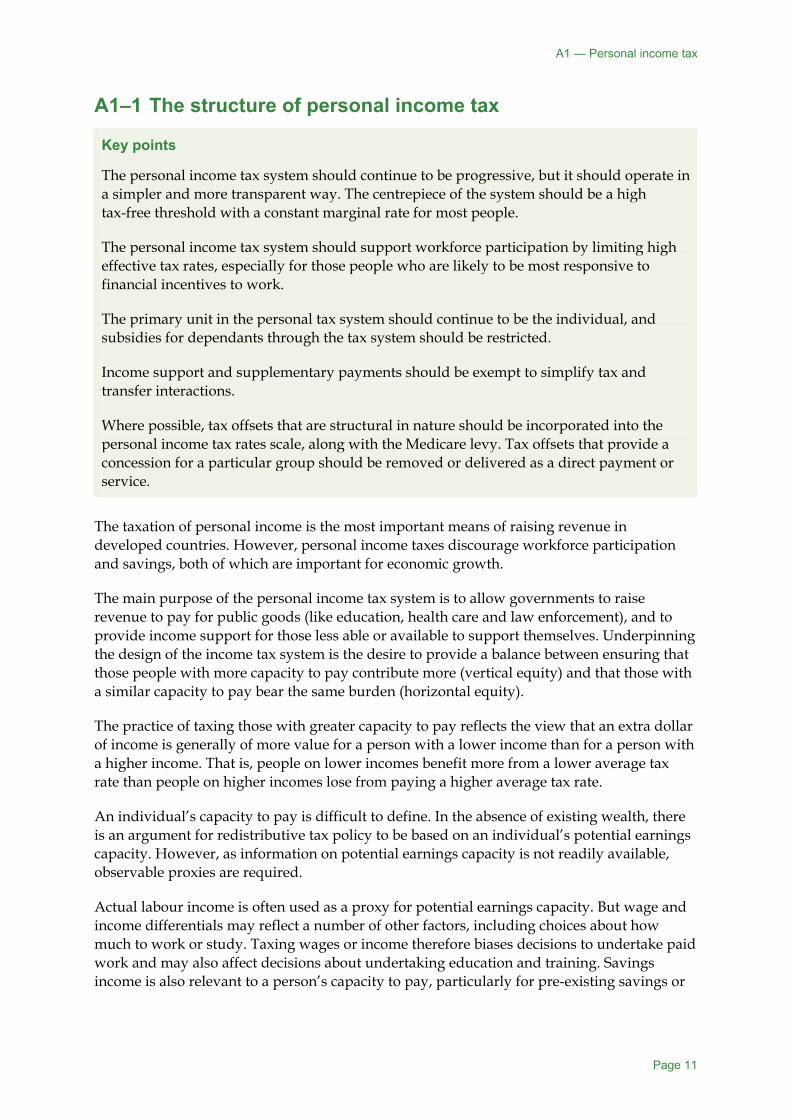
The personal income tax system should continue to be progressive, but it should operate in a simpler and more transparent way. The centrepiece of the system should be a high tax-free threshold with a constant marginal rate for most people.
The personal income tax system should support workforce participation by limiting high effective tax rates, especially for those people who are likely to be most responsive to financial incentives to work.
The primary unit in the personal tax system should continue to be the individual, and subsidies for dependants through the tax system should be restricted.
Income support and supplementary payments should be exempt to simplify tax and transfer interactions.
Where possible, tax offsets that are structural in nature should be incorporated into the personal income tax rates scale, along with the Medicare levy. Tax offsets that provide a concession for a particular group should be removed or delivered as a direct payment or service.
The taxation of personal income is the most important means of raising revenue in developed countries. However, personal income taxes discourage workforce participation and savings, both of which are important for economic growth.
The main purpose of the personal income tax system is to allow governments to raise revenue to pay for public goods (like education, health care and law enforcement), and to provide income support for those less able or available to support themselves. Underpinning the design of the income tax system is the desire to provide a balance between ensuring that those people with more capacity to pay contribute more (vertical equity) and that those with a similar capacity to pay bear the same burden (horizontal equity).
The practice of taxing those with greater capacity to pay reflects the view that an extra dollar of income is generally of more value for a person with a lower income than for a person with a higher income. That is, people on lower incomes benefit more from a lower average tax rate than people on higher incomes lose from paying a higher average tax rate.
An individual’s capacity to pay is difficult to define. In the absence of existing wealth, there is an argument for redistributive tax policy to be based on an individual’s potential earnings capacity. However, as information on potential earnings capacity is not readily available, observable proxies are required.
Actual labour income is often used as a proxy for potential earnings capacity. But wage and income differentials may reflect a number of other factors, including choices about how much to work or study. Taxing wages or income therefore biases decisions to undertake paid work and may also affect decisions about undertaking education and training. Savings income is also relevant to a person’s capacity to pay, particularly for pre-existing savings or

Australia's future tax system — Report to the Treasurer
Page 12
taxes on economic rent. But taxing the normal return to saving is likely to bias savings, labour supply (for those that save part of their wages) and consumption decisions.
As income taxes can lead to a decline in overall economic output, there can be a trade-off between equity and efficiency when designing the personal income tax system.
A hybrid personal income tax base
Australia’s personal income tax system should continue to represent a hybrid personal income tax — with income from long-term, lifetime, savings taxed at a lower rate than other income or exempt from income tax. In particular, the main forms of lifetime savings for most Australians, superannuation and owner-occupied housing, should continue to be taxed at a lower rate or exempt from income tax — consistent with an expenditure tax benchmark that exempts the returns to saving (see Section A2–2). Comprehensive income taxation, under which all savings income is taxed in the same way as labour income, is not an appropriate policy goal or benchmark.
The essential reason for exempting lifetime savings or taxing them at a lower rate is that income taxation creates a bias against savings. The income taxation of savings therefore discriminates against taxpayers who save. They pay a higher lifetime tax bill than people with similar earnings who choose to save less. As savings can be thought of as deferred consumption, the longer the person saves and reinvests, the greater the implicit tax on future consumption (see Chart A1–6). For a person who works today and saves, taxing savings also reduces the benefit from working.
Chart A1–6: Tax wedge on future consumption
0
500
1,000
1,500
0 5 10 15 20 25 30 35 40 45
Years consumption is deferred
0
500
1,000
1,500
Before tax After tax
Tax wedge ($) Tax wedge ($)
Tax on future consumption
Source: Treasury estimates. Assumptions: Pre-tax interest rate of 6 per cent per annum and a tax rate of 30 per cent. The increasing implicit tax on future consumption provides an argument to tax longer-term lifetime savings at a lower rate. An individual can undertake lifetime saving through a variety of savings vehicles, but there are asset types that are more conducive or related to lifetime savings: namely superannuation and owner-occupied housing. It is possible to convert savings in these assets into present consumption by borrowing against them, directly or in effect. Further, the family home yields a stream of income (imputed rent) that is also a

A1 — Personal income tax
Page 13
form of current consumption. While these features could diminish their status as lifetime savings vehicles, in practice these assets will in net terms remain major forms of lifetime savings for most Australians, and provide for a major part of their retirement income.
An exemption from income tax or applying relatively low rates of tax to superannuation and owner-occupied housing is common practice around the world and has been a longstanding feature of the Australian tax system. The family home has not been subject to income tax in Australia since the earlier part of last century. Imputed rental income and capital gains from owner-occupied housing are generally exempt in the OECD countries, with a few exceptions.
While owner-occupied housing represents more than lifetime or retirement savings, other factors support its continued exemption. Given there is little community acceptance for applying income tax to the family home, any attempt to subject it to taxation is unlikely to be sustainable. Australia’s current approach avoids the worst of the biases found in some other countries, where limited taxation of income or gains combined with full tax deductibility of mortgage expenses encourages people to over-invest in housing and take on too much household debt.
Retirement savings are also generally lightly taxed around the world. Many OECD countries tax retirement benefits at a person’s marginal tax rate, and exempt contributions and earnings. In Australia, retirement savings are also taxed lightly but in a different manner — as both contributions and earnings are taxed at low rates while superannuation benefits are generally tax-exempt when paid after the age of 60.
Principles
Superannuation and owner-occupied housing should continue to be taxed at relatively low rates or be exempt from income tax, consistent with an expenditure tax benchmark.
Other savings income should continue to be subject to income tax.
Personal income tax rates
Options for achieving a progressive personal income tax rates scale
A progressive income tax is characterised by average rates that rise with income, in line with the idea that reductions in income caused by taxation reduce the wellbeing of low-income earners more than high-income earners. This means that higher-income people bear a greater than proportional share of the tax burden.
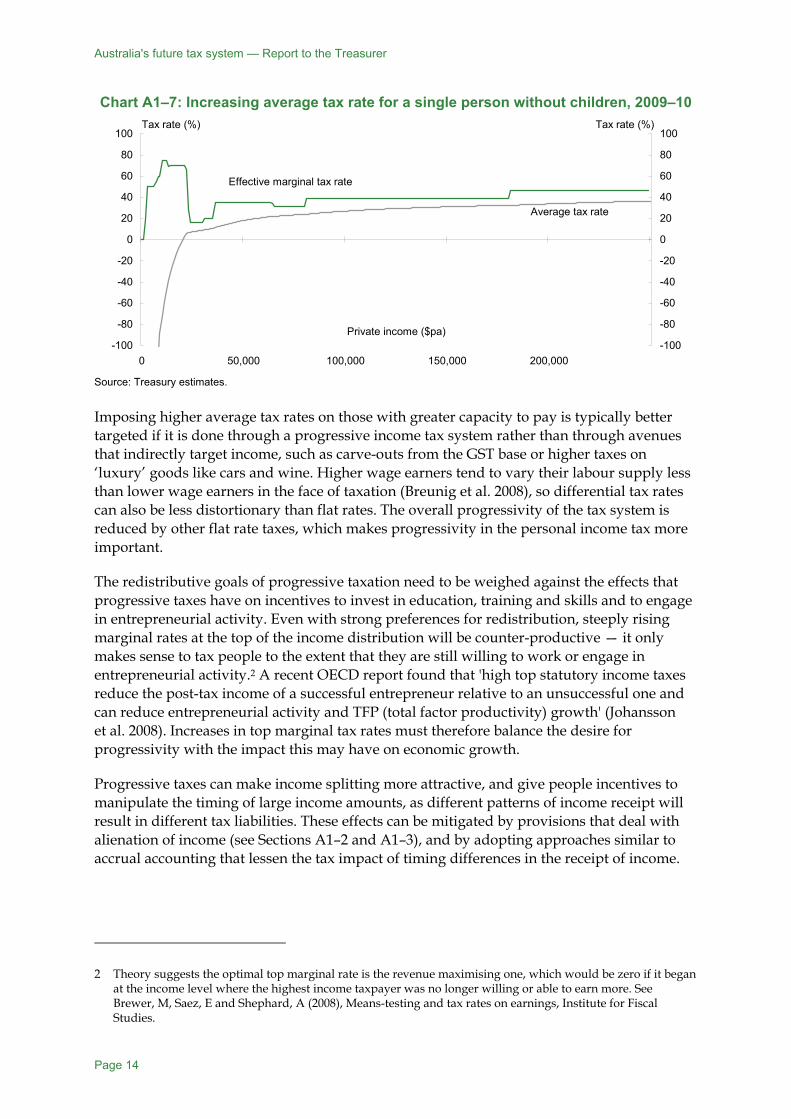
Progressivity can be achieved either through a flat tax rate with a tax-free threshold, a rising personal income tax rates scale, or a combination of both. Progressivity does not necessarily require increasing effective marginal tax rates, as illustrated in Chart A1–7.
Australia's future tax system — Report to the Treasurer
Page 14
Chart A1–7: Increasing average tax rate for a single person without children, 2009–10
-100
-80
-60
-40
-20
0
20
40
60
80
100
0 50,000 100,000 150,000 200,000
Private income ($pa)-100
-80
-60
-40
-20
0
20
40
60
80
100
Effective marginal tax rate
Average tax rate
Tax rate (%) Tax rate (%)
Source: Treasury estimates. Imposing higher average tax rates on those with greater capacity to pay is typically better targeted if it is done through a progressive income tax system rather than through avenues that indirectly target income, such as carve-outs from the GST base or higher taxes on ‘luxury’ goods like cars and wine. Higher wage earners tend to vary their labour supply less than lower wage earners in the face of taxation (Breunig et al. 2008), so differential tax rates can also be less distortionary than flat rates. The overall progressivity of the tax system is reduced by other flat rate taxes, which makes progressivity in the personal income tax more important.
The redistributive goals of progressive taxation need to be weighed against the effects that progressive taxes have on incentives to invest in education, training and skills and to engage in entrepreneurial activity. Even with strong preferences for redistribution, steeply rising marginal rates at the top of the income distribution will be counter-productive — it only makes sense to tax people to the extent that they are still willing to work or engage in entrepreneurial activity.2 A recent OECD report found that 'high top statutory income taxes reduce the post-tax income of a successful entrepreneur relative to an unsuccessful one and can reduce entrepreneurial activity and TFP (total factor productivity) growth' (Johansson et al. 2008). Increases in top marginal tax rates must therefore balance the desire for progressivity with the impact this may have on economic growth.
Progressive taxes can make income splitting more attractive, and give people incentives to manipulate the timing of large income amounts, as different patterns of income receipt will result in different tax liabilities. These effects can be mitigated by provisions that deal with alienation of income (see Sections A1–2 and A1–3), and by adopting approaches similar to accrual accounting that lessen the tax impact of timing differences in the receipt of income.
2 Theory suggests the optimal top marginal rate is the revenue maximising one, which would be zero if it began at the income level where the highest income taxpayer was no longer willing or able to earn more. See Brewer, M, Saez, E and Shephard, A (2008), Means-testing and tax rates on earnings, Institute for Fiscal Studies.
A1 — Personal income tax
Page 15
Principle
Personal income tax should be progressive, both through its own rates scale and also in combination with transfer payments.
Australia’s progressive personal income tax system
The progressivity of a tax system can be assessed in various ways. A relatively straightforward approach is to compare the marginal and average tax rates inherent in the personal income tax rates scale at a particular point in the income distribution. The OECD commonly makes such an assessment at different points, illustrating how point measures of progressivity are sensitive to where they are evaluated.3 For example, for a single person in 2008, the Australian tax system was the 7th most progressive in the OECD if they were earning 67 per cent of the average wage, 20th most progressive at 100 per cent, and 11th most progressive at 167 per cent. Using this same measure, since 2000 the tax system has become slightly more progressive at 67 per cent of the average wage, and slightly less progressive at 100 per cent and 167 per cent.
Complementary measures enable progressivity to be evaluated across the whole system, not only at specific income levels. As well as hypothetical calculations, actual outcomes can be assessed using empirical data.
Administrative data show that the tax-free threshold and rising marginal rates of the existing personal income tax system deliver progressive outcomes in Australia. Chart A1–8 compares how taxable income and tax paid are spread across the population, after ranking everyone according to their taxable income.4 Taxable income is unequally distributed across the population, with the top 20 per cent of taxfilers receiving 49 per cent of all taxable income. However, the income tax burden is even more concentrated, with the top 20 per cent of taxfilers paying 67 per cent of all personal income tax. Similarly, the bottom 20 per cent of taxfilers receive 3 per cent of all taxable income, but pay only 0.1 per cent of all personal income tax. This means that post-tax outcomes are more evenly distributed than pre-tax outcomes.
3 The measure is calculated as (1 — marginal tax rate)/(1 — average tax rate), and is reported in the annual OECD publication Taxing Wages. A variant of this was used in Arnold (2008).
4 People with negative or zero taxable income have been excluded.

Australia's future tax system — Report to the Treasurer
Page 16
Chart A1–8: Distribution of taxable income and tax paid, 2007–08
0
10
20
30
40
50
60
70
80
90
100
0 10 20 30 40 50 60 70 80 90 100
Cumulative percentage of taxfilers, by increasing taxable income (%)
0
10
20
30
40
50
60
70
80
90
100
Taxable income
Tax paid
Cumulative percent Cumulative percent
Excludes people with negative or zero taxable income. Source: Australian government administrative data. However, the progressivity of personal income tax also depends on how comprehensively income is assessed. The provision of tax offsets, concessions and exemptions affects the personal income tax rates scale that different individuals face, and hence changes the progressivity of the system. The more exemptions in the tax base, the weaker is taxable income as a guide to a person’s actual income. Compromises to the tax base include income received in forms that are taxed more lightly; for example, from salary sacrificing into superannuation and from splitting income with others to avoid higher tax rates.
Alongside the tax system, transfer payments are another key mechanism for delivering progressivity. In contrast to many other countries, which have social insurance systems that pay benefits based on a person’s previous earnings, Australia has a targeted transfer system focused on poverty alleviation. This delivers strongly progressive outcomes — Chart A1–9 compares the share of transfers paid to the richest half of the population in the OECD countries in 2005.
Chart A1–9: Share of transfers paid to the richest half of the population, 2005
0
10
20
30
40
50
60
70
80
Aus
tralia
New
Zea
land
Den
mar
kU
nite
d K
ingd
omIre
land
Finl
and
Net
herla
nds
Nor
way
Cze
ch R
epub
licS
wed
enC
anad
aS
witz
erla
ndB
elgi
umU
nite
d S
tate
sIc
elan
dS
lova
k R
epub
licK
orea
Hun
gary
Japa
nG
erm
any
Spa
inLu
xem
bour
gG
reec
eFr
ance
Italy
Aus
tria
Pol
and
Por
tuga
lM
exic
oTu
rkey
0
10
20
30
40
50
60
70
80
OECD average
Per cent Per cent
Source: Whiteford 2009.

A1 — Personal income tax
Page 17
Finding
Overall, Australia has a progressive personal income tax system. The personal income tax and transfer system taken together is among the most progressive in the OECD.
Setting tax rates to support workforce participation
Rates of tax are one of the key factors in determining incentives to work and save. For many taxpayers, tax rates are a more visible part of the tax system than other key design elements, such as the way that income is defined for tax purposes.
As a matter of principle, taxes should interfere as little as possible with work incentives, as this leaves society as well off as possible. In practice, people can avoid taxes by earning less, and this is more costly to society than if the person was willing to work more and pay more tax. For example, a taxpayer can decide to work fewer hours than they otherwise might, or a person who receives income support can elect not to work at all to prevent withdrawal of their payment. People may respond to taxes in ways other than simply adjusting their hours of work. They may alter their education or entrepreneurial plans, or the form in which they receive income.
A large body of literature has explored how best to set tax rates to meet a government’s needs for revenue while minimising the disincentive effects of taxes and taking account of societal preferences for redistribution; for example, Diamond (1998), Saez (2001), Moffitt (2008), Brewer, Saez and Shephard (2008). One of the key findings is that it can be more efficient to impose higher tax rates where fewer people are subject to them, such as at very low and very high incomes. Another insight from this literature is that it can be more efficient to impose higher rates on people whose behaviour is relatively unresponsive to tax rates, such as prime-aged men and women who are not caring for dependent children.
People respond to tax and to financial incentives delivered through both the tax and the transfer systems. For people who are able and expected to work full time, the progression from unemployment to self-support through work can involve a high effective tax rate. Relatively high effective tax rates on low earnings, such as earnings from part-time work, can encourage people to choose full time work to get a lower overall rate and a higher disposable income. By contrast, people who have limited capacity or limited availability for work may only ever seek part-time work. This could be due to caring responsibilities, disability or impairment, or age. People with such restrictions who work part-time may respond to a high effective tax rate by withdrawing from work altogether. A more efficient arrangement in those circumstances is to impose a lower effective tax rate on modest earnings. This could be delivered through the tax rate only, the income support withdrawal rate only, or a combination of the two. Greater certainty and transparency result from varying only the withdrawal rates rather than using the tax system as well.
If more people currently outside the workforce worked part or full time, this could help meet the challenges of an ageing population. This would be likely to require more employment services and other support, alongside financial incentives, for people who are sick or disabled, their carers, aged people and those who are engaged in home duties or the care of children (Abhayaratna et al. 2006).

Australia's future tax system — Report to the Treasurer
Page 18
Arrangements to support the employment of people who are sick or disabled are discussed in Section F The transfer system. The workforce participation of those who are engaged in home duties and the care of children is also discussed in that section. A key element of the personal income tax system that supports workforce participation is the unit of assessment.
Tax rates and withdrawal rates can have the same economic effect
In considering the incentive effects of the system, it is important to consider the combined impact of the personal tax system and the withdrawal rates applying to means tested benefits. This is because withdrawal rates can have the same economic impact as tax rates — the effect on a person’s disposable income is the same whether part of a payment is withdrawn or an additional amount of tax is collected. For example, the pension assets test acts like a tax on savings, and can affect savings decisions in the same way.
While in general tax rates and withdrawal rates should have the same impact on decisions, the impact is not identical where they use different income bases. In addition, timing differences can also alter the effective tax rate at a point in time by comparison with the final effective tax rate after a tax assessment. The practice of taxing and making payments to people at the same time (‘churn’) can be criticised on the grounds of administrative cost, but has the advantage of allowing governments to target taxes and transfers with much greater precision than would be possible if it simply reduced tax liabilities. Taxing and making payments at the same time allows the tax and transfer systems to reflect work responsiveness, the presence of children, and other characteristics.
The impact of taxes and withdrawal rates may also differ because an individual may react differently to having their earned income taxed compared to having a transfer payment reduced, even though the effect on their net disposable income is the same.
These different characteristics of tax and withdrawal rates, and of the tax and transfer systems, suggest that decisions about imposing tax rates through the tax and transfer systems should consider the relative strengths of the two systems.
Principles
The tax system should limit the extent to which people face high effective tax rates, particularly for those who are most likely to reduce their work effort as a result.
Effective tax rates should be tailored to individual circumstances to support workforce participation for those who are able to work and choose to do so. Tailoring should be achieved through adjusting withdrawal rates on transfer payments rather than through tax mechanisms.
Supporting work in an ageing population
Levying taxes efficiently is likely to become increasingly important as the population ages and there are fewer working people as a proportion of the population. Over the next four decades, the retirement age population is expected to grow faster than the working age population. By 2049, over one fifth of the population is projected to be aged 65 or more, compared to around 13 per cent in 2009. As Chart A1–10 illustrates, a corresponding reduction is expected in the relative size of the working age population, and this suggests that economic growth will slow.

A1 — Personal income tax
Page 19
Chart A1–10: Historic and projected labour force participation rates
50
55
60
65
70
75
80
1978-79 1989-90 2000-01 2011-12 2022-23 2033-34 2044-4550
55
60
65
70
75
80
People aged 15 and over People aged 15-64
Participation rate (%) Participation rate (%)
Year
Source: Treasury projections. Australia’s current workforce participation rates are high compared to those in the past, at 65.4 per cent in 2008 compared to 60.8 per cent in 1979 (ABS 2009f). Maintaining high levels in the future will require a tax and transfer system that supports work. The Council of Australian Governments (COAG) made the following comment on this issue:
… with an ageing population, there will be relatively fewer Australians of working age. To avoid putting too great a burden on those already in work, more Australians need to realise their potential by entering or rejoining the workforce (COAG 2006).
Key groups where Australian participation rates are relatively low compared to other OECD countries include prime aged men, women of child-bearing age, and older men and women.5 This suggests that incentives for existing workers to remain in work are critical. In addition, increases in participation by those not currently working should be supported and encouraged, whether they are not currently working because of illness or disability, caring responsibilities, age, home duties or the care of children.
High effective tax rates reduce incentives to work and save
The personal income tax rates scale is often the most visible component of the effective tax rates that people face. However, other parts of the tax system can raise effective tax rates above the marginal rates in the tax scale. The Medicare levy collects 1.5 per cent of income, and is phased in at a 10 per cent rate over an income range that is not announced until the end of the tax year. Means tested offsets, such as the senior Australians tax offset and the low income tax offset, also increase effective tax rates when they are being withdrawn.
Average tax rates in Australia are in the bottom third of the OECD for single people at 67 per cent of the average wage and at 100 per cent, and are still below the OECD average at 167 per cent. The top marginal rate is in the bottom half of those in OECD countries, and the
5 In 2005, Australia was ranked 25th for prime aged men (aged 25 to 54 years), 23rd for women of child-bearing age (aged 25 to 44 years), and 13th and for older men and women (aged 55 to 64 years).

Australia's future tax system — Report to the Treasurer
Page 20
corresponding threshold is set slightly above the OECD average in terms of multiples of average earnings (OECD 2009d).6
Other elements of the tax system can result in very high effective tax rates at particular points (such as thresholds for HELP repayments and the Medicare levy surcharge). Crossing these thresholds results in a higher rate of tax being levied on every dollar of income, not only on income over the threshold. This means that people’s disposable income can fall even though their private income has increased. Work by Chapman and Leigh identified a statistically significant degree of ‘bunching’ of incomes slightly below the HECS thresholds, suggesting that these very high effective tax rates do have an impact on behaviour (Chapman & Leigh 2006).
The transfer system overlays additional financial incentives on the tax system, because payment withdrawal rates interact with taxes. Recent studies of effective marginal tax rates (EMTRs) in Australia suggest that around 90 per cent of working age Australians face EMTRs below 40 per cent (Harding et al. 2006; Kalb 2007). (EMTRs measure the proportion of an extra dollar of income that is lost due to taxes and transfer withdrawals.) Due to the widening of eligibility for means tested family assistance, the proportion of working age Australians facing EMTRs over 50 per cent increased between 1996–97 and 2006–07, from 4.8 per cent to 7.1 per cent. However, the proportion facing EMTRs over 80 per cent declined over this period.
EMTRs do not give a complete picture of the incentive effects of the tax and transfer systems. It is difficult to fully capture these incentives, which may also be affected by factors such as child care costs, public housing rent-setting, and child support liabilities or receipts. More broadly, consumption and payroll taxes also affect the returns to work, and even corporate income taxes may be borne at least in part by workers (see Section B1 Company and other investment taxes).
In certain situations, EMTRs may not be an appropriate measure of the returns to work. For example, a person out of work may be less influenced by the effective tax rate on a small increase in earnings than by the effective tax rate when they move from not working to working — a much larger increase in private income. Effective tax rates on these larger increases in private income are often called participation tax rates (PTRs).
Research looking at the labour market transitions of Australian families over time found that PTRs have a moderate negative effect on the probability that women will enter employment, and a very large negative effect on the probability that an unemployed person will find work (Dockery et al. 2007). This may be a particular concern for jobless couple families with children, who can face high PTRs when one member takes up work. Among couple families with children under 15 where the woman is not working, around 19 per cent of the men are also out of work (ABS 2009g). This is in sharp contrast to males in couples generally, who have markedly higher rates of employment.
6 Average rates include employee social security contributions.

A1 — Personal income tax
Page 21
Chart A1–11: Participation tax rates
0
10
20
30
40
50
60
70
0 30,000 60,000 90,000 120,000 150,000 180,000 210,000 240,000
Private income ($pa)
0
10
20
30
40
50
60
70
One earner couple, two children
Single person
Participation tax rate (%) Participation tax rate (%)
Source: Treasury estimates. Chart A1–11 shows that, for an adult in a jobless couple family with two children, more than 58 per cent of their pay will be lost to tax and payment withdrawal if one member takes a job at the minimum wage. However, these high tax rates allow tax rates to be lower elsewhere in the system, which means that the overall effect on incentives is unclear.
To gain a clearer picture of the incentive effects of the tax and transfer systems, measures of effective tax rates need to be combined with empirical research on the responsiveness of the people who face them. The Australian Fair Pay Commission recently commissioned research into how much certain groups know about the impacts of the tax and transfer systems, and their motivation to work. This work established that people have limited theoretical understanding of how transfers are affected by changes in income, but also that once people are in receipt of a transfer payment, they may protect their entitlements by avoiding work that would move them off benefits.
Dandie and Mercante (2007) reviewed the literature on the responsiveness of various Australian groups, and found that partnered men, single men and single women without children are generally less responsive to changes in wages than partnered women. Lone parents tend to be more responsive than partnered women. Responsiveness varies according to factors such as level of education (higher responsiveness for those with lower education levels), whether the individual works part-time or full-time (higher responsiveness for part-time workers), and income level (generally higher responsiveness for those with lower incomes).
Finding
Effective tax rates can be high for some people, including for those likely to reduce their level of work as a result.

Australia's future tax system — Report to the Treasurer
Page 22
Reform directions — improve simplicity and incentives with a high tax-free threshold and a constant marginal rate for most people
Recommendation 2:
Progressivity in the tax and transfer systems should be delivered through the personal income tax rates scale and transfer payments. A high tax-free threshold with a constant marginal rate for most people should be introduced to provide greater transparency and simplicity.
The personal income tax rates scale is a key contributor to progressivity in the tax and transfer systems.
A new personal income tax rates scale would have a high tax-free threshold and a constant marginal rate for most people. This could take the form of a constant rate of tax for most taxpayers, with a higher rate for those on very high incomes. An indicative approach to implementing the personal income tax rates scale for Australian residents is shown in Table A1–1. The indicative scales shown in the table result in lower personal taxes for people with low incomes, and give rise to broadly comparable average tax rates for those with taxable incomes up to $100,000.
Table A1–1: Indicative personal income tax rates scale Taxable income ($) Rate (%)
0 – 25,000 0 25,001 – 180,000 35
180,001 + 45
This approach sets the tax-free threshold at $25,000, where income support recipients would either have exhausted their payments or have substantial private income. This would mean that more than 1.2 million additional people would no longer pay tax — over 10 per cent of current taxpayers. Many of these would not have to file a tax return (although some would continue to do so to claim withheld amounts or imputation credits). Setting the tax-free threshold at this level would remove the need for the low income tax offset and limit the need for the senior Australians tax offset.
Above the tax-free threshold, a constant rate of 35 per cent would apply for most taxpayers. In the example provided in Table A1–1, over 97 per cent of people over the tax-free threshold would be subject to the 35 per cent rate of tax. A constant rate of tax of this kind has the advantage of transparency for most working people. Combined with a tax exemption for transfer payments, it would be much easier for people to understand their marginal rate of tax.
A higher rate of tax could be applied to those on around three times average wages — $180,000 in this example. A top marginal rate that began at this multiple of average wages would be slightly above the OECD average, although internationally there is a high degree of variation in the level at which top marginal rates apply. For example, in the United States, the top marginal rate applies from nine times average wages, while in the United Kingdom it is 1.2 times average wages. Countries with top personal marginal tax rates that apply from around three times average wages include Canada, France, Italy and Korea.

A1 — Personal income tax
Page 23
This indicative personal income tax rates scale broadly reflects the aspirational tax cuts proposed by the Government for introduction in 2013–14. Introducing a rates scale of this kind would have a number of advantages. It would provide a higher level of transparency to individual taxpayers, as the great majority would have a single marginal rate. It would also improve the relationship between the tax and transfer systems: allied with a tax exemption for transfer payments, more people would be in only one system at any given time.
A tax scale of this kind could be implemented gradually, taking into account existing settings on marginal tax rates, offsets and the definition of income.
Incentives to work
A personal income tax system that provides more support to workforce participation should be delivered in a transparent way.
Currently, most taxpayers have more tax withheld throughout the year than is necessary, because part of the effective tax-free threshold is given through the low income tax offset (LITO) and is only available after the taxpayer files their tax return. By incorporating LITO into the explicit tax scale, people would receive better financial returns to work throughout the year, strengthening participation incentives.
As well as incorporating the existing LITO into the tax scale, a substantial increase in the tax-free threshold would increase the attractiveness of work to low-income earners (including secondary earners), who are typically more responsive to effective tax rates.
Reconfiguring the dependency offsets would better target support to those unable or not expected to work, which would improve participation incentives for those secondary earners not in these categories.
These changes build upon those proposed for the transfer system. Together, these reforms would better support employment and position Australia to meet the coming demographic challenges.
Taxing people as individuals In designing a personal tax system based on anything other than a strictly flat rate of tax, a fundamental choice has to be made about the unit of assessment — that is, whether people are taxed as individuals or as part of a couple or family. This choice involves judgments about how people in couples operate in society compared to single people and about the needs of other family members, particularly children.
The key consideration in determining the unit of assessment is how it gives effect to contemporary social norms about individuals and couples. The judgment implied in the choice of unit is whether horizontal equity is concerned with treating individuals or couples in like circumstances alike. It has particular practical implications for workforce participation.
Specifically, the unit of assessment determines the marginal tax rate that each person in a couple faces. There are advantages in having each partner face different marginal tax rates, according to their earnings and other characteristics. For example, in a couple where one partner is the primary earner and the other earns less, perhaps working part-time and caring
Australia's future tax system — Report to the Treasurer
Page 24
for children, imposing the same marginal tax rate on both may cause the secondary earner to reduce their work effort. By contrast, a lower marginal rate for that person may encourage and support work.
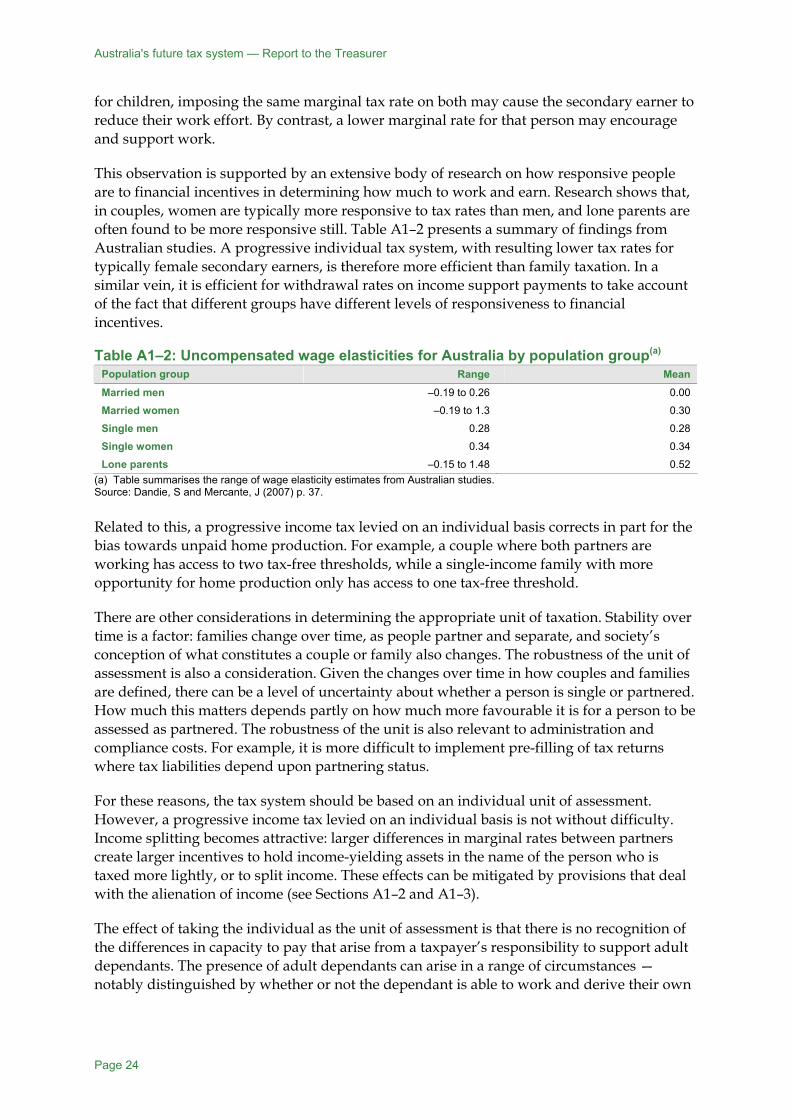
This observation is supported by an extensive body of research on how responsive people are to financial incentives in determining how much to work and earn. Research shows that, in couples, women are typically more responsive to tax rates than men, and lone parents are often found to be more responsive still. Table A1–2 presents a summary of findings from Australian studies. A progressive individual tax system, with resulting lower tax rates for typically female secondary earners, is therefore more efficient than family taxation. In a similar vein, it is efficient for withdrawal rates on income support payments to take account of the fact that different groups have different levels of responsiveness to financial incentives.
Table A1–2: Uncompensated wage elasticities for Australia by population group(a) Population group Range Mean Married men –0.19 to 0.26 0.00
Married women –0.19 to 1.3 0.30
Single men 0.28 0.28
Single women 0.34 0.34
Lone parents –0.15 to 1.48 0.52 (a) Table summarises the range of wage elasticity estimates from Australian studies. Source: Dandie, S and Mercante, J (2007) p. 37. Related to this, a progressive income tax levied on an individual basis corrects in part for the bias towards unpaid home production. For example, a couple where both partners are working has access to two tax-free thresholds, while a single-income family with more opportunity for home production only has access to one tax-free threshold.
There are other considerations in determining the appropriate unit of taxation. Stability over time is a factor: families change over time, as people partner and separate, and society’s conception of what constitutes a couple or family also changes. The robustness of the unit of assessment is also a consideration. Given the changes over time in how couples and families are defined, there can be a level of uncertainty about whether a person is single or partnered. How much this matters depends partly on how much more favourable it is for a person to be assessed as partnered. The robustness of the unit is also relevant to administration and compliance costs. For example, it is more difficult to implement pre-filling of tax returns where tax liabilities depend upon partnering status.
For these reasons, the tax system should be based on an individual unit of assessment. However, a progressive income tax levied on an individual basis is not without difficulty. Income splitting becomes attractive: larger differences in marginal rates between partners create larger incentives to hold income-yielding assets in the name of the person who is taxed more lightly, or to split income. These effects can be mitigated by provisions that deal with the alienation of income (see Sections A1–2 and A1–3).
The effect of taking the individual as the unit of assessment is that there is no recognition of the differences in capacity to pay that arise from a taxpayer’s responsibility to support adult dependants. The presence of adult dependants can arise in a range of circumstances — notably distinguished by whether or not the dependant is able to work and derive their own

A1 — Personal income tax
Page 25
income. These considerations are generally best addressed through the transfer system, while some horizontal equity benefits can be provided by dependant offsets.
Principle
The personal income tax system should generally tax people as individuals.
Retain the individual as the primary unit of assessment
The Australian tax system has always been based on individual assessment. This is one of the most important ways in which the personal tax system supports participation, by allowing different marginal tax rates to apply to each person in a couple. However, the system does include some elements that take account of the presence of a partner or children, and their circumstances.
Dependency offsets are examples of tax provisions that take account of partner or family circumstances. The senior Australians tax offset allows any unused value to be claimed by a person’s partner, if they have one. The Medicare levy low income phase-in arrangements take account of family size and structure. The Medicare levy surcharge’s thresholds are based on family size and structure. The spouse superannuation contributions tax offset is available for contributions on behalf of a spouse, while the medical expenses tax offset allows claims for family members as well as for the taxpayer themselves. These provisions are discussed in more detail in Annex A1.
These provisions depart from the principle that tax should be levied on each individual separately. They are a source of complexity in the system, often because the tax system does not routinely collect spouse information — a factor that can make compliance activity difficult. These provisions also tend not to provide responsive assistance in those cases where they are intended to support the costs of living. In many cases, more targeted support is available through the transfer system or other spending programs. They can also have a negative impact on participation incentives, where they affect dependants who could otherwise work.
There could be a case for optional couple assessment for people of retirement age or of late retirement age, on the grounds that these people are not expected to work and the great majority do not. Joint assessment would provide the same benefits to couples who have not shared their assets equally or where one member receives a superannuation pension from a defined benefit scheme, as for couples who have split their assets equally. Such a proposal would, however, introduce significant complexity into the tax system, by requiring the Australian Taxation Office (ATO) to assess relationships and changes in relationship status, as is currently required in the transfer system. While it is more complex, where participation incentives are not important, relaxation of the individual unit of assessment can assist other policy objectives.
Australia's future tax system — Report to the Treasurer
Page 26
Findings
The current tax system is generally based on taxing people as individuals. However, some provisions take account of couple or family circumstances.
Individual assessment supports workforce participation by secondary earners, by allowing different effective tax rates for each person in a couple.
Where participation incentives are not important, relaxation of the individual unit of assessment can assist other policy objectives.
Recommendation 3: The primary unit in the personal tax system should continue to be the individual, and subsidies for dependants through the tax system should be restricted (see Recommendation 6a). However, there could be a case for optional couple assessment for people of late retirement age.
The taxation of transfer payments Many Australians receive transfer payments, often at the same time as they pay tax. Income support and supplementary payments replace or supplement wages and salary for their recipients.
Commonwealth transfer payments are cash payments provided by the Australian government to individuals and families, including Age pensioners, veterans, people with a disability, carers, unemployed people, and people affected by natural disaster. Transfers play a vital role in the government’s redistributive policies and take a variety of forms, from income support and supplementary payments to cash payments for families with children.
Reflecting their poverty alleviation objectives and redistributive goals, cash transfers are typically targeted at low-income individuals and are designed to help recipients pay for daily living expenses and otherwise support themselves. Income support payments in particular assist poor households or those likely to fall into poverty without the transfer.
The rate of income support includes the base payment and any supplementary payments, such as Rent Assistance, Telephone Allowance and Pharmaceutical Allowance. These components should be treated on a consistent basis for tax purposes. The same treatment should also apply to government scholarships.
Family assistance has some different characteristics. It is not wage-like in its nature, as it is paid in addition to wages or income support for costs associated with children. Its tax status need not be the same as the tax status of income support.
Transfer payments have a mix of tax treatments
The current system exempts some transfer payments from income tax but taxes others.
Most income support payments are taxable, including Newstart Allowance, the Age Pension and Parenting Payment. The pensioner and beneficiary tax offsets remove the tax liability of

A1 — Personal income tax
Page 27
recipients who receive the maximum rate of income support payment for the full year. A tax exemption applies to Disability Support Pension (if the recipient is under Age Pension age), Wife Pension (if both spouses are under Age Pension age), and Carer Payment (if the carer and person being cared for are under Age Pension age). The combined effect of the pensioner or beneficiary tax offset plus the low income tax offset and the Medicare levy low income phase-in is that there is only minimal difference in final outcomes. A mix of taxable and non-taxable payments with these additional provisions is a complex and non-transparent way of delivering effectively the same outcome.
A key difference between taxable and non-taxable income support payments in the current system is the outcome for people whose circumstances change significantly in the course of a tax year. If a person receives income support for part of a year and has a well-paid job for the other part of the year, a taxable income support payment is partially or fully clawed back through tax, while a non-taxable income support payment is not. This is because the taxable income support payment is added to the income from work. The impact of this is greater where the variation in income level is high, and was important when seasonal work was a larger component of the work available.
Supplementary payments are, in effect, part of the rate of income support. These payments include Rent Assistance, Telephone Allowance and Pharmaceutical Allowance. While most income support payments are taxable, supplementary payments are mostly non-taxable. Even parts of a payment can have a mixed treatment — the Pension Supplement (a single payment for pensioners) has both taxable and non-taxable elements.
Family assistance payments, including Family Tax Benefit Part A, Child Care Benefit, the Child Care Rebate and the Baby Bonus, are not taxable. These payments are unlike other payments in that Family Tax Benefit Part A, Child Care Benefit and the Child Care Rebate are assessed annually on a variant of taxable income, while the Baby Bonus takes the same assessment concept but applies it to the half year preceding the baby’s birth. These payments address the direct costs of children and so should not be taxable.
Findings
Income support and supplementary payments have a variety of tax treatments. Some payments have taxable and non-taxable components.
Recipients of taxable and non-taxable income support payments have similar levels of disposable income, once the effects of offsets are taken into account.
Family assistance payments are tax-exempt and address the direct costs of children.
Australia's future tax system — Report to the Treasurer
Page 28
Reform directions — consistent tax treatment of income support and supplementary payments
Recommendation 4:
Income support and supplementary payments should be tax-exempt.
(a) Family assistance should remain exempt from tax because it addresses direct costs associated with children.
(b) Government payments that are similar in nature to income support, such as scholarships, should be exempt from tax to align their treatment with that of income support.
A key reform direction is to provide a consistent tax treatment for pensions, allowances and supplementary payments. All income support and supplementary payments should be exempt from tax. One of the main objectives of cash transfer payments is to increase poor households’ real income, and taxing transfer payments can interfere with this objective. Taxing transfer payments also complicates individuals’ interaction with the tax and transfer systems.
It should be noted that exempting payments from tax has a different impact from taxing most income support and providing an offset to the tax liability for maximum-rate full-year recipients. These two treatments have different effects because the assessment period for tax and for transfers is different; if they were the same, changes in the timing of income receipt or eligibility for transfer payments would not lead to varying tax outcomes. The income on which payments are assessed is also different, meaning that a person’s income is counted in different ways in the two systems.
Making all income support and transfer payments non-taxable may result in some income support recipients, particularly pensioners, facing high EMTRs on income from certain sources where the means test withdrawal rates overlap with tax rates on income above the tax-free threshold. The resulting EMTRs would be higher when income support is non-taxable because withdrawal and tax rates would be additive, rather than offsetting each other as is the case when income support and transfer payments are taxable.
For tax-exempt income support payments, the effective tax rate is the sum of the withdrawal rate and the tax rate the recipient is paying on other income. This can result in very high effective tax rates: for example, a 65 per cent withdrawal rate and a 35 per cent tax rate combine to give an effective tax rate of 100 per cent. To reduce these very high effective tax rates, income support payments can be withdrawn at a slower rate at income levels where it is likely that the person is also paying tax, to maintain a desired overall effective tax rate. The fact that the tax and transfer systems have different periods of assessment would make this difficult to achieve precisely, but it would have participation benefits.
There may need to be some offsetting adjustments in the relevant means test to minimise the impact of this overlap for people with taxable income above the tax-free threshold.
Family assistance payments should remain exempt from tax. These payments are not wage-like in nature but are intended to address private and domestic costs associated with children.

A1 — Personal income tax
Page 29
The government will need to review the level of the tax-free threshold periodically to maintain a relationship between the tax and transfer systems that has the simple and transparent character of this proposal.
Tax offsets Tax offsets provide a mechanism for delivering lower net taxes to taxpayers with particular characteristics or types of income. However, the design differences in the large number of tax offsets add significant complexity to the tax system. People’s interactions with the tax system would be greatly simplified by rationalising the number of offsets. This would also provide a simpler and more transparent marginal tax rate structure.
Tax offsets reduce the transparency of the tax system
Tax offsets7 are used in the tax system for a number of purposes:
• to provide concessional tax treatment for some forms of income over others — for example, employment termination payment tax offsets;
• to provide concessional tax treatment of income received by particular groups of taxpayers relative to others — for example, the senior Australians tax offset (SATO); and
• to reduce interactions between taxable transfer payments and the tax system — through the beneficiary tax offset (BTO) and the pensioner tax offset (PTO).
At present there are more than 40 tax offsets, with different design features and impacts on people. Non-refundable tax offsets reduce the amount of tax that is payable on an individual’s taxable income by the dollar value of the offset. The full amount of these offsets can only be utilised where there is sufficient tax liability — if the offset is larger than the person’s tax liability no refund is available. Refundable tax offsets provide the full amount of the offset to the individual regardless of tax liability (that is, they can reduce tax to zero and create a refund).
The combination of all offsets, with their different interactions and eligibility criteria, contributes significantly to complexity in the tax system. Rationalising offsets could make the system simpler and reduce compliance costs. Many of the objectives of the current offsets could be (or have already been) achieved more effectively if delivered through transfer payments, other government spending, or through direct remuneration.
Some tax offsets are structural — that is, they alter the personal income tax rates scale for the majority or a large number of taxpayers. For example, in 2009–10 the low income tax offset (LITO) of $1,350 increases the effective tax-free threshold to $15,000 and changes the effective marginal tax rates for people with incomes between $30,000 and $63,750.
Most other offsets provide concessional treatment to a smaller group of people in specific circumstances. As concessional tax offsets are usually delivered on assessment, they generally do not deliver assistance to taxpayers at the time that the relevant expenses are
7 Known as tax rebates in the Income Tax Assessment Act 1936.
Australia's future tax system — Report to the Treasurer
Page 30
incurred, are not transparent because they are not directly related to the incurring of the expenses, and they are generally targeted only at those people who have a tax liability.
The objectives of the current set of offsets could be achieved more simply and effectively if they were rationalised in the following way:
• Structural offsets (such as the LITO, SATO, PTO and BTO) should largely be removed. A higher tax-free threshold and adjustments to the personal income tax rates scale would facilitate this.
• Concessional offsets, which have in many cases been replaced by direct transfer payments or other government spending, should in most cases, be removed from the tax system. Exceptions should apply where the dependant is unable to work due to disability or carer responsibilities, or either the taxpayer or dependant has reached Age Pension age.
Findings
Structural tax offsets alter the personal income tax rates scale for a large number of taxpayers and create complex interactions between the tax and transfer systems. The assistance provided by structural tax offsets would be more simply and transparently delivered through explicit marginal tax rates.
Concessional tax offsets provide a mechanism for delivering lower net tax rates to taxpayers with particular characteristics. However, assistance provided in this way is not transparent, timely or well targeted.
Medicare levy complicates personal income tax
While the Medicare levy is designed to help fund Medicare expenditure, it only partially funds Medicare, which in turn constitutes only a fraction of total government health spending. Of the $71.2 billion spent on health by Australian, State and local governments in 2007–08, only $7.4 billion was funded by the Medicare levy. In June 2009 the National Health and Hospitals Reform Commission (NHHRC) recommended that the levy be increased by 0.75 percentage points to finance its proposed Denticare scheme (NHHRC 2009).
The Medicare levy raises the marginal tax rate for most Australian residents by 1.5 percentage points. However, the levy does not apply to all taxpayers and it interacts with the marginal tax rates in complex ways, creating high effective tax rates at some income levels.
A complex set of low-income phase-in arrangements operates to provide an exemption from the Medicare levy for people without a tax liability (treating couples and singles differently). The complexity of these arrangements and the income levels at which they are phased in make it difficult to avoid stacking of tax rates and withdrawal rates.
In addition, many people are exempt from paying the levy based on their personal circumstances. For example, members of the Australian Defence Force and non-residents are exempt. As a result of the phase-in and exemption arrangements, in 2007–08 only 75 per cent of the 11.4 million taxpayers with a gross tax liability paid the levy.

A1 — Personal income tax
Page 31
The levy may send a misleading message to taxpayers about the cost of health spending. This may encourage inconsistent demands for more public funding of health care combined with an expectation that this can be absorbed without higher rates of tax.
The Medicare levy should be removed and incorporated into the personal income tax rates scale. This would simplify the tax system and remove potentially misleading messages to taxpayers about the cost of health spending.
However, to increase the transparency of the costs of health, a share of revenue raised from personal income tax could be allocated to health expenditure. This allocation could be made whether or not the funds were hypothecated formally to health. Total government health spending accounted for around 56 per cent of personal income tax revenue in 2007–08 (based on tax revenue of $126.1 billion), increasing to 62 per cent in 2008–09 (based on estimated tax revenue of $125.8 billion). This could be applied as a proportion of the net tax payable by an individual. This option would be simpler and raise revenue on the more efficient personal income tax base.
Medicare levy surcharge and private health insurance
To increase the take-up of private health insurance, the Medicare levy surcharge requires individuals with an income for surcharge purposes over $73,000 and families with a combined income for surcharge purposes over $146,000 (increased by $1,500 for each dependent child after the first) in 2009–10 to pay an additional 1 per cent tax on their taxable income (including reportable fringe benefits) if they do not have complying health insurance for themselves and all their dependants. The singles threshold is indexed to AWOTE and increased in $1,000 increments (rounded down). The threshold for families is double the singles threshold. While the surcharge is designed to be entirely avoidable (by purchasing the required insurance cover), it was levied on 725,000 individuals and raised revenue of around $450 million in 2007–08.
As it currently operates, the Medicare levy surcharge is not ideal. Although levied on individuals, it is calculated on a family basis (by considering the presence of a spouse and the number, age and study status of any children). This means that the surcharge is levied on a high-income individual with insurance whose spouse does not have insurance. This complicates the system and makes compliance more difficult. It also creates spikes in EMTRs as it applies to every dollar of taxable income, including reportable fringe benefits, once the relevant income threshold is exceeded (rather than only the amount in excess of the threshold). The name of the surcharge is also misleading as it is not related to the Medicare levy and does not reflect its link with private health insurance. As a result, it should be relabelled to reflect this link.
The surcharge is closely linked with the private health insurance offset as part of a package of government polices aimed at increasing the take up of private health insurance. The offset is also problematic as it can be claimed using multiple mechanisms, including through the tax system, making the system unnecessarily complex and costly.
Finding
Tax arrangements relating to private health insurance, including the Medicare levy surcharge and the private health insurance tax offset, are unnecessarily complex.

Australia's future tax system — Report to the Treasurer
Page 32
Reform directions
Recommendation 5:
The Medicare levy and structural tax offsets — the low income, senior Australians, pensioner and beneficiary tax offsets — should be removed as separate components of the system and incorporated into the personal income tax rates scale. If a health levy is to be retained, it could be applied as a proportion of the net tax payable by an individual.
Recommendation 6:
To remove complexity and ensure government assistance is properly targeted, concessional offsets should be removed, rationalised, or replaced by outlays.
(a) The existing dependency offsets should be replaced with a single dependant tax offset where one of the following circumstances apply:
– the dependant is unable to work due to disability or carer responsibilities; or
– either the taxpayer or dependant has reached Age Pension age.
(b) The zone tax offset should be reviewed. If it is to be retained, it should be based on contemporary measures of remoteness.
(c) The mature age worker, employment termination payment, overseas civilian, entrepreneurs’ and notional tax offsets should be removed (see Annex A1). The education tax refund should be replaced as part of the single family payment, but as a back-to-school (lump-sum) amount.
(d) The overseas forces tax offset should be replaced by adjusting remuneration to maintain net incomes.
(e) Averaging tax offsets for primary producers, the offset for ‘special professionals’ and the lump sum payment in arrears tax offset should be retained to minimise the extent to which the timing of such income influences tax liability (see Annex A1).
Recommendation 7:
Consistent with the recommendations of the National Health and Hospitals Reform Commission:
(a) The medical expenses tax offset should be removed following a review of the scope and structure of health safety net arrangements.
(b) The Medicare levy surcharge and assistance for private health insurance should be reviewed as part of the package of tax and non-tax policies relating to private health insurance. The Medicare levy surcharge lump sum payment in arrears tax offset should be retained if the Medicare levy surcharge is retained (see Annex A1). Assistance, if retained, for private health insurance should be provided exclusively as a direct premium reduction.

A1 — Personal income tax
Page 33
Structural offsets The low income tax offset (LITO)
The LITO is the mechanism that changes the tax-free threshold for the largest number of people, 6.8 million in 2007–08. This number will increase as the LITO rises as a result of legislated tax cuts. The full amount of LITO is available to individuals with taxable income up to $30,000, and the amount of LITO available is then reduced at the rate of four cents in the dollar. In 2009–10, the LITO has the same effect as increasing the tax-free threshold to $15,000 for those with incomes up to $30,000, increasing the 15 per cent marginal tax rate to 19 per cent (plus 1.5 per cent Medicare levy) for individuals with incomes between $30,001 and $35,000, and increasing the 30 per cent marginal tax rate to 34 per cent (plus 1.5 per cent Medicare levy) for those with income between $35,001 and $63,750 (the point at which the LITO is completely withdrawn).
The LITO not only increases the tax-free threshold, but also increases marginal tax rates at higher incomes (see Chart A1–12). As a result, many taxpayers with taxable income up to $80,000 face an effective marginal tax rate different to that set out in the personal income tax rates scale. For example, the only taxpayers who face a 30 per cent effective marginal tax rate (excluding the Medicare levy) in 2009–10 were those who earn between $63,751 and $80,000.
Chart A1–12: Impact of the LITO on personal income tax rates 2009–10
0
5
10
15
20
25
30
35
40
0 10,000 20,000 30,000 40,000 50,000 60,000 70,000 80,000
Taxable income ($)
0
5
10
15
20
25
30
35
40
Explicit rates Explicit rates plus LITO
Tax rate (%) Tax rate (%)
Note: Does not include Medicare levy. Source: Treasury estimates. The LITO should be incorporated into the personal income tax rates scale, both for reasons of transparency and to retain the progressivity of the personal income tax rates scale. This change would also make the benefit of the LITO fully available through the pay as you go withholding rates scale, rather than half through withholding and half on assessment, as is currently the case.
Senior Australians tax offset (SATO)
The SATO increases the effective tax-free threshold for people of Age Pension or Veterans Service Pension age. In 2006–07, approximately 623,000 people claimed the offset at a cost of

Australia's future tax system — Report to the Treasurer
Page 34
$1.1 billion. In 2010–11, the SATO, when combined with the LITO, will provide an effective tax-free threshold of $30,685 for singles and $26,680 for each partner in a couple. The SATO phases out (at the rate of 12.5 cents per dollar) for income above these thresholds and will be completely phased out once income reaches $48,525 (singles) and $39,496 (for each member of a couple not separated by illness). SATO amounts ($2,230 for singles and $1,602 for each member of a couple not separated by illness) are not indexed. Unused amounts of SATO can be transferred between partners up to the point where the maximum combined offset amount has been used.
The SATO should be removed, in conjunction with the Review’s recommendations that the tax-free threshold be raised substantially and that pensions and benefits be made tax-exempt. As a transitional mechanism, it should be replaced with an offset that takes into account the new personal income tax rates and thresholds and delivers a similar effective tax-free threshold. In light of the increase in the number of Australians accessing tax-free superannuation benefits, and a higher tax-free threshold, the tax concession provided by the new offset should be reduced over time.
Pensioner tax offset (PTO)
The PTO was introduced to ensure that pensioners and some allowees on maximum rates of payment do not incur a tax liability. The PTO is available to recipients of specified payments made under the Social Security Act 1991 and Veterans’ Entitlements Act 1986. In 2008–09, the PTO was $2,240 for singles, $2,086 for partners in a couple who had to live apart due to illness or because one partner was in a nursing home, and $1,699 for each partner in a couple not separated by illness. The PTO, when combined with the LITO, provides an effective tax-free threshold of $25,298 for singles and $21,691 for each partner in a couple not separated by illness. In 2006–07, approximately 294,000 people claimed the offset at a cost of $459 million.
As the LITO has increased, there has been no offsetting downward adjustment to the PTO or SATO. This has pushed up the effective tax-free threshold delivered by the combination of PTO, SATO and LITO. As a result, most pensioners, whether full- or part-rate, no longer pay any tax on their combined pension and private incomes.
The PTO should be removed, in light of the recommendations to exempt all transfer payments from tax and increase the tax-free threshold. Pensioners of Age Pension age would have access to the transitional offset outlined in the SATO section above.
Beneficiary tax offset (BTO)
The BTO ensures that recipients of prescribed government payments such as allowances, drought assistance payments and wage supplements following disasters do not pay tax on the benefit or allowance component of their income. In 2006–07, approximately 279,000 people claimed the offset at a cost of $130 million.
The BTO should be removed, in light of the recommendations to exempt all transfer payments from tax and increase the tax-free threshold.

A1 — Personal income tax
Page 35
Concessional tax offsets Dependency tax offsets
Concessional tax arrangements for dependants have been a feature of the tax system for a long time and were generally introduced at a time when spouses (and other dependants) typically depended on a main breadwinner and full-time work was the norm. There are five dependency tax offsets, which provide different levels of tax concessions to taxpayers depending on whether they support:
• a spouse who has a very low income;
• an invalid relative who has a very low income;
• a child who is not employed, but is undertaking (unpaid) work as a housekeeper in the taxpayer’s house;
• the engagement of a housekeeper to care for a child under 21 years, invalid relative or spouse receiving Disability Support Pension; or
• a dependent parent or parent-in-law who has a very low income.
The multiple dependency offsets complicate the tax system and are withdrawn from a low level of dependant’s income. This can affect participation incentives and is generally only appropriate where there is less concern about the impact on participation of the dependant; for example, for dependants unable to participate due to invalidity, or for people over Age Pension age.
The dependency offsets should not be provided where the dependant is able to seek work, because in this situation the offset acts as a work disincentive. The offsets should be more narrowly focused on taxpayers supporting either a dependant who is unable to work due to disability or carer responsibilities or where the taxpayer or dependant has reached Age Pension age.
Other concessional offsets
Several other tax offsets are designed to influence behaviour. In some cases these would no longer be necessary as a result of recommended changes to the personal income tax rates scale or because assistance is already provided through the transfer system. For example, the mature age worker tax offset was intended to provide people over 55 years with an incentive for continued workforce participation. However, the recommended increase in the tax-free threshold provides a more transparent and effective participation incentive for these people.
As a general principle, offsets should be limited to circumstances where the assistance cannot be provided effectively through the transfer system or other government spending. Further detail on existing concessional offsets and recommended reforms is presented in Annex A1.
Private health insurance tax offset
The Australian government currently subsidises private health insurance premiums based on a person’s age through three mechanisms: a direct premium reduction, a reimbursement from Medicare Australia, or a tax offset. Most people claim the rebate as a direct premium reduction, with around 96 per cent of private health insurance subsidies claimed through

Australia's future tax system — Report to the Treasurer
Page 36
premium reductions and Medicare Australia and around 4 per cent claimed through the tax system. In 2008–09, total expenditure on the private health insurance rebate was around $4 billion.
Providing multiple ways to claim assistance for private health insurance, including through the tax system, is unnecessarily complex and costly. If government wishes to subsidise private health insurance, assistance should only be provided as a direct premium reduction. This provides timely assistance, as it reduces the cost of insurance at the time it is paid, is simple to administer and is the most common way of claiming assistance.
Whether or not this subsidy is means tested requires a balancing of equity and complexity considerations. Means testing would help ensure this assistance is directed to those who need it most. On the other hand, it would require people to estimate their annual income when they receive assistance and then reconcile the assistance they receive against their actual income at the end of the income year. This would create a risk that inaccurate estimates of income would create debts. Means testing arrangements would also increase administrative complexity for policy holders, insurance providers and the ATO.
The National Health and Hospitals Reform Commission’s (NHHRC) final report recommended that the Australian government ‘commits to explore the design, benefits, risks and feasibility around the potential implementation of health and hospital plans to the governance of the Australian health system’ (NHHRC 2009). This would include examining the potential role of private health insurance alongside health and hospital plans including examining any changes to the Australian government’s ‘regulatory, policy or financial support for private health insurance' (NHHRC 2009). As a result, tax arrangements for private health insurance, including the Medicare levy surcharge and the private health insurance tax offset, need to be assessed in light of an overall review of this sector. In keeping with this, the Review has only assessed the operation of these mechanisms in relation to the tax and transfer systems. It has not assessed the role, purpose and funding of private health insurance.
A1 — Personal income tax
Page 37
A1–2 Income from work and deductions
Key points
A broad definition of taxable income is both fair and efficient. Income from work should be taxed on a more consistent basis, whether it comes from wages and salaries, fringe benefits or superannuation contributions. Tax exemptions should not apply to income from work.
Fringe benefits that are readily valued and attributable to individual employees should be taxed in the hands of employees. To ease compliance costs for employers, valuation and apportionment methodologies should be simplified, and the scope of fringe benefits streamlined.
Arrangements to prevent the transfer or alienation of income arising from work are important to the integrity of the tax system, and should be improved.
Earned income that is subject to taxation should continue to be net of the costs required to earn that income, although those costs should be more tightly defined as those necessary to producing the income. A standard deduction should be introduced to cover work-related expenses and the costs of managing tax affairs for most taxpayers, although individuals with high expenses should continue to be able to claim all expenses with full substantiation.
The consistent taxation of income from work is fundamental to a fair and efficient tax system, ensuring that people with the same level of earned income are treated similarly, regardless of how they are paid, their occupation, or their employment status. Treating different forms of earned income in a similar way for tax purposes avoids creating incentives for people to structure their income purely for the sake of minimising their tax.
For employees, remuneration comprises three main elements:
• wages and salaries, which are generally taxed according to the personal income tax rates scale, although some forms of wages and salary are tax-exempt;
• employer superannuation contributions, which are included in the taxable income of the fund, and are subject to 15 per cent tax; and
• fringe benefits (non-cash benefits in the form of free or discounted goods and services provided by an employer to an employee), which are taxed in the employer’s hands at the top marginal tax rate. In 2007–08, around 1.5 million employees received fringe benefits, such as cars and housing.
For self-employed people, some profits from their self-employment or business also represent labour income.
Some forms of income are neither from work nor from savings — most notably transfer payments. Income support and supplementary payments replace or supplement wage and salary income.
Australia's future tax system — Report to the Treasurer
Page 38
The costs associated with producing income are deductible for tax purposes. For employees, this takes the form of a deduction for work-related expenses; for self-employed people, a deduction for expenses necessarily incurred in operating a business. The costs of managing tax affairs are claimed by large numbers of people with earned income, as well as those with savings and investment income. Other allowable deductions include gifts to deductible gift recipients.
Various kinds of income are exempt from tax. Some of these are income from work, including certain forms of foreign and Defence force income. Some are not directly from work but have similar characteristics. These include superannuation benefits from a taxed source for people aged 60 or more, government transfer payments (of which some but not all are exempt), and government scholarships. Others are unlike work income, such as one-off bonuses from government and lump sum damages payments.
Principles
All income from work should be taxed consistently. This includes wages and salaries, fringe benefits (where they are a direct substitute for salary and wages), employer superannuation contributions, and the returns from self-employment.
Tax exemptions should not apply to income from work.
Employee income Employee income most commonly takes the form of wages and salary, which are taxed through the personal income tax rates scale. A general principle of the income tax system is that amounts derived from employment or as a reward for services should be taxable. However, some forms of income from work are specifically exempted from tax, giving rise to inequities between taxpayers.
Wage and salary tax exemptions
Wages and salary are generally subject to the personal income tax rates scale. However, some income from work is exempt from tax, giving rise to horizontal inequities between employees.
Employment-related exempt payments
Genuine redundancy payments, foreign termination payments and certain payments from approved early retirement schemes are exempt from income tax.
The tax free arrangements for termination payments affect horizontal equity, as individuals with the same total income have different tax liabilities and different entitlements for means tested government assistance. The subjective definitions for redundancy payments and certain payments from approved early retirement schemes also complicate the income tax law. The exemption of these payments is inconsistent with the tax treatment of other forms of work income. The definitions used to determine whether a termination payment qualifies for an exemption are opaque and subjective.

A1 — Personal income tax
Page 39
Foreign income and income of foreign residents
The worldwide income of Australian residents and the Australian-source income of foreign residents is generally taxable, subject to the obligations set out in Australia’s bilateral tax treaties and other international agreements.
As a general rule, payments in respect of employment or that are rewards for service are treated as taxable income. However, an exemption applies to some payments to foreign experts and officials for service or advice they provide in Australia, or work they undertake in relation to certain Australian government projects.
Exempting payments for work on some overseas projects or for expert foreign advice creates horizontal inequities between individuals and is contrary to basic income tax principles. Exempting some payments for foreign employment from tax also has a cost to revenue. The revenue forgone as a result of the exemption of income of individuals employed on certain overseas projects is estimated at $520 million in 2008–09.
Defence and disciplined force payments
Members of disciplined forces such as the Australian Defence Force and the Australian Federal Police may receive taxation concessions on their income depending on the location of their duty and period of service. Defence force members serving on ‘warlike’ operations receive a full income tax exemption for pay and allowances earned while on deployment. Members serving on ‘non-warlike’ operations receive an exemption of pay and allowances earned while engaged in foreign service for a continuous period of not less than 91 days. Australian Federal Police deployed on International Deployment Group missions who are subject to Commander orders also receive this exemption. Further, supplementary remuneration for Defence force personnel such as deployment allowance and separation allowance are exempt from income tax.
The cost to revenue of exempting pay and allowances of Defence force personnel deployed on ‘warlike’ service is estimated at $120 million in 2008–09. The cost of the exemption for part-time Defence reservist pay and allowances is estimated at $40 million in 2008–09. Delivering these benefits as outlays would involve minimal net cost to the budget.
Finding
Wages and salary are generally taxed according to the personal income tax rates scale, but concessions apply to income in the form of superannuation and fringe benefits. A number of forms of remuneration from work are exempt from tax.

Australia's future tax system — Report to the Treasurer
Page 40
Reform directions — tax all forms of wages and salary consistently with minimal exemptions
Recommendation 8:
All forms of wages and salary for Australian resident taxpayers should be taxable on an equivalent basis and without exemptions.
(a) Private education payments provided in respect of employment or as an incentive to undertake employment and employment-related payments should be assessed as income and taxed at marginal tax rates.
(b) The broad exemptions for foreign employment income should be removed and such income should be taxed at marginal tax rates.
(c) Defence and disciplined forces payments should be taxable and direct remuneration increased for affected personnel.
A simple and fair system would treat all forms of employee remuneration and related amounts in the same way, upholding the basic income tax rule that amounts derived from employment or as a reward for services are taxable. Pay and allowances for individuals working on government-approved overseas projects would be taxable in accordance with this principle. Pay and allowances of Defence and disciplined forces would also be taxed, with compensation provided through increases in direct remuneration.
All private education payments provided in respect of employment or as an incentive to undertake particular employment (such as bonded scholarships) should be taxable. However, government payments that are similar in nature to income support, such as scholarships or bursaries paid to a full-time student at a school, college or university, should be exempt from tax. This would align the tax treatment of these payments with that of income support. Taxing forms of remuneration that are currently exempt from tax may require employers and other bodies to make higher payments or individuals may receive lower disposable income.
Foreign-source employment income derived by an Australian resident and Australian-source employment income derived by a foreign resident should be taxable irrespective of whether the income is incurred on work for government or private entities, or for particular purposes. The tax status of payments for employment should not depend on whether the employer is government or non-government. If appropriate, compensation may be provided through direct remuneration.
Other exemptions from tax A tax exemption is appropriate in some circumstances, although not for income from work. An exemption may be justified when payments are one-off in nature and not related to income-producing activities, such as compensation payments and personal injury awards, and government grants and one-off payments. An exemption may also be justified where double taxation would otherwise apply.
Superannuation contributions Compulsory superannuation contributions are included in the taxable income of the fund, which is subject to 15 per cent tax. This concession means that there are distinct advantages

A1 — Personal income tax
Page 41
to taking income in the form of superannuation, and these advantages are greater the higher the income of the recipient. The taxation arrangements for superannuation are discussed in detail in Section A2.
Fringe benefits Fringe benefits tax (FBT) was introduced in 1986 and applies where non-cash benefits are provided by an employer to an employee — such as through the provision of free or discounted goods and services. In most cases, fringe benefits are provided as a substitute for salary and wages; however, in some cases, they are incidental to an individual’s employment.
Table A1–3 shows the major categories of fringe benefits, which were collectively valued at $7.2 billion in 2007–08. The value of fringe benefits has risen sharply in recent years, particularly in relation to car parking benefits, housing benefits, and living away from home allowances.
Table A1–3: Taxable value of fringe benefits by type, 2007–08(a) Type of fringe benefit Value ($m) Expense payment(b) 3,827.9 Car benefit – statutory formula 1,624.3 – operating cost 147.3 Car parking 213.3 Property 147.9 Meal entertainment 416.2 Housing benefit 303.0 Living away from home allowance 90.6 Entertainment 43.3 Loan fringe benefit 28.1 Debt waiver 19.6 Board 5.4 Airline transport 1.8 Residual 319.3 TOTAL BENEFITS(c) 7,188.1
(a) Total FBT payable was $3,772 million in 2007–08. (b) Expense payments arise where an employer reimburses an employee for expenses they incur, or pays a third party to meet
expenses incurred by an employee. In either case, the expenses may be business expenses or private expenses, or a combination of the two.
(c) Totals may not add due to rounding. Source: ATO (2009). As Table A1–4 shows, Australia’s fringe benefits tax system is complex, like those of many other countries. There are, however, some differences in the way in which Australia taxes fringe benefits. While the FBT system has the same broad tax base as other countries, it relies on a higher number of statutory valuation rules and a greater number of concessions and exemptions. The complexity of Australia’s FBT system is exacerbated by the taxation of fringe benefits in the hands of employers, which has required the introduction of a large number of supplementary rules to ensure that fringe benefits are factored into means tests in the tax and transfer systems.
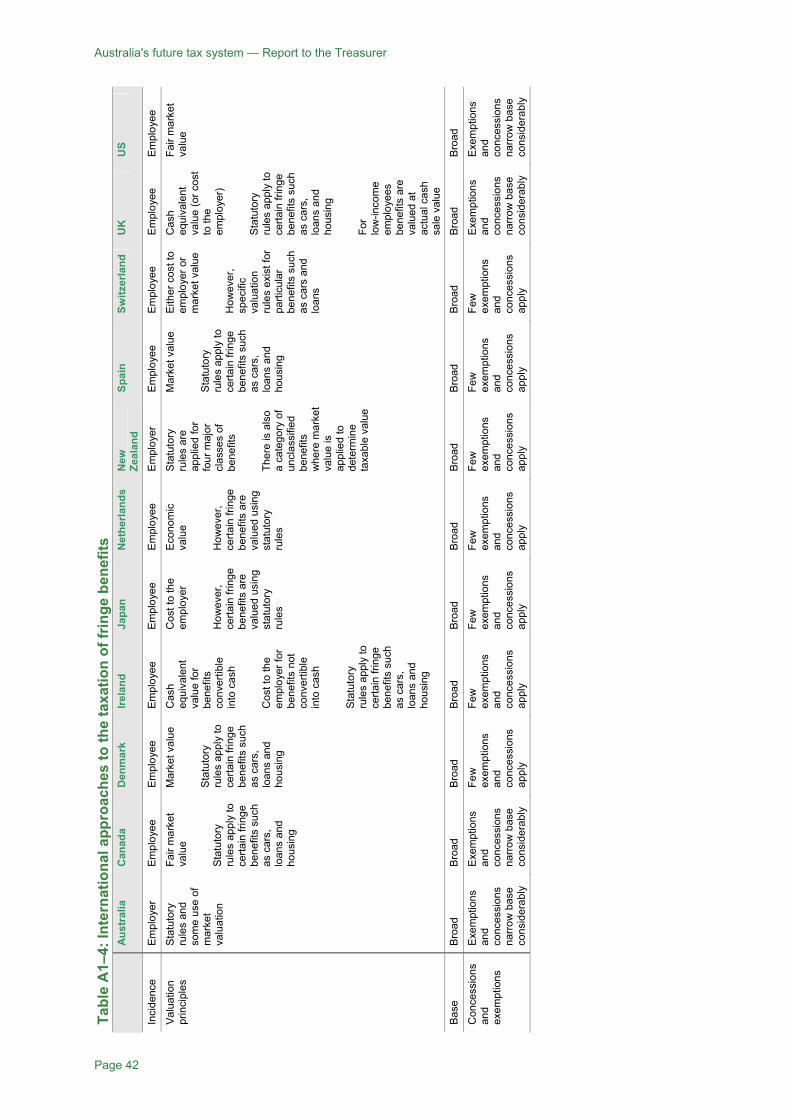
Australia's future tax system — Report to the Treasurer
Page 42
Tabl
e A
1–4:
Inte
rnat
iona
l app
roac
hes
to th
e ta
xatio
n of
frin
ge b
enef
its
A
ustr
alia
C
anad
a D
enm
ark
Irela
nd
Japa
n N
ethe
rland
s N
ew
Zeal
and
Spai
n Sw
itzer
land
U
K
US
Inci
denc
e E
mpl
oyer
E
mpl
oyee
E
mpl
oyee
E
mpl
oyee
E
mpl
oyee
E
mpl
oyee
E
mpl
oyer
E
mpl
oyee
E
mpl
oyee
E
mpl
oyee
E
mpl
oyee
Val
uatio
n pr
inci
ples
S
tatu
tory
ru
les
and
som
e us
e of
m
arke
t va
luat
ion
Fair
mar
ket
valu
e S
tatu
tory
ru
les
appl
y to
ce
rtain
frin
ge
bene
fits
such
as
car
s,
loan
s an
d ho
usin
g
Mar
ket v
alue
S
tatu
tory
ru
les
appl
y to
ce
rtain
frin
ge
bene
fits
such
as
car
s,
loan
s an
d ho
usin
g
Cas
h eq
uiva
lent
va
lue
for
bene
fits
conv
ertib
le
into
cas
h C
ost t
o th
e em
ploy
er fo
r be
nefit
s no
t co
nver
tible
in
to c
ash
Sta
tuto
ry
rule
s ap
ply
to
certa
in fr
inge
be
nefit
s su
ch
as c
ars,
lo
ans
and
hous
ing
Cos
t to
the
empl
oyer
H
owev
er,
certa
in fr
inge
be
nefit
s ar
e va
lued
usi
ng
stat
utor
y ru
les
Eco
nom
ic
valu
e H
owev
er,
certa
in fr
inge
be
nefit
s ar
e va
lued
usi
ng
stat
utor
y ru
les
Sta
tuto
ry
rule
s ar
e ap
plie
d fo
r fo
ur m
ajor
cl
asse
s of
be
nefit
s Th
ere
is a
lso
a ca
tego
ry o
f un
clas
sifie
d be
nefit
s w
here
mar
ket
valu
e is
ap
plie
d to
de
term
ine
taxa
ble
valu
e
Mar
ket v
alue
S
tatu
tory
ru
les
appl
y to
ce
rtain
frin
ge
bene
fits
such
as
car
s,
loan
s an
d ho
usin
g
Eith
er c
ost t
o em
ploy
er o
r m
arke
t val
ue
How
ever
, sp
ecifi
c va
luat
ion
rule
s ex
ist f
or
parti
cula
r be
nefit
s su
ch
as c
ars
and
loan
s
Cas
h eq
uiva
lent
va
lue
(or c
ost
to th
e em
ploy
er)
Sta
tuto
ry
rule
s ap
ply
to
certa
in fr
inge
be
nefit
s su
ch
as c
ars,
lo
ans
and
hous
ing
For
low
-inco
me
empl
oyee
s be
nefit
s ar
e va
lued
at
actu
al c
ash
sale
val
ue
Fair
mar
ket
valu
e
Bas
e B
road
B
road
B
road
B
road
B
road
B
road
B
road
B
road
B
road
B
road
B
road
Con
cess
ions
an
d ex
empt
ions
Exe
mpt
ions
an
d co
nces
sion
s na
rrow
bas
e co
nsid
erab
ly
Exe
mpt
ions
an
d co
nces
sion
s na
rrow
bas
e co
nsid
erab
ly
Few
ex
empt
ions
an
d co
nces
sion
s ap
ply
Few
ex
empt
ions
an
d co
nces
sion
s ap
ply
Few
ex
empt
ions
an
d co
nces
sion
s ap
ply
Few
ex
empt
ions
an
d co
nces
sion
s ap
ply
Few
ex
empt
ions
an
d co
nces
sion
s ap
ply
Few
ex
empt
ions
an
d co
nces
sion
s ap
ply
Few
ex
empt
ions
an
d co
nces
sion
s ap
ply
Exe
mpt
ions
an
d co
nces
sion
s na
rrow
bas
e co
nsid
erab
ly
Exe
mpt
ions
an
d co
nces
sion
s na
rrow
bas
e co
nsid
erab
ly

A1 — Personal income tax
Page 43
In looking at the FBT system, the Review has considered narrowing the fringe benefits tax base and instead denying deductions for employers. While this approach would be simpler, it would also give rise to significant integrity and equity issues.
There is scope to reform the legal incidence of FBT, valuation methodologies and concessions and exemptions in a way that would reduce compliance costs for employers and employees and would deliver greater neutrality in the treatment of cash and non-cash remuneration.
Legal incidence
Most OECD countries either tax fringe benefits in the hands of employees, or align fringe benefits taxation with the employee’s personal income tax rate.
In Australia, FBT is paid by employers (including government employers) at the top personal income tax rate plus the Medicare levy (currently 46.5 per cent), irrespective of the income of the employee receiving the fringe benefit. Submissions express concern that the application of the top marginal rate is inequitable, as employees ultimately bear the economic incidence of FBT. In 2007–08, less than 12 per cent of employees with reportable fringe benefits were in the top marginal tax bracket (even accounting for the value of their fringe benefits).
The value of reportable fringe benefits is included on an employee’s payment summary on a ‘grossed-up’ basis — that is, the value of the fringe benefit is increased to reflect the value of income tax (at the top personal rate) that would be paid if the fringe benefit were purchased out of the employee’s after-tax income.
Means tests in the tax system generally take account of the grossed-up value of fringe benefits; however, as Box A1–1 indicates, means tested transfers generally reflect the net or ‘cash’ value of fringe benefits (with the exception of the income test to assess child support liability).
Box A1–1: Fringe benefits and transfer payments
The 2006–07 Budget announced that the grossed-up value of fringe benefits would be included in the means test for family assistance payments from 1 July 2008. The Government reversed this measure on 19 June 2008, citing concerns over the implications for employees in the not-for-profit (NFP) sector.
As many NFP organisations are eligible for FBT concessions, employees in the NFP sector are more likely to receive their income as fringe benefits. Further, these employees often receive lower wages (and are hence taxed at lower rates) given the charitable nature of their work.
This issue was explicitly referred to the Review for consideration.
Finding
The current FBT arrangements are inequitable as they apply the top marginal tax rate regardless of the income of the recipient employee.

Australia's future tax system - Report to the Treasurer
Page 44
Valuation and reporting arrangements
The current approach to valuing fringe benefits is to use market value in some cases, complemented by a large number of statutory valuation methodologies. Submissions from business have expressed concern that these methodologies are highly complex, particularly in relation to meal entertainment. One submission claimed that a business meal can potentially be valued in 39 different ways for FBT purposes.
In some cases, any one of a number of methodologies may be used to value a single benefit. Generally, all the methodologies deliver broadly similar results. For example, property fringe benefits can be assessed in five different ways, all of which seek to proxy market value. Nonetheless, anecdotal evidence suggests that employers calculate the value of a fringe benefit using all available methodologies and then choose the lowest valuation. This results in unnecessary compliance costs. Table A1–5 shows that the compliance costs for FBT are significantly larger than those for other taxes (measured in terms of the costs of compliance relative to the amount of tax paid). These compliance costs are exacerbated by the need for employers to apportion the value of shared fringe benefits between employees (such as where several employees attend a business lunch).
Table A1–5: Compliance surtax(a) Mean (%) Median (%)
Income tax 1.6 0.9
Payroll tax 0.7 0.2
Fringe benefits tax 7.6 4.8
Overall 2.9 1.2 (a) The compliance surtax measures the costs of compliance for each tax relative to the amount of the tax paid. For example,
an organisation that incurs $2 in compliance costs for every $100 it pays in GST would face a compliance surtax of 2 per cent for GST.
Source: PricewaterhouseCoopers (2009). Concessions and exemptions
Market value is not applied as broadly as it could be, due to the volume of fringe benefits that receive concessional or exempt treatment. Many of these concessions and exemptions have a historical basis that is no longer relevant. For example, the concession applied to the living away from home allowance has evolved to encompass expenses that are essentially private in nature. This has led to inequities in employee remuneration.
The FBT concessions and exemptions have a significant impact on the FBT base. In 2008–09, FBT concessions and exemptions were estimated at $3.3 billion (Treasury 2009), while FBT revenue collections amounted to $3.6 billion.8
Not-for-profit organisations
Fringe benefits received by employees of certain NFP organisations attract concessional FBT treatment. For example, public benevolent institutions and health promotion charities receive a $30,000 capped exemption from FBT per employee — that is, the first $30,000 of fringe benefits received by each employee is exempt from FBT. Public and not-for-profit hospitals and public ambulance services receive a $17,000 capped exemption. Meal entertainment expenses, entertainment facility leasing expenses, and car parking expenses
8 The ratio of concessionality to revenue collections is underestimated due to the omission of many fringe benefits from quantification in the TES (for example, in-house childcare).
A1 — Personal income tax
Page 45
do not count towards the caps. Anecdotal evidence suggests that the benefits of these concessions are shared between employers and employees (although the benefits are more likely to accrue to employees).
In addition, certain not-for-profit, non-government bodies are eligible for a 48 per cent rebate of FBT that would otherwise be payable. The rebate applies to the first $30,000 worth of benefits per employee and reflects the fact that these employers do not benefit from tax deductibility for the cost of fringe benefits. In general, the rebate applies to religious institutions, not-for-profit scientific or educational institutions, charitable institutions, schools, trade unions, and associations of employers or employees. The rebate also applies to not-for-profit societies, organisations, and clubs that are exempt from income tax.
Submissions to the Review have expressed concern that the FBT concessions for NFP organisations result in horizontal inequity, as they are not equally accessible by all employees. For example, one submission notes that the FBT arrangements favour nurses in public and not-for-profit hospitals, even though they provide identical or similar services to their private hospital counterparts. Public and NFP hospitals argue that the concessions have a ‘profound’ impact on their ability to attract and retain staff and are a highly sensitive factor in their overall remuneration strategy.
Findings
Fringe benefit valuation and apportionment methodologies impose unnecessary compliance costs on employers and have embedded high levels of concessionality in the FBT system.
Most of the existing FBT concessions and exemptions have a historical basis that is no longer relevant. This has eroded the FBT tax base.
While the FBT concessions provided to certain NFP organisations help them deliver their services, they result in horizontal inequity and undermine the perceived integrity and fairness of the tax system.
Car fringe benefits
There are two approaches for determining the taxable value of car fringe benefits, the statutory formula and the operating cost method:
• The statutory formula applies so that the taxable value of a car fringe benefit falls as total kilometres rise. At the margin, this may create an incentive for individuals to travel additional kilometres to reduce the taxable value of their car (particularly at the points at which the statutory fraction falls — 15,000, 25,000 and 40,000 kilometres) (see Chart 1–13). This increases pollution and road congestion.
• Under the operating cost method, the actual operating costs of a car (for example, all car expenses, depreciation, registration, and insurance) are apportioned between business use and non-business use, as determined by a log book maintained over a 12-week period. The non-business portion of the operating costs is the value of the car fringe benefit. While the operating cost method provides a more accurate valuation than the statutory formula, it imposes a high compliance burden for users with low levels of business use.

Australia's future tax system - Report to the Treasurer
Page 46
Chart A1–13: Number of vehicles by kilometres travelled (2007–08 fringe benefits tax (FBT) year)
0
500
1,000
1,500
2,000
2,500
3,0000
2,00
0
4,00
0
6,00
0
8,00
0
10,0
00
12,0
00
14,0
00
16,0
00
18,0
00
20,0
00
22,0
00
24,0
00
26,0
00
28,0
00
30,0
00
32,0
00
34,0
00
36,0
00
38,0
00
40,0
00
Annualised kilometres travelled in the FBT year
0
500
1,000
1,500
2,000
2,500
3,000Number of cars Number of cars
Source: Based on SG fleet submission to the 2009 Review of Australia's Automotive Industry, as cited in the AFTS submission of the Federal Chamber of Automotive Industries.
Finding
The existing statutory formula for valuing car fringe benefits applies a reduced taxable value the further a vehicle is driven. At the margin, this may encourage individuals to travel unnecessary kilometres.

A1 — Personal income tax
Page 47
Reform directions — treat reportable fringe benefits like salary and wages
Recommendation 9:
Fringe benefits that are readily valued and attributable to individual employees should be taxed in the hands of employees through the PAYG system. Other fringe benefits, including those incidental to an individual’s employment, should remain taxed to employers at the top marginal rate (and non-reportable for employees). The scope of fringe benefits that are subject to tax should be simplified.
(a) Market value should generally be used to value fringe benefits (with an appropriate adjustment for employee contributions).
(b) The current formula for valuing car fringe benefits should be replaced with a single statutory rate of 20 per cent, regardless of the kilometres travelled.
(c) All fringe benefit tax (FBT) exemptions should be reviewed to determine their continuing appropriateness. To improve simplicity, consideration should also be given to excluding fringe benefits from tax where the costs of compliance outweigh equity and tax integrity considerations. The broad definition of fringe benefits in the FBT law could be reviewed to exclude essential workplace items such as chairs, stationery and toilets.
(d) For fringe benefits that are taxed in the hands of employers, a small de minimis threshold, below which fringe benefits are exempt from tax, should apply. The threshold could vary depending on the number of employees within an organisation.
(e) Not-for-profit entities’ FBT concessions should be reconfigured (see Section B3). The FBT exemptions for members of the Defence force should be replaced with direct remuneration increases for affected personnel (see related Recommendation 8c).
Shift the legal incidence of reportable fringe benefits to employees
Fringe benefits that can readily be valued and assigned to a particular employee should be taxable in the employee’s hands and reportable for transfer purposes. Other benefits that are incidental to an individual’s employment or difficult to assign should be taxable to the employer at the top marginal tax rate (and be non-reportable for the employee for transfer purposes). The scope of fringe benefits that are subject to tax should be simplified.
This approach would provide a more neutral taxation of income, regardless of whether it is received as cash or fringe benefits. By removing the need for the current grossing-up process, it would also facilitate the consistent and equitable treatment of fringe benefits for means tested taxes and transfers (thereby addressing the issues raised in Box A1–1).
Under this approach, responsibility for valuing fringe benefits and including their taxable value on employee payment summaries would remain with employers. These tasks would be simplified through the proposed reforms to FBT valuation methodologies discussed below.
The transition to the new arrangements would require the renegotiation of remuneration packages for employees currently receiving fringe benefits. Collecting FBT fortnightly through the PAYG withholding schedules (rather than quarterly instalments) may require some level of smoothing to minimise fluctuations in tax payments. To facilitate these
Australia's future tax system - Report to the Treasurer
Page 48
processes, a lead-in period of at least two years should be provided before any changes take effect.
Adopt greater usage of market valuation
To simplify the valuation of fringe benefits, market valuation should be more widely used.
Market value represents the amount an employee would need to spend to purchase the same fringe benefit in the market (rather than the cost to the employer of providing the benefit). For example, the cost of discounted travel supplied by a public transport provider to its employees would be measured not in terms of the marginal cost to the provider (which is almost zero), but the cost of the travel for members of the public.
Market valuation would reduce compliance costs and provide a clear outcome for employers. It would also facilitate a significant reduction in the volume of FBT legislation (around 400 pages), much of which describes valuation and apportionment methodologies.
Table A1–6 summarises the different approaches to valuation in the current system, and the proposed valuation framework.
In most cases, market value is readily identifiable (such as where an employer reimburses an employee for a holiday). However, to assist employers and ease compliance costs, market valuation could be supported through ATO guidelines. Unlike the valuation methodologies in the FBT law, the guidelines could be quickly and easily adjusted to changing circumstances. The ATO could also provide a ruling about the market value of a fringe benefit in less common cases.
Market valuation would require an appropriate adjustment to account for any employee contributions; for example, rent paid by an employee receiving a housing fringe benefit would be deducted from the market value of the benefit to determine its taxable value.
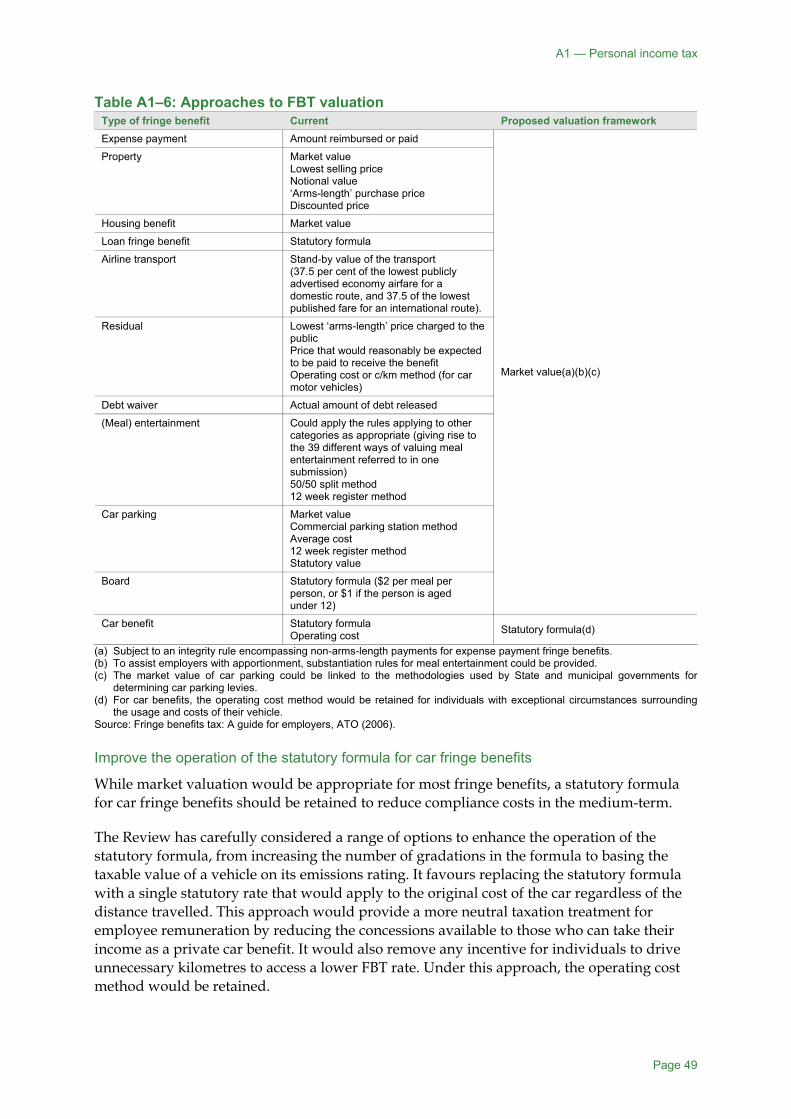
A1 — Personal income tax
Page 49
Table A1–6: Approaches to FBT valuation Type of fringe benefit Current Proposed valuation framework Expense payment Amount reimbursed or paid
Property Market value Lowest selling price Notional value ‘Arms-length’ purchase price Discounted price
Housing benefit Market value
Loan fringe benefit Statutory formula
Airline transport Stand-by value of the transport (37.5 per cent of the lowest publicly advertised economy airfare for a domestic route, and 37.5 of the lowest published fare for an international route).
Residual Lowest ‘arms-length’ price charged to the public Price that would reasonably be expected to be paid to receive the benefit Operating cost or c/km method (for car motor vehicles)
Debt waiver Actual amount of debt released
(Meal) entertainment Could apply the rules applying to other categories as appropriate (giving rise to the 39 different ways of valuing meal entertainment referred to in one submission) 50/50 split method 12 week register method
Car parking Market value Commercial parking station method Average cost 12 week register method Statutory value
Board Statutory formula ($2 per meal per person, or $1 if the person is aged under 12)
Market value(a)(b)(c)
Car benefit Statutory formula Operating cost Statutory formula(d)
(a) Subject to an integrity rule encompassing non-arms-length payments for expense payment fringe benefits. (b) To assist employers with apportionment, substantiation rules for meal entertainment could be provided. (c) The market value of car parking could be linked to the methodologies used by State and municipal governments for
determining car parking levies. (d) For car benefits, the operating cost method would be retained for individuals with exceptional circumstances surrounding
the usage and costs of their vehicle. Source: Fringe benefits tax: A guide for employers, ATO (2006). Improve the operation of the statutory formula for car fringe benefits
While market valuation would be appropriate for most fringe benefits, a statutory formula for car fringe benefits should be retained to reduce compliance costs in the medium-term.
The Review has carefully considered a range of options to enhance the operation of the statutory formula, from increasing the number of gradations in the formula to basing the taxable value of a vehicle on its emissions rating. It favours replacing the statutory formula with a single statutory rate that would apply to the original cost of the car regardless of the distance travelled. This approach would provide a more neutral taxation treatment for employee remuneration by reducing the concessions available to those who can take their income as a private car benefit. It would also remove any incentive for individuals to drive unnecessary kilometres to access a lower FBT rate. Under this approach, the operating cost method would be retained.
Australia's future tax system - Report to the Treasurer
Page 50
Review the existing FBT exemptions
The existing FBT exemptions should be reviewed. Consideration should be given to exempting fringe benefits from tax where the costs of compliance outweigh equity and tax integrity considerations. The broad definition of fringe benefits in the FBT law could also be reviewed to exclude essential workplace items such as chairs, stationery and toilets.
The exemptions relating to not-for-profit organisations and the Australian Defence Force should be reconfigured.
As discussed in Section B3, all NFP FBT concessions should be phased out over 10 years, to be replaced with annual direct government funding.
The important contribution of Australians serving overseas is best recognised through direct salary and wages, rather than complex fringe benefits tax concessions and exemptions. Consistent with this principle, the existing exemptions should be replaced with direct remuneration increases for affected personnel. This would simplify the tax system, while still recognising the hardships that members face while serving in particular localities.
Introduce a single threshold for non-reportable fringe benefits
The existing FBT thresholds, encompassing the $300 exemption for minor benefits, the $1,000 exemption for in-house benefits, and the $2,000 exemption for reportable fringe benefits, should be removed.
Non-reportable fringe benefits should be subject to a small de minimis threshold, below which benefits would be exempt from tax. The threshold could vary depending on the number of employees within an organisation. It should be set at a level that encompasses minor benefits to reduce compliance costs for employers.
Income from self-employment Income from self-employment is generally assessed on the same basis as income from employment. Aspects of the current income tax system may provide a favourable treatment to self-employment income. These include the retention of profits in a company to defer any additional personal income tax, the greater ability in practice to claim deductions for expenses (such as home office and travel expenses), and the greater ability to arrange income splitting.
Some self-employed people may also benefit from tax concessions applying to capital gains (the general 50 per cent capital gains discount), or small business capital gains (the small business capital gains tax concessions) and measures designed to reduce small business compliance costs (under the small business tax framework).
The capital gains discount and concessions can be particularly beneficial. For many business owners, their personal effort and investment of capital is rewarded through the appreciating value of their business and its assets. This is most common in businesses that can create valuable intangible assets such as business goodwill, customer lists and brand names, or other businesses with appreciating tangible assets such as land.
For these self-employed people, and their businesses, the capital gains tax arrangements provide two advantages. First, taxation is deferred until the gain is realised, and, secondly,

A1 — Personal income tax
Page 51
the amount of the gain taxed on realisation is significantly discounted. As a consequence, while 100 per cent of an employee’s income is generally taxed as it is earned, income from self-employment may not be taxed until later and then only in small part. For example, on the sale of goodwill that benefits from the general and active assets discounts, only 25 per cent of the gain would be taxable.
Favourable treatment of self-employment income over income from salaried employment may give rise to efficiency or equity concerns, depending on the ultimate effects of that treatment. A tax that applies only to employees’ wages creates incentives for people to shift from being employees to being self-employed and operating their own business.
To the extent that the burden of a tax on employment is spread to all workers, there is an efficiency cost because the allocation of labour in the economy is biased by the tax or because compliance costs are increased by efforts to artificially characterise wages as income from self-employment. To the extent that the burden of the tax is not spread, there may be equity concerns as a self-employed person on a given income pays less tax than an employed person on the same income.
Alienation of personal services income
Specific rules target the alienation of personal services income to a partnership, trust or company. The rules are effectively aimed at personal services income (income from working) earned by people in employee-like cases (such as dependent contractors). The rules are designed to prevent income splitting and the deferral of tax. They also act to ensure that deductions relating to such alienated income are limited to those available to employees.
While these specific rules have had some effect, their scope is generally limited to employee-like cases, compliance is poor, they are complex and a good deal of uncertainty remains around their operation (Board of Taxation 2009).
For personal services income arising in other cases (as well as cases covered by the specific rules above), general provisions and anti-avoidance rules are used to limit the alienation of income attributable to the efforts or exertion of a person. This includes alienation achieved both through the interposition of an entity like a partnership or trust, and through payments to associates (such as relatives who provide some services, or the use of service trusts by professional partnerships). Enforcement of these provisions and rules can be difficult and uncertain.
Findings
Some self-employed people can benefit from a relatively favourable tax outcome compared to an employee undertaking similar work.
Current rules limit, but do not eliminate, the scope for the alienation or assignment of an individual’s earned income to other people or legal entities. These rules are not fully effective, and are complex and uncertain.
Australia's future tax system - Report to the Treasurer
Page 52
Reform directions — limit the alienation of personal services income
Recommendation 10:
Consideration should be given to a revised regime to prevent the alienation of personal services income that would extend to all entities earning a significant proportion of their business income from the personal services of their owner-managers, whether in employee-like or non-employee-like cases. This regime may also apply an arm’s length rule to deductions arising from payments to associates to ensure deductions reflect the value of services provided.
Effective rules are required to deal with the alienation of income arising from a person’s work and the possibility of income splitting or tax deferral. The ability to alienate such income undermines the individual basis of taxation and the overall progressivity of the personal income tax system. It also means that some taxpayers may be advantaged over others and poses a risk that labour and other resources will be misallocated as people move to occupations or forms of employment more suited to alienation.
A major failing with the current approach is that it attempts to distinguish between personal services income arising in employee-like cases and other personal services income, when in either case alienation or income splitting is inconsistent with the choice of the individual as the unit of taxation and with progressive income tax rates.
Consistent with an option raised in the Board of Taxation’s recent post-implementation review of the alienation of personal services income rules, consideration could be given to a revised regime that would extend to all entities earning a significant part of their income from the personal services of their owner-managers, including personal services businesses (Board of Taxation 2009).
The focus would be on personal services income in general, and not on whether the income was derived by the taxpayer acting in, say, an employee-like capacity. Personal services income, as now, could be defined as income that is mainly a reward for personal exertion. Alternatively, the rules could be more explicitly aimed at closely-held entities where a set proportion of the business income of the entity arises from the efforts of owner-managers.
Such a revised regime, like the existing rules, would not apply to businesses with significant assets, as a significant proportion of the profits of such businesses include a return on investment and savings, rather than earned income.
Income splitting opportunities could also be further limited by applying an arm’s length rule to deductions arising from payments to associates, to ensure deductions reflect the value of services provided.
Such approaches could provide a more effective constraint on the alienation of earned income, while simplifying the law and making administration easier (Board of Taxation 2009). It would also temper the additional incentives to alienate earned income to a company that may arise from any future reduction in the company income tax rate (see Section B1).
A1 — Personal income tax
Page 53
Deductions Tax deductions are allowed for a range of expenses. Beyond those associated with earning income, deductions are available for the cost of managing tax affairs, and for gifts to deductible gift recipients. Deductions for deriving income from savings are discussed in the following section.
The costs of earning income
The personal income tax system allows deductions for the costs incurred in producing income. In the case of employee income, this entails the deductibility of work-related expenses, including expenses for self-education associated with earning income. For self-employed people, this entails the deductibility of expenses incurred in producing their assessable income, and expenses necessarily incurred in carrying on their business to produce income.
These deductions are consistent with the Schanz-Haig-Simons definition of income, under which income represents the increase in a person’s stock of assets in a period, plus their consumption in the period (with consumption including expenditure other than that incurred in producing income). There are important equity reasons for maintaining this approach; that is, it is fair to recognise that people with the same level of income may incur different costs in earning that income.
Principle
Earned income subject to taxation should be net of the costs directly incurred in earning that income. Work-related expenses should be clearly defined as those that are necessary to produce income.
Australia’s tax system is relatively generous to work expense claims
Deductions for work-related expenses (WREs) are the most common claims among employees. In 2006–07, three quarters of net taxpayers claimed WREs for items including tools of trade, equipment, technical and trade books, travel, self-education and home office costs. Under specific statutory concessions, employees are able to claim certain other WREs such as uniforms and motor vehicle costs.9
WRE claims account for around 42 per cent of the value of all deductions claimed by individuals, or around $14 billion in 2006–07 (ATO 2009). Generally, the claimable amount is not capped, and the total claimed has grown substantially over time.
Most WREs are deductible for a taxpayer in a particular income year if the expense is incurred in the course of gaining or producing their assessable income and the expense is not ‘private, domestic or capital’ in nature. This provides taxpayers with a broad range of deductible expenses.
9 The statutory deduction for uniforms relates to non-compulsory uniforms — compulsory uniforms are deductible under the general provision. Motor vehicle expenses are deductible under the general provision but there are special statutory rules for valuing the expense incurred.
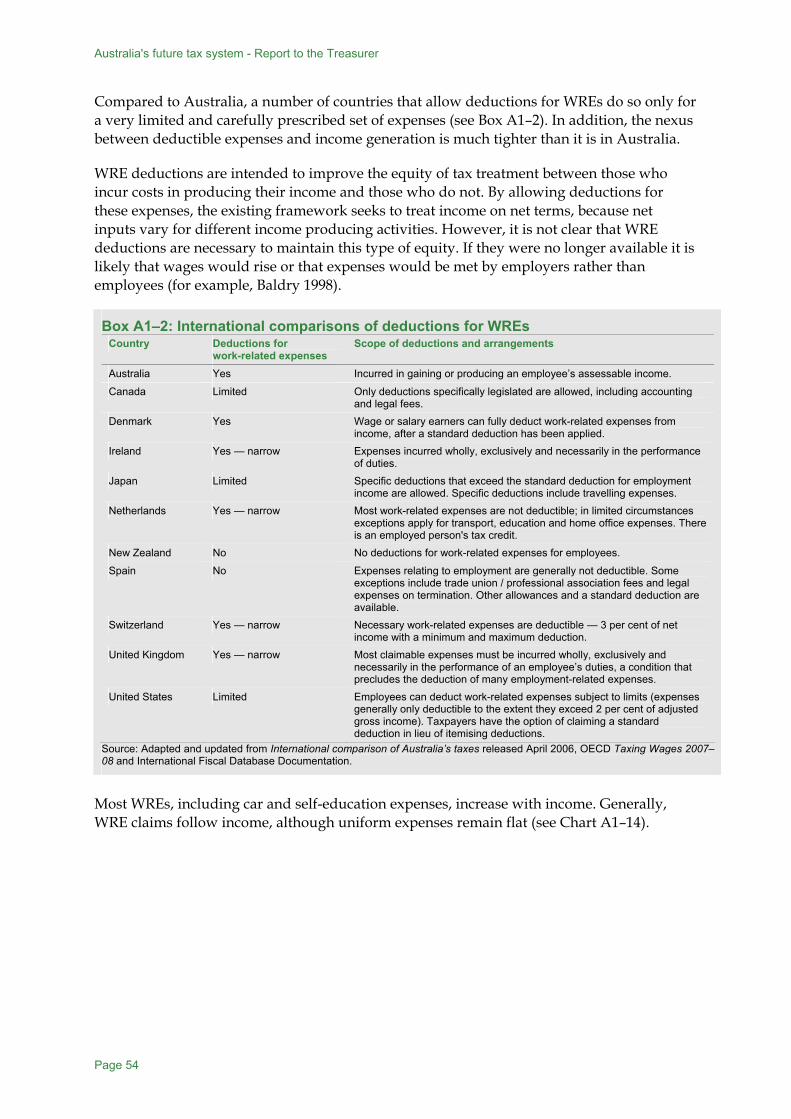
Australia's future tax system - Report to the Treasurer
Page 54
Compared to Australia, a number of countries that allow deductions for WREs do so only for a very limited and carefully prescribed set of expenses (see Box A1–2). In addition, the nexus between deductible expenses and income generation is much tighter than it is in Australia.
WRE deductions are intended to improve the equity of tax treatment between those who incur costs in producing their income and those who do not. By allowing deductions for these expenses, the existing framework seeks to treat income on net terms, because net inputs vary for different income producing activities. However, it is not clear that WRE deductions are necessary to maintain this type of equity. If they were no longer available it is likely that wages would rise or that expenses would be met by employers rather than employees (for example, Baldry 1998).
Box A1–2: International comparisons of deductions for WREs Country Deductions for
work-related expenses Scope of deductions and arrangements
Australia Yes Incurred in gaining or producing an employee’s assessable income.
Canada Limited Only deductions specifically legislated are allowed, including accounting and legal fees.
Denmark Yes Wage or salary earners can fully deduct work-related expenses from income, after a standard deduction has been applied.
Ireland Yes — narrow Expenses incurred wholly, exclusively and necessarily in the performance of duties.
Japan Limited Specific deductions that exceed the standard deduction for employment income are allowed. Specific deductions include travelling expenses.
Netherlands Yes — narrow Most work-related expenses are not deductible; in limited circumstances exceptions apply for transport, education and home office expenses. There is an employed person's tax credit.
New Zealand No No deductions for work-related expenses for employees.
Spain No Expenses relating to employment are generally not deductible. Some exceptions include trade union / professional association fees and legal expenses on termination. Other allowances and a standard deduction are available.
Switzerland Yes — narrow Necessary work-related expenses are deductible — 3 per cent of net income with a minimum and maximum deduction.
United Kingdom Yes — narrow Most claimable expenses must be incurred wholly, exclusively and necessarily in the performance of an employee’s duties, a condition that precludes the deduction of many employment-related expenses.
United States Limited Employees can deduct work-related expenses subject to limits (expenses generally only deductible to the extent they exceed 2 per cent of adjusted gross income). Taxpayers have the option of claiming a standard deduction in lieu of itemising deductions.
Source: Adapted and updated from International comparison of Australia’s taxes released April 2006, OECD Taxing Wages 2007–08 and International Fiscal Database Documentation.
Most WREs, including car and self-education expenses, increase with income. Generally, WRE claims follow income, although uniform expenses remain flat (see Chart A1–14).
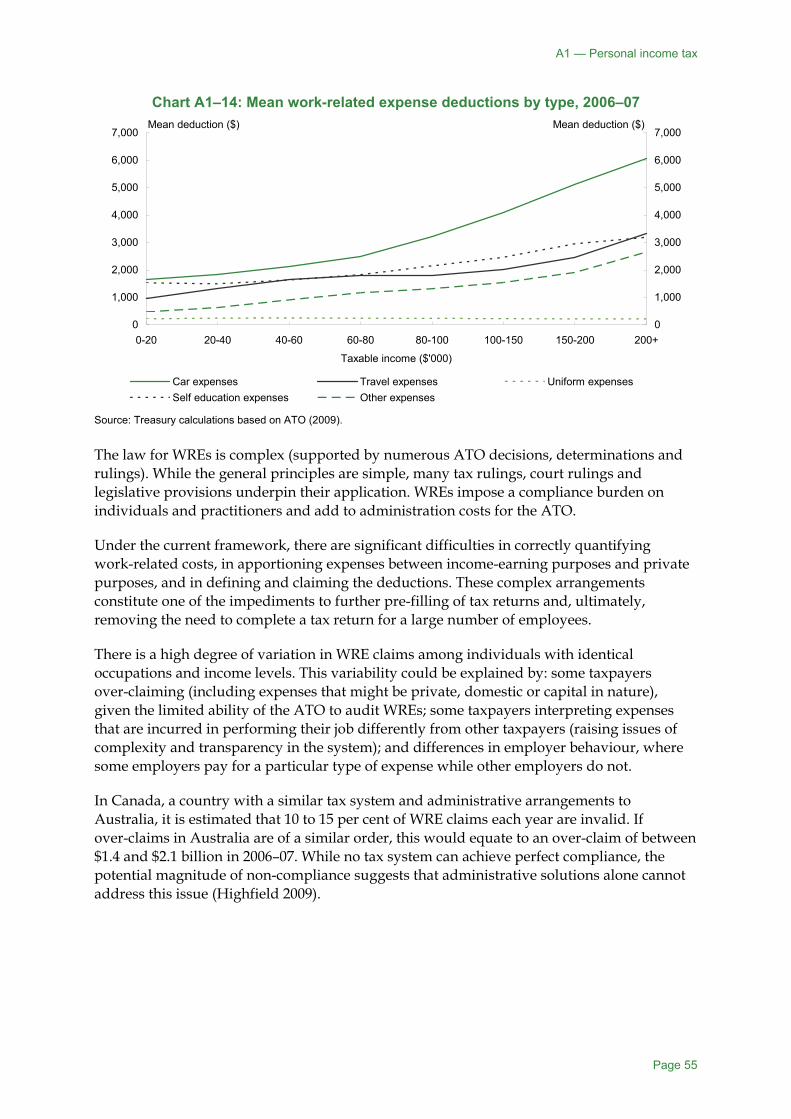
A1 — Personal income tax
Page 55
Chart A1–14: Mean work-related expense deductions by type, 2006–07
0
1,000
2,000
3,000
4,000
5,000
6,000
7,000
0-20 20-40 40-60 60-80 80-100 100-150 150-200 200+
Taxable income ($'000)
0
1,000
2,000
3,000
4,000
5,000
6,000
7,000
Car expenses Travel expenses Uniform expensesSelf education expenses Other expenses
Mean deduction ($) Mean deduction ($)
Source: Treasury calculations based on ATO (2009). The law for WREs is complex (supported by numerous ATO decisions, determinations and rulings). While the general principles are simple, many tax rulings, court rulings and legislative provisions underpin their application. WREs impose a compliance burden on individuals and practitioners and add to administration costs for the ATO.
Under the current framework, there are significant difficulties in correctly quantifying work-related costs, in apportioning expenses between income-earning purposes and private purposes, and in defining and claiming the deductions. These complex arrangements constitute one of the impediments to further pre-filling of tax returns and, ultimately, removing the need to complete a tax return for a large number of employees.
There is a high degree of variation in WRE claims among individuals with identical occupations and income levels. This variability could be explained by: some taxpayers over-claiming (including expenses that might be private, domestic or capital in nature), given the limited ability of the ATO to audit WREs; some taxpayers interpreting expenses that are incurred in performing their job differently from other taxpayers (raising issues of complexity and transparency in the system); and differences in employer behaviour, where some employers pay for a particular type of expense while other employers do not.
In Canada, a country with a similar tax system and administrative arrangements to Australia, it is estimated that 10 to 15 per cent of WRE claims each year are invalid. If over-claims in Australia are of a similar order, this would equate to an over-claim of between $1.4 and $2.1 billion in 2006–07. While no tax system can achieve perfect compliance, the potential magnitude of non-compliance suggests that administrative solutions alone cannot address this issue (Highfield 2009).
Australia's future tax system - Report to the Treasurer
Page 56
Findings
The scope of work-related expenses for which a tax deduction can be claimed is broad by international standards.
Deductibility for work-related expenses adds a great deal of complexity to the personal income tax system and imposes high compliance costs on taxpayers.
The scope and number of claims significantly limits opportunities for fully automating the preparation of tax returns using pre-filling.
Deductions for the cost of managing tax affairs
The costs of managing their tax affairs are deductible to all taxpayers, whether they are business taxpayers, salary or wage earners, or investors.
This deduction is important in recognising the compliance costs imposed by government on individuals, and can be seen as one of the direct costs of the tax system.
Principle
The costs of managing tax affairs should be deductible in recognition of the compliance burden the tax system imposes on individuals.
Claims for managing tax affairs reflect complexity
Individual taxpayers can deduct expenses incurred in managing their income tax affairs (including complying with legal obligations). These expenses include costs incurred in preparing an income tax return (including travel and other incidental costs), the purchase of tax reference material, and the costs of objecting or appealing against an assessment or determination made by the Commissioner of Taxation.
Of the 11.8 million individuals who lodged a tax return in 2006–07, around three quarters used a tax agent. Approximately two thirds of these, or 5.3 million individuals, claimed a deduction for the cost of managing their tax affairs, totalling over $1.4 billion. The average deduction for these expenses was $206 for employees and $740 for investors.
Finding
The costs of managing tax affairs are widely claimed by individuals, reflecting the complexity of the system.

A1 — Personal income tax
Page 57
Reform directions — costs of earning income and managing tax affairs
Recommendation 11:
A standard deduction should be introduced to cover work-related expenses and the cost of managing tax affairs to simplify personal tax for most taxpayers. Taxpayers should be able to choose either to take a standard deduction or to claim actual expenses where they are above the claims threshold, with full substantiation.
Recommendation 12:
There should be a tighter nexus between the deductibility of the expense and its role in producing income.
A new test that better aligns income and work-related expenses
Under the current system an expense may be deductible as long as it is sufficiently related to earning income. The necessary link is considerably looser than in other countries. The current test adds to compliance costs, makes it hard to move to pre-filled (automated) tax returns, and expands the net of allowable expenses to such an extent that is it is difficult to check that expenses conform with the law.
Requiring a tighter link between an expense and gaining income would improve clarity for taxpayers on what they can deduct and would ensure that WREs and other deductions are well-targeted.
A new test that more strictly defines deductible expenses incurred in producing income should be introduced. This test could be similar to the approach taken in the United Kingdom, where a tax deduction for WREs is only available if the employee is obliged to incur and pay the expense as holder of the employment, and if the expense is incurred wholly, exclusively and necessarily in the performance of the duties of the employment. A tighter nexus should be consistent with the fringe benefit tax arrangements, to eliminate opportunities for arbitrage.
This approach would exclude some expenses that are claimed under Australia’s current arrangements: expenses that are only loosely linked to generating income, to the extent that they are so used.
Standard deduction to simplify tax arrangements
Many taxpayers face legitimate expenses that are directly related to generating their income, including business income for individuals. Recognising legitimate expenses is important to ensure that employment and business activities that involve relatively high expenses are appropriately taxed relative to those that have few expenses.
However, the current arrangements for deductions, particularly for WREs, place a considerable compliance burden on many taxpayers. To simplify individuals’ interaction with the tax system and to facilitate much more pre-filling of tax returns, an automatic standard deduction should be introduced.
Taxpayers would be provided with a standard deduction as part of their pre-filled tax return, unless their claim for WREs (excluding tuition fees that should be separately deductible) and for the cost of managing their tax affairs exceeds a claims threshold and they

Australia's future tax system - Report to the Treasurer
Page 58
choose to claim their actual expenses with full substantiation. The standard deduction should be the default option. Taxpayers could opt out of the standard deduction and claim higher total expenses where these are above the claims threshold (see Chart A1–15).
The standard deduction would consist of:
• a nominal base amount available to those with labour and/or capital (non-business) income who do not elect to claim itemised expenses (WREs, including some self-education expenses, and cost of managing tax affairs) above a minimum claim threshold; and
• a proportion of labour-related income up to a capped amount (the claims threshold).
While the increasing value of the standard deduction would reflect the fact that expense claims rise with income, the value of the tax concession should ultimately be set so as to bring most taxpayers into the standard deduction. The level of the standard deduction would need to be set with regard to changes in the requirements for expense deductions.
Taxpayers with high expenses above the claims threshold would be able to claim expenses above the claims threshold with full substantiation (and subject to the new requirements for expense deductions).
Chart A1–15: Standard deduction increases with labour-related income
Increasing earned income
Claims threshold — WREs and costs of managing tax affairs over this amount can be claimed.
Standard deduction — provided where taxpayers do not claim WREs or cost of managing tax affairs. The
standard deduction increases with earned income up to the claims threshold.
Standard deduction amount Standard deduction amount
An alternative approach would be to allow taxpayers to identify whether they wished to claim the standard deduction, or to claim all eligible expenses that meet the new substantiation requirements.
To bring as many taxpayers into the simplified system as possible, smaller capital-related deductions (excluding interest expenses) and the cost of managing tax affairs deduction should be incorporated into the standard deduction. However, consistent with current administrative arrangements, genuine and reasonable travel allowance expenses (including accommodation, food, and drink associated with working away from their ordinary residence) would not be include in a taxpayer's assessable income (or in the standard deduction). Consideration would need to be given to the interaction of the standard deduction and the proposed capital income discount.

A1 — Personal income tax
Page 59
Depending on the rate of the standard deduction and the claims threshold, a large number of individual taxpayers would no longer need to complete a detailed tax return. This would simplify the tax return lodgement process, and alleviate the compliance burden for many taxpayers.
Refine deductibility for self-education expenses associated with earning or producing income
Education and training is an essential part of human capital development and a significant contributor to economic outcomes for all Australians. It is essential that Australians have opportunities to train and study, both to enhance their skills for their current employment and to pursue new opportunities, particularly when structural change in the economy makes re-training essential for sustainable employment.
There is a role for the deductibility of self-education expenses to encourage further education and training. Tuition fees for education related to current employment should not be included in the standard deduction. Instead, these expenses should be deductible from the first dollar, with full substantiation.
To reduce complexity for taxpayers, other deductible self-education expenses (including travel expenses and educational materials) should be included in the standard deduction.
The Review has considered whether a taxpayer should be able to deduct education and training expenses that are not related to their current employment.
Extending deductibility in this way would be costly and difficult to administer. It would be challenging and inefficient for the administrators of the tax system to differentiate between (non-deductible) leisure activities, and (deductible) training that increases human capital. This risk would be reduced by ensuring that the tuition expense must be incurred in the generation of labour income with a sufficient link to employment. For this reason, financial support for people who want to build skills unrelated to their current employment should be delivered through direct transfers, not tax deductions.
Streamline the costs of managing tax affairs deduction to facilitate automated lodgement
The deduction for the cost of managing tax affairs can be attributed to the costs associated with generating both capital and labour income. As the deduction is claimed by a large number of taxpayers, rolling it into the standard deduction would simplify the taxpayers’ experience of the tax system and facilitate tax return pre-filling. People whose income is solely derived from capital should have access to the base amount of the standard deduction.
The costs of managing tax affairs should continue to be separately deductible where the taxpayer’s total expenses exceed their minimum claim threshold.
Deduction for gifts
Individuals and businesses support the activities of many not-for-profit (NFP) organisations, including through volunteering time and donating goods and services. Donations of money were valued at $8.9 billion in 2004 (FaHCSIA 2005).
The decision to donate money to a NFP organisation may be motivated by a range of factors, including altruism, the possibility of material gain, family or business tradition, social
Australia's future tax system - Report to the Treasurer
Page 60
affiliation, values or beliefs, and humanitarianism. Submissions suggest that donations are also influenced by the tax concessions provided to certain NFP organisations. Donations over $2 are tax deductible if they are made to a deductible gift recipient (DGR).
In 2006–07, 36.3 per cent of individuals claimed a gift or contribution to a DGR as a deduction in their income tax return. Of these individuals, 82.5 per cent donated less than 1 per cent of their total income (ATO 2009).
Assessment
Gifts are a longstanding and important source of funding for the NFP sector, and are supported through gift deductibility.
While it is unclear how gift deductibility influences the amount individuals donate, it provides several benefits. It supports pluralism by giving individuals the opportunity to direct government expenditures to their preferred causes, provides transparency in the provision of government assistance, and is an administratively simple mechanism for both donors and the ATO (although donors incur some compliance costs from the requirement to hold receipts for audit purposes).
Findings
Gifts are an important source of funding for the NFP sector.
Gift deductibility supports pluralism, and is a transparent and administratively simple mechanism.
Reform direction — retain gift deductibility for donations to deductible gift recipients
Recommendation 13:
Gift deductibility should be retained, with the deductibility threshold raised from $2 to $25.
The Review has investigated options to streamline the current arrangements, including replacing gift deductibility with a flat rebate that the donor could choose to assign to the NFP organisation. This approach has been successfully adopted in other jurisdictions, including New Zealand, the United Kingdom and the United States.
While a rebate would provide several benefits (including facilitating a more timely refund, lowering compliance costs through simplifying tax returns and addressing the vertical inequity of gift deductibility), it would also give rise to several integrity issues that require further detailed consideration (for example, ensuring individuals are not able to ‘double dip’ by claiming the rebate for themselves and assigning the rebate to the NFP organisation). Further, the impact of removing gift deductibility on philanthropy is unclear.
Given these concerns, the Review favours retaining gift deductibility, and raising the gift deductibility threshold to $25 per recipient organisation per income year. A higher threshold would reduce the reporting burden for donors who have to retain receipts to be entitled to the tax deduction, and for DGRs that need to issue a large number of receipts for small donations.

A1 — Personal income tax
Page 61
In 2007–08, tax deductions for donations to NFP organisations were valued at $1.8 billion. Of these, $16 million were claimed by people with total donations of $25 or less.
Other deductions
Over time, governments and the community have placed a high value on certain activities and projects — including standing for political elections, making additional superannuation contributions, investing in the Australian film industry, and investing in forestry — and have encouraged investment in them through tax deductions for individual taxpayers.
Deductions for these activities, can be claimed against labour or capital income. For example, election expenses incurred by candidates for any level of government are deductible although they may not be related to current income-earning activities and therefore would not be deductible under the general deduction provisions of the tax law.
Other deductions are available for investing in the Australian film industry and in forestry managed investment schemes. The cost of insurance premiums related to the loss of income, such as income protection, sickness and accident insurance premiums, is deductible under the general deduction provisions, because the premiums relate to the earning of assessable income.
A future review of the relevance and impact of these deductions could be undertaken.

Australia's future tax system - Report to the Treasurer
Page 62
A1–3 Taxation of income from savings
Key points
The income from the savings of Australian residents, other than savings invested in owner-occupied housing and superannuation, should continue to be a significant part of the personal income tax base.
The income tax treatment of these household savings would be improved by applying a 40 per cent discount to most interest income, net residential rental property income, capital gains and certain interest expenses. Doing so would provide a more consistent tax outcome for income from bank deposits and bonds, shares, and rental properties, and provide a means of adjusting for the effect of inflation.
A more consistent treatment of household savings would encourage households to seek the best pre-tax return on their savings and to invest their savings in assets that best suit their circumstances and risk-preferences. It would also largely remove the current bias towards negatively geared investment in rental properties and shares and so reduce a major distortion in the rental property market.
While a discount would provide a more consistent tax outcome for savings, its introduction would also substantially change incentives in some key markets, particularly for rental housing. Given the current problems in the rental housing market, the discount for net residential rental income should only be adopted following reforms to housing supply and housing assistance.
While a move to a broad 40 per cent discount would involve further boundaries in the income tax system, at least in the short- to medium-run, some areas of the current arrangements can be simplified. In particular, capital gains tax should be simplified by excluding some low-revenue generating assets, rationalising existing concessions, removing grandfathering rules, and considering a principles-based rewrite of the rules.
A consistent treatment of savings
Challenges in the taxation of savings
Productivity is reduced if tax-induced distortions lead to a misallocation of resources, with savings directed towards less productive investment opportunities. By favouring one form of savings income over another, the tax system alters the allocation, ownership and the management of the nation’s capital. This can have adverse implications for the efficiency and stability of capital markets and the way risk is distributed between individuals.
Internationally, the tax treatment of gains and losses from saving typically varies depending on the asset type, the financing arrangement and the entity or entities involved. As well as reflecting discrete policy decisions to favour particular types of saving over others, these differences arise because of the inherent difficulties in measuring economic income.
In particular, there are difficulties with measuring changes in asset values over time, which have led to changes in value only being taken into account when an asset is sold and a gain realised, and in accounting for inflation.
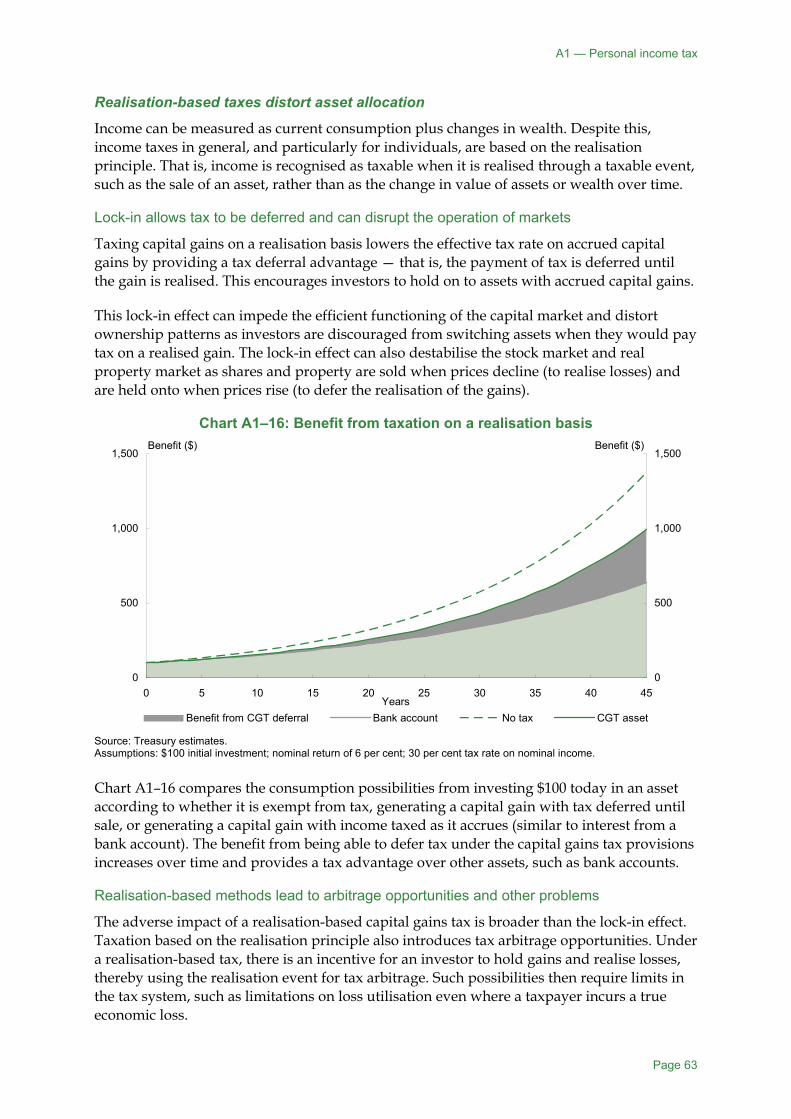
A1 — Personal income tax
Page 63
Realisation-based taxes distort asset allocation
Income can be measured as current consumption plus changes in wealth. Despite this, income taxes in general, and particularly for individuals, are based on the realisation principle. That is, income is recognised as taxable when it is realised through a taxable event, such as the sale of an asset, rather than as the change in value of assets or wealth over time.
Lock-in allows tax to be deferred and can disrupt the operation of markets
Taxing capital gains on a realisation basis lowers the effective tax rate on accrued capital gains by providing a tax deferral advantage — that is, the payment of tax is deferred until the gain is realised. This encourages investors to hold on to assets with accrued capital gains.
This lock-in effect can impede the efficient functioning of the capital market and distort ownership patterns as investors are discouraged from switching assets when they would pay tax on a realised gain. The lock-in effect can also destabilise the stock market and real property market as shares and property are sold when prices decline (to realise losses) and are held onto when prices rise (to defer the realisation of the gains).
Chart A1–16: Benefit from taxation on a realisation basis
0
500
1,000
1,500
0 5 10 15 20 25 30 35 40 450
500
1,000
1,500
Benefit from CGT deferral Bank account No tax CGT assetYears
Benefit ($) Benefit ($)
Source: Treasury estimates. Assumptions: $100 initial investment; nominal return of 6 per cent; 30 per cent tax rate on nominal income. Chart A1–16 compares the consumption possibilities from investing $100 today in an asset according to whether it is exempt from tax, generating a capital gain with tax deferred until sale, or generating a capital gain with income taxed as it accrues (similar to interest from a bank account). The benefit from being able to defer tax under the capital gains tax provisions increases over time and provides a tax advantage over other assets, such as bank accounts.
Realisation-based methods lead to arbitrage opportunities and other problems
The adverse impact of a realisation-based capital gains tax is broader than the lock-in effect. Taxation based on the realisation principle also introduces tax arbitrage opportunities. Under a realisation-based tax, there is an incentive for an investor to hold gains and realise losses, thereby using the realisation event for tax arbitrage. Such possibilities then require limits in the tax system, such as limitations on loss utilisation even where a taxpayer incurs a true economic loss.
Australia's future tax system - Report to the Treasurer
Page 64
The realisation principle for capital gains may also create additional complexity and compliance costs. Under a realisation-based tax, taxpayers are required to keep records for long periods, and are also likely to have less frequent exposure to the relevant tax rules. Separating capital gains from other forms of income also creates uncertainty, and arbitrage opportunities, over how particular forms of income should be classified for tax purposes.
But there are practical impediments to accrual income taxation
While there could be benefits from moving towards taxing on an accruals or accruals-equivalent basis, there would also be a number of practical problems in doing so for individuals across-the-board.
The first is the need to accurately measure changes in asset values. While there are practical difficulties associated with accounting on an accruals basis for business profits and other income, unrealised capital gains (other than for assets where a market price is readily observable) are even more difficult to measure. The act of measurement could also affect market pricing.
These practical difficulties are likely to give rise to their own compliance costs and differential tax treatments of assets, depending on how easily accruing income can be measured for different assets. Different tax treatments, with only some assets taxed on an accruals or accruals-equivalent basis, would also give rise to their own tax arbitrage and minimisation arrangements.
Further, where unrealised gains accrue a taxpayer may not have the cash at hand to pay the tax liability, and borrowing against or selling down assets to meet the tax liability would not be costless. Volatility in asset prices combined with lags in tax liabilities falling due may exacerbate these concerns.
While some of the problems of valuation and liquidity arising from accruals taxation could be addressed by using an accruals-equivalent approach (for example, deeming a rate of return based on the value of an asset), this would have other disadvantages. For example, taxing savings on a deemed return or presumptive tax basis would forgo tax on any above-normal returns or economic rent.
In the longer-run, improvements in technology and changes in the operation of capital markets may mean that some of these practical impediments become less significant.
Principle
Savings should be taxed as consistently as possible to minimise tax arbitrage opportunities and to avoid biasing household and investor decisions about what assets best suit their needs and preferences.
Taxing inflationary gains erodes consumption power
The current tax system is based on nominal income. That is, the income tax base includes compensation for inflation as well as real gains. The inflationary component compensates investors for the reduction in their purchasing power arising from inflation, allowing them to purchase the same quantity of goods and services in future periods. By taxing the inflation component, an individual’s consumption power is eroded.

A1 — Personal income tax
Page 65
Chart A1–17: Real effective tax rate on the return to savings under different inflation rates
0
20
40
60
80
100
120
140
Inflation rate = 0%(or tax on labour income)
Inflation rate = 2.5% Inflation rate = 5% Inflation rate = 10%0
20
40
60
80
100
120
140
Tax on real gain Tax on inflationary gain
Real effective tax rate (%) Real effective tax rate (%)
Assumptions: Real return of 3.5 per cent; 30 per cent tax rate on nominal income. Source: Treasury estimates. For example, if an individual purchases an asset for $100 and sells it a year later for $106 — earning a 6 per cent return — the full return ($6) is subject to tax. If inflation is also 6 per cent, the individual would have had no increase in consumption power — a real return of zero. That is, the same bundle of goods that cost $100 last year would cost $106 this year. By being taxed on the inflationary return the individual is no longer able to consume the same bundle of goods.
Taxing the inflation component increases the effective tax rate on savings above the statutory tax rate, which may reduce incentives to save. For a given real return, the effective tax rate increases as the inflation component increases (see Chart A1–17). The impact from taxing nominal gains may also be exacerbated under a progressive income tax where the average tax rate increases as taxable income increases.
The impact of inflation is less of an issue for capital gain assets where taxation is deferred until realisation. In this case, the real post-tax return increases the longer an asset is held. In contrast, for an interest generating asset the real after tax return does not vary with the holding period. Consequently, the argument for accounting for inflation for capital gain assets is not as strong as that for other assets (Brinner 1976).
While comprehensive adjustments can in theory be made to measure real rather than nominal income, in practice such adjustments can be very complex. A number of jurisdictions that typically face higher rates of inflation than Australia make or have made adjustments on a comprehensive basis for some items of capital income.
As price stability has been a key objective of effective Australian monetary policy settings that target a low rate of consumer price inflation, the biases caused by inflation expectations on the taxation of nominal income in Australia have been reduced.
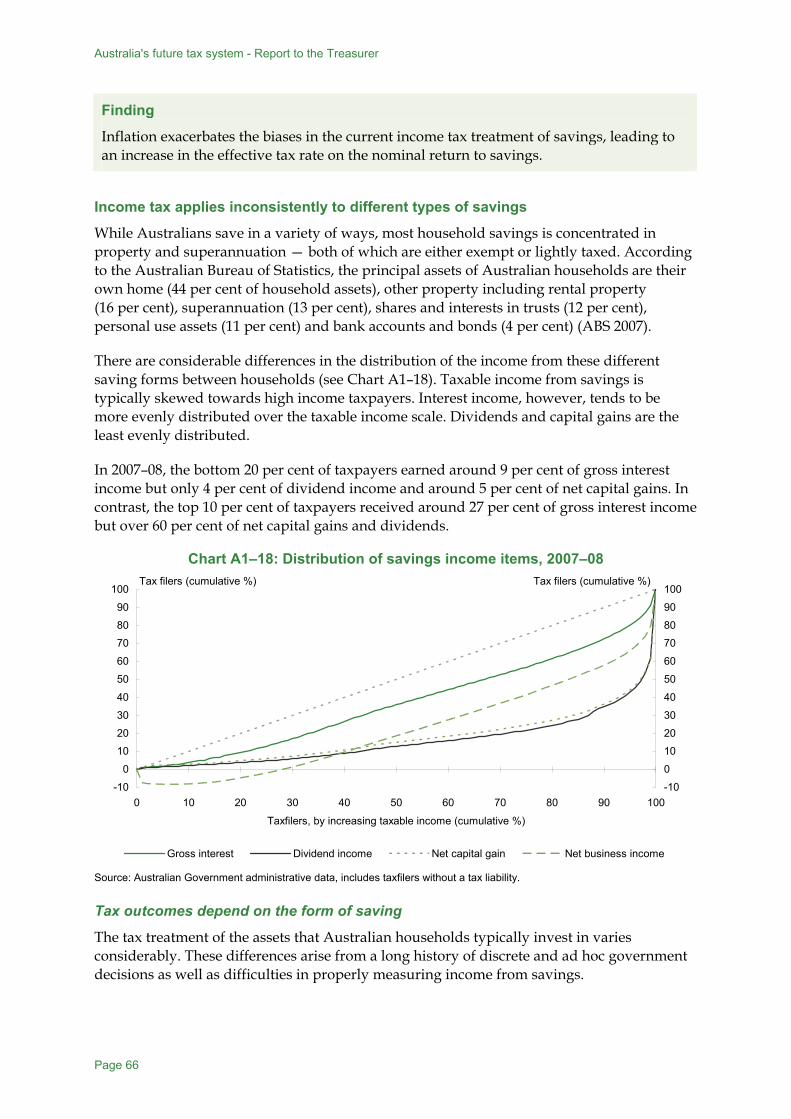
Australia's future tax system - Report to the Treasurer
Page 66
Finding
Inflation exacerbates the biases in the current income tax treatment of savings, leading to an increase in the effective tax rate on the nominal return to savings.
Income tax applies inconsistently to different types of savings
While Australians save in a variety of ways, most household savings is concentrated in property and superannuation — both of which are either exempt or lightly taxed. According to the Australian Bureau of Statistics, the principal assets of Australian households are their own home (44 per cent of household assets), other property including rental property (16 per cent), superannuation (13 per cent), shares and interests in trusts (12 per cent), personal use assets (11 per cent) and bank accounts and bonds (4 per cent) (ABS 2007).
There are considerable differences in the distribution of the income from these different saving forms between households (see Chart A1–18). Taxable income from savings is typically skewed towards high income taxpayers. Interest income, however, tends to be more evenly distributed over the taxable income scale. Dividends and capital gains are the least evenly distributed.
In 2007–08, the bottom 20 per cent of taxpayers earned around 9 per cent of gross interest income but only 4 per cent of dividend income and around 5 per cent of net capital gains. In contrast, the top 10 per cent of taxpayers received around 27 per cent of gross interest income but over 60 per cent of net capital gains and dividends.
Chart A1–18: Distribution of savings income items, 2007–08
-10
0
10
20
30
40
50
60
70
80
90
100
0 10 20 30 40 50 60 70 80 90 100
Taxfilers, by increasing taxable income (cumulative %)
-10
0
10
20
30
40
50
60
70
80
90
100
Gross interest Dividend income Net capital gain Net business income
Tax filers (cumulative %) Tax filers (cumulative %)
Source: Australian Government administrative data, includes taxfilers without a tax liability. Tax outcomes depend on the form of saving
The tax treatment of the assets that Australian households typically invest in varies considerably. These differences arise from a long history of discrete and ad hoc government decisions as well as difficulties in properly measuring income from savings.
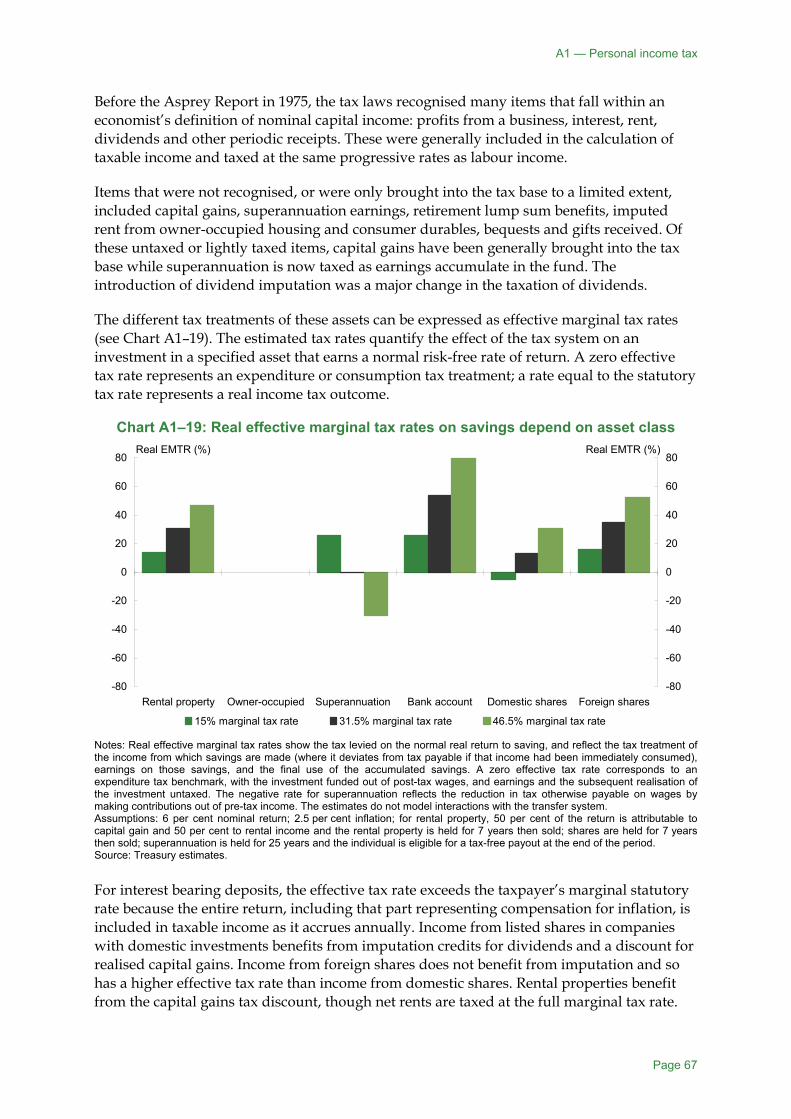
A1 — Personal income tax
Page 67
Before the Asprey Report in 1975, the tax laws recognised many items that fall within an economist’s definition of nominal capital income: profits from a business, interest, rent, dividends and other periodic receipts. These were generally included in the calculation of taxable income and taxed at the same progressive rates as labour income.
Items that were not recognised, or were only brought into the tax base to a limited extent, included capital gains, superannuation earnings, retirement lump sum benefits, imputed rent from owner-occupied housing and consumer durables, bequests and gifts received. Of these untaxed or lightly taxed items, capital gains have been generally brought into the tax base while superannuation is now taxed as earnings accumulate in the fund. The introduction of dividend imputation was a major change in the taxation of dividends.
The different tax treatments of these assets can be expressed as effective marginal tax rates (see Chart A1–19). The estimated tax rates quantify the effect of the tax system on an investment in a specified asset that earns a normal risk-free rate of return. A zero effective tax rate represents an expenditure or consumption tax treatment; a rate equal to the statutory tax rate represents a real income tax outcome.
Chart A1–19: Real effective marginal tax rates on savings depend on asset class
-80
-60
-40
-20
0
20
40
60
80
Rental property Owner-occupied Superannuation Bank account Domestic shares Foreign shares-80
-60
-40
-20
0
20
40
60
80
15% marginal tax rate 31.5% marginal tax rate 46.5% marginal tax rate
Real EMTR (%) Real EMTR (%)
Notes: Real effective marginal tax rates show the tax levied on the normal real return to saving, and reflect the tax treatment of the income from which savings are made (where it deviates from tax payable if that income had been immediately consumed), earnings on those savings, and the final use of the accumulated savings. A zero effective tax rate corresponds to an expenditure tax benchmark, with the investment funded out of post-tax wages, and earnings and the subsequent realisation of the investment untaxed. The negative rate for superannuation reflects the reduction in tax otherwise payable on wages by making contributions out of pre-tax income. The estimates do not model interactions with the transfer system. Assumptions: 6 per cent nominal return; 2.5 per cent inflation; for rental property, 50 per cent of the return is attributable to capital gain and 50 per cent to rental income and the rental property is held for 7 years then sold; shares are held for 7 years then sold; superannuation is held for 25 years and the individual is eligible for a tax-free payout at the end of the period. Source: Treasury estimates. For interest bearing deposits, the effective tax rate exceeds the taxpayer’s marginal statutory rate because the entire return, including that part representing compensation for inflation, is included in taxable income as it accrues annually. Income from listed shares in companies with domestic investments benefits from imputation credits for dividends and a discount for realised capital gains. Income from foreign shares does not benefit from imputation and so has a higher effective tax rate than income from domestic shares. Rental properties benefit from the capital gains tax discount, though net rents are taxed at the full marginal tax rate.
Australia's future tax system - Report to the Treasurer
Page 68
Savings placed in lifetime savings such as superannuation and owner-occupied housing are more preferentially taxed. Owner-occupied housing is outside of the income tax base and faces a zero effective tax rate. Superannuation is advantaged because contributions into a superannuation fund are generally made out of pre-tax income (unlike for a bank account, where deposits are made out of post-tax income), though they are subject to a 15 per cent contributions tax. Earnings in the fund are also taxed at a 15 per cent statutory rate and are eligible for a one-third capital gains tax discount and for refundable imputation credits.
For superannuation, the access to the effective partial deduction for saving (or co-contributions from the Australian government, or both), the very low rate of tax on earnings and the exemption from income tax of retirement benefits, means that for many individuals saving in a superannuation fund is treated more generously than it would be under an expenditure tax.
There is considerable evidence that tax differences have large effects on which assets a household’s savings are invested in. Based on an examination of the literature and OECD data, the OECD concluded that while low-income individuals respond to tax incentives with more saving, for high-income individuals in particular savings are diverted from taxable to tax-preferred savings (OECD 2007a).
Finding
The tax outcomes for different types of savings vary considerably and have evolved in an ad hoc manner. How households allocate their savings between different assets or savings vehicles is likely to be significantly affected.
Different tax treatment of financing gives rise to arbitrage opportunities
Investments in assets by individuals face different effective tax rates depending on the financing choices of the saver. When equity financed, rental properties yield a positive effective tax rate. When negatively geared, asymmetries in the treatment of expenses and receipts give rise to a more favourable treatment (see Chart A1–20). This asymmetry ranks amongst the greatest tax induced biases to the savings choices of households.

A1 — Personal income tax
Page 69
Chart A1–20: Real effective marginal tax rates on rental properties, by gearing ratio (current approach)
-20
-10
0
10
20
30
40
50
70% geared 40% geared No gearing-20
-10
0
10
20
30
40
50Real EMTR (%) Real EMTR (%)
Assumptions: 6 per cent nominal return; 2.5 per cent inflation; for rental property, 50 per cent of the return is attributable to capital gain and 50 per cent to rental income and the rental property is held for seven years then sold; tax on debt provider disregarded. Source: Treasury estimates. For example, assume that the full amount required to purchase an investment property for $400,000 is borrowed. The return, part of which is a capital gain, is just enough to cover costs (including interest repayments). In the absence of tax the investment will break even. The same outcome would occur under an accrual-based tax without discounts, as all income and all expenditure would be pooled together and taxed at the same rate.
Under the current system, however, the same investment receives a tax advantage that allows it to do better than break even after tax. All expenses (less rents received) can be pooled and offset against other income — in full and at the individual’s marginal tax rate. But any capital gain would not be taxed until realised, and if the asset is held for at least 12 months, only half the gain would be subject to tax. The same results apply for other types of geared investment that yield capital gains; in particular shares, where margin lending arrangements are used to negatively gear share investments.
The realisation principle also leads to an adverse selection bias. That is, there is an incentive to realise capital losses immediately, while deferring the realisation of accrued capital gains, which would be taxed at a discount. For this reason, the tax law quarantines capital losses, which can only be offset against other capital gains, not against other income.
Negative gearing of rental properties has become more prevalent
Households held around $700 billion of residential investment property assets in 2005–06 (ABS 2007). This represented around 14 per cent of total household assets, a proportion that has increased over the last decade.
Currently, around 70 per cent of individual investors in rental properties are in a net loss position. This figure has increased from 58 per cent in 2000–01 (see Chart A1–21). The increase largely reflects increases in interest deductions, reflecting rising levels of gearing rather than higher interest costs. Rental deduction claims have also increased relative to gross rent.

Australia's future tax system - Report to the Treasurer
Page 70
Chart A1–21: Selected taxation statistics —rental income and deductions
40
60
80
100
2000–01 2001–02 2002–03 2003–04 2004–05 2005–06 2006–0740
60
80
100
Proportion of individuals reporting net rent with net rental losses
Ratio of gross rent to total rental deductions
Ratio of rental interest deductions to total rental deductions
Proportion (%) Proportion (%)
Source: ATO, Taxation statistics (various years). The biases arising from the current income tax treatment of rental properties may amplify volatility in the housing market. (See Section E4.)
Finding
Current income tax arrangements for savings lead to significant arbitrage opportunities. The different treatment of capital gains as against other savings income and related expenses is an important driver of these opportunities. This creates significant distortions in how rental properties, in particular, are financed and for the rental property market.
Reform directions
Recommendation 14:
Provide a 40 per cent savings income discount to individuals for non-business related:
(a) net interest income;
(b) net residential rental income (including related interest expenses);
(c) capital gains (and losses); and
(d) interest expenses related to listed shares held by individuals as non-business investments.
In conjunction with introducing the discount further consideration should be given to how the boundaries between discounted and non-discounted amounts are best drawn to achieve certainty, reduce compliance costs, and prevent labour and other income being converted into discounted income. Further consideration should also be given to addressing existing tax law boundaries related to the treatment of individuals owning shares in order to address uncertainties about when the shares are held on capital account (and subject to capital gains tax) and on revenue account (and taxed as ordinary income).

A1 — Personal income tax
Page 71
Recommendation 15:
When the 40 per cent savings income discount is introduced a smooth transition should be provided to minimise any disruption that may arise. The transition to a savings income discount for net residential rental income should only be adopted following reforms to the supply of housing (Section E4 Housing affordability) and reforms to housing assistance (Section F5 Housing assistance).
Recommendation 16:
As part of the consideration of alternative company income tax arrangements and dividend imputation (see Recommendations 26 and 37), consideration should be given to extending the discount to other savings income.
Towards better taxation of savings
The reform direction for savings income taxation aims to provide a more consistent treatment of savings income, to reduce opportunities for tax arbitrage and to reduce incentives for investors to take on too much debt, while broadly compensating for the effects of inflation, particularly for interest income.
To give effect to this reform direction the Review has considered two primary methods of reducing the taxation of income from savings: discounting savings income (like the current arrangements for capital gains) or taxing savings income at a relatively low flat rate (like the current arrangements for superannuation). Both can be seen as representing a form of dual income tax, as indeed can current arrangements though in a more ad hoc way.
While both alternatives have the potential to represent a good fit for Australia’s future tax system, a discount approach is the Review’s overall preference as it assists in upholding the current progressivity of the income tax system. Deciding between the two reform paths depends on the trade-off between equity concerns of moving away from progressive marginal tax rates and the potential integrity and simplicity benefits of adopting a flat rate. Both options provide a pragmatic approach to dealing with inflation.
The proportional inclusion achieved under a discount would continue to tax other income from savings at progressive marginal tax rates, which may be desirable from an equity perspective. Proportional taxation of a notional real return to saving may also be efficient. To the extent that savings by high income earners are relatively unresponsive to post-tax returns it may be efficient to tax the returns from savings by higher income earners at higher rates and use the revenue to reduce taxes elsewhere.
However, while a proportional inclusion approach may assist in making the tax system more progressive, the degree to which it would do so is less clear. Progressive rates create opportunities for tax arbitrage, as individuals seek to exploit differences in marginal tax rates, or retain income in companies. For example, under the current tax system individuals can reduce the tax paid on the returns to saving by streaming the income to a family member facing a lower tax rate using a discretionary trust.
A flat tax rate on other forms of savings would also reduce incentives and opportunities for tax arbitrage; for example, from realising income in periods where a person’s marginal tax rate is low. Furthermore, a flat tax rate would reduce incentives for investors in high income

Australia's future tax system - Report to the Treasurer
Page 72
tax brackets to allocate their savings towards tax favoured assets or to try to evade tax by investing offshore and not reporting income received.
A flat tax rate would also reduce the lock-in effects of a realisation-based capital gains tax relative to progressive taxation. Under progressive taxation taxpayers can be pushed into a higher tax bracket when gains accumulated over a long time are realised. In addition, unlike a proportional inclusion, gains and losses would be taxed at the same low flat rate, reducing disincentives towards risk taking and entrepreneurship. Even so, a proportional inclusion approach would still reduce these drawbacks of progressive taxation, because the differences in marginal tax rates between tax brackets would be smaller.
While a flat tax on the income from savings has many desirable features, the transition to a flat tax rate would raise a number of challenges. A flat tax rate, even at a low rate, is likely to result in an increase in the tax rate faced by some low-income earners. In the long-run, however, flat rate taxation of savings income may be more easily integrated with other potentially desirable directions for the future taxation of capital income, including deeming and accrual taxation of capital gains, and integration of personal income tax with a business level expenditure tax (see Sections B1 and B2) (Sørensen & Johnson 2010).
A savings income discount would tax savings more consistently
Individuals should be provided with a 40 per cent discount for the returns and expenses from certain forms of taxable savings. This would include interest income from certain interest-bearing assets, including deposit accounts, net rental income from residential properties, including discounting interest expenses, and (as now, but with a reduced discount) capital gains. The discount would also apply to such income earned through trusts and partnerships. The discount would not generally apply to dividends and business income.
It is not recommended that the discount be applied to dividend and certain other business and savings income (such as related party interest and commercial property rentals) while dividend imputation is retained and given the potential for returns to labour to be converted into discounted income. These issues are discussed further below.
A 40 per cent discount represents a more realistic inflation adjustment than the 50 per cent discount currently provided for certain capital gains given the recent history of real risk-free returns and the Reserve Bank of Australia’s objective of medium term price stability — with the goal of keeping consumer price inflation between 2 and 3 per cent, on average, over the cycle. Moving to a 40 per cent discount on capital gains would also reduce the arbitrage opportunities currently available while limiting the transitional costs involved with the abolition of the existing capital gains discount.
Certain investment products (such as income bonds, funeral policies, fixed-term annuities and scholarship plans) are currently taxed like bank accounts in some, but not all, ways. Consideration should therefore be given to how these investments are to be treated in light of the general savings income discount.
The savings income discount would reduce the large differences in effective tax rates across different savings vehicles (Chart A1–22). For an individual on the top marginal tax rate, the real effective tax rate on interest income would fall from around 80 per cent to 50 per cent. The treatment of owner-occupied housing and superannuation would remain significantly

A1 — Personal income tax
Page 73
different, reflecting their lifetime savings characteristics, but the degree of difference would be reduced.
Chart A1–22: Real effective marginal tax rates for selected asset classes Panel A: Current approach Panel B: Recommended approach
-80
-60
-40
-20
0
20
40
60
80
Ren
tal
prop
erty
Ow
ner-
occu
pied
Sup
er-
annu
atio
n
Ban
kac
coun
t
Dom
estic
shar
es
Fore
ign
shar
es
-80
-60
-40
-20
0
20
40
60
80
15% marginal tax rate 31.5% marginal tax rate46.5% marginal tax rate
Real EMTR (%) Real EMTR (%)
-80
-60
-40
-20
0
20
40
60
80
Ren
tal
prop
erty
Ow
ner-
occu
pied
Sup
er-
annu
atio
n
Ban
kac
coun
t
Dom
estic
shar
es
Fore
ign
shar
es
-80
-60
-40
-20
0
20
40
60
80
15% marginal tax rate 31.5% marginal tax rate46.5% marginal tax rate
Real EMTR (%) Real EMTR (%)
Notes: The real effective marginal tax rate on saving is defined as the difference between pre-tax and post-tax return from a marginal investment as a proportion of the pre-tax return (net inflation). A zero effective tax rate reflects a prepaid expenditure tax benchmark, where saving is undertaken out of post-tax labour income and the return to saving is exempt from income tax. Negative rates for superannuation reflect the reduction in tax from either making contributions out of pre-tax income (current approach) or by assessing the recommended refundable tax offset for contributions. Assumptions: 6 per cent nominal return; 2.5 per cent inflation; for rental property, 50 per cent of the return is attributable to capital gain and 50 per cent to rental income and the rental property is held for 7 years then sold; shares are held for 7 years then sold; superannuation is held for 25 years and the individual is eligible for a tax-free payout at the end of the period. Does not account for interactions with the transfer system. Source: Treasury estimates. As previously discussed, the current system for taxing assets that yield capital gains, in particular shares and rental properties, allows for interest to be deductible at the full marginal tax rate, while only half the capital gain is subject to tax. This encourages households to take on too much debt and risk when undertaking these investments.
This bias can encourage surges of debt-funded investor activity in anticipation of concessionally taxed capital gains, potentially adding to the volatility of capital markets. The savings income discount would reduce, but not completely eliminate this bias (see Chart A1-23). Under the savings income discount, income from shares would take discounted (capital gains) and undiscounted forms (dividends). Interest expenses in relation to investments in listed companies should be discounted given the difficulties in assigning debt to particular investments and the significant tax benefits that would otherwise still remain for margin lending.

Australia's future tax system - Report to the Treasurer
Page 74
Chart A1–23: Real effective marginal tax rates on rental property, by gearing ratio Panel A: Current approach Panel B: Recommended approach
-20
-10
0
10
20
30
40
50
70% geared 40% geared No gearing-20
-10
0
10
20
30
40
50Real EMTR (%) Real EMTR (%)
-20
-10
0
10
20
30
40
50
70% geared 40% geared No gearing-20
-10
0
10
20
30
40
50Real EMTR (%) Real EMTR (%)
Assumptions: Individual on 46.5 per cent marginal tax rate; 6 per cent nominal return; 2.5 per cent inflation; for rental property, 50 per cent of the return is attributable to capital gain and 50 per cent to rental income and the rental property is held for seven years then sold; tax on debt provider disregarded. Source: Treasury estimates. Under the savings income discount, there would also be a generally better outcome for rental property investors that finance out of equity (see Chart A1–23). The more neutral treatment would reduce the crowding out (by those undertaking negative gearing) of other potential investors in rental housing, and improve the long-term stability of the housing market. In the medium to long-run, there would be a shift in how rental property investments are financed. Applying the savings income discount to rental properties would also have the benefit of improving the overall operation and stability of the housing market.
The current system favours returns from capital gains compared to rental returns. Moving to a lower rate of tax on net rental income may also encourage more capital-intensive use of residential land, with increasing investment in higher density, higher rental income yielding developments and less reliance on capital gains from land.
However, there are currently constraints to the supply of housing that need to be taken into account. Amendments to the taxation of rental housing should only be adopted following reforms to the supply of housing, such as the approvals processes around the planning system and land supply (see Section E4). In addition, the tax benefit available to negatively geared properties may place downward pressure on rents though it is poorly targeted to this purpose. As such, steps to reduce the existing tax distortion should only be undertaken following reforms to housing assistance (see Section F5).
Boundary issues need to be considered
Despite achieving more consistent tax outcomes for savings, further consideration would need to be given to a number of boundary issues before implementation. Some existing distinctions in the tax system would become more important.
To prevent the labour income of owner-managers from benefiting from the discount, consideration would need to be given to how best to define eligible interest income. Interest income from deposits with deposit-taking institutions, government and widely marketed
A1 — Personal income tax
Page 75
bonds should be eligible for the discount. But interest income from transactions involving related parties or associates would need to be excluded or otherwise limited, otherwise returns to labour could be converted into interest payments.
In addition, the interaction of the boundary between eligible and ineligible interest and the boundary between business and non-business income would need some consideration, particularly where the eligibility of interest income or deductions for the discount may depend on the behaviour of the taxpayer. For example, consideration would need to be given to the treatment of interest expenses associated with borrowing to purchase units in a unit trust or company that may carry on a business or may invest in rental properties, debt or listed shares.
The distinction between residential and non-residential properties would become more important. The status of properties on the borderline between residential and commercial property, such as serviced apartments, would need to be clarified. However, although not straightforward, this is an existing challenge in relation to income tax and the GST.
In addition, it would be appropriate to give further consideration to addressing the existing boundaries relating to the tax treatment of income from shares. In particular, whether gains and losses are treated on the capital or revenue account is affected by whether the taxpayer is engaged in passive investment or active trading. Such a distinction can be difficult to apply in practice, because the differences between these are often a matter of degree. Under the savings income discount, there would be a greater incentive for taxpayers to classify their share ownership as a passive investment when they make gains and to classify their ownership as active trading when they make losses so that they can offset (undiscounted) losses against other revenue income.
Transitional issues
The recommended discount would reduce the rate of tax on the returns to existing assets that yield eligible interest and rental income. On the other hand, the reduction in the discount on capital gains would negatively affect individuals with significant unrealised capital gains. For geared investors in rental properties and shares, the application of the discount to net rental income and interest expenses would also have implications for their preferred level of gearing.
Transitional relief should be provided to minimise the disruption that may arise when the savings discount is introduced (see Recommendation 15). Options include a phasing in of the new rate of discount (the best approach) or introducing grandfathering provisions for existing assets. Grandfathering provisions, such as those in capital gains tax, tend to be long lived and are among the most complex provisions in the tax law, and should be avoided where possible.
For example, the discount for savings income and related expenses could be gradually increased from 0 per cent to 40 per cent over five years. A five-year transitional period could also apply for capital gains, with the current 50 per cent discount declining each year by 2 percentage points.
For ungeared capital gains assets, such a phase-in would reduce the likelihood of market disruption caused by the incentive to bring forward the realisation of capital gains between the time of announcement and the enactment of legislation. A phased reduction in the capital

Australia's future tax system - Report to the Treasurer
Page 76
gains tax discount over five years would offset the natural decline in the effective tax rate arising from the deferral benefits of a realisation-based capital gains tax (see Chart A1–24).
Chart A1–24: Real effective marginal tax rates on capital gains from a five year transition
0
5
10
15
20
25
30
35
40
45
5 10 15 20 25 300
5
10
15
20
25
30
35
40
45
Proposed approach with 5 year transition Current approach
Year capital gain asset is sold
Transition period
Real EMTR (%) Real EMTR (%)
//
Assumptions: Recommended approach introduced one year after capital gain asset is acquired; individual on 46.5 per cent marginal tax rate; 6 per cent nominal return; 2.5 per cent inflation. Source: Treasury estimates. For highly geared investors in rental properties, such transitional arrangements would achieve a smooth transition to an outcome that still provides some tax benefits relative to other investments, though significantly less than before. A smooth transition would limit any short-term disruptions in the supply of rental properties if some investors were to respond to the changed tax arrangements by selling out rather than adjusting their level of gearing.
As well as providing long-term benefits, reforms to address supply side constraints in residential housing markets would also assist with managing any transition and so would become more necessary. Reforms to State land taxes and stamp duties would be of some value in this regard, while there are also potential gains from improving the supply of housing and its responsiveness through other policy reforms, such as to planning and land release (see Section E4).
Treatment of dividends and other business and savings income
The Review has considered whether the savings discount should be extended to dividends, business income, other interest income and rental income from non-residential properties and other assets. Such an extension is not recommended for now, but could be reconsidered in the context of a long-term move away from dividend imputation. However, such consideration would need to account for the deferral benefits afforded by the difference between the company income tax rate and the personal income tax rates.
For larger, more internationally orientated companies, not providing the discount for dividends could partially offset the portfolio bias for domestic savers to hold domestic shares rather than debt and foreign shares. This bias arises to the extent that an imputation credit to resident shareholders is a refund for company income tax that they have not entirely borne given that Australia is an open economy (see Section B2).
A1 — Personal income tax
Page 77
Further, if the savings income discount was made available for dividends, there would be an incentive for owner managers to convert their labour income into profits. They could then effectively pay themselves a wage through a dividend of which only 60 per cent would be subject to tax, thereby undermining the tax base for income from work.
The labour to capital conversion problem also arises with non-commercial or non-arm’s length loans and with rental income from non-arm’s length commercial property. For example, if a discount applied to interest income there would be an incentive to convert business profits that represent the non-wage labour income of owner-managers into interest income from a loan provided by the owner at an artificially high rate of interest.
Nevertheless, excluding dividends and certain other types of income has some downsides. In particular, it would lead to a difference in the tax treatment between debt and equity for domestic savers. This would reduce the cost of debt finance, creating an incentive for domestic companies to finance new investment with debt to the extent that the financing choices of domestic companies reflect the availability of domestic capital. Excluding these items also gives rise to some of the boundary issues identified above.
For the longer term, however, a continuing trend of increased openness in the Australian economy suggests consideration may need to be given to moving away from dividend imputation as a means of integrating personal and company income tax (see Section B2 The treatment of business entities and their owners, Recommendation 37).
Longer-term options for dividends and business income
Under most alternatives to dividend imputation, a typical feature of the taxation of dividends is to provide double taxation relief, either through a discount or a low flat rate. As part of a move to such an alternative, a discount could directly apply to dividends from listed shares where the conversion of labour income into profits is less of an issue.
For unlisted businesses, however, providing relief to all business income would, as discussed above, be problematic. Such income often includes a mix of returns to the labour of the owner-managers as well as the capital employed in the business. On the other hand, if income from unlisted businesses is taxed in full, the savings income component could be over-taxed compared to income from listed companies, discouraging small business and entrepreneurial activity.
To address the difference between saving through widely-held listed shares and through a closely-held business, the savings income discount could be extended to business income through a business allowance. Internationally, business allowance systems are already used where there are dual income taxes, such as in the Scandinavian countries, to separate capital income from other income.
Business allowance systems split the net business income of sole traders, partnerships and trusts into labour and savings or capital components, with the discount applying to the capital component. A similar approach could apply to dividends received from unlisted companies, non-commercial loans and non-arm’s length commercial property arrangements. Under the allowance system, owners of unlisted businesses (shareholders in unlisted companies, trust beneficiaries, partners or a sole proprietor) would receive an allowance for a deemed return on their equity (savings) in the business.

Australia's future tax system - Report to the Treasurer
Page 78
Extending the discount, or applying a flat tax rate, to all savings income would mean that many of the boundary issues previously discussed, and the differential treatment of debt and equity, would be of less concern. An allowance arrangement would however give rise to some complexity of its own, though allowance-like arrangements may be an appropriate way of dealing with non-arm’s length interest payments.
As part of the longer-term consideration of alternative company tax arrangements and dividend imputation, consideration should therefore be given to extending the discount (or possibly a flat rate of tax on savings income) to all savings income.
Treatment of earnings from life insurance policies
Currently, life insurance providers are taxed at the company income tax rate on investment earnings from assets that support ordinary life insurance policies. Reversionary bonuses (or accumulated earnings) paid to policyholders when an insured event occurs, or when the policy is cancelled or matures after it has been held for more than 10 years, are tax free. Therefore, the policyholder is effectively taxed at the company tax rate on the earnings.
Where the policy is cancelled or matures after it has been held for eight years or less, the accumulated earnings paid to policyholders are taxed at marginal tax rates. A proportion of the accumulated earnings is taxed if the policy is cancelled or matures after it has been held for nine or 10 years. To the extent that the accumulated earnings are taxed, policyholders are entitled to a tax offset to prevent double taxation. Currently, the tax offset is 30 per cent of the taxable component of the earnings, a proxy for the company tax rate.
Accumulated earnings paid to policyholders should not benefit from the savings income discount. Life insurance policyholders would benefit from the recommended reduction in the company income tax rate to 25 per cent (see Recommendation 27), increasing the potential tax deferral advantages of life insurance. In addition, life insurance providers invest in assets that produce income, particularly dividends, that would not attract the discount.
Simplifying the taxation of capital gains The regime for taxing business and savings income includes complex provisions that reflect the complexity of commercial activity, the increasing sophistication of financial instruments, and the wide variety of saving structures and intermediaries. There will be a continuing need to re-assess such provisions with a view to improving certainty, reducing administration and compliance costs, and dealing with design or integrity failings.
Particular emphasis should be placed on simplifying the rules directly affecting large numbers of individuals who are not equipped to deal with tax complexity. The capital gains tax regime is the primary example of such complexity, and should be simplified to reduce administration and compliance costs for individuals and small business in particular.
Capital gains tax is complex
A number of submissions to the Review have highlighted the complexity of the current capital gains tax regime. Principal drivers of the high administration and compliance costs include the complexity of the legislation, the frequency of changes to the legislation, the number of rules and exceptions, and record keeping requirements.

A1 — Personal income tax
Page 79
For individuals, shares and real estate give rise to the majority of taxable capital gains (see Table A1–7). Collectables and personal use assets generate little capital gains tax revenue.
Table A1–7: Total current year capital gains of taxable individuals by source (2006–07)(a)(b)
Source of gain(c) Number of individuals reporting gains
Value of capital gain ($million)
Shares 436,395 20,415
Real estate 152,056 15,061
Other assets(d) 214,918 11,196
Collectables 1,120 67
Total number of individuals reporting gains 668,415(e) 46,739 (a) Refers to individual taxpayers with net tax payable greater than $0 who completed a schedule. (b) Includes data processed up to 31 October 2008. (c) Sources include both active and non-active assets. (d) Includes other capital gains tax assets and any other capital gains tax events. (e) This is not the sum of figures in this column as individuals may report capital gains from more than one source, so that the
total of individuals reporting gains from different sources will exceed the total number of individuals reporting gains. Note: The figures in this table are derived from the capital gains tax schedule, which individuals who lodge a paper return are not required to complete. Therefore these figures cannot be directly compared to the statistics reported on net capital gains in Taxation statistics. Source: ATO (2009). The complexity of capital gains tax is compounded by the various exemptions and the grandfathering of previous provisions. For example, there are various concessions for small business, in addition to the general 50 per cent discount for individuals, while capital gains made on assets acquired before the introduction of the capital gains tax regime are generally exempt and the pre–1999 indexation arrangements remain available for assets acquired before indexation was abolished. A number of submissions also noted that the mechanical and prescriptive nature of the capital gains tax legislation adds significantly to administration and compliance costs.
Small business capital gains tax concessions
There are currently four separate small business capital gains tax concessions available to qualifying businesses or their owners: an exemption for capital gains made on active assets held for at least 15 years (generally available only to an individual aged 55 or over who retires); a retirement exemption for capital gains made on active assets up to a lifetime limit of $500,000 per individual; a further 50 per cent discount for the sale of active business assets; and a small business roll-over, which allows deferral of a capital gain made on an active asset if within two years the proceeds are reinvested in another business asset.
There are currently two initial criteria a taxpayer must satisfy to be eligible for the small business CGT concessions: they must either be conducting a business with an aggregated turnover of less than $2 million (the small business entity test) or they must have net assets of $6 million or less (the maximum net asset value test).
The concessions are a significant area of complexity within the capital gains tax rules. In a survey of tax practitioners on the drivers of capital gains tax compliance costs, Evans (2004) found that the small business concessions ranked prominently (6 out of 18) in the list of factors. Despite attempts to simplify the concessions, taxpayers are required to navigate a legislative maze of gateway and threshold conditions and then additional conditions that relate to each of the specific concessions.

Australia's future tax system - Report to the Treasurer
Page 80
Evans also found that the concessions have become more complex over time. They have frequently been amended to extend their reach and to ensure that the concessions do not provide opportunities for tax avoidance. The outcome is provisions so complex that specialist professional advice is typically required to access them. Despite this complexity, but perhaps reflecting their value, the concessions are widely used (see Table A1–8).
Table A1–8: Number of claimants of the small business capital gains tax concessions, 2006–07
Concession Companies Individuals 15 year exemption 207 764 Retirement exemption 1,264 10,057 Active asset reduction 2,746 24,220 Rollover 519 4,676
Source: ATO (2009).
Finding
The current capital gains tax rules are particularly complex, with that complexity compounded by various exemptions and the grandfathering of previous provisions.
Simplifying capital gains tax
Recommendation 17:
The capital gains tax regime should be simplified by:
(a) increasing the exemption threshold for collectables and exempting all personal use assets;
(b) rationalising and streamlining the current small business capital gains tax concessions by:
– removing the active asset 50 per cent reduction and 15–year exemption concessions;
– increasing the lifetime limit of the retirement exemption by permanently aligning it with the capital gains tax cap for contributions to a superannuation fund; and
– allowing taxpayers who sell a share in a company or an interest in a trust to access the concessions via the turnover test.
(c) removing current grandfathering provisions relating to assets acquired before the commencement of capital gains tax, with a market value cost base provided for those assets when the exemption is removed, or before the end of previous indexation arrangements. A relatively long lead-time should be provided before these removals take effect; and
(d) rewriting the capital gains tax legislation using a principles-based approach that better integrates it with the rest of the income tax system.
The capital gains tax system should be simplified by rationalising existing concessions, exempting certain assets, simplifying the legislative provisions, and removing some
A1 — Personal income tax
Page 81
grandfathering arrangements. While the Review has considered the potential benefits of an annual exemption, it is not clear that there would be net benefits from such an approach.
For any simplification of capital gains tax to substantially reduce overall complexity and compliance costs, trade-offs that favour simplicity over equity and efficiency would be required, as well as an acceptance that there would be losers as well as winners in respect of future tax liabilities. As a possible exception, in the medium to long term the greater use of real time reporting of taxpayer information from share registries could also significantly reduce the need for shareholders to retain records and calculate their own capital gains.
Rationalising and streamlining small business concessions
The small business capital gains tax concessions are a significant contributor to complexity and compliance costs. As discussed above in relation to income from work, taken together with the general 50 per cent capital gains tax discount the concessions also result in a highly favourable tax outcome for those small businesses benefiting from them. This outcome may skew the allocation of resources in the economy to less productive uses and detract from equity goals.
Rationalising the provisions — by removing the active asset 50 per cent reduction and the 15 year exemption — and streamlining the remaining concessions would reduce compliance costs as well as improve efficiency and equity around the treatment of earned income (see Recommendation 17b). The small business roll-over provision would be retained, as it has an efficiency benefit of reducing lock-in effects that prevent assets and businesses being reallocated and organised most productively.
Two of the existing concessions — the 15 year exemption and the retirement exemption — raise issues related to the self-employed and superannuation arrangements, and the principle that lifetime savings should face little or no income tax. Many self-employed people effectively use the accumulation of value in their business as a lifetime savings vehicle for their retirement. But the system should be simplified by providing the retirement exemption only.
Access to the retirement exemption should be increased and better aligned to concessions available within the superannuation system. The current lifetime contribution limit should be increased and permanently aligned to the cap for contributions to a superannuation fund derived from the disposal of small business assets. This would increase the current lifetime limit from $500,000 to $1.1 million (in 2009–10), and ensure the limit is indexed annually.
The small business capital gains tax concessions could also be rationalised and simplified by allowing taxpayers who sell a share in a company or an interest in a trust that is a small business entity to access the concessions using the turnover test. Under the current arrangements the concessions can only be accessed under the maximum net asset value test. Under the recommendation, owners of businesses who already access the other small business concessions will not need to determine eligibility under the maximum net asset value test, and instead rely on the same test used to access the other small business concessions.
Exempting certain assets can reduce compliance costs
The capital gains tax regime could also be simplified by exempting all personal use assets and increasing the exemption threshold for collectables. Currently collectables with a cost

Australia's future tax system - Report to the Treasurer
Page 82
base of $500 or less and personal use assets that cost $10,000 or less are disregarded for capital gains tax purposes.
All personal use assets should be exempt from capital gains tax, reducing compliance costs at minimal cost to revenue. Increasing the threshold for collectables would also reduce compliance costs, without establishing a tax bias to invest in high-value collectables (such as works of art).
Rewrite the capital gains tax rules
The complexity and uncertainty of the capital gains tax regime could also be reduced by adopting a principles-based approach to simplifying the legislative provisions. The current legislative provisions are prescriptive and mechanical. For example, under the current rules there are 53 separate capital gains tax events, five elements that make up an asset’s cost base and five elements of an asset’s reduced cost base, and an anti-overlap rule preventing double taxation through capital gains tax.
A principles-based approach could be used to reduce complexity while also increasing comprehension and awareness of the regime. Subject to consideration of the feasibility and net benefits of alternative approaches, a principles-based approach could build on the existing core capital gains tax concepts (such as events, cost base and capital proceeds) to minimise any impacts or disruption to other parts of the tax law that also use these concepts. Any redrafting should focus on the relationship of the capital gains tax regime to the rest of the income tax system.
In 2000, the Board of Taxation commissioned draft legislation on a more principled expression of the capital gains tax law (as part of a wider project known as the ‘tax value method’). That redraft reduced 126 pages of capital gains tax law to only 28, without significant policy change. Though the government of the time decided against proceeding with the more ambitious project of which it was a part (and which the Review is not proposing be relaunched), the redraft highlighted the potential for significant legislative simplification.
More substantial simplification of the legislation would inevitably involve some policy change, with some taxpayers made worse off and others better off. Furthermore, while a principles-based approach has the potential to simplify the law, much of the complexity in the capital gains tax regime is due to concessions and the need to address integrity concerns. Whether such concessions or integrity provisions are worth retaining would need to be re-assessed.
Remove grandfathering provisions
The abolition of grandfathering for pre-capital gains tax assets and for pre–1999 indexation arrangements would reduce the complexity of the capital gains tax regime. Evans (1998) suggested that up to 20 per cent of the capital gains tax legislation is attributable to the decision to grandfather old provisions. Removing the grandfathering provisions would also improve the efficiency and equity of the system. For example, grandfathering increases the lock–in effect of a realisation-based capital gains tax, which can lead to inefficient resource allocation.
‘Grandfathering’ (that is, preserving the treatment of pre-existing arrangements when rules are changed) often occurs in response to concerns about the equity and efficiency

A1 — Personal income tax
Page 83
implications of a change in policy settings. However, it can add to the complexity of the tax system, particularly where its effects are long lived.
Capital gains tax only applies to gains made on assets acquired after 19 September 1985. While grandfathering reduced the impact of change for existing investors, more complex legislation is needed to maintain the exemption and prevent avoidance. For those holding grandfathered assets there would be compliance costs associated with ending grandfathering, but as the number of such assets declines over time the case for ending grandfathering becomes more compelling.
The indexation rules also contribute to the regime’s complexity, although to a lesser extent than grandfathering. Indexation was phased out from September 1999 but remains available for assets acquired before then. It is likely that only a small number of taxpayers are currently better off under indexation relative to the outcome they would receive under the discount method with respect to capital gains unless they can offset such gains with relatively large capital losses.
Concerns over removing the pre-capital gains tax exemption could be offset to some extent by providing a market value cost base for remaining pre-capital gains tax assets at the time the exemption is removed. This would ensure that only capital gains that accrue going forward are taxable. Providing a relatively long lead time for such a change would also provide an opportunity for taxpayers holding pre-capital gains tax assets to dispose of those assets without capital gains tax consequences.
Taxing savings on an individual basis One practical difficulty with taking the individual as the unit of assessment for tax purposes is the alienation of income from saving, where an individual can attribute their income to another person or legal entity. A particular issue is the difficulty in drawing a distinction between gifts to others and the assignment of income from assets to others.
A person can transfer ownership of an asset to another person. This can be done formally, or can happen naturally such as when a couple has a joint bank account or owns assets jointly. Income tax systems typically permit these gifts, with the future income from the gifted asset included in the taxable income of the other person. Such gifts, however, raise a question of whether gifts or other wealth transfers should be taxed (see Section A3).
Alternatively, a person can retain ownership of an asset but assign (pre-tax) income from the asset to another person or entity, for example, by legally assigning the right to any interest or dividend to another person, or settling the asset on a trust that then distributes the income to the other person. Income tax systems may not recognise these assignments, particularly where it is only the current income that is applied for the benefit of another.
However, there is no clear line between the gift of an asset and an assignment of the income from an asset. The value of an asset can be seen as the net present value of the expected, risk adjusted, future income stream from that asset. The assignment of part of the future income of an asset is simply the giving of another type of asset, that of the right to income for a defined period.

Australia's future tax system - Report to the Treasurer
Page 84
The relative ease with which savings income can be split between individuals, particularly within a household, may have implications for attempts to improve workforce participation by keeping the marginal personal income tax rates facing secondary earners low (see Section A1–1). Including the household’s savings income in the secondary earner’s income may increase their marginal tax rates, reducing incentives to work or to work more.
Attempts to limit assignments of savings or business income, from either a person’s labour or savings can be constrained by practical considerations such as the difficulty of properly targeting any measures. For example, in the case of a family trust used in connection with a family business, the underlying ownership claims to the assets of the business and the contributions of unpaid labour by the different family members may be diffuse and complex.
Current rules only partly limit the alienation of savings income
For savings income, specific rules apply to limit the transfer of income from property, but transfers of property itself are generally effective in assigning future income to the recipient of the property (though on transfer capital gains tax may apply to any gains in the value of the asset that have arisen up to that point in time). Entities such as companies and trusts can also be used to split income from assets, while the underlying ownership or control of the assets remains unchanged.
A number of submissions to the Review raised concerns about the use of discretionary trusts, in particular, to split income. Trusts have the advantages of preserving tax preferences such as capital gains tax discounts and foreign tax credits. Companies allow deferral of any taxation above the company income tax rate, and the potential to smooth an individual’s taxable income over time. Trusts and companies are often used together to obtain the particular tax benefits of each.
There are also instances where a (low-tax) beneficiary of a trust is taxed on trust income (for example, as they are considered to be presently entitled to the income) but the actual income is effectively provided to another. The different components of income associated with the same asset may also be allocated for tax purposes to the beneficiary best suited from a tax perspective to receive them. Those beneficiaries to whom the different types of income are allocated may change over time.
Finding
Current rules limit, but do not eliminate, the scope for the alienation or assignment of an individual’s income to other persons or legal entities.
Options to further limit the alienation of savings income
The Review has considered options to further limit the potential to alienate savings income, particularly through the use of trusts. However, given the potential downsides of these options for the overall progressivity of the system or for other taxpayers, their adoption has not been recommended. The case for change is also weakened by the difficulty in drawing a line between allowing gifts and common ownership of assets within households and preventing income splitting.
Applying a flat rate of tax to savings income, from the first dollar, would remove all income tax advantages from income splitting. However, a discount for net interest, rental income
A1 — Personal income tax
Page 85
and capital gains would also flatten the income tax rates to some extent as they apply to nominal savings income. This would reduce the benefits from income splitting or deferring tax through sheltering income in a company.
For trusts, attributing income to the settlor of assets on the trust when they retain control would directly target the alienation of income. Foreign trusts are already subject to such rules for income tax purposes (the transferor trust provisions), and the transfer system adopts a similar approach to private trusts and companies. However, the administration and compliance costs associated with the general adoption of this approach in the income tax system is likely to be significant and enforcement would be difficult.
Another option considered would be to tax trusts, or discretionary trusts, as companies. Taxing trusts as companies does not directly address the problem of the alienation of income. Use of a trust would potentially confer tax deferral advantages (where the company income tax rate is less than the marginal tax rate of shareholders), while income could still be split between the various beneficiaries of the trust who could in turn benefit from refunds of any excess imputation credits.
Taxing trusts as companies could, however, indirectly limit income splitting by imposing tax penalties on the use of trusts, such as the non-flow through of capital gains discounts. But taxing trusts as companies would be poorly targeted, disadvantaging trusts not used for income splitting. Previous consideration of this option following the Review of Business Taxation also pointed to the practical difficulties involved (Board of Taxation 2002).
While the current income tax structure is broadly retained, the use of trusts for tax avoidance or evasion is, however, likely to remain an area of concern that may require targeted responses. The Australian Government has recently announced the introduction of tax file number reporting and associated withholding requirements for closely-held and family trusts. An updating and rewriting of the current trust income tax rules (Division 6) also has the potential to consider any abuses of current trust tax arrangements (Section B2 The treatment of business entities and their owners, Recommendation 36).
Australia's future tax system - Report to the Treasurer
Page 86
Annex A1: Concessional offsets in detail This attachment outlines the concessional offsets that are available in the existing system and the proposed approach to reforming, removing or retaining them.
Dependency tax offsets — Dependent spouse tax offset
Taxpayers are eligible to claim a dependent spouse tax offset if they maintain a spouse on either a married or a de facto basis, and neither the taxpayer claiming the offset nor the spouse is entitled to Family Tax Benefit Part B. The offset subsidises the costs of maintaining a spouse who is not in the full-time workforce, and cuts out when the income of the spouse reaches $8,917 (2008–09) or when income of the taxpayer reaches $150,000. In 2006–07, around 354,000 taxpayers claimed the offset at a cost to the Government of approximately $465 million.
The dependent spouse tax offset should be removed where it impacts on participation incentives and should be limited to circumstances were there is less concern about the impact on workforce participation of the secondary earner — for example, for dependants unable to work due to invalidity or for those over Age Pension age.
The dependency offsets should be combined into a single offset to provide a tax concession where the taxpayer is supporting either a dependant who is unable to work due to disability or carer responsibility or where the taxpayer or dependant has reached Age Pension age.
Dependency tax offsets — Invalid relative tax offset
The invalid relative tax offset is available to taxpayers who maintain an invalid brother, sister or child who has been certified by a medical practitioner as unable to work. In 2006–07, around 29,000 taxpayers claimed the invalid relative and parent/parent-in-law tax offset at a cost of $43 million.
The means test applied to the invalid relative (which has an income cut-out point of $3,448 in 2008–09) makes taxpayers ineligible where the invalid relative receives Disability Support Pension or an alternative income support payment.
Support to families maintaining invalid relatives is essential. It is best delivered through the transfer system via the non-means tested Carer Allowance supplementary payment and the means tested Carer Payment. The transfer system is well equipped to deal with these circumstances and is a timely and effective way of delivering assistance to those in need.
The tax system can play an additional role in providing an offset for invalid dependent relatives, although this requires a parallel system for assessing invalidity. The tax system should provide a tax offset for taxpayers who maintain and provide daily care and attention for a disabled relative where the dependant does not receive an income support payment. This should form a component of the new dependency offset.
Dependency tax offsets — Housekeeper tax offset
The housekeeper tax offset is a subsidy to taxpayers who engage a full-time housekeeper for their house. The housekeeper must care for a child under 21 years of age, invalid relative or spouse of the taxpayer who is receiving a Disability Support Pension. In 2006–07, almost 11,000 taxpayers claimed the housekeeper tax offset at a cost of approximately $16 million.

A1 — Personal income tax
Page 87
The housekeeper tax offset should be replaced with the single dependency offset for those situations where the dependant or taxpayer is unable to work or is of Age Pension age.
Dependency tax offsets — Child-housekeeper tax offset
The child-housekeeper tax offset subsidises taxpayers where their child, adopted child or stepchild keeps house for the taxpayer full-time and has some responsibility for the general running of the household. The child-housekeeper does not have to care for a dependant. Around 2,500 taxpayers claim the child-housekeeper tax offset each year at a cost of around $10 million.
The child-housekeeper tax offset should be removed, to encourage active engagement in study, training and work on the part of older dependent children. There are transfer programs that assist with the costs of undertaking work search, or full-time study or training.
Dependency tax offsets — Parent/parent-in-law tax offset
Taxpayers who maintain their parent or their spouse’s parent may be eligible for the parent/parent-in-law tax offset. The means test applied to the parent or parent-in-law (which has a separate net income cut-out point of $6,614 in 2008–09) makes taxpayers ineligible for the offset where the parent receives the Age Pension or some other form of income support. Assistance for taxpayers with dependent parents or parents-in-law is better provided through the transfer system. The tax system can play an additional role in providing an offset for dependent parents and parents-in-law aged over 65 who are ineligible for the Age Pension.
Mature age worker tax offset
The mature age worker tax offset (MAWTO) is a non-refundable offset with a complicated design. While it is intended to increase work incentives for older Australians, it is unclear whether it has achieved this goal. It is delivered at the end of the year (not through withholding tax arrangements). While it reduces effective rates of tax on earned income over one range of income, it increases them over another.
The MAWTO was introduced in the 2004–05 tax year for eligible Australian residents aged 55 or over who remain in the workforce. It offers a rebate of up to $500 based on the amount of net income generated from working during the year. The amount of the rebate is not indexed. It is phased in at five cents per dollar of assessable labour income less related deductions, reaches the maximum amount when net income from working reaches $10,000, and phases out completely when this type of income reaches $63,000. As with other offsets, the benefit is received when tax is assessed.
The MAWTO should be removed. Removal of this and other offsets would facilitate lower tax rates and a higher tax-free threshold, which is a more effective way of encouraging workforce participation than offsets like the MAWTO.
Private health insurance tax offset
To encourage the take up of private health insurance the Australian government currently subsidises premiums based on a person’s age (see Table A1–9). It does this through direct premium reductions or by providing individuals with assistance through the tax or transfer system.
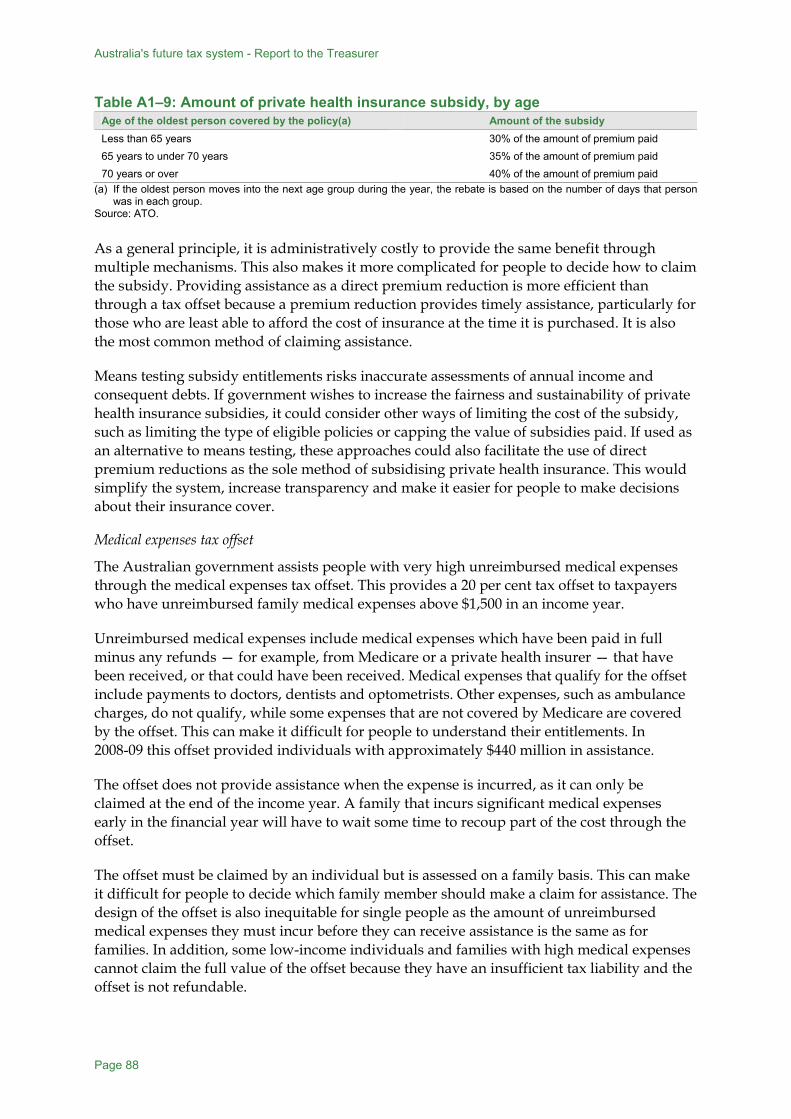
Australia's future tax system - Report to the Treasurer
Page 88
Table A1–9: Amount of private health insurance subsidy, by age Age of the oldest person covered by the policy(a) Amount of the subsidy Less than 65 years 30% of the amount of premium paid 65 years to under 70 years 35% of the amount of premium paid 70 years or over 40% of the amount of premium paid
(a) If the oldest person moves into the next age group during the year, the rebate is based on the number of days that person was in each group.
Source: ATO. As a general principle, it is administratively costly to provide the same benefit through multiple mechanisms. This also makes it more complicated for people to decide how to claim the subsidy. Providing assistance as a direct premium reduction is more efficient than through a tax offset because a premium reduction provides timely assistance, particularly for those who are least able to afford the cost of insurance at the time it is purchased. It is also the most common method of claiming assistance.
Means testing subsidy entitlements risks inaccurate assessments of annual income and consequent debts. If government wishes to increase the fairness and sustainability of private health insurance subsidies, it could consider other ways of limiting the cost of the subsidy, such as limiting the type of eligible policies or capping the value of subsidies paid. If used as an alternative to means testing, these approaches could also facilitate the use of direct premium reductions as the sole method of subsidising private health insurance. This would simplify the system, increase transparency and make it easier for people to make decisions about their insurance cover.
Medical expenses tax offset
The Australian government assists people with very high unreimbursed medical expenses through the medical expenses tax offset. This provides a 20 per cent tax offset to taxpayers who have unreimbursed family medical expenses above $1,500 in an income year.
Unreimbursed medical expenses include medical expenses which have been paid in full minus any refunds — for example, from Medicare or a private health insurer — that have been received, or that could have been received. Medical expenses that qualify for the offset include payments to doctors, dentists and optometrists. Other expenses, such as ambulance charges, do not qualify, while some expenses that are not covered by Medicare are covered by the offset. This can make it difficult for people to understand their entitlements. In 2008-09 this offset provided individuals with approximately $440 million in assistance.
The offset does not provide assistance when the expense is incurred, as it can only be claimed at the end of the income year. A family that incurs significant medical expenses early in the financial year will have to wait some time to recoup part of the cost through the offset.
The offset must be claimed by an individual but is assessed on a family basis. This can make it difficult for people to decide which family member should make a claim for assistance. The design of the offset is also inequitable for single people as the amount of unreimbursed medical expenses they must incur before they can receive assistance is the same as for families. In addition, some low-income individuals and families with high medical expenses cannot claim the full value of the offset because they have an insufficient tax liability and the offset is not refundable.

A1 — Personal income tax
Page 89
For these reasons, the medical expenses tax offset should be removed and an alternative method for delivering safety net arrangements for individuals with very high medical expenses should be developed using (for example, Medicare safety net arrangements). In light of this, the Review supports the NHHRC’s recommendation that the scope and structure of safety net arrangements be reviewed. The purpose of the review would be ‘to create a simpler, more family-centred approach that protects people from unaffordably high’ health care costs (National Health and Hospitals Reform Commission 2009).
Education tax refund
The education tax refund (ETR) was introduced for the 2008–09 tax year as a refundable offset to assist parents and independent students with certain prescribed education expenses (including computers) related to primary and secondary schooling. To be eligible, parents must meet the means test for Family Tax Benefit Part A (FTB A), and independent students must be in receipt of Youth Allowance, ABSTUDY or a like payment. An offset of 50 per cent of expenses up to an indexed maximum refund of $375 for primary students and $750 for secondary students is available.
As the refund is paid through the tax system, there is a time lag between when the expense is incurred and when the refund is received. More generally, payments such as the ETR, which are linked to receipt of other payments (in this case FTB A), effectively create ‘sudden death’ cut outs and result in very high (over 100 per cent) effective rates of tax at the point at which the main payment (FTB A) is extinguished.
The ETR should be removed from the personal tax system and replaced with automatic advance payments through the family payment system at the beginning of each school semester to those that meet the existing eligibility criteria. The Back to School Bonus would be an appropriate model.10 While eligibility for the rebate would no longer be contingent on the purchase of particular items, the proposed reform would reduce the compliance burden (substantiation requirements) for family payment recipients, provide more timely compensation and reduce complexity and administration costs in the tax system.
Entrepreneurs’ tax offset
The entrepreneurs’ tax offset (ETO) was introduced in 2005 to provide encouragement to entrepreneurs in the very early stages of business development. The ETO provides a 25 per cent tax offset on the annual income tax liability attributable to business income of very small businesses. Around 73 per cent of recipients of the ETO receive less than $600 (though the maximum rebate is $2,500). The ETO begins to phase out for businesses whose turnover exceeds $50,000, and businesses with a turnover of $75,000 cease to be eligible. Eligibility for the offset is also restricted through a means test on the claimant’s other (non-small business) income.
Removing the ETO would reduce compliance and administration costs and provide a more equitable and neutral treatment between self-employment and employment income. The ETO is very complex to administer and provides problematic incentives related to business structure.
10 The Back to School Bonus is part of the Nation Building and Jobs Plan announced on 3 February 2009. It was a one-off, upfront bonus of $950 paid to families eligible for FTB A for each eligible child of school age.

Australia's future tax system - Report to the Treasurer
Page 90
Overseas defence forces and civilian tax offsets
The overseas defence forces tax offset is available to members of the Australian Defence Force (ADF) serving in places where the nature of service is declared to be uncongenial and isolated. The overseas civilian offset is available to prescribed civilian personnel, such as Australian Federal Police (AFP) personnel, contributed by Australia to an armed force of the United Nations overseas.
For both offsets the annual amount is $338 plus 50 per cent of any dependency tax offsets for which the taxpayer is eligible.
The important contribution of Australians serving overseas is best recognised through direct salary and wages, rather than delayed payments delivered through the taxation system. The overseas defence forces tax offset and the overseas civilian tax offset should be replaced with additional remuneration. This would simplify the tax system, while still recognising the specific hardships that members face while serving in particular places.
Zone tax offset
The zone tax offset (ZTO) is available to residents of particular areas in Australia, designated Zone A, Zone B and special areas within each zone. While the special areas are defined by reference to remoteness, and can shift as concentrations of population shift, Zones A and B have not been changed for some time. Special areas include places that are more than 250 kilometres by the shortest practicable surface route from the nearest town with more than 2,500 people, as of 1981.
For special areas the offset is equal to $1,173 plus 50 per cent of the relevant rebate amount per year. For ordinary Zone A the offset is equal to $338 plus 50 per cent of the relevant rebate amount per year. For ordinary Zone B the offset is equal to $57 plus 20 per cent of the relevant rebate amount per year. The relevant rebate amount is the total of dependency offsets the taxpayer is eligible for, including notional offsets.
Data on the number of taxpayers claiming the ZTO is combined with the overseas forces offsets. In 2006–07 around 550,000 taxpayers claimed the ZTO or overseas forces offsets at a cost of $234 million.
While the Review has not examined the ZTO in detail, it is notable that the zones do not appear to be determined by any modern concept of remoteness. The zones were established in 1945 and the boundaries have remained broadly unchanged since 1956. Given changes in population and the distribution of industry and transport infrastructure since 1956, many areas in the zones are not disadvantaged or isolated. On the other hand some remote areas fall outside the zones. For example while Darwin is in Zone A and Townsville and Cairns are in Zone B, Ivanhoe, in western New South Wales, with a population of around 250 and more than 200 kilometres from the nearest town with over 2,500 people, lies outside the zones.
The zone tax offset should be reviewed, with a view to providing assistance based on contemporary measures of remoteness.
Notional tax offsets
In general there are three categories of notional dependant tax offsets: the sole parent offset, the dependent spouse with child offset, and the dependant child offset (where the amount of the offset depends on the number of children and whether the child is a student). Although

A1 — Personal income tax
Page 91
these offsets have been abolished in their own right, they are still used to determine a taxpayer’s eligibility for the zone, overseas forces and medical expenses tax offsets and for determining the amount of the Medicare levy family income threshold offsets.
For example, taxpayers who are living in a zone or are on eligible overseas service and who are sole parents or have a dependent spouse or child are eligible for an increased amount of ZTO or overseas forces offset as a result of the notional tax offsets. The notional dependent spouse with child tax offset of $2,508 allows a taxpayer who qualifies for the ZTO an additional offset of $1,254 if they are a resident of a special area or ordinary Zone A, or $502 if they are a resident of ordinary Zone B.
The notional tax offsets should be removed.
Averaging tax offsets — Employment termination payment tax offset
Historically, payments made in respect of termination of employment have been taxed at a concessional rate. The employment termination payment tax offset limits the maximum rate of tax applied to taxed elements of employment termination payments.
The taxable component of an employment termination payment up to $145,000 (in 2008–09) is taxed at 15 per cent if the recipient is at or above preservation age, and at 30 per cent if they are under preservation age. Amounts received in excess of this threshold are taxed at the top marginal tax rate. The offset was introduced in 2007 as part of the Better Super changes to replace previous arrangements under which the concessional taxation treatment of employment termination payments was aligned with the taxation arrangements applying to superannuation benefits. A limit to the concessional treatment of these payments was introduced, because they could less clearly be characterised as retirement-related.
The existing arrangements are complex and the income threshold for the concession differs significantly from the marginal tax rate thresholds. In addition, the concession is provided for generous ‘golden handshakes’ as well as for unpaid salary.
Elements of employment termination payments, such as ‘golden handshakes’, should be treated as income and taxed at marginal rates. Over time, the remaining concessions in relation to these payments should be removed and the payments taxed as income.
Averaging tax offsets — Lump sum in arrears tax offset
The lump sum in arrears tax offset limits the tax payable on the arrears component of eligible lump sum income that accrued in earlier years, such as salary or wages that accrued during a period ending more than 12 months before the date on which they were paid. It reduces the tax liability to what it would have been if the income had been received in the year(s) in which it accrued. The offset enables smoothing of tax liabilities where taxpayers receive lump sum income. The offset ensures that a taxpayer who receives a lump sum is not penalised through a higher tax liability purely because of the timing of the payment which may be out of their control.
The lump sum in arrears tax offset should be retained.
Averaging tax offsets — Medicare levy surcharge lump sum payment in arrears tax offset
The Medicare levy surcharge lump sum payment in arrears tax offset provides an offset to taxpayers who have incurred a Medicare levy surcharge liability or an increased liability in

Australia's future tax system - Report to the Treasurer
Page 92
the current year due to the receipt of an eligible lump sum payment in arrears. It ensures that any Medicare levy surcharge liability arising from receipt of an eligible lump sum payment in arrears, such as a workers compensation payment, is offset.
The Medicare levy surcharge lump sum payment in arrears tax offset should be retained if the Medicare levy surcharge is retained.
Other averaging offsets
A taxpayer with income from primary production may have their income from previous years averaged out over a period of up to five years. This is designed to ensure that a primary producer with a fluctuating income is taxed comparably to a person with a steady income stream. Where tax on the current year’s income would exceed the tax on the average income amount, the taxpayer is eligible for an offset equal to the difference. Where tax on the current year’s income would be less than the tax on the averaged income amount they incur an additional tax liability.
A taxpayer who is a ‘special professional’ — an author, inventor, performing artist, production associate or sportsperson — is also able to use an income averaging scheme under which the tax payable is calculated by applying to the total amount of ‘above-average’ special professional income the average rate of tax that one-fifth of that amount would have borne if it had been the top slice of the taxpayer’s taxable income in the relevant income year. Averaging plays an important role in ensuring reasonable treatment for primary producers and special professionals.
The averaging arrangements for primary producers and special professionals should be retained.
Superannuation tax offsets — Spouse superannuation contributions offset
The spouse superannuation contributions tax offset should be removed. Under the proposed superannuation contribution rules, all contributions would be eligible for an offset. The spouse superannuation contribution tax offset would no longer be necessary.
Other offsets for individuals
There are a number of other smaller offsets that would need to be considered on a case-by-case basis if the number of offsets were to be reduced further. In general, tax offsets should not be used to provide assistance to groups or individuals. This should instead be done through direct government spending, including through the transfer system.
Unused annual leave tax offset
This offset applies to unused annual leave accrued before 18 August 1993 or made in connection with a payment that includes or consists of a genuine redundancy payment, payment from an approved early retirement scheme or a payment that consists of an invalidity segment. The offset limits the rate of tax on the unused annual leave payment to 30 per cent.
Unused long service leave offset
This offset applies to unused long service leave accrued before 18 August 1993 and to genuine redundancy payments, early retirement scheme payments and an invalidity segment of an employment termination payment or superannuation benefit

A1 — Personal income tax
Page 93
post-18 August 1993. The offset limits the rate of tax on the unused long service leave payment to 30 per cent.
Payments for unused annual leave and long service leave should be treated as income and taxed at marginal tax rates.


Page 95
A2. Retirement incomes
A2–1 The strategic report into the retirement income system The retirement income system is facing challenges that will test it as the 21st century unfolds. These challenges include the ageing of the population, longer life expectancies and more people interacting with the system.
Key points
The retirement income system will face challenges as the 21st century unfolds. These include the ageing of the population, longer life expectancies and more people interacting with the system. A key finding of the Review’s strategic report on the retirement income system, released in May 2009, was that the current three-pillar retirement income system is well placed to deal with these challenges.
Many OECD countries tax retirement savings using an expenditure tax benchmark linked to personal income tax. Such a treatment is consistent with encouraging retirement saving, which is important in the context of population ageing. The Review recommends a number of tax changes to retirement saving that would combine to achieve a similar outcome as in these OECD countries.
The Review recommends that employer superannuation contributions be treated as employee income, with employees receiving a flat-rate tax offset. This would result in a more equitable distribution of tax concessions between low- and high-income earners. Access to concessions should be broadened by making voluntary contributions eligible for the offset. Retirement incomes should be improved by removing the tax on superannuation contributions currently payable by the fund, and halving the tax on superannuation fund earnings to 7.5 per cent.
These changes would address equity concerns with present arrangements, simplify the taxation of superannuation and improve retirement incomes, but they may not be sufficient to enable people to effectively manage their retirement incomes for longer as life expectancies increase. The current retirement income system does not provide the products that would allow a person to manage longevity risk. This is a structural weakness. The government should support the development of these products and better facilitate their provision by the private sector. This could be achieved through issuing long-dated bonds and removing rules that restrict the development of income stream products. The Review Panel is not convinced, however, that the purchase of such products should be made compulsory.
The government has a role in improving people’s awareness of the retirement income system. Arrangements could be improved by requiring superannuation guarantee contributions to be paid at the same time as wages, linking superannuation records and developing a single portal through which people could interact with government agencies.

Australia's future tax system — Report to the Treasurer
Page 96
The Review made some key findings and recommendations on the retirement income system in its strategic report released in May 2009 (AFTS 2009). The report assessed the retirement income system against the following five objectives:
• It should be broad and adequate, in that it protects those unable to save against poverty in their old age and provides the means by which individuals must, or can, save for their retirement.
• It should be acceptable to individuals, in that it considers the income needs of individuals both before and after retirement, is equitable and does not bias inappropriately other savings decisions.
• It should be robust, in that it deals appropriately with investment, inflation and longevity risk.
• It should be simple and approachable, in that it allows individuals to make decisions that are in their best interests.
• It should be sustainable, in that it is financially sound and detracts as little as possible from economic growth.
The key finding of the retirement income report is that the three-pillar architecture of the current system is well-suited for a balanced and flexible response to the challenges it faces and should be retained. The three-pillar architecture consists of the means tested Age Pension, compulsory saving through the superannuation guarantee and voluntary saving for retirement.
The retirement income report recommends maintaining the superannuation guarantee at 9 per cent and gradually increasing both the Age Pension age and the superannuation preservation age to 67. The retirement income report deferred some issues until this Report:
• the taxation of superannuation;
• arrangements for dealing with longevity risk;
• public awareness of the retirement income system;
• a single means test for income support payments; and
• the interactions between the tax and transfer systems and aged care.
The first three issues are considered in this section of the Report, while means testing and aged care are considered in sections F2 and F7 respectively.
A2–2 Taxing retirement incomes Superannuation is the main form of lifetime saving outside the family home. There is a bias in the current taxation system against long-term saving, particularly lifetime saving such as superannuation. There are at least two reasons for taxing superannuation more favourably than other saving (with the exception of housing) to reduce this bias.

A2 — Retirement incomes
Page 97
The first reason is that taxing superannuation earnings, like the earnings on most forms of savings, means that the effective rate of tax on the real value of saving increases the longer an asset is held (see Section A1 Personal income tax). This effect is more pronounced in superannuation than other savings as superannuation saving is generally held for a longer time. This justifies a more favourable tax treatment.
The second reason is that superannuation is a form of deferred income. People should be taxed on superannuation at the rate that would apply if their income had been spread over their entire life rather than merely over their working life. This is an income-smoothing argument. As a person’s retirement income is generally lower than their income while they were working it should be taxed at a lower rate.
Many OECD countries deal with the effects of inflation and income-smoothing by taxing retirement benefits at a person’s marginal tax rate, and exempting contributions and earnings from income tax. This is an example of an expenditure tax treatment of savings (see Box A2–1). The Australian approach is, instead, to achieve an approximation to the expenditure tax treatment by embedding superannuation concessions in an income tax framework.
Box A2–1: Tax benchmarks for retirement savings
The return to savings is made up of a number of components including compensation for deferring consumption (the ‘risk-free’ or normal return), a return to risk-taking and economic rent (see for example, US President‘s Tax Reform Panel 2005).
Most countries’ retirement income systems use an expenditure tax benchmark. There are two types of expenditure tax benchmarks: pre-paid and post-paid.
A pre-paid expenditure tax is based on direct taxation of labour income with an exemption for income from saving. That is, all components of the return to savings are exempt from tax. Under the pre-paid expenditure tax benchmark, superannuation contributions are taxed at an individual’s personal tax rate with both earnings and benefits tax-exempt.
A post-paid expenditure tax is based on the taxation of a direct measure of expenditure or of goods and services. This differs from a comprehensive income tax in that it exempts the normal return to saving. The return to risk-taking and any additional returns are treated similarly under both an income tax and a post-paid expenditure tax. Under the post-paid expenditure tax, both contributions and earnings would be tax-exempt but benefits would be fully taxable when paid.
In Australia, both contributions and earnings are included as income in the superannuation fund and taxed, generally at 15 per cent, while superannuation benefits are tax-exempt when paid after the age of 60. The terms of reference of this Review preclude it from considering the tax-free status of superannuation payments for the over-60s.
It is possible, however, to achieve a system that provides a similar tax outcome as other OECD countries. This system would tax contributions at a rate lower than the marginal tax rate on employment income and have earnings and benefits largely tax-free. As savings are taxed only once — on contributions — this is another type of expenditure tax of retirement savings. The Review’s recommendations in this section — to tax contributions at marginal

Australia's future tax system — Report to the Treasurer
Page 98
tax rates with a capped offset, and with a very low tax rate on earnings — combine to achieve this outcome.
In considering the equity of the superannuation tax concessions, the Review has had regard to whether people on different incomes are treated consistently and whether people can readily take advantage of the tax preferences. Rules that restrict access to concessions based on a person’s employment arrangements, such as whether their employer allows salary sacrifice contributions, mean that people in similar circumstances can receive different outcomes.
Principles
Superannuation’s sole purpose is to provide a lifetime savings vehicle, and savings should be invested to maximise returns without being subject to competing policies that would require, for example, specific asset allocation. Given this lifetime savings purpose, superannuation should receive preferential income tax treatment compared to other savings. As the Review’s terms of reference rule out taxing superannuation benefits, the key taxing point must continue to be superannuation contributions.
The objectives for the taxation of superannuation savings should be to:
• provide an equitable distribution of concessions for people with different incomes, consistent with the degree of progressivity in the personal income tax rates scale;
• encourage saving for retirement;
• make it simpler for people to get access to concessions; and
• ensure the sustainability of the retirement income system into the future.
The equity, complexity and adequacy impacts of the current tax arrangements A flat rate of tax (15 per cent) generally applies to the income of a superannuation fund, which includes contributions and earnings during the accumulation stage.
Many submissions to the Review have stated that taxing contributions at a flat rate of 15 per cent is unfair to low-income earners. They argue that many low-income earners would pay less tax if the contributions were paid as wages. They note that low-income earners receive a significantly smaller concession than high-income earners.
Based on the 2008–09 tax rates, around 1.2 million individuals do not receive a personal income tax benefit from their concessional superannuation contributions. An additional 1.2 million people receive a concession of only 1.5 percentage points (Treasury 2008). This compares with around 200,000 taxpayers (those earning more than $180,000) who receive a concession on their superannuation contributions of 31.5 per cent.
Different types of superannuation contributions receive tax concessions in different ways. An employee effectively receives a deduction for contributions made from pre-tax income (that is, superannuation guarantee and salary sacrifice contributions). A person who is
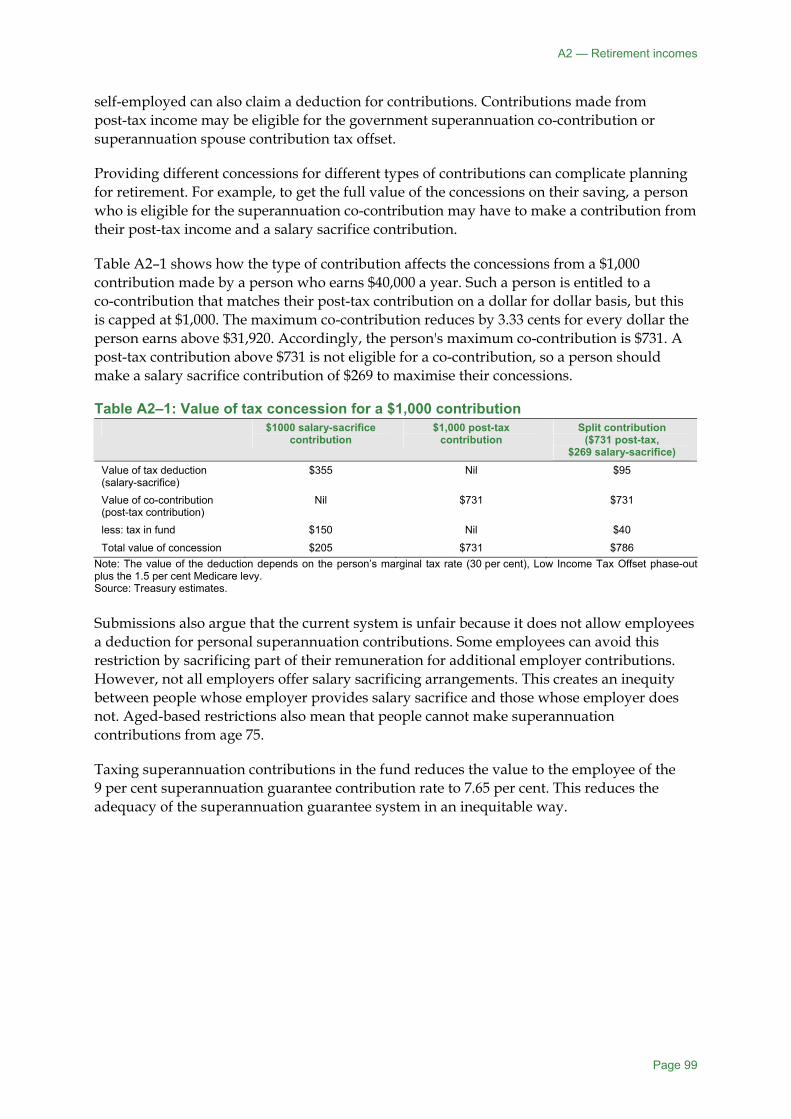
A2 — Retirement incomes
Page 99
self-employed can also claim a deduction for contributions. Contributions made from post-tax income may be eligible for the government superannuation co-contribution or superannuation spouse contribution tax offset.
Providing different concessions for different types of contributions can complicate planning for retirement. For example, to get the full value of the concessions on their saving, a person who is eligible for the superannuation co-contribution may have to make a contribution from their post-tax income and a salary sacrifice contribution.
Table A2–1 shows how the type of contribution affects the concessions from a $1,000 contribution made by a person who earns $40,000 a year. Such a person is entitled to a co-contribution that matches their post-tax contribution on a dollar for dollar basis, but this is capped at $1,000. The maximum co-contribution reduces by 3.33 cents for every dollar the person earns above $31,920. Accordingly, the person's maximum co-contribution is $731. A post-tax contribution above $731 is not eligible for a co-contribution, so a person should make a salary sacrifice contribution of $269 to maximise their concessions.
Table A2–1: Value of tax concession for a $1,000 contribution $1000 salary-sacrifice
contribution $1,000 post-tax
contribution Split contribution
($731 post-tax, $269 salary-sacrifice)
Value of tax deduction (salary-sacrifice)
$355 Nil $95
Value of co-contribution (post-tax contribution)
Nil $731 $731
less: tax in fund $150 Nil $40
Total value of concession $205 $731 $786 Note: The value of the deduction depends on the person’s marginal tax rate (30 per cent), Low Income Tax Offset phase-out plus the 1.5 per cent Medicare levy. Source: Treasury estimates. Submissions also argue that the current system is unfair because it does not allow employees a deduction for personal superannuation contributions. Some employees can avoid this restriction by sacrificing part of their remuneration for additional employer contributions. However, not all employers offer salary sacrificing arrangements. This creates an inequity between people whose employer provides salary sacrifice and those whose employer does not. Aged-based restrictions also mean that people cannot make superannuation contributions from age 75.
Taxing superannuation contributions in the fund reduces the value to the employee of the 9 per cent superannuation guarantee contribution rate to 7.65 per cent. This reduces the adequacy of the superannuation guarantee system in an inequitable way.
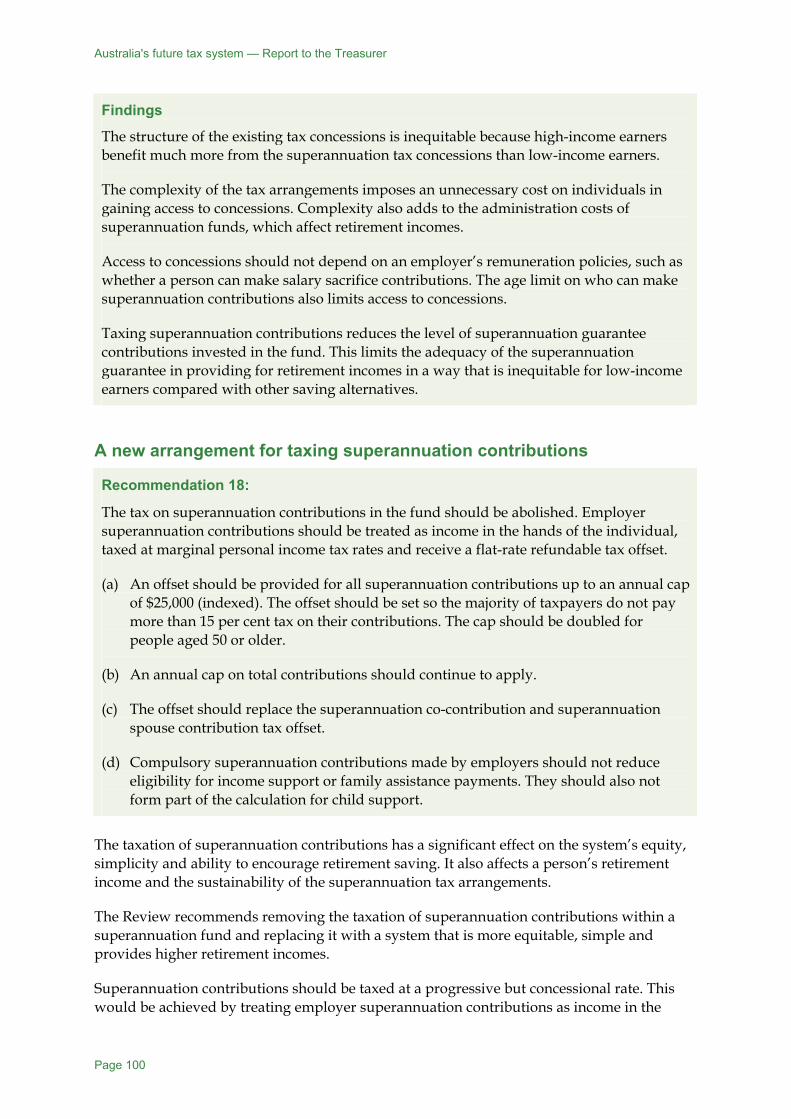
Australia's future tax system — Report to the Treasurer
Page 100
Findings
The structure of the existing tax concessions is inequitable because high-income earners benefit much more from the superannuation tax concessions than low-income earners.
The complexity of the tax arrangements imposes an unnecessary cost on individuals in gaining access to concessions. Complexity also adds to the administration costs of superannuation funds, which affect retirement incomes.
Access to concessions should not depend on an employer’s remuneration policies, such as whether a person can make salary sacrifice contributions. The age limit on who can make superannuation contributions also limits access to concessions.
Taxing superannuation contributions reduces the level of superannuation guarantee contributions invested in the fund. This limits the adequacy of the superannuation guarantee in providing for retirement incomes in a way that is inequitable for low-income earners compared with other saving alternatives.
A new arrangement for taxing superannuation contributions
Recommendation 18:
The tax on superannuation contributions in the fund should be abolished. Employer superannuation contributions should be treated as income in the hands of the individual, taxed at marginal personal income tax rates and receive a flat-rate refundable tax offset.
(a) An offset should be provided for all superannuation contributions up to an annual cap of $25,000 (indexed). The offset should be set so the majority of taxpayers do not pay more than 15 per cent tax on their contributions. The cap should be doubled for people aged 50 or older.
(b) An annual cap on total contributions should continue to apply.
(c) The offset should replace the superannuation co-contribution and superannuation spouse contribution tax offset.
(d) Compulsory superannuation contributions made by employers should not reduce eligibility for income support or family assistance payments. They should also not form part of the calculation for child support.
The taxation of superannuation contributions has a significant effect on the system’s equity, simplicity and ability to encourage retirement saving. It also affects a person’s retirement income and the sustainability of the superannuation tax arrangements.
The Review recommends removing the taxation of superannuation contributions within a superannuation fund and replacing it with a system that is more equitable, simple and provides higher retirement incomes.
Superannuation contributions should be taxed at a progressive but concessional rate. This would be achieved by treating employer superannuation contributions as income in the

A2 — Retirement incomes
Page 101
hands of the employee, taxed at marginal personal income tax rates. A flat-rate refundable tax offset, payable to the individual, would apply to these contributions to ensure that investing in superannuation retains its preferential tax treatment over other types of saving.
The offset should be available in respect of employer contributions as well as other contributions made by, or on behalf of, a person. This would provide a more consistent treatment for all contributions regardless of their source. The offset would also apply to contributions made by people who are not employees, such as the self-employed. This would replace the deductions that currently apply to these contributions.
The rate of the offset should be set so that the effective tax rate (marginal tax rate less offset) on superannuation contributions, up to a cap, remains at 15 per cent for a person on the standard marginal tax rate. The standard rate is the rate that applies to the majority of taxpayers. Under the indicative personal income tax rates scale in Section A1–1 The structure of personal income tax, this would be 35 per cent.
Taxing contributions within the superannuation fund would no longer apply. This means that the full amount of contributions (both superannuation guarantee and salary sacrifice contributions) would be invested in the fund on behalf of the person. The effect of this change, along with recommended changes to the taxation of superannuation fund earnings, would be to increase a person’s superannuation assets at retirement. For example, the superannuation assets of a person on Average Weekly Ordinary Times Earnings (AWOTE)11 would increase from over $440,000 to over $570,000 after a full working life. (For more detail, see ‘Effects of recommendations on retirement income’ later in this section.)
Improving the distribution of concessions
The recommendation would integrate employer superannuation contributions into the personal income tax system. This, along with the flat-rate tax offset, would increase the equity of the superannuation system by increasing the progressivity of the taxation of superannuation contributions (see Chart A2–1).
Under the recommendation, a person with income below the tax-free threshold would not pay tax on their superannuation contributions. The effective tax rate on contributions would remain at 15 per cent for the majority of income earners and increase for higher-income earners. People who have income below the tax-free threshold would pay no tax on their contributions but would still be eligible for the offset, while people on the highest tax rate would pay more than 15 per cent.
11 AWOTE is currently around $1,200 per week ($62,400 per year).

Australia's future tax system — Report to the Treasurer
Page 102
Chart A2–1: Progressive taxation of superannuation contributions
-30
-20
-10
0
10
20
30
0 25,000 40,000 70,000 100,000 130,000 160,000 180,000
Taxable income ($ pa)
-30
-20
-10
0
10
20
30
Current Proposal
Tax rate (%) Tax rate (%)
Note: This chart is based on the indicative personal income tax rates scale in Section A1–1. Source: Treasury estimates. The recommendation provides for a similar tax result to that in OECD countries that only tax benefits at marginal tax rates (rather than contributions and earnings). In these systems, a person generally has less income in their retirement than when they were working. This means they would pay a lower average tax rate on their retirement income compared to their pre-retirement income. The offset replicates this effect by reducing the tax rate paid on superannuation contributions compared to the tax rate paid on a person’s working income.
Under the recommendation, the maximum concession a person could receive on their contributions would be the value of the offset (in this example, 20 per cent). The level of concessions for low-income earners on their employer contributions would increase significantly while the concessions for high-income earners would decrease. This would target the concessions more effectively by increasing the savings of lower-income earners (see Chart A2–2).
The OECD (2007a) considers that the distribution of concessions is an important indicator of the success of concessional saving vehicles. It found that a policy is more effective if it increases the retirement savings for people on low to moderate incomes, as high-income earners are more likely to switch their savings to the preferentially taxed vehicle. Although concessions for higher-income earners would decrease under the recommendation, the offset would still provide a substantial incentive for them to make voluntary superannuation contributions.

A2 — Retirement incomes
Page 103
Chart A2–2: A more equitable concession for contributions Based on a 20 per cent offset(a)
1.5
16.5
31.5
20 20 20
0
5
10
15
20
25
30
35
0.5 x AWOTE AWOTE 3 x AWOTEPre-retirement income
0
5
10
15
20
25
30
35
Current Proposal
Concession (percentage points) Concession (percentage points)
(a) The chart assumes a single person who does not receive income support. The figures for the current situation are based on
the 2009–10 marginal tax rate schedule with Medicare levy. In this case, a person on 0.5 x average weekly ordinary time earnings (AWOTE) has a marginal tax rate of 16.5 per cent, a person on AWOTE has a marginal tax rate of 31.5 per cent and a person on 3 x AWOTE has a marginal tax rate of 46.5 per cent. AWOTE is currently around $1,200 per week ($62,400 per year). Around half of workers earn less than three-quarters of AWOTE.
Note: The recommended concessions are based on the indicative personal income tax rates scale in Section A1–1. Source: Treasury estimates.
Simplifying the system for individuals and superannuation funds
Moving to a single offset would simplify the system for many individuals. To get the maximum tax concession out of the current superannuation arrangements, many people must enter into an arrangement with their employer to make a contribution. In some cases employees are charged a fee to have these contributions made on their behalf.
Moving to an offset for all superannuation contributions would allow a person to deal directly with their superannuation fund. This would remove the third-party arrangements with employers that currently exist in the system. It would also increase the transparency of the superannuation contribution concessions by collapsing the existing different concessions into one (see Chart A2–3). This would remove the need for individuals to seek tax planning to optimise the structure or pattern of contributions. This tax planning also increases the costs individuals can face when making a decision whether to make voluntary superannuation contributions.

Australia's future tax system — Report to the Treasurer
Page 104
Chart A2–3: A more consistent treatment of superannuation contributions
Superguarantee
Salarysacrifice
Marginaltax rate
less 15%
Marginaltax rate
less 15%
Employer
Pre-tax Post-tax
Marginaltax rate
less 15%
Co-contribution(if eligible). Noconcession ifnot eligible for
co-contribution.
Self-employed
Spousesuperannuation
tax offset
Spouse
FLAT-RATETAX
OFFSET
Current concession Proposed
Post-tax
Co-contribution(if eligible). Noconcession ifnot eligible for
co-contribution.
Employee
Superguarantee
Salarysacrifice
15% 15%
Employer
Pre-tax Post-tax
15% Nil
Self-employed
Nil
Spouse
NO TAX
Current contributions tax in fund Proposed
Post-tax
N/A
Employee
Superguarantee
Salarysacrifice
Nil Nil
Employer
Pre-tax Post-tax
Nil Marginal taxrate (0 -46.5%)
Self-employed
Marginal taxrate (0 -46.5%)
Spouse
MARGINALTAX RATE(0-45%)(a)
Current other personal income tax Proposed
Post-tax
Marginal taxrate (0 -46.5%)
Employee
(a) Based on the indicative personal income tax rates scale in Section A1–1. There would also be benefits for superannuation funds. Currently, funds must know whether contributions are taxable or non-taxable as they are received. Under the recommendation, funds would treat all contributions the same, making for a simpler system to administer.
Government superannuation co-contribution and spouse offset
The government superannuation co-contribution provides an incentive for low- to middle-income earners to make additional superannuation contributions. Under the scheme, a person must make a personal contribution out of their post-tax income. The government matches this dollar-for-dollar up to a maximum of $1,000 for people on incomes up to $31,920 (indexed). The value of the co-contribution reduces, and phases-out completely once a person’s income is $61,920 (indexed).
Only around 20 per cent of people who would be eligible for a co-contribution currently make the necessary contribution to a fund. Many people earning less than $31,920 may find it hard to set money aside for an additional contribution. For such people the co-contribution provides no ongoing benefit as they are unable to make a contribution every year.
The abolition of the tax on their contributions, along with the offset, would provide a more effective way to increase the retirement income of low-income earners whose main source of retirement savings is their superannuation guarantee contributions. The offset would also provide a concession for voluntary savings. Therefore, it is recommended that the co-contribution be repealed.
Taxpayers can currently also claim a tax offset if they make post-tax superannuation contributions on behalf of a low-income or non-working spouse. The maximum offset for a year of income is $540. This offset should also be abolished and be replaced by the offset applying to all contributions.

A2 — Retirement incomes
Page 105
Ensuring the sustainability of the superannuation contribution tax offset
The purpose of the offset would be to provide a concession for people who want to save for their retirement. While an offset may not be as generous as the current arrangements for some taxpayers, it is still a substantial concession. The retention of a cap on concessions is therefore necessary to ensure their sustainability. The Review recommends a cap of $25,000 (indexed) be applied to the amount of contributions eligible for the offset. This is equivalent to the current cap on concessional superannuation contributions.
However, many people who have extended periods outside the workforce, such as carers and middle-aged migrants, may not have had the ability to make concessional contributions over a full working life. These people should be able to make additional concessional contributions when they have the capacity to do so. Currently, there are transitional arrangements in place that allow a person aged 50 and over to make $50,000 of concessional contributions in a year. These arrangements are due to cease from 1 July 2012 when the cap will reduce to $25,000. The Review recommends that the cap remain at double the rate of the normal cap beyond this date for people aged 50 and over (see Recommendation 18a).
A cap should also continue to apply to total superannuation contributions (currently $150,000 a year), with the existing excess contributions tax applying to contributions above the cap. People should still be able to bring forward three years of contributions into one year before the age of 65.
Arrangements should be put in place to reduce the ability of a person to arrange their affairs to receive an offset. For example, contributions up to the value of a person’s taxable or earned income should be eligible for a refund. This would discourage people from entering into short-term arrangements, such as borrowing, to get the benefit of the offset rather than increase their retirement income.
Also, the amount of offset should be available only for contributions in excess of an amount withdrawn from superannuation during the year. This would limit the ability of a person to churn amounts through superannuation purely to gain the value of the offset. For example, a person aged 65 and over has unlimited tax-free access to their superannuation. It would be possible for them to withdraw an amount from their superannuation fund, re-contribute it back into superannuation, access the concession and withdraw the contribution immediately. In this case, there would have been no increase in their retirement savings but they would be eligible for the full value of the offset.
Effect of recommendation on income
Under the recommendation, employers would withhold the amount of tax owing on the contribution from the employee’s salary or wages, thereby reducing their disposable income. The offset would, however, act to reduce the impact on disposable income.
The effect would be to move the taxation of contributions from the superannuation fund to the individual. Taken in isolation from other changes to personal income tax, this would decrease their disposable income. It would, however, increase their retirement income, as the fund would no longer pay tax on their contributions. In this respect, the proposal is similar to requiring employees to make an additional compulsory contribution into superannuation.

Australia's future tax system — Report to the Treasurer
Page 106
Transitional arrangements
Some people would be able to reduce the effect of the proposal on their take-home pay by reducing their voluntary saving. For example, as the effect of the recommendations would be similar to an additional compulsory contribution, people who currently voluntarily contribute more than 9 per cent of their salary into superannuation could reduce this amount. In some cases, the reduction in contributions would offset the reduction in take-home pay without reducing their overall investment in superannuation.
Arrangements could also be put in place to reduce the immediate impact of the changes on disposable income. For example, the changes could be implemented as part of the broader plan to reform the personal tax system. Another option would be to start with a higher offset that would gradually phase down to the ongoing offset rate over a transition period. This rate could be set so there is no effect on disposable income for a person on the 35 per cent tax rate in the first year. Reducing the offset would transfer most of the effect on income through a reduction in real take-home pay increases. This would be similar to the effect on pay resulting from an increase in the superannuation guarantee rate. The amount of tax payable on contributions could also be phased down over the same period.
Effect on government payments and child support
Eligibility for government payments such as Family Tax Benefit and Newstart Allowance should not be affected by the recommendations. Eligibility for these payments should be based on a person’s ability to meet day-to-day expenses from their accessible income and assets. As the superannuation guarantee contributions must be paid into a superannuation fund, they cannot generally be used to support a person with their day-to-day living expenses until they retire. Recommendation 18d proposes that arrangements be put in place to ensure compulsory superannuation contributions do not affect eligibility for government payments. For the same reasons, compulsory superannuation contributions should not be included when determining an individual’s child support obligations.
The taxation of earnings
Recommendation 19:
The rate of tax on superannuation fund earnings should be halved to 7.5 per cent. Superannuation funds should retain their access to imputation credits. The 7.5 per cent tax should also apply to capital gains (without a discount) and the earnings from assets supporting superannuation income streams.
Currently superannuation earnings are taxed at 15 per cent while they accumulate in the fund, with certain capital gains taxed at 10 per cent. If benefits are paid as an income stream, such as a pension or annuity, the earnings on the assets supporting the income stream are not subject to tax.
Because superannuation is a lifetime savings vehicle, the compounding effect of interest has a significant influence on how much superannuation a person can accumulate. The taxation of earnings reduces this compounding effect. It is therefore appropriate that earnings are taxed at a low rate. For the sake of simplicity this should be at a low flat rate within the fund without reference to the marginal tax rate of fund members.
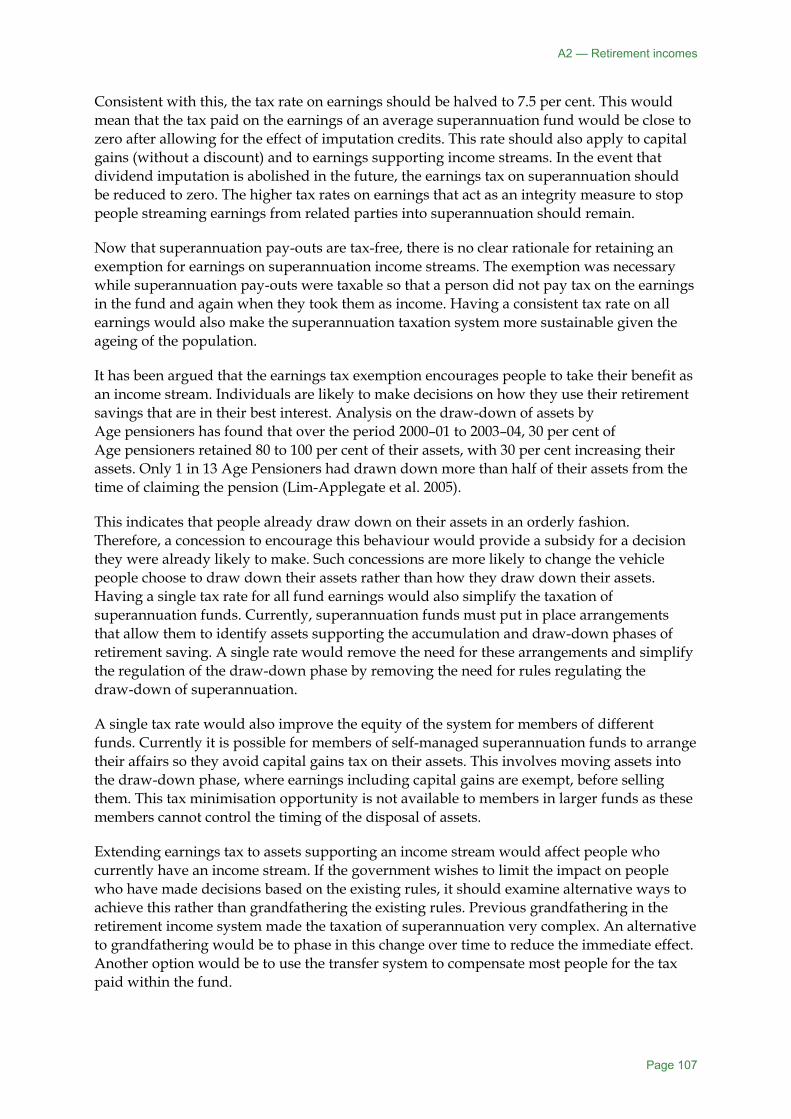
A2 — Retirement incomes
Page 107
Consistent with this, the tax rate on earnings should be halved to 7.5 per cent. This would mean that the tax paid on the earnings of an average superannuation fund would be close to zero after allowing for the effect of imputation credits. This rate should also apply to capital gains (without a discount) and to earnings supporting income streams. In the event that dividend imputation is abolished in the future, the earnings tax on superannuation should be reduced to zero. The higher tax rates on earnings that act as an integrity measure to stop people streaming earnings from related parties into superannuation should remain.
Now that superannuation pay-outs are tax-free, there is no clear rationale for retaining an exemption for earnings on superannuation income streams. The exemption was necessary while superannuation pay-outs were taxable so that a person did not pay tax on the earnings in the fund and again when they took them as income. Having a consistent tax rate on all earnings would also make the superannuation taxation system more sustainable given the ageing of the population.
It has been argued that the earnings tax exemption encourages people to take their benefit as an income stream. Individuals are likely to make decisions on how they use their retirement savings that are in their best interest. Analysis on the draw-down of assets by Age pensioners has found that over the period 2000–01 to 2003–04, 30 per cent of Age pensioners retained 80 to 100 per cent of their assets, with 30 per cent increasing their assets. Only 1 in 13 Age Pensioners had drawn down more than half of their assets from the time of claiming the pension (Lim-Applegate et al. 2005).
This indicates that people already draw down on their assets in an orderly fashion. Therefore, a concession to encourage this behaviour would provide a subsidy for a decision they were already likely to make. Such concessions are more likely to change the vehicle people choose to draw down their assets rather than how they draw down their assets. Having a single tax rate for all fund earnings would also simplify the taxation of superannuation funds. Currently, superannuation funds must put in place arrangements that allow them to identify assets supporting the accumulation and draw-down phases of retirement saving. A single rate would remove the need for these arrangements and simplify the regulation of the draw-down phase by removing the need for rules regulating the draw-down of superannuation.
A single tax rate would also improve the equity of the system for members of different funds. Currently it is possible for members of self-managed superannuation funds to arrange their affairs so they avoid capital gains tax on their assets. This involves moving assets into the draw-down phase, where earnings including capital gains are exempt, before selling them. This tax minimisation opportunity is not available to members in larger funds as these members cannot control the timing of the disposal of assets.
Extending earnings tax to assets supporting an income stream would affect people who currently have an income stream. If the government wishes to limit the impact on people who have made decisions based on the existing rules, it should examine alternative ways to achieve this rather than grandfathering the existing rules. Previous grandfathering in the retirement income system made the taxation of superannuation very complex. An alternative to grandfathering would be to phase in this change over time to reduce the immediate effect. Another option would be to use the transfer system to compensate most people for the tax paid within the fund.

Australia's future tax system — Report to the Treasurer
Page 108
Effect of recommendations on retirement incomes A person’s wellbeing in retirement depends on several key factors that should be considered together: the rate of Age Pension, the rate of the superannuation guarantee, the taxation of retirement income, the retirement age, and the funding of health and aged care. Voluntary saving is also important for people who want to achieve an income higher than can be provided by the Age Pension and superannuation guarantee savings.
The review of adequacy presented in the Review’s strategic report on retirement income (AFTS 2009) considered only the superannuation guarantee rate and the retirement age. The rate of the Age Pension was considered by Dr Harmer in his review of pensions (FaHCSIA 2009).
Since the Review’s retirement income report, the value of the total Age Pension package has been increased by $32.50 a week on top of indexation (to $335.95 a week) for single pensioners and $10.15 a week for pensioner couples on top of indexation (to $506.50 a week).12 The Age Pension age is also being gradually increased to age 67.
These decisions have significantly increased potential retirement incomes beyond the levels considered by the Review in the retirement income report. For example, the replacement rate — which compares a person’s spending power before and after retirement — for a person on average weekly ordinary time earnings (AWOTE) increased from 63 per cent in the retirement income report to 71 per cent after the Age Pension increase (see Chart A2–4).
Finding
The increase to the Age Pension in September 2009 and the Age Pension age have considerably increased the potential retirement incomes of Australians.
Effect of recommendations on replacement rates
The Review has reassessed the potential outcomes of the retirement income system for this Report. Building on Dr Harmer’s earlier review of the effect of the increase in the Age Pension on retirement incomes, the Review has reassessed adequacy in the context of the wider recommendations on what a future tax and transfer system might look like. This has provided a more complete basis on which to estimate the potential outcomes of the retirement income system.
The recommendations to change the taxation of superannuation, in addition to the increase in the Age Pension, would increase retirement incomes significantly. For example, the replacement rate for a person on AWOTE would be 76 per cent compared to 63 per cent without the Age Pension increase and the tax reform recommendations. The comparable figures for a person earning 1.5 times AWOTE are 63 per cent and 52 per cent (see Chart A2-4).
These estimates are based on a person’s superannuation guarantee savings and the amount of Age Pension for which they are eligible. Recommended changes to the funding of aged
12 These amounts include the Pension Supplement pensioners may receive as an additional payment to the base pension. The maximum Pension Supplement is currently $28.05 a week for a single pensioner and $42.30 a week for couples. Rent Assistance is not included in these amounts.

A2 — Retirement incomes
Page 109
care would also improve the standard of living of people in retirement (see Section F7 Funding aged care). Although these recommendations would reduce costs in retirement they are not reflected in the following charts as they would not directly increase the amount of retirement income a person has.
Chart A2–4: Illustrative projected replacements rates under the Age Pension and superannuation guarantee(a)
0
20
40
60
80
100
120
Pre
-Bud
get
Pos
t-Bud
get
Pos
t-AFT
S
Pre
-Bud
get
Pos
t-Bud
get
Pos
t-AFT
S
Pre
-Bud
get
Pos
t-Bud
get
Pos
t-AFT
S
Pre
-Bud
get
Pos
t-Bud
get
Pos
t-AFT
S
Pre
-Bud
get
Pos
t-Bud
get
Pos
t-AFT
S
0.5 x AWOTE 0.75 x AWOTE 1 x AWOTE 1.5 x AWOTE 2.5 x AWOTE
0
20
40
60
80
100
120
Age pension Superannuation guarantee savings
Replacement rate (%) Replacement rate (%)
(a) A replacement rate compares a person’s spending power before and after retirement (that is, income and fringe benefits
after tax is paid). For example, a replacement rate of 75 per cent would mean that a person would be able to spend in a given time period $75 in retirement for each $100 spent before retirement. The illustrative replacement rates are projected for a hypothetical single male. Pre-Budget outcomes are for a male who works for 35 years and retires in 2035. Other outcomes are for a male who works for 37 years and retires in 2047. It is assumed that they use their superannuation guarantee benefit to purchase a lifetime annuity at retirement. The spending power used to calculate the illustrative replacement rates are deflated by the consumer price index to 2008–09 dollars. Actual outcomes will vary depending on factors such as workforce participation, labour income patterns, investment performance, inflation, longevity and whether a person accesses their superannuation prior to Age Pension age.
Note: AWOTE is currently around $1,200 per week ($62,400 per year). Around half of workers earn less than three-quarters of AWOTE. Source: Treasury projections. The effect of the superannuation tax recommendations, in addition to the increase in the Age Pension, would be equivalent to a 15 per cent superannuation guarantee rate over a full working life for a person earning 0.75 x AWOTE (approximately median earnings) and AWOTE before the 2009–10 Budget. However, an increase in the superannuation guarantee rate to 15 per cent under the existing tax rules would retain the existing inequitable distribution of concessions.
There are a number of views within the community on the adequacy of the retirement income system. There are different ways to increase the adequacy of the retirement income system. This report recommends changing tax arrangements, which would increase retirement incomes (as well as improving equity and simplicity of the system). Increasing the rate of the superannuation guarantee would also increase retirement incomes, (but would not, of itself, improve equity and simplicity).
The retirement income report recommended that the superannuation guarantee rate remain at 9 per cent. In coming to this recommendation the Review took into the account the effect that the superannuation guarantee has on the pre-retirement income of low-income earners. Although employers are required to make superannuation guarantee contributions, employees bear the cost of these contributions through lower wage growth. This means the
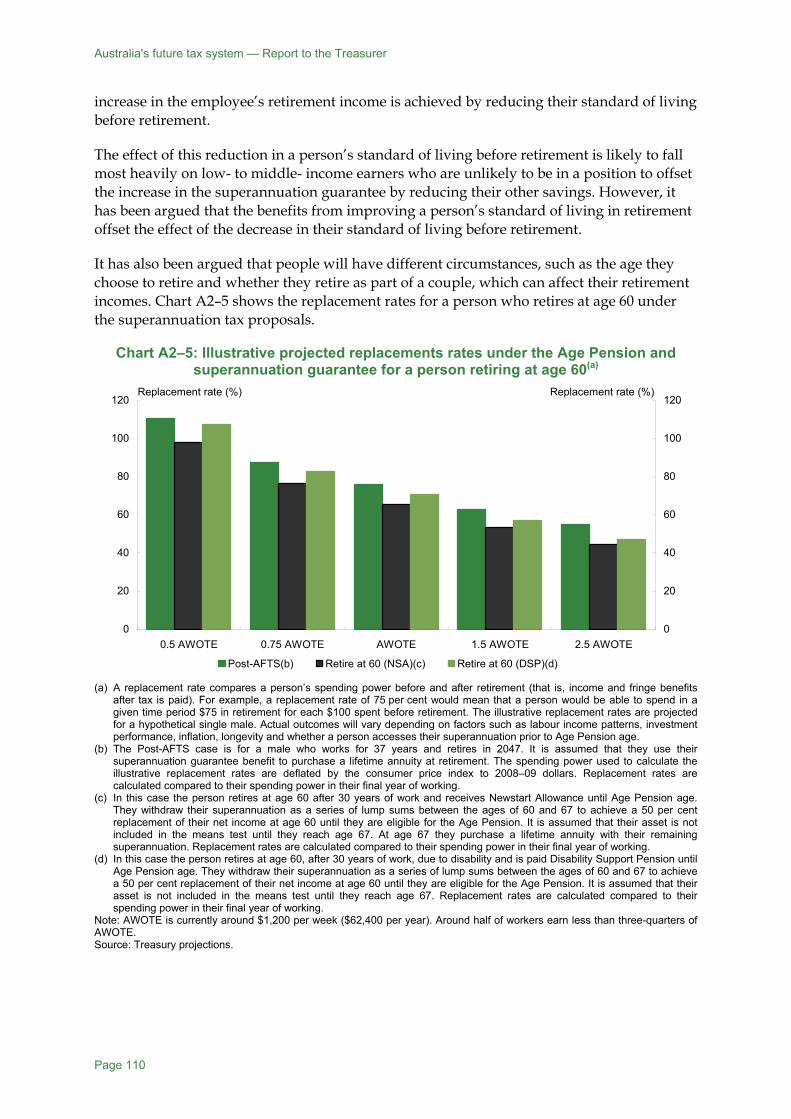
Australia's future tax system — Report to the Treasurer
Page 110
increase in the employee’s retirement income is achieved by reducing their standard of living before retirement.
The effect of this reduction in a person’s standard of living before retirement is likely to fall most heavily on low- to middle- income earners who are unlikely to be in a position to offset the increase in the superannuation guarantee by reducing their other savings. However, it has been argued that the benefits from improving a person’s standard of living in retirement offset the effect of the decrease in their standard of living before retirement.
It has also been argued that people will have different circumstances, such as the age they choose to retire and whether they retire as part of a couple, which can affect their retirement incomes. Chart A2–5 shows the replacement rates for a person who retires at age 60 under the superannuation tax proposals.
Chart A2–5: Illustrative projected replacements rates under the Age Pension and superannuation guarantee for a person retiring at age 60(a)
0
20
40
60
80
100
120
0.5 AWOTE 0.75 AWOTE AWOTE 1.5 AWOTE 2.5 AWOTE0
20
40
60
80
100
120
Post-AFTS(b) Retire at 60 (NSA)(c) Retire at 60 (DSP)(d)
Replacement rate (%) Replacement rate (%)
(a) A replacement rate compares a person’s spending power before and after retirement (that is, income and fringe benefits
after tax is paid). For example, a replacement rate of 75 per cent would mean that a person would be able to spend in a given time period $75 in retirement for each $100 spent before retirement. The illustrative replacement rates are projected for a hypothetical single male. Actual outcomes will vary depending on factors such as labour income patterns, investment performance, inflation, longevity and whether a person accesses their superannuation prior to Age Pension age.
(b) The Post-AFTS case is for a male who works for 37 years and retires in 2047. It is assumed that they use their superannuation guarantee benefit to purchase a lifetime annuity at retirement. The spending power used to calculate the illustrative replacement rates are deflated by the consumer price index to 2008–09 dollars. Replacement rates are calculated compared to their spending power in their final year of working.
(c) In this case the person retires at age 60 after 30 years of work and receives Newstart Allowance until Age Pension age. They withdraw their superannuation as a series of lump sums between the ages of 60 and 67 to achieve a 50 per cent replacement of their net income at age 60 until they are eligible for the Age Pension. It is assumed that their asset is not included in the means test until they reach age 67. At age 67 they purchase a lifetime annuity with their remaining superannuation. Replacement rates are calculated compared to their spending power in their final year of working.
(d) In this case the person retires at age 60, after 30 years of work, due to disability and is paid Disability Support Pension until Age Pension age. They withdraw their superannuation as a series of lump sums between the ages of 60 and 67 to achieve a 50 per cent replacement of their net income at age 60 until they are eligible for the Age Pension. It is assumed that their asset is not included in the means test until they reach age 67. Replacement rates are calculated compared to their spending power in their final year of working.
Note: AWOTE is currently around $1,200 per week ($62,400 per year). Around half of workers earn less than three-quarters of AWOTE. Source: Treasury projections.

A2 — Retirement incomes
Page 111
The effect of retiring before Age Pension age reduces retirement income for two reasons. The first is that a person has less time to accumulate superannuation and the second is that they must make their superannuation last for a longer period. It is projected that the retirement income system, with the tax proposals, would still provide a substantial replacement of income for people who must retire before Age Pension age. For example, an average income earner would have a replacement rate of 65 per cent if they receive Newstart Allowance and 70 per cent if they receive the Disability Support Pension.
In setting the rate for the superannuation guarantee it is appropriate to consider the average working life. For a male the full-time equivalent average working life was projected to be around 36 years (Bingham 2003). This did not take account of the effect of the recent increase in the Age Pension age. An assumption used to calculate the replacement rate in Chart A2–4 is that the person works for 37 years. Setting the superannuation guarantee rate to account for a person with a shorter working life would result in people with a longer working life saving significant amounts for their retirement. Chart A2–6 shows the replacement rates for a person who has a working life of 42 years under the superannuation tax proposals. In this case replacement rates for an average income earner increase from 76 per cent to 81 per cent.
Chart A2–6: Illustrative projected replacements rates under the Age Pension and superannuation guarantee for a person with a working life of 42 years(a)
0
20
40
60
80
100
120
0.5 AWOTE 0.75 AWOTE 1 AWOTE 1.5 AWOTE 2.5 AWOTE0
20
40
60
80
100
120
37 years 42 years
Replacement rate (%) Replacement rate (%)
(a) A replacement rate compares a person’s spending power before and after retirement (that is, income and fringe benefits
after tax is paid). For example, a replacement rate of 75 per cent would mean that a person would be able to spend in a given time period $75 in retirement for each $100 spent before retirement. The illustrative replacement rates are projected for a hypothetical single male. The chart shows how changing the assumption on how long a person works affects replacement rates. In both cases the person retires in 2047. It is assumed that they use their superannuation guarantee benefit to purchase a lifetime annuity at retirement. The spending power used to calculate the illustrative replacement rates are deflated by the consumer price index to 2008–09 dollars. Actual outcomes will vary depending on factors such as labour income patterns, investment performance, inflation, longevity and whether a person accesses their superannuation prior to Age Pension age.
Note: AWOTE is currently around $1,200 per week ($62,400 per year). Around half of workers earn less than three-quarters of AWOTE. Source: Treasury projections. Charts A2–4, A2–5 and A2–6 only show the potential retirement incomes for a single person. However, over 70 per cent of people enter retirement as part of a couple. This affects retirement income as each person in the couple is likely to have a different life expectancy. For example, women live longer than men on average. This increases the period that retirement savings must last, thereby decreasing replacement rates. Chart A2–7 shows that

Australia's future tax system — Report to the Treasurer
Page 112
replacement rates for a household are lower than for singles. A single average income earner under the tax recommendations would have a replacement rate of 76 per cent. The couple replacement rate would be 73 per cent.
Chart A2–7: Illustrative projected replacements rates under the Age Pension and superannuation guarantee(a)
(Household)
0
20
40
60
80
100
120
0.5 AWOTE 0.75 AWOTE AWOTE 1.5 AWOTE 2.5 AWOTE0
20
40
60
80
100
120
Post-AFTS (single)(b) Post-AFTS (couple)(c)
Replacement rate (%) Replacement rate (%)
(a) A replacement rate compares a person’s spending power before and after retirement (that is, income and fringe benefits
after tax is paid). For example, a replacement rate of 75 per cent would mean that a person would be able to spend in a given time period $75 in retirement for each $100 spent before retirement.
(b) The illustrative replacement rates are projected for a hypothetical single male who works for 37 years and retires in 2047. It is assumed that he uses his superannuation guarantee benefit to purchase a lifetime annuity at retirement. The spending power used to calculate the illustrative replacement rates are deflated by the consumer price index to 2008–09 dollars. Actual outcomes will vary depending on factors such as workforce participation, labour income patterns, investment performance, inflation, longevity and whether a person accesses their superannuation prior to Age Pension age.
(c) The illustrative replacement rates are for a hypothetical couple of the same age who both retire in 2047. The male works for 37 years. It is assumed that he uses his superannuation guarantee benefit to purchase a lifetime annuity at retirement. The lifetime annuity has a reversionary payment of 85 per cent to his spouse. The female enters the workforce at age 36 and works part-time to age 44, full-time from age 45 to age 59 and part-time from age 60 to age 67. She is assumed to use her superannuation guarantee benefit to purchase a lifetime annuity at retirement without a reversionary benefit. She lives three years longer than her spouse. Actual outcomes will vary depending on factors such as workforce participation, labour income patterns, investment performance, age differences between the couple, inflation, longevity and whether a person accesses their superannuation prior to Age Pension age.
Note: AWOTE is currently around $1,200 per week ($62,400 per year). Around half of workers earn less than three-quarters of AWOTE. Source: Treasury projections.
Effect of recommendations on voluntary superannuation saving
Under the recommended changes, people would continue to have a considerable incentive to save through superannuation compared to other saving vehicles. The benefits of the recommended changes for voluntary savings are shown below.
Chart A2–8 shows illustrative replacement rates for a hypothetical person making voluntary superannuation contributions under the recommended changes. While it is difficult to determine the actual effect of the changes on voluntary saving, it is assumed that the offset, and in particular the halving of the tax on earnings, would provide significant concessions compared to other savings.
The chart uses the average rate of salary sacrifice contributions for an employee based on their age and level of remuneration. It assumes they continue to make these contributions

A2 — Retirement incomes
Page 113
after the changes to the taxation of superannuation and other savings. However, the maximum amount of contributions they make is capped at $25,000 below age 50 and $50,000 from age 50.
Chart A2–8: Illustrative projected replacement rates including the Age Pension, superannuation guarantee and average salary sacrificed amounts for employees(a)
0
20
40
60
80
100
120
140
Post-AFTS Post-AFTS Post-AFTS Post-AFTS Post-AFTS
0.5 x AWOTE 0.75 x AWOTE AWOTE 1.5 x AWOTE 2.5 x AWOTE
0
20
40
60
80
100
120
140
Age pension and superannuation guarantee Average salary sacrifice
Replacement rate (%) Replacement rate (%)
(a) A replacement rate compares a person’s spending power before and after retirement (that is, after tax is paid). For example,
a replacement rate of 75 per cent would mean that a person would be able to spend in a given time period $75 in retirement for each $100 spent before retirement. The illustrative replacement rates are projected for a hypothetical single male who works for 37 years and retires in 2047. It is assumed that they use their superannuation guarantee benefit to purchase a lifetime annuity at retirement. The spending power used to calculate the illustrative replacement rates are deflated by the consumer price index to 2008–09 dollars. Actual outcomes will vary depending on factors such as workforce participation, labour income patterns, investment performance, inflation, longevity and whether a person accesses their superannuation prior to Age Pension age.
Note: AWOTE is around $1,200 per week ($62,400 per year). Around half of workers earn less than three-quarters of AWOTE. Source: Treasury projections.
Findings
Removing the contributions tax and halving the tax on earnings would provide an opportunity to generate more retirement income from the superannuation guarantee system.
The preferential tax treatment of superannuation compared to other savings should be retained. Halving the tax on earnings would be particularly effective in increasing the returns from voluntary superannuation saving.
Effect of recommendations on overall saving The superannuation system is a significant contributor to Australia’s pool of private savings. However, the system’s overall effect on national savings depends on the effect on the government’s fiscal position (that is, public savings). Superannuation affects public savings by reducing future Age Pension outlays, but the cost of concessions reduces government revenue thereby decreasing public savings.
Empirical studies on the effect of taxes on household saving are constrained due to data limitations and estimation problems. Some progress has been made with respect to studies of tax policies on investment retirement accounts and 401(k) plans in the United States, but the
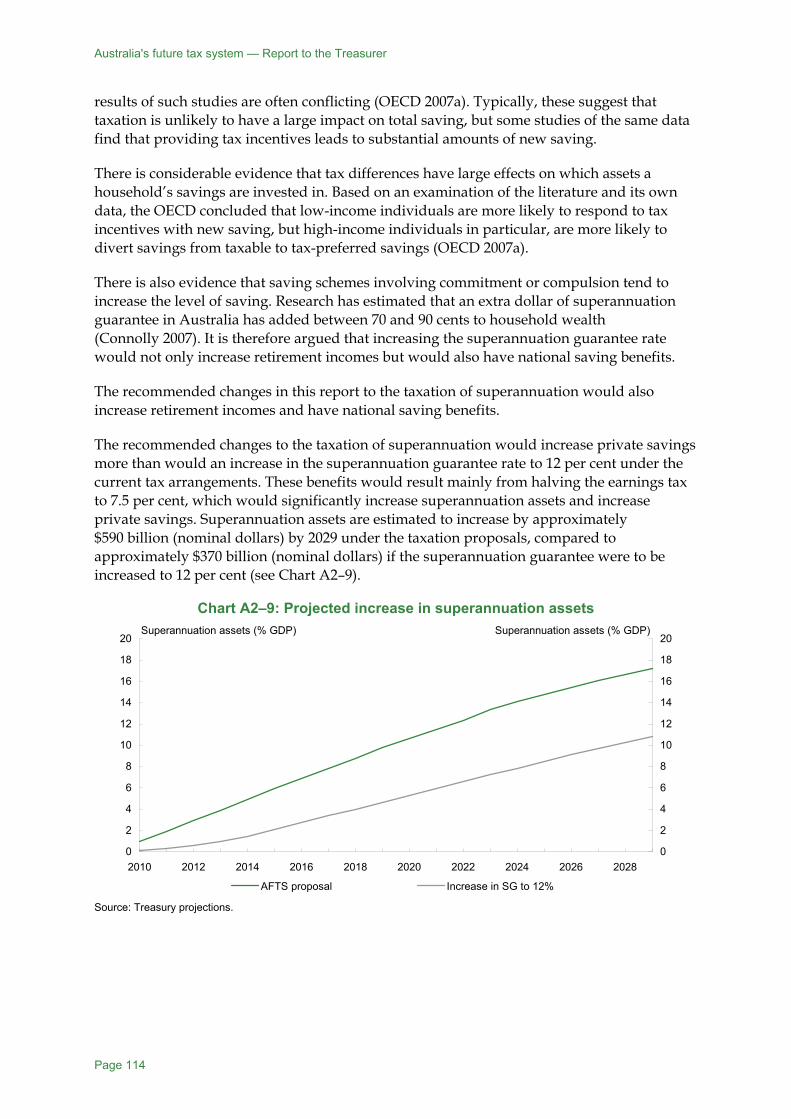
Australia's future tax system — Report to the Treasurer
Page 114
results of such studies are often conflicting (OECD 2007a). Typically, these suggest that taxation is unlikely to have a large impact on total saving, but some studies of the same data find that providing tax incentives leads to substantial amounts of new saving.
There is considerable evidence that tax differences have large effects on which assets a household’s savings are invested in. Based on an examination of the literature and its own data, the OECD concluded that low-income individuals are more likely to respond to tax incentives with new saving, but high-income individuals in particular, are more likely to divert savings from taxable to tax-preferred savings (OECD 2007a).
There is also evidence that saving schemes involving commitment or compulsion tend to increase the level of saving. Research has estimated that an extra dollar of superannuation guarantee in Australia has added between 70 and 90 cents to household wealth (Connolly 2007). It is therefore argued that increasing the superannuation guarantee rate would not only increase retirement incomes but would also have national saving benefits.
The recommended changes in this report to the taxation of superannuation would also increase retirement incomes and have national saving benefits.
The recommended changes to the taxation of superannuation would increase private savings more than would an increase in the superannuation guarantee rate to 12 per cent under the current tax arrangements. These benefits would result mainly from halving the earnings tax to 7.5 per cent, which would significantly increase superannuation assets and increase private savings. Superannuation assets are estimated to increase by approximately $590 billion (nominal dollars) by 2029 under the taxation proposals, compared to approximately $370 billion (nominal dollars) if the superannuation guarantee were to be increased to 12 per cent (see Chart A2–9).
Chart A2–9: Projected increase in superannuation assets
0
2
4
6
8
10
12
14
16
18
20
2010 2012 2014 2016 2018 2020 2022 2024 2026 20280
2
4
6
8
10
12
14
16
18
20
AFTS proposal Increase in SG to 12%
Superannuation assets (% GDP) Superannuation assets (% GDP)
Source: Treasury projections.
A2 — Retirement incomes
Page 115
Based on the assumptions in Annex A2, both the superannuation tax recommendations and increasing the superannuation guarantee rate would increase national saving, but reduce public saving since only part of the revenue forgone in tax concessions for superannuation would be offset by a reduction in pension outlays. The recommended changes would have a greater negative effect on public saving than an increase in the superannuation guarantee to 12 per cent under the current tax arrangements. However, the transfer to private savings resulting from the recommended changes means they would have a greater positive effect on national savings than an increase to the superannuation guarantee rate to 12 per cent (see Chart A2–10).
Chart A2–10: Projected increase in national saving
0.00
0.20
0.40
0.60
0.80
1.00
1.20
2010 2012 2014 2016 2018 2020 2022 2024 2026 20280.00
0.20
0.40
0.60
0.80
1.00
1.20
AFTS proposal Increase in SG to 12%
National savings (% GDP) National savings (% GDP)
Source: Treasury projections.
Findings Superannuation is a significant contributor to Australia’s savings pool.
Both the recommended changes to superannuation tax and increasing the superannuation guarantee would increase retirement incomes and national saving. The recommended changes to superannuation tax would provide a greater benefit to national savings than an increase in the superannuation guarantee rate to 12 per cent.
Other tax-related issues
Recommendation 20: The restriction on people aged 75 and over from making contributions should be removed. However, a work test should still apply for people aged 65 and over. There should be no restrictions on people wanting to purchase longevity insurance products from a prudentially regulated entity.
Submissions to the Review have raised a number of specific tax-related issues, including who can make superannuation contributions, how superannuation is taxed on a person’s death and the treatment of benefits paid from an untaxed fund.
Restrictions on superannuation contributions
Superannuation tax concessions have generally been accompanied by restrictions on who can access them. These restrictions take the form of contributions caps, work tests and age
Australia's future tax system — Report to the Treasurer
Page 116
limits. They are consistent with the primary purpose of the retirement income system, which is to smooth income over a person’s lifetime rather than be a concessional estate planning vehicle.
The work test and age limits apply to people above Age Pension age. From this age, a person must work 40 hours over a 30-day period before they can make a superannuation contribution, while contributions cannot be made from age 75. The current work test is not suitable for establishing eligibility for the proposed tax offset, because its participation demands are minimal and difficult for fund trustees to monitor.
Given the very low rate of tax applied to superannuation fund earnings, compared to other savings, a restriction on people of Age Pension age accessing concessions should continue to apply. This restriction could be in the form of an improved work test or a restriction on the amount of concessions available (a lower contribution cap). However, the restriction on people aged 75 and over, who are currently prevented from making superannuation contributions, should be abolished. If restrictions on accessing concessions continue to exist from Age Pension age, there is no need for further restrictions from the age of 75.
There should be no restrictions on people wanting to purchase longevity insurance from a prudentially regulated entity. This would be an important element in making it easier for people to purchase these products (see Section A2–3).
Death benefits
The tax treatment of superannuation on the death of a person depends on a number of factors, including who inherits the asset. A benefit paid to a dependant, such as a spouse or partner, is tax-free. A benefit paid to a non-dependant is subject to a tax of 15 per cent.13 Some submissions argue that this leads to added complexity and inequities in how benefits are taxed. However, the superannuation tax concessions are provided so a person can finance their retirement, and that of their dependants. On balance, a tax on payments made to non-dependants should continue to apply.
Untaxed funds
People in untaxed superannuation funds, such as some public sector funds, are currently taxed differently from people in the more common taxed superannuation funds. Untaxed funds do not pay tax on some, or all, of the contributions and earnings in the fund. Benefits from these funds remain taxed to achieve a broadly equivalent tax outcome between people in taxed and untaxed funds.
Superannuation pensions paid from an untaxed superannuation fund are taxed at marginal tax rates less a 10 per cent offset. Lump sums from an untaxed fund are taxed at 15 per cent up to a threshold, currently $1.1 million (indexed), and at the top marginal tax rate beyond that.
13 The tax is payable on the ‘taxable component’ of the benefit. This includes contributions and earnings that have been taxed in the fund. Tax is calculated by subtracting the tax-free component from the value of the benefit. The tax-free component is not taxable in the hands of a non-dependant. This includes amounts such as non-concessional contributions that are not taxable in the fund.

A2 — Retirement incomes
Page 117
Several submissions raise concerns that members of untaxed funds pay more tax on their non-superannuation income than members of taxed funds. A pension from a taxed fund is not included in assessable income while a pension from an untaxed fund is. This means that non-superannuation income is added to a pension from an untaxed fund. As a result, the person can pay a higher marginal tax rate on that income than they would have if the pension was paid from a taxed fund.
The considerable differences between taxed and untaxed funds make it very difficult to achieve complete parity between the benefits paid from them. On balance, it is considered that the current tax treatment of benefits paid from an untaxed fund remains appropriate given the recommended changes to the taxation of superannuation contributions and earnings in taxed funds. The treatment of contributions to untaxed funds would need to be carefully considered.
Benefits for people aged less than 60
The taxation of benefits paid to people above their preservation age but under the age of 60 should not change. Taxable lump sums are taxed at 0 per cent up to a threshold (currently $150,000) and 16.5 per cent above that amount. Taxable superannuation pensions are taxed at marginal tax rates less an offset of 15 per cent.
If, as recommended, superannuation contributions are taxed in the hands of the individual, such future contributions would be made on a post-tax basis and would not be subject to further taxation when withdrawn as a superannuation benefit.
A2–3 Responding to increasing life expectancies As people live longer, they will require more options to manage their assets over a longer period. The retirement income system will need to become more flexible so that it can provide these options.
Principles
Policies requiring a person to invest their superannuation in a particular product, or restricting access to lump sums, should only be adopted where there is strong evidence that people are unable to make decisions that are in their best interests.
The retirement income system should be flexible to allow for the development of products that allow people to manage better their retirement income.
The public sector’s primary role should be to support the private sector in the development of these products. The public sector should only enter this market where the private sector is unable to meet the needs of the community and should do so only on an actuarially fair pricing of risk.
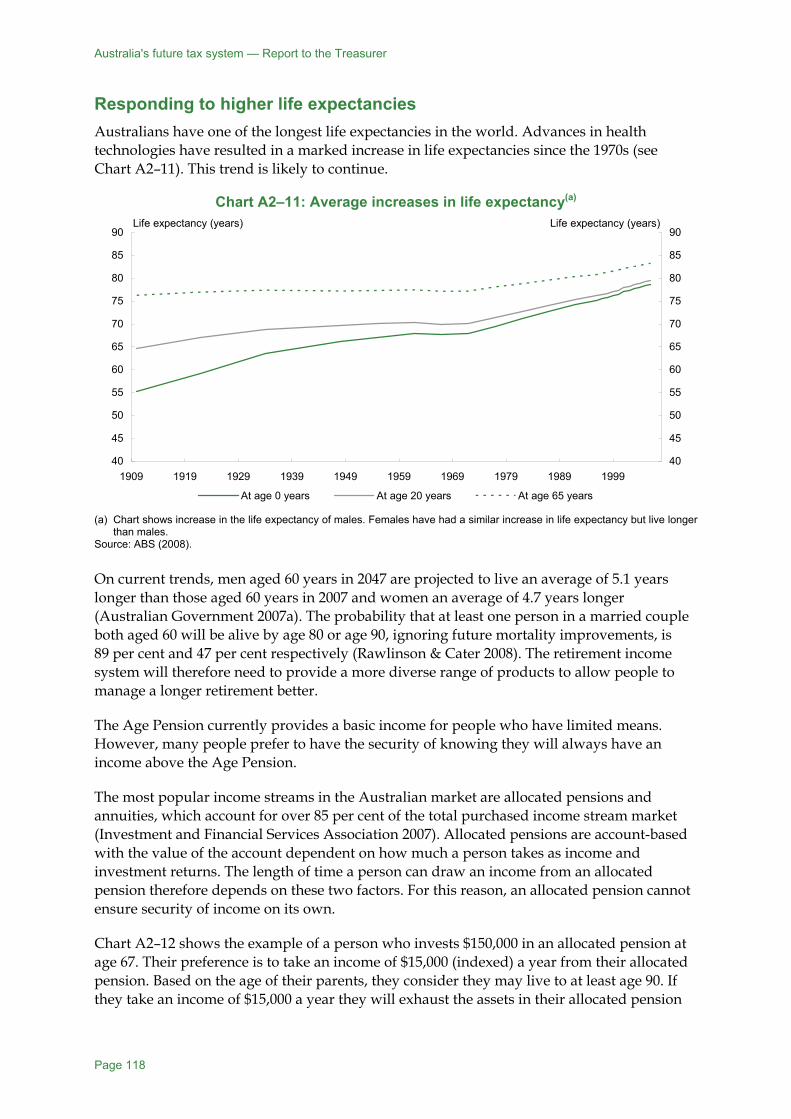
Australia's future tax system — Report to the Treasurer
Page 118
Responding to higher life expectancies Australians have one of the longest life expectancies in the world. Advances in health technologies have resulted in a marked increase in life expectancies since the 1970s (see Chart A2–11). This trend is likely to continue.
Chart A2–11: Average increases in life expectancy(a)
40
45
50
55
60
65
70
75
80
85
90
1909 1919 1929 1939 1949 1959 1969 1979 1989 199940
45
50
55
60
65
70
75
80
85
90
At age 0 years At age 20 years At age 65 years
Life expectancy (years) Life expectancy (years)
(a) Chart shows increase in the life expectancy of males. Females have had a similar increase in life expectancy but live longer
than males. Source: ABS (2008). On current trends, men aged 60 years in 2047 are projected to live an average of 5.1 years longer than those aged 60 years in 2007 and women an average of 4.7 years longer (Australian Government 2007a). The probability that at least one person in a married couple both aged 60 will be alive by age 80 or age 90, ignoring future mortality improvements, is 89 per cent and 47 per cent respectively (Rawlinson & Cater 2008). The retirement income system will therefore need to provide a more diverse range of products to allow people to manage a longer retirement better.
The Age Pension currently provides a basic income for people who have limited means. However, many people prefer to have the security of knowing they will always have an income above the Age Pension.
The most popular income streams in the Australian market are allocated pensions and annuities, which account for over 85 per cent of the total purchased income stream market (Investment and Financial Services Association 2007). Allocated pensions are account-based with the value of the account dependent on how much a person takes as income and investment returns. The length of time a person can draw an income from an allocated pension therefore depends on these two factors. For this reason, an allocated pension cannot ensure security of income on its own.
Chart A2–12 shows the example of a person who invests $150,000 in an allocated pension at age 67. Their preference is to take an income of $15,000 (indexed) a year from their allocated pension. Based on the age of their parents, they consider they may live to at least age 90. If they take an income of $15,000 a year they will exhaust the assets in their allocated pension
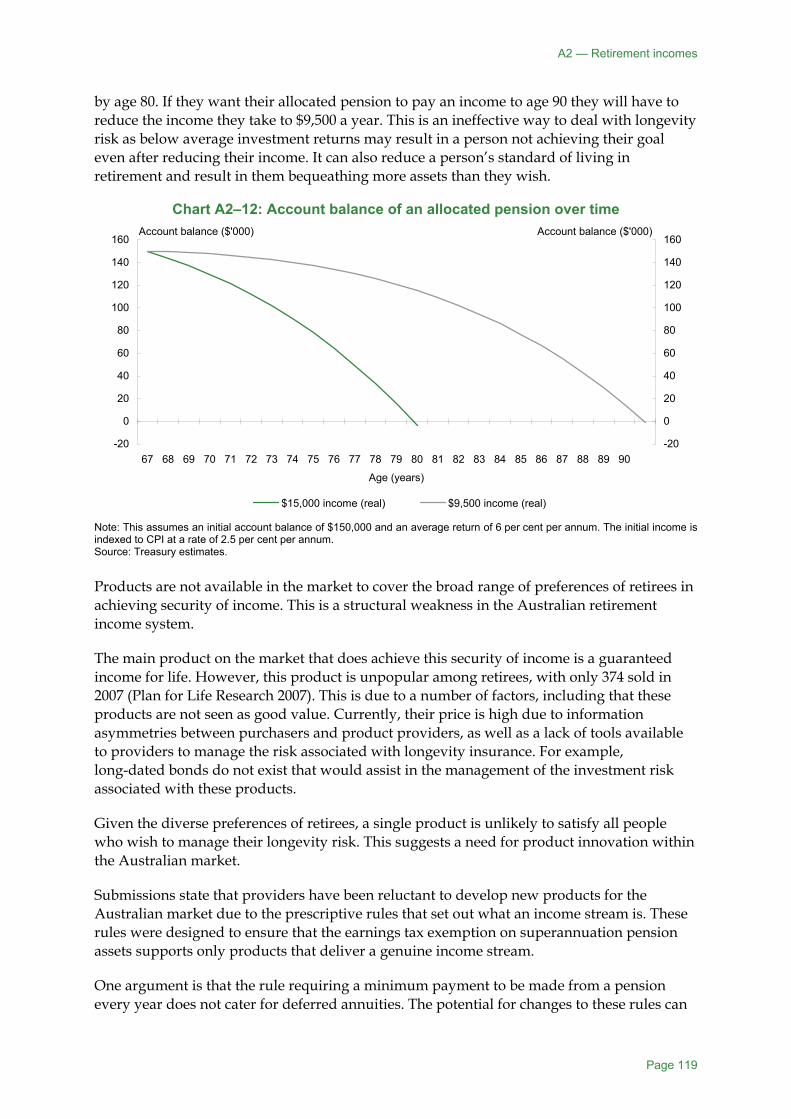
A2 — Retirement incomes
Page 119
by age 80. If they want their allocated pension to pay an income to age 90 they will have to reduce the income they take to $9,500 a year. This is an ineffective way to deal with longevity risk as below average investment returns may result in a person not achieving their goal even after reducing their income. It can also reduce a person’s standard of living in retirement and result in them bequeathing more assets than they wish.
Chart A2–12: Account balance of an allocated pension over time
-20
0
20
40
60
80
100
120
140
160
67 68 69 70 71 72 73 74 75 76 77 78 79 80 81 82 83 84 85 86 87 88 89 90
Age (years)
-20
0
20
40
60
80
100
120
140
160
$15,000 income (real) $9,500 income (real)
Account balance ($'000) Account balance ($'000)
Note: This assumes an initial account balance of $150,000 and an average return of 6 per cent per annum. The initial income is indexed to CPI at a rate of 2.5 per cent per annum. Source: Treasury estimates. Products are not available in the market to cover the broad range of preferences of retirees in achieving security of income. This is a structural weakness in the Australian retirement income system.
The main product on the market that does achieve this security of income is a guaranteed income for life. However, this product is unpopular among retirees, with only 374 sold in 2007 (Plan for Life Research 2007). This is due to a number of factors, including that these products are not seen as good value. Currently, their price is high due to information asymmetries between purchasers and product providers, as well as a lack of tools available to providers to manage the risk associated with longevity insurance. For example, long-dated bonds do not exist that would assist in the management of the investment risk associated with these products.
Given the diverse preferences of retirees, a single product is unlikely to satisfy all people who wish to manage their longevity risk. This suggests a need for product innovation within the Australian market.
Submissions state that providers have been reluctant to develop new products for the Australian market due to the prescriptive rules that set out what an income stream is. These rules were designed to ensure that the earnings tax exemption on superannuation pension assets supports only products that deliver a genuine income stream.
One argument is that the rule requiring a minimum payment to be made from a pension every year does not cater for deferred annuities. The potential for changes to these rules can

Australia's future tax system — Report to the Treasurer
Page 120
increase the uncertainty faced by providers. Submissions also claim there is a lack of coordination between the regulators of the income stream market. It is argued that these issues increase the risk, and therefore cost, of developing products.
Findings
The increasing life expectancies of Australians will require a greater choice of retirement income products that can cater for the different needs of individuals in retirement.
There are not enough products that guarantee an income for the whole of a person’s retirement. This is because the industry lacks tools to manage risks associated with these products, such as long-dated bonds. Also government rules restricting development of income-stream products and uncertainty about future changes in these rules inhibit product innovation.
Housing as a form of longevity insurance
Accessing the equity in the family home is another way people may choose to achieve a higher standard of living in retirement and to protect against longevity risk. Reverse mortgages allow a person to borrow against the equity in their home with the loan usually paid off when the home is sold or the home owner dies. The reverse mortgage market in Australia is still developing but has been growing over time (see Table A2–2). An alternative product has recently been introduced where a person sells a proportion of their home to an institution. The institution then has a right to claim that proportion of the proceeds on the sale of the house.
Table A2–2: The reverse mortgage market in Australia December 2005 December 2006 December 2007 December 2008 June 2009
Outstanding market size ($b)
0.85
1.51
2.02
2.48
2.61
Number of loans 16,584 27,898 33,741 37,530 38,048
Average loan size $51,148 $54,233 $60,000 $66,150 $68,473 Source: SEQUAL/Deloitte (2009). Payments from a reverse mortgage on a primary residence are not treated as income for tax purposes as they are considered to be a loan. The exemption of the owner-occupied home from the income support means test may discourage people from undertaking home equity conversions as it would convert an exempt asset into an assessable one. To counter this, special means test arrangements apply. The first $40,000 of a reverse mortgage paid as a lump sum is exempt from the assets test for 90 days. Amounts over $40,000 are assessed under deeming rules if held as a financial asset. If taken as a stream of payments, the amount drawn down is not counted in the income test. The tax and means test treatment of these products is already generous and should not be made more so.

A2 — Retirement incomes
Page 121
Role of longevity insurance products
Recommendation 21:
The government should support the development of a longevity insurance market within the private sector.
(a) The government should issue long-term securities, but only where this is consistent with its fiscal obligations, to help product providers manage the investment risk associated with longevity insurance.
(b) The government should make available the data needed to create and maintain a longevity index that would assist product providers to hedge longevity risk.
(c) The government should remove the prescriptive rules in the Superannuation Industry (Supervision) Regulations 1994 relating to income streams that restrict product innovation. This should be done in conjunction with the recommendation to have a uniform tax on earnings on all superannuation assets.
Recommendation 22:
The government should consider offering an immediate annuity and deferred annuity product that would allow a person to purchase a lifetime income. This should be subject to a business case that ensures the accurate pricing of the risks being taken on by the government. To limit the government’s exposure to longevity risk, it should consider placing limits on how much income a person can purchase from the government.
The development of longevity insurance products is another means — along with the taxation of superannuation and the funding of health and aged care — of improving the adequacy of the retirement income system. If a person knows they can rely on a particular level of income to support them until they die, they can make better decisions on how to manage their assets over their retirement.
The retirement income report set out some issues relating to longevity insurance that the Review Panel wanted to consider in this Report. These were whether the product should be:
• mandatory or voluntary;
• provided by the private sector or public sector; and
• guaranteed or non-guaranteed.
Mandatory or voluntary
As long as the Age Pension continues to provide a longevity insurance safety net, it is not necessary to impose a requirement that people invest in additional insurance.
A reasonable basis for policy design is the presumption that, having accumulated retirement savings, people are generally in the best position to determine how they use their assets during their retirement. Some people may prefer a higher standard of living at the beginning of their retirement, with high draw-downs from their superannuation during this time, before relying on the Age Pension later in their life. Other people may prefer a stable and
Australia's future tax system — Report to the Treasurer
Page 122
secure income over their entire retirement. A voluntary system ensures that both these groups can insure up to the level of income they want over their retirement.
Some submissions suggest that people should be required to use part of their superannuation to purchase longevity insurance. Such a requirement could help to overcome one source of market failure in longevity insurance markets related to access to information. These markets may fail to yield efficient outcomes because a person may have more information on how long they are likely to live than insurers do. This may mean that the only people who purchase these products are those who consider they are likely to live longer than average. Insurers can react to this ‘information asymmetry’ either by not selling the products or by pricing them at a level that discourages most people from purchasing them. This is one of the reasons for the unpopularity of life annuities.
A mandatory system would remove this market failure by ensuring that the people in the insurance pool reflect the average life expectancy within the community as a whole. This would allow insurers to sell these products at a lower price because the capital of the people who die early in their retirement supports those people who live for longer. Research by the University of New South Wales confirms this effect (Sherris & Evans 2009). Table A2–3 shows the first annual payment of an annuity in a mandatory and voluntary system.
Table A2–3: Income differences between mandatory and voluntary annuitisation Type of annuity First annual payment(a)
($) Compulsory annuitisation, immediate annuity(b) 8,965 Voluntary annuitisation, immediate annuity 7,942 Compulsory annuitisation, deferred annuity(c) 71,408 Voluntary annuitisation, deferred annuity 44,181
(a) The payment is based on an annuity purchased by a male from the private sector with $100,000. Longevity is based on the improvements to mortality that have occurred in the past 5 years. It assumes no indexation and is valued using the end June 2009 yield curve from government bonds quoted on Bloomberg. The values are in nominal dollars.
(b) The immediate annuity commences at age 67. (c) The deferred annuity is purchased at age 67 and commences at age 85. Source: Sherris and Evans (2009). However, overcoming this market failure by mandating the purchase of longevity insurance can come at a cost to people who are in poor health or have lower life expectancies, such as Indigenous Australians. Such people would be disadvantaged by a mandatory system as they would effectively be subsidising people who live longer than average. It may be possible to provide a different pricing structure for these people to accommodate their lower life expectancies. However, even if these arrangements existed, a mandatory system is likely still to be seen as punitive to these people.
Another argument for a mandatory system is that it would reduce the risk that people exhaust their assets quickly in order to receive an Age Pension. However, the research by Lim-Applegate et al. (2005) suggests that people in retirement are conservative in how they draw down their assets. This may be as a result of them attempting to self-insure against longevity risk.
On balance, the Review does not recommend a mandatory system for longevity insurance. A mandatory system would constrain the ability of people to make their own decisions on how they use their superannuation to fund their retirement. The evidence suggests that people make conservative decisions on how they use their assets in retirement. Also, the existence of
A2 — Retirement incomes
Page 123
the Age Pension already provides longevity insurance for a significant proportion of the population.
Findings
There are some arguments for requiring people to purchase longevity insurance. These include addressing information asymmetries that exist between the purchaser and provider and ensuring that at least part of a person’s superannuation is used for retirement.
However, a mandatory system would have a detrimental effect on people with lower than average life expectancies. The Age Pension will continue to provide longevity insurance for the majority of retirees.
Public or private sector
The Review Panel considers that the development of a voluntary market for longevity insurance will require input from the private and public sectors. The private sector is in a better position to develop products that best meet the preferences of individuals. However, the public sector may be in a better position to deal with the significant counterparty risk associated with longevity insurance. The public sector could also provide more tools to assist in the development of longevity insurance products.
International experience
In other countries, new products are being developed that provide an alternative to typical annuity products where a person purchases an income for life. In the United States, a person can purchase a guaranteed income based on the value of an investment account similar to an allocated pension from a set time. These products differ from typical annuity products in that the amount of income and the start date are not fixed. While the minimum amount of income is fixed, it can increase depending on investment returns. The income only commences when the value of the account falls below the income guarantee. The level of guarantee also tends to be supported by hedging arrangements by the provider. This differs from typical annuities, which are supported by capital that the provider must hold under prudential regulation. A similar product has recently been introduced into the Australian market.
Deferred annuities, which provide an income from a certain age, are also becoming more prevalent. These annuities allow a person to lock up part of their retirement savings to generate an income when they are entering the latter stages of their retirement. This provides a person with more certainty in how they manage the rest of their assets before the commencement of the deferred annuity.
The preferences of retirees, advancements in technology and risk management techniques will continue to affect the development of longevity risk products into the future. The private sector is likely to be able to respond to these factors more quickly than the public sector.
The role of the government
The government can assist in creating an environment where the industry has greater flexibility and confidence to develop longevity insurance products.

Australia's future tax system — Report to the Treasurer
Page 124
Removing restrictive rules
A product must comply with certain rules to be treated as a superannuation pension or annuity. The prescriptive nature of these rules, such as a requirement for specific annual payments and limits on indexation, can constrain product development.
The recommendation to tax all superannuation fund earnings (whether or not they support an income stream) at a uniform lower tax rate removes the concession these rules were protecting (see Recommendation 19). Therefore, implementing the earnings tax recommendation would provide the opportunity to remove these rules. The removal of these rules would provide greater scope for innovation in the income-stream market and enable product providers to get products into the market more quickly. The current rule that caps the amount of payment from a transition to retirement pension should continue, however, as this protects the integrity of the preservation rules.
The removal of these rules would also make redundant the current income test assessment of superannuation pensions and strengthens the case for deeming income on account-based income streams, so they are treated like other financial assets. The proposal for means testing superannuation pensions is at Section F2 Means testing.
In many cases, people may choose not to purchase longevity insurance at their retirement age. As they grow older they may be in a better position to judge their potential longevity. However, after a person retires they may be unable to make further contributions into a superannuation fund due to the work test rules. These restrictions should not apply to contributions made to a prudentially regulated superannuation fund or life insurance company for the purpose of purchasing a longevity product (see Recommendation 20).
The government should also consider removing other legislative constraints that may inhibit the development of longevity products. However, this should not be at the cost of necessary prudential or consumer protection. Given the nature of these products, they should only be provided by prudentially regulated entities. Products that provide a guaranteed income should follow consistent prudential requirements to reduce the risk that a provider is unable to meet their obligations as they fall due.
Coordination between the regulators
Another concern raised with the Review is that there is little coordination between the various regulators of income-stream products. These regulators are: the Australian Taxation Office (ATO); the Australian Prudential Regulation Authority (APRA); the Department of Families, Housing, Community Services and Indigenous Affairs (FaHCSIA); and the Australian Securities and Investments Commission (ASIC).
Most concern was raised about the interaction between the ATO and APRA, especially in relation to whether a product meets the definition of a pension or annuity and is therefore eligible for tax concessions. While the ATO administers these concessions, it is unable to advise product providers whether their product meets the definition of a pension or annuity as this definition is in the Superannuation Industry (Supervision) Regulations 1994, which are administered by APRA. This definition would no longer exist if all superannuation fund earnings are taxed at a uniform rate. This would also remove the need for the ATO to be involved in the regulation of income streams.

A2 — Retirement incomes
Page 125
Better management of risks
The providers of longevity insurance must deal with a number of risks in bringing a product to the market. These include investment risk, inflation risk and longevity risk.
Investment risk relates to the long-term nature of these products. In guaranteeing a future income, the provider assumes an average rate of return over the period of the guarantee. The more closely a provider can match their long-term liabilities with long-term assets, the lower this risk and the lower the price at which the product can be sold.
Inflation risk affects both the purchaser and the product provider. Inflation reduces the spending power of a person’s retirement income over time. People can purchase income streams indexed to inflation to counter this risk but this increases the price of the product. Inflation risk also increases the costs of providing long-term products.
Longevity risk relates to the likelihood that the provider will have to meet pension obligations for longer than expected due to an unanticipated increase in life expectancy in the community.
Government policy can help product providers manage these risks and reduce the price of longevity insurance. In particular the government could issue a broader range of debt instruments, such as indexed and long-dated bonds. The availability of these assets would greatly assist in the development of a longevity insurance market by reducing investment and inflation risk.
The Australian Office of Financial Management announced on 7 August 2009 that it would resume issuing Treasury indexed bonds. The government should also consider issuing longer-dated bonds where this is consistent with its fiscal obligations.
The Review Panel does not consider that the government should issue longevity-indexed bonds to encourage the development of a longevity insurance market. The government already takes on the overwhelming majority of longevity risk through the Age Pension. Longevity bonds would increase the government’s exposure to this risk. This is consistent with the findings of the OECD (2007b), which found the prospects for a successful, large-scale market in longevity-indexed bonds did not seem favourable due to the already high level of longevity risk already on government balance sheets.
A longevity index shows the number of years that, on average, a member of the population at a particular age is expected to live. The index can be used to establish a market in which providers can hedge part of their longevity risk. Such an index has been set up by J.P. Morgan for the United Kingdom market (known as the LifeMetrics index). The government could help to develop a longevity index by making available the data necessary to create and maintain one (see Recommendation 21b). This is consistent with an OECD (2007b) finding that governments, through their national statistical institutes, could help private market participants produce longevity indices. Sherris and Evans (2009) suggest that the government would be in the best position to produce such an index.
Tax and means test concessions
There have also been calls for the government to provide tax or social security concessions to encourage people to purchase longevity insurance. Specific concessions for longevity risk products are not supported as they could distort the market.

Australia's future tax system — Report to the Treasurer
Page 126
If specific concessions did exist, there would need to be rules setting out the characteristics of these products. The government would effectively need to approve new products that may fall outside these rules by making legislative changes. The longevity insurance market is likely to be very innovative. Placing legislative restraints on product design would be an unnecessary and costly constraint on innovation.
However, given the unique nature of deferred annuities, there is a case that they should only be means tested when they start to pay an income, unless a person can access the capital before this time. Further details on the proposed means test treatment of superannuation pensions and annuities are in Section F2 Means testing.
Government-provided products
In purchasing a longevity risk product, the purchaser is taking on the risk that the provider will be unable to meet their obligations. Prudential regulation provides some protection against this risk. However, other factors could affect this counterparty risk.
One of these risks is systemic longevity risk, where advances in health research or changes in lifestyle result in unexpected increases in life expectancy for the entire community. Significant changes in life expectancy may go beyond what is catered for in prudential regulation. This might affect a provider’s ability to meet its current and future obligations.
The government should consider whether these risks are such that it should enter the market and sell products that provide a guaranteed income stream (see Recommendation 22). For example, the government could use the existing Age Pension infrastructure to allow a person to purchase an immediate annuity. The government should also consider selling a deferred annuity that, if purchased, would give retirees greater certainty over the period they have to draw down their assets. People should be able to purchase these products with superannuation as well as non-superannuation money.
Several submissions state that the government should not sell these products. They argue that the government may not provide these products at an actuarially fair price. This might result in low-income households who do not purchase this product subsidising higher-income households who are more likely to do so. This may also result in the private sector leaving the market (which could result in less product innovation).
As the government already takes on the majority of longevity risk through the Age Pension, if it were to offer these products it should limit the amount of additional longevity risk it takes on. It could, for example, limit the value of the annuity and place a cap on the amount a person could invest in a deferred annuity. The government would need to develop an appropriate business model that would ensure the products are sold at a price that accurately reflects the risk the government would be taking on.

A2 — Retirement incomes
Page 127
Findings
The development of a longevity insurance market will require involvement by both the private and public sectors. The private sector is better placed to develop products that meet the needs of retirees. The public sector can assist in developing these products by providing more tools that the private sector could use to limit the risks associated with the products.
The public sector may be better placed to deal with the counterparty risks that exist with these products. However, the government would be taking on more longevity risk by entering this market.
Guaranteed or non-guaranteed
Products can either be guaranteed by the provider or non-guaranteed. The income from a non-guaranteed product would depend on the investment returns on the assets supporting the pool and the mortality experience of the people in the pool.
The government should not restrict the types of products that could be sold. Longevity insurance should form part of a portfolio of products people can use to finance their retirement. Placing restrictions on products, such as requiring them to be guaranteed or non-guaranteed, reduces the potential range of products that could be included in this portfolio.

Australia's future tax system — Report to the Treasurer
Page 128
A2–4 Improving people’s awareness of the retirement income system
Recommendation 23:
The government should help make people more aware of the retirement income system, and therefore better able to manage their superannuation, by increasing the regularity of superannuation guarantee contributions, making it easier for people to manage their superannuation and providing people with a single point of contact for government agencies.
(a) Superannuation guarantee contributions should be paid at the same time as wages. This should be introduced over time so businesses can adjust their cash flows. As a first step, larger businesses (that is, businesses required to lodge their business activity statements on a monthly basis) should be required to pay superannuation guarantee contributions at least monthly.
(b) Employers should report superannuation contributions to their employees when a contribution is made.
(c) There should be a method of linking superannuation records, such as client identifiers like the tax file number, to make it easier for people to manage their superannuation.
(d) A superannuation portal where people can interact with government agencies and get information on retirement incomes should be developed. Over time this portal should evolve, subject to suitable safeguards, so that people can manage all their superannuation through one channel.
Principles
People should be able to engage with the superannuation system and manage their superannuation as easily as possible. In order to do so, they need to be aware of how the retirement income system works with their money. The system should take into account that superannuation contributions are part of an employee’s remuneration and people should be able to manage their superannuation in an efficient manner.
People should be able to interact easily with the government agencies that administer the retirement income system.
A person’s level of awareness of the retirement income system will affect the outcomes they get from it. While it is difficult to make people take a greater interest in the system there would be benefits in making it easier for people to become more engaged with their superannuation.
Measures to increase engagement include: increasing the regularity of superannuation guarantee contributions; creating a more effective means for people to prove their identity to superannuation funds; and introducing a single superannuation portal that people can use to manage their relationship with government agencies.
A2 — Retirement incomes
Page 129
The relationship between members and superannuation funds is also important for increasing awareness and engagement. This relationship forms part of the Review into the governance, efficiency and structure and operation of Australia's superannuation system being undertaken by Mr Jeremy Cooper (the Cooper Review).
Findings
There are certain aspects of the retirement income system that can hinder people from becoming more engaged with it. These include government regulations that provide for:
• superannuation guarantee contributions to be paid separately from wages; and
• complex identification requirements for people with multiple accounts that can make it difficult for people to manage their superannuation.
The relationship between individuals and superannuation funds is outside the scope of this Review and falls within the scope of the Cooper Review.
Superannuation guarantee contributions are part of an employee’s remuneration but, unlike wages, they are only required to be paid once every three months. This may make it difficult for people to see that superannuation is part of their wage. In addition, many employers are not required to advise their employees that they have made a superannuation contribution on their behalf.
Superannuation guarantee contributions should be made at the same time as an employee is paid their wage. The growth of electronic commerce since the introduction of the superannuation guarantee in 1992 has made it easier for employers to make more regular contributions. However, this requirement should be phased in over time to give smaller businesses time to adjust their cash flows.
As a first step, larger business could be required to make superannuation guarantee contributions at least monthly. A business could be regarded as a large business if it is required to lodge its business activity statement on a monthly basis. This could also form part of a future extension of the standard business reporting protocols (see Section G4 Client experience of the tax and transfer system). Like other remuneration, employers should be required to advise their employees when a contribution is made.
Although people cannot access their superannuation until they retire, it should be easier for them to manage it while it accumulates. Advances in technology will assist in this process. However, electronic management of superannuation accounts will depend on the person being able to prove they are the owner of that account. The government should implement a mandatory identifier for superannuation (possibly including the existing tax file number). This would also act as proof of identity, making it easier for people to manage their superannuation, to merge multiple accounts into one account and to open new accounts. It would also assist in reducing the number of lost superannuation accounts.
Access to information is another way of improving engagement with the system. As a trusted source of information for the community, the government should establish a superannuation portal. The portal would provide a single point where people could access information from, and interact with, relevant government agencies on retirement income matters, including the Age Pension. It would also provide access to general retirement

Australia's future tax system — Report to the Treasurer
Page 130
information, such as that already available on the FIDO website administered by ASIC and the National Information Centre on Retirement Investments.
Over time, this portal could evolve to provide more specific information relating to a person’s superannuation accounts. This could allow a person to view all their accounts in one place, open and close accounts and move money between funds. These capabilities would depend on the introduction of a mandatory electronic signature or identifier to provide a link between accounts.
It would be important, however, to ensure that if a government portal is used to access private superannuation accounts, appropriate means are employed to ensure that account holders are aware that superannuation is not a government product, is not guaranteed by the government and is not otherwise endorsed by the government.
There would be adjustment issues for both employers and the superannuation industry as a result of these recommendations. These would include updating software and other administration systems. Therefore, the recommendations should be further developed in consultation with employers and the superannuation industry.
A2–5 Other retirement income issues
Superannuation funds and infrastructure Superannuation funds play a significant role in the economy as a provider of capital. Some submissions have argued that superannuation funds could play a greater role in investment in infrastructure in Australia.
The Review Panel notes that the Cooper Review will consider the issue of superannuation fund investment in infrastructure assets and whether things should be done to facilitate greater investment in this asset class. In principle, barriers (if any) that prevent superannuation funds from making suitable investments in infrastructure should be removed. The Cooper Review is the most appropriate forum to consider this.
However, specific tax concessions should not be provided to superannuation funds to encourage such investment.
Superannuation guarantee for contractors In its retirement income report, the Review Panel recommended against extending the superannuation guarantee to the self-employed due to the diverse and varying risks and circumstances of business and entrepreneurship. However, the Panel stated that it wanted to consider further the treatment of contractors within the superannuation guarantee system.
It can be very difficult to distinguish whether a contractor is engaged in an arrangement that is similar to an employer–employee relationship or on a genuine independent contractor basis. Embedding this distinction in legislation would set an arbitrary line between those inside and outside the superannuation guarantee arrangements. This would allow people to arrange their affairs to remain outside the superannuation guarantee and would result in greater complexity for genuine contractors.

A2 — Retirement incomes
Page 131
The definition of an employee also affects issues outside the superannuation guarantee system, such as tax, industrial relations and workers’ compensation schemes. It is difficult to make recommendations on the superannuation aspects of this question without understanding how they may affect these other areas.
The Taskforce on Reducing the Regulatory Burden on Business, chaired by Mr Gary Banks, recommended that the definition of ‘employee’ and ‘contractor’ in the Superannuation Guarantee (Administration) Act 1992 (SG Act) be aligned with the provisions that apply for PAYG withholding purposes (Australian Government 2006). The SG Act has a broader definition of employee. The taskforce found that the fact the two definitions were not aligned was resulting in a high level of non-compliance with the superannuation guarantee. The Board of Taxation also found that the distinction between employee and independent contractor for superannuation guarantee purposes was leading to higher compliance costs and was acting as a deterrent to employing staff (Board of Taxation 2007).
The Banks Taskforce found that most employers were well aware of their PAYG withholding obligations. For this reason it recommended aligning the SG Act definition of employee with the PAYG definition to reduce compliance costs and also help to overcome the problem of unwitting non-compliance. Aligning the definitions would also be consistent with the proposal to bring superannuation contributions within the PAYG withholding system. This would make it easier for employers to adjust to this proposal.
The Taskforce recognised that altering the superannuation guarantee definition would mean that some contractors currently covered would fall outside the system. However, it considered that the effect would be small. This impact should be considered in any decision to align the definitions.
Preservation ages for mandatory retirement occupations
Recommendation 24:
The preservation age for Service Pensioners should remain at 60 as it is already legislated to align with the eligibility age for that pension. An increase in the preservation age should apply to people who currently have a legislatively prescribed retirement age.
In the retirement income report, the Review Panel recommended that the preservation age should be increased to 67 years to align it with the Age Pension age. In making this recommendation, the Panel stated that it wished to explore other issues associated with this alignment, including the effects on people in occupations with mandatory retirement ages and on Service Pensioners.
As noted in the retirement income report, the preservation age provides an important social signal about retirement expectations. Increasing access ages for retirement benefits is also consistent with many other OECD countries. Iceland, Norway and the United States have increased the access age to 67 years, and Denmark and Germany are in the process of increasing the access age to 67 years while the United Kingdom is increasing the access age to 68 years.
While certain occupations may have mandatory retirement ages below age 67, a community-wide standard for the preservation of superannuation savings is fundamental to
Australia's future tax system — Report to the Treasurer
Page 132
preserving the link between retirement expectations and the preservation age. Also, retirement from one occupation does not necessarily mean retirement from the workforce.
Any exceptions to preservation age legislation for particular groups or occupations would be inconsistent with:
• the Review Panel’s view that retirement ages should reflect increasing life expectancies; and
• the actions of successive governments to abolish employment practices that potentially discriminate against older workers.
On this basis, there should be a consistent preservation age across all occupations. The recommended increase in the preservation age beyond 60 is not proposed to commence until 2024. This should provide sufficient time for organisations to adjust their mandatory retirement ages where appropriate.
The already legislated increase in the preservation age to 60 will align the preservation age with the eligibility age for the Service Pension. Therefore recipients of this pension should still be allowed to access their superannuation from age 60.

A2 — Retirement incomes
Page 133
Annex A2: Assumptions used in this section The Treasury uses two models, RIMHYPO and RIMGROUP, to measure the outcomes of the retirement income system. The replacement rate analysis in Section A2–2 (Chart A2–4 to Chart A2–8) has been calculated using RIMHYPO. The national saving analysis (Chart A2–9 and A2–10) has been calculated using RIMGROUP.
Replacement rate analysis
RIMHYPO produces retirement income projections for a hypothetical individual or couple, including all relevant combinations of life events, government policies and retirement income sources. It captures, in detail, the legislative structure defining the interactions between superannuation, taxation and social security legislation.
The growth assumptions used in this model reflect long-term trends.
• Inflation is 2.5 per cent per year, reflecting the mid-point of the Reserve Bank’s medium term inflation target of 2 to 3 per cent, on average, over the cycle.
• Wages grow at 1.6 per cent per year in real terms, reflecting 30 year averages.
• Superannuation fund earnings are 6.5 per cent per year, reflecting 30 year averages.
The projections presented in Section A2–2 involve a range of additional assumptions. These assumptions are designed to provide a balanced view of possible outcomes for individuals. Actual outcomes could be higher or lower depending on the specific circumstances of the individual.
The base case is for a single person, who starts work in 2010 at age 30 years, and retires in 2047. A 37-year working life is an average working life for a primary earner, including periods outside the workforce (for example, study, care or travel). The replacement for the base case scenario is shown in Chart A2–4.
The base case assumes the hypothetical individual retires in 2047 and lives for a further 22 years (a total life expectancy of 88 years). This is based on Treasury projections of age-specific probabilities of death for each year of age, calculated using the 2005–2007 life-tables and various historical life tables published by the Australian Bureau of Statistics. The projections factor in improvements in mortality factors.
The base case assumes the person does not make any additional contributions to superannuation, beyond the superannuation guarantee. The exception to this is Chart A2–8, which presents replacement rates for an employee who salary sacrifices at the average rate for people in their age and level of salary and wage remuneration (including salary sacrificed amounts as remuneration).
The base case assumes the person does not access their superannuation before Age Pension age. The exception to this is Chart A2–5, which assumes a person retires at age 60. In this alternative base case, the individual is assumed to access either Newstart Allowance or Disability Support Pension and then draw down their superannuation to achieve a 50 per cent replacement rate of their income at age 60. At age 67 they purchase a lifetime annuity with their remaining superannuation.
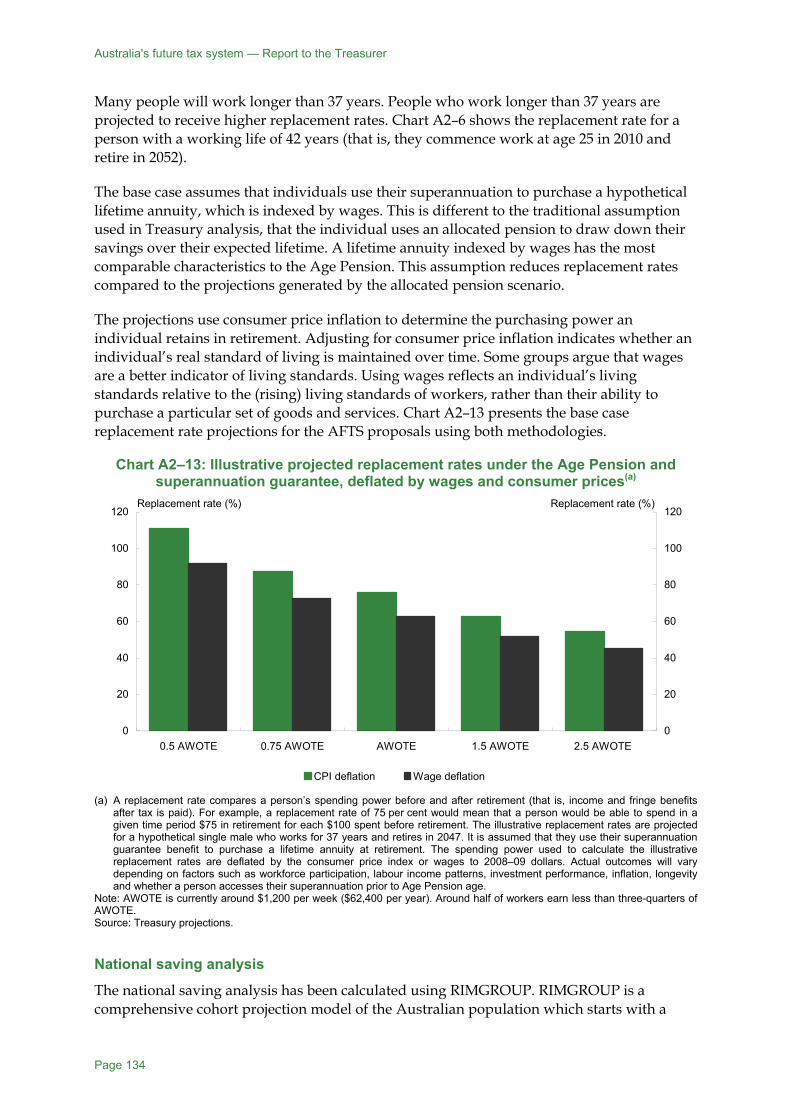
Australia's future tax system — Report to the Treasurer
Page 134
Many people will work longer than 37 years. People who work longer than 37 years are projected to receive higher replacement rates. Chart A2–6 shows the replacement rate for a person with a working life of 42 years (that is, they commence work at age 25 in 2010 and retire in 2052).
The base case assumes that individuals use their superannuation to purchase a hypothetical lifetime annuity, which is indexed by wages. This is different to the traditional assumption used in Treasury analysis, that the individual uses an allocated pension to draw down their savings over their expected lifetime. A lifetime annuity indexed by wages has the most comparable characteristics to the Age Pension. This assumption reduces replacement rates compared to the projections generated by the allocated pension scenario.
The projections use consumer price inflation to determine the purchasing power an individual retains in retirement. Adjusting for consumer price inflation indicates whether an individual’s real standard of living is maintained over time. Some groups argue that wages are a better indicator of living standards. Using wages reflects an individual’s living standards relative to the (rising) living standards of workers, rather than their ability to purchase a particular set of goods and services. Chart A2–13 presents the base case replacement rate projections for the AFTS proposals using both methodologies.
Chart A2–13: Illustrative projected replacement rates under the Age Pension and superannuation guarantee, deflated by wages and consumer prices(a)
0
20
40
60
80
100
120
0.5 AWOTE 0.75 AWOTE AWOTE 1.5 AWOTE 2.5 AWOTE 0
20
40
60
80
100
120
CPI deflation Wage deflation
Replacement rate (%) Replacement rate (%)
(a) A replacement rate compares a person’s spending power before and after retirement (that is, income and fringe benefits
after tax is paid). For example, a replacement rate of 75 per cent would mean that a person would be able to spend in a given time period $75 in retirement for each $100 spent before retirement. The illustrative replacement rates are projected for a hypothetical single male who works for 37 years and retires in 2047. It is assumed that they use their superannuation guarantee benefit to purchase a lifetime annuity at retirement. The spending power used to calculate the illustrative replacement rates are deflated by the consumer price index or wages to 2008–09 dollars. Actual outcomes will vary depending on factors such as workforce participation, labour income patterns, investment performance, inflation, longevity and whether a person accesses their superannuation prior to Age Pension age.
Note: AWOTE is currently around $1,200 per week ($62,400 per year). Around half of workers earn less than three-quarters of AWOTE. Source: Treasury projections.
National saving analysis
The national saving analysis has been calculated using RIMGROUP. RIMGROUP is a comprehensive cohort projection model of the Australian population which starts with a

A2 — Retirement incomes
Page 135
population and labour force model, tracks the accumulation of superannuation in a specified set of account types, estimates non-superannuation saving and calculates tax payment and expenditures, social security payments including pensions and the generation of other retirement incomes. The projections are done for each year of the projection period separately for each birth year gender decile cohort.
The key assumptions in the analysis underlying Charts A2–9 and A2–10 are:
• Increases in compulsory saving are offset by a reduction of 30 per cent in other saving. This applies to the increase in contributions resulting from the removal of contributions tax as recommended in this Report and the increase to the superannuation guarantee rate to 12 per cent.
• Increases in saving resulting from halving the earnings tax rate are offset by a reduction of 5 per cent in other saving.
• In analysing the effects of a potential increase in the superannuation guarantee rate to 12 per cent, total remuneration has been kept constant in the base and new policy runs. The increase in superannuation guarantee contributions has been directly offset by a decrease in the growth of gross cash wages.


Page 137
A3. Wealth transfer taxes
Key points
A bequest tax would be a relatively efficient means of taxing savings. Decisions to save taken solely to fund consumption later in life would be unaffected. But decisions to save motivated by the desire to leave a bequest would be affected and this would impose some efficiency costs. In aggregate, though, bequest taxes are not likely to introduce large biases into donor behaviour. A bequest tax could increase labour supply and savings by recipients and prospective recipients, though the effects would be limited.
Such a tax could also be a progressive element of the tax and transfer system. Because the distribution of wealth in Australia is so uneven, most of the revenue available from a bequest tax could be raised from the top 10 per cent of households by wealth.
A tax on bequests would fit well with Australia’s demographic circumstances over the coming decades. Over the next 20 years, the proportion of all household wealth held by older Australians is projected to increase substantially. Large asset accumulations will be passed on to a relatively small number of recipients. On the other hand, a bequest tax would be complex. There would be a need for anti-avoidance provisions, including a tax on gifts. There would, inevitably, be significant administration and compliance costs.
A tax on bequests should not be levied at very high rates. People should not be unduly deterred from saving to leave bequests. A substantial tax-free threshold combined with a low flat rate beyond that point would be an appropriate structure for a bequest tax. Bequests to spouses should be concessionally treated.
Another design issue is whether to tax the whole of the donor’s estate or the inheritances received by individual recipients. There are arguments on either side, but on balance, they probably favour taxing each estate as a whole. A large number of other design issues would need to be considered. The more concessions and exemptions in the bequest tax, the greater its complexity and the greater the risk to efficiency and equity goals.
The Review has not sought to recommend the introduction of a bequest tax at this time, but believes that there should be full community discussion and consultation on the options.
A3–1 How a tax on bequests measures up A central question for any tax system is whether, and how, to tax savings. The Review sees a role for the taxation of savings in Australia’s future tax system but one that is more neutral between different forms of saving and that imposes smaller efficiency costs than the existing system (see Section A1–3). One element of the future taxation of savings could be a bequest tax; that is, a tax on the assets a person leaves behind at their death.

Australia's future tax system — Report to the Treasurer
Page 138
A bequest tax levied at a low flat rate, and designed to affect only large bequests, could be an efficient and equitable component of Australia’s future tax system.14
Efficiency Most taxes introduce biases into economic decisions and thus impose efficiency costs on society overall. But a tax on bequests would impose lower efficiency costs than many other means of taxing savings. The motives for leaving bequests have important impacts on the biases that the tax would bring to savings behaviour and, consequently, on the efficiency costs of the tax.
Principle
The tax system should aim to raise revenue with low efficiency costs — while also taking into account issues of equity, simplicity, sustainability and consistency with other policy objectives. Consideration should be given to any tax that would raise revenue with low efficiency costs and no large adverse effects on other tax policy considerations.
While altruism towards recipients, predominantly children, is an important motivation for leaving bequests, there are two other important scenarios.
First, many bequests are unplanned. The length of a person’s life is uncertain and in many cases a donor saves not to leave a bequest but solely to ensure their own financial security. If they live for as long as they expect to, they consume their savings and pay tax as they do so. If they die early, however, a substantial amount of savings may remain. These savings are usually bequeathed to someone, but bequeathing the assets is not the purpose for which they were acquired. In this sense, the bequest is unplanned.
Second, some bequests may be a form of compensation for services provided by a recipient to the donor. For example, an elderly donor may leave a bequest to a neighbour who has devoted time and effort to caring for them.
How taxing bequests would affect donors
An important consideration in designing a tax on savings is to limit the extent to which the tax encourages people to consume now rather than save and have their savings taxed in future (see Section A1–3). Taxing savings at the time of death largely avoids such biases, as a person has at that point finished saving in order to consume later in life. Taxing bequests would, however, have some impact on donor saving decisions — and, therefore, some efficiency costs — depending on the donor’s motive for accumulating wealth.
• Saving undertaken solely to ensure the donor’s financial security would not be affected by a bequest tax because it is motivated by the donor’s concern for their own wellbeing, not the desire to leave a bequest.
14 This report uses ‘bequest tax’ as a generic term applying to any tax levied on assets at death. An ‘estate tax’ is levied on the whole of the donor’s estate. An ‘inheritance tax’ is levied on the inheritances received by individual recipients. An ‘accessions tax’ applies on a cumulative basis to the gifts or inheritances received by an individual throughout their life. ‘Donor’ is used for the person who leaves a bequest or makes a gift and ‘recipient’ for the person who receives a gift or bequest.

A3 — Wealth transfer taxes
Page 139
• Economic theory suggests that the impact of a bequest tax on saving for altruistic motives is uncertain. The tax means that the donor must forgo more consumption to deliver the same after-tax benefit to the recipient. This discourages saving. However, it also means that the range of consumption and bequest options open to the donor has been diminished. Whether this will induce the donor to save less or more will depend on their individual preferences. If the donor is determined to leave a post-tax bequest of a certain size, the tax may encourage them to save more. If they are more concerned about their current consumption, they may save less.
• For the same reasons, the net impact of a bequest tax on the saving of donors who are seeking to compensate recipients for services rendered is not clear in theory.
Many donors are likely to be moved by a combination of these motives, so that estimating the impact of a bequest tax is essentially an empirical matter. There is no doubt that the bequest motive has some impact on savings decisions. Life insurance choices and patterns of giving before death show that altruism has some effect on donor choices. On the other hand, there is a considerable body of evidence that precautionary savings, which result in unplanned bequests, account for a significant proportion of savings (Parker & Preston 2005). As purely precautionary savings would be unaffected by a bequest tax, it is unlikely that taxing bequests would greatly affect donor savings (Gale & Perozak 2001).
This suggests that a bequest tax would be more efficient than some other means of taxing savings — particularly taxation of the returns to saving as they accrue (see Section A1–3).
Recipients would work and save more
Because they do not receive, or do not expect, such a large post-tax inheritance, recipients and prospective recipients tend to work more and save more in the presence of a bequest tax. Evidence from the US suggests that receipt (or expected receipt) of an inheritance reduces labour supply, although the impact is not great (Holz-Eakin et al. 1993). Consequently, the improvement to labour supply that would arise from reducing post-tax bequests through a bequest tax, while positive, is likely to be small.
Double taxation is not good or bad in itself
Bequest taxes are sometimes opposed on the grounds that they involve double taxation: much of the income saved to build up the bequeathed assets has been taxed at the time it accrued to the donor. ‘Double taxation’ is not good or bad in itself. Any system that taxes economic flows at more than one point will involve an element of double taxation. For example, the current system taxes an individual’s labour income as it accrues and taxes the part that is consumed a second time, through the GST. There is no reason to try to avoid such double taxation by adopting a system with a single tax. A system that raised all its revenue from a single household income tax would impose very large costs on taxpayers despite the absence of double taxation. The important thing is to design and implement a system that raises enough revenue while limiting the costs of doing so.
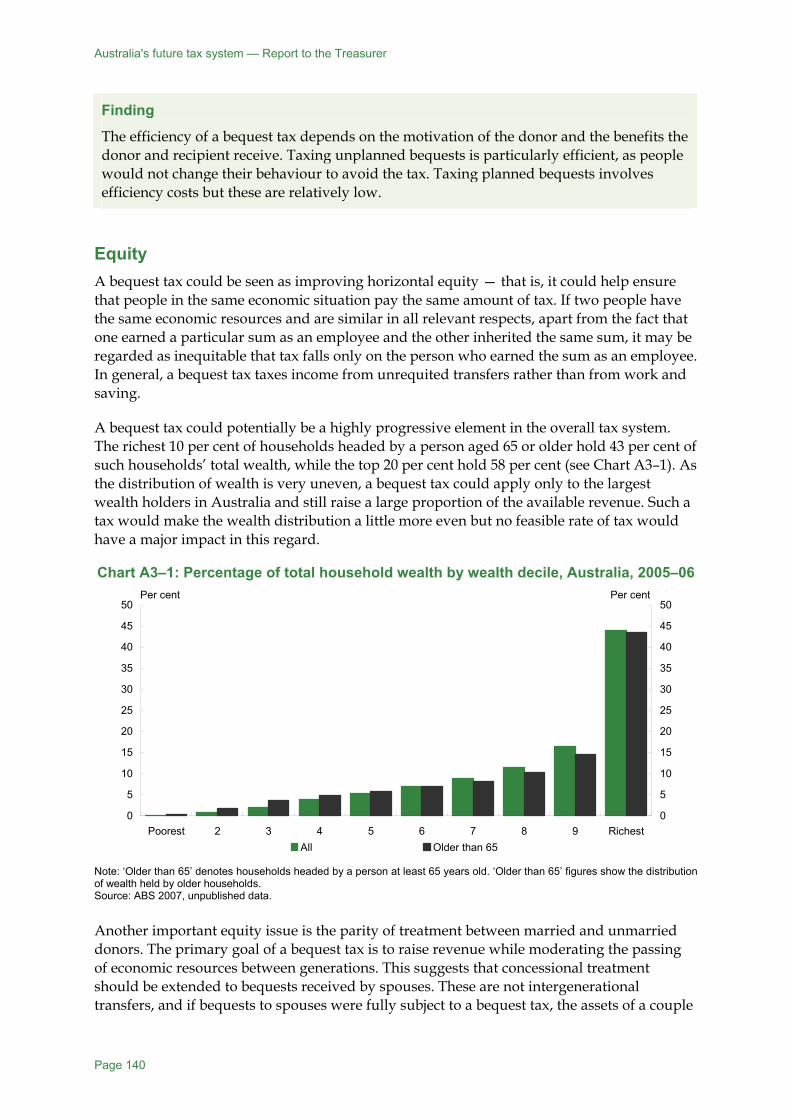
Australia's future tax system — Report to the Treasurer
Page 140
Finding
The efficiency of a bequest tax depends on the motivation of the donor and the benefits the donor and recipient receive. Taxing unplanned bequests is particularly efficient, as people would not change their behaviour to avoid the tax. Taxing planned bequests involves efficiency costs but these are relatively low.
Equity A bequest tax could be seen as improving horizontal equity — that is, it could help ensure that people in the same economic situation pay the same amount of tax. If two people have the same economic resources and are similar in all relevant respects, apart from the fact that one earned a particular sum as an employee and the other inherited the same sum, it may be regarded as inequitable that tax falls only on the person who earned the sum as an employee. In general, a bequest tax taxes income from unrequited transfers rather than from work and saving.
A bequest tax could potentially be a highly progressive element in the overall tax system. The richest 10 per cent of households headed by a person aged 65 or older hold 43 per cent of such households’ total wealth, while the top 20 per cent hold 58 per cent (see Chart A3–1). As the distribution of wealth is very uneven, a bequest tax could apply only to the largest wealth holders in Australia and still raise a large proportion of the available revenue. Such a tax would make the wealth distribution a little more even but no feasible rate of tax would have a major impact in this regard.
Chart A3–1: Percentage of total household wealth by wealth decile, Australia, 2005–06
0
5
10
15
20
25
30
35
40
45
50
Poorest 2 3 4 5 6 7 8 9 Richest0
5
10
15
20
25
30
35
40
45
50
All Older than 65
Per cent Per cent
Note: ‘Older than 65’ denotes households headed by a person at least 65 years old. ‘Older than 65’ figures show the distribution of wealth held by older households. Source: ABS 2007, unpublished data. Another important equity issue is the parity of treatment between married and unmarried donors. The primary goal of a bequest tax is to raise revenue while moderating the passing of economic resources between generations. This suggests that concessional treatment should be extended to bequests received by spouses. These are not intergenerational transfers, and if bequests to spouses were fully subject to a bequest tax, the assets of a couple

A3 — Wealth transfer taxes
Page 141
would usually be taxed twice before reaching the next generation, while the assets of a single person would not.
Principle
Overall, a well-designed bequest tax would improve equity as it would help to distribute opportunities more evenly across the community.
Simplicity A core theme for the Review has been to reduce complexity in the tax and transfer system. The introduction of a new tax on savings would inevitably involve some new complexity, and present at least some tax-planning opportunities for taxpayers approaching the end of their lives. Tax planning need not be illegal nor immoral, and in many cases it constitutes rational behaviour on the part of the taxpayer. But it contributes nothing to the wellbeing of Australians overall. Rather than creating value, it is entirely concerned with how much value should be transferred from the taxpayer to the government.
Any estate, inheritance or accessions tax would need to be accompanied by a means of taxing gifts, as an anti-avoidance measure. Otherwise, many donors would be able to avoid the tax by transferring their assets to the intended recipients shortly before the time of death. Other anti-avoidance provisions would also be necessary, although these may not need to differ greatly from existing provisions in other areas of the tax law.
US experience with its estate tax suggests that the best available tax planning is able to remove around one-third of a medium-size estate from the estate tax net (Schmalbeck 2001). Many of the expedients that minimise tax are undesirable to donors on other grounds; for example, they may oblige the donor to relinquish control of their assets many years before their death. Leakage from the US estate tax base is significant but falls well short of wholesale avoidance.
It is important to remember that the Review is proposing consideration of a bequest tax that falls only on the largest estates or inheritances. The large majority of estates or inheritances would not be subject to tax. Nevertheless, it is clear that the introduction of a tax on bequests would involve provisions of significant complexity. The tax base would need to be defined, avoidance countered and rates specified. This complexity and its attendant costs must be weighed against the efficiency of the tax in raising revenue and the contribution it could make to the redistributive goals of the tax and transfer system, its sustainability and its policy coherence.
Finding
The introduction of a new tax on bequests would involve some new complexity, and present some tax planning opportunities for taxpayers approaching the end of their lives. This additional complexity must be weighed against the efficiency and equity arguments in favour of taxing bequests.
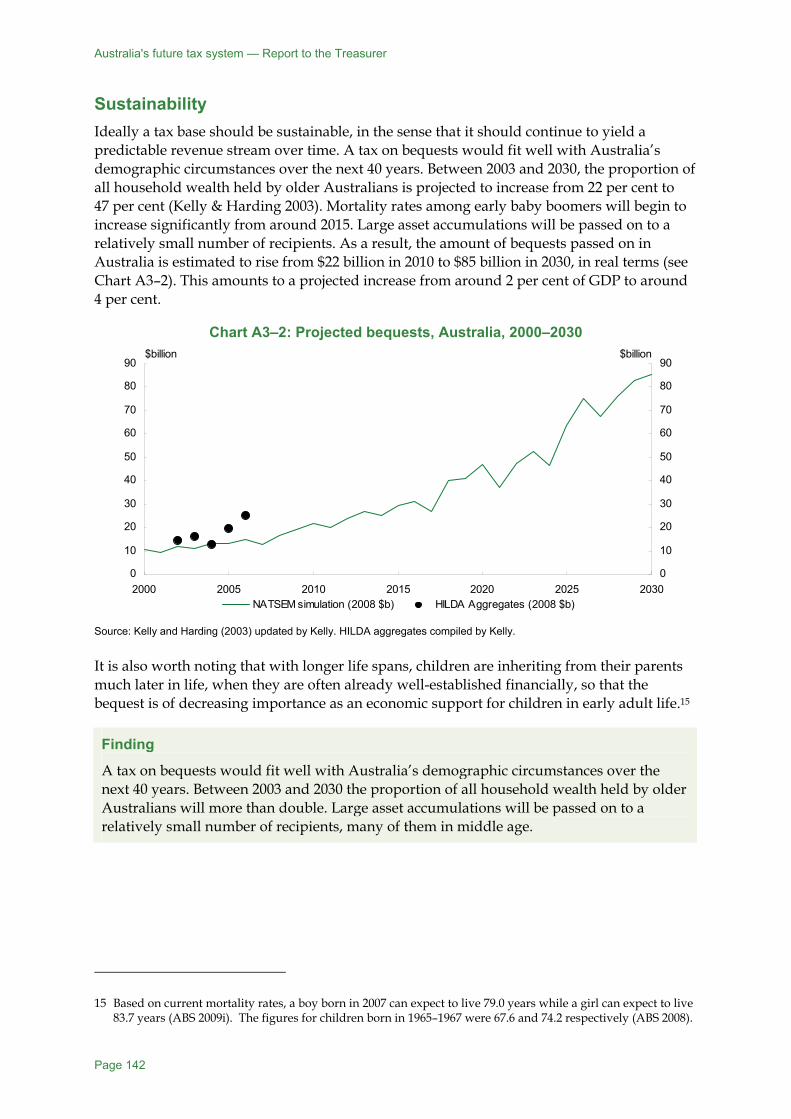
Australia's future tax system — Report to the Treasurer
Page 142
Sustainability Ideally a tax base should be sustainable, in the sense that it should continue to yield a predictable revenue stream over time. A tax on bequests would fit well with Australia’s demographic circumstances over the next 40 years. Between 2003 and 2030, the proportion of all household wealth held by older Australians is projected to increase from 22 per cent to 47 per cent (Kelly & Harding 2003). Mortality rates among early baby boomers will begin to increase significantly from around 2015. Large asset accumulations will be passed on to a relatively small number of recipients. As a result, the amount of bequests passed on in Australia is estimated to rise from $22 billion in 2010 to $85 billion in 2030, in real terms (see Chart A3–2). This amounts to a projected increase from around 2 per cent of GDP to around 4 per cent.
Chart A3–2: Projected bequests, Australia, 2000–2030
0
10
20
30
40
50
60
70
80
90
2000 2005 2010 2015 2020 2025 20300
10
20
30
40
50
60
70
80
90
NATSEM simulation (2008 $b) HILDA Aggregates (2008 $b)
$billion $billion
Source: Kelly and Harding (2003) updated by Kelly. HILDA aggregates compiled by Kelly. It is also worth noting that with longer life spans, children are inheriting from their parents much later in life, when they are often already well-established financially, so that the bequest is of decreasing importance as an economic support for children in early adult life.15
Finding
A tax on bequests would fit well with Australia’s demographic circumstances over the next 40 years. Between 2003 and 2030 the proportion of all household wealth held by older Australians will more than double. Large asset accumulations will be passed on to a relatively small number of recipients, many of them in middle age.
15 Based on current mortality rates, a boy born in 2007 can expect to live 79.0 years while a girl can expect to live 83.7 years (ABS 2009i). The figures for children born in 1965–1967 were 67.6 and 74.2 respectively (ABS 2008).

A3 — Wealth transfer taxes
Page 143
A3–2 The current system has some impact on bequests All States and the Australian government imposed death duties until the late 1970s. At that point, they began to be phased out. Avoidance had not been tackled systematically and thresholds had not been adjusted, so that moderate-size estates became liable for the taxes, which became very unpopular. State bequest taxes also suffered from competition between the States, with most duties abolished in the ten years after Queensland abolished its duties in 1977.
Internationally, many OECD countries impose wealth transfer taxes — mostly taxes on estates or inheritances — though in no country are these taxes a major source of revenue. On average, OECD countries raise 0. 41 per cent of total tax revenue from such taxes (see Chart A3–3). If this percentage were replicated in Australia, wealth transfer taxes would have raised about $1.4 billion in 2007–08.
Chart A3–3: Estate, inheritance and gift taxes, OECD, 2007 Per cent of total tax revenue
-0.2
0.0
0.2
0.4
0.6
0.8
1.0
1.2
1.4
1.6
Slo
vak
Rep
ublic
Aus
tralia
Can
ada
Mex
ico
Sw
eden
New
Zea
land
Por
tuga
lIta
lyC
zech
Rep
ublic
Turk
eyP
olan
dH
unga
ryA
ustri
aN
orw
ayIc
elan
dLu
xem
bour
gG
reec
eD
enm
ark
Ger
man
yS
witz
erla
ndFi
nlan
dIre
land
Spa
inU
nite
d K
ingd
omU
nite
d S
tate
sN
ethe
rland
sJa
pan
Fran
ceK
orea
Bel
gium -0.2
0.0
0.2
0.4
0.6
0.8
1.0
1.2
1.4
1.6Per cent Per cent
Unweighted average
Source: OECD (2009). In Australia today, no taxes are charged on transfers of wealth by bequest or gift. However, some parts of the tax and transfer system impact on bequests for other policy purposes.
Superannuation benefits paid to a non-dependant are subject to a tax of 15 per cent (see Section A2–2).
Means testing of residential aged care assistance effectively operates as a tax on some estates (see Section F7 Funding aged care). For example, on average 26 per cent of the cost of high-level residential aged care services is met from fees to care recipients (DoHA 2008). By law, the size of these contributions varies with the user’s income and assets, yet the service standard a user enjoys does not vary with their contributions. Where contributions are made from private savings, the imposition of means testing effectively reduces the value of their estate.

Australia's future tax system — Report to the Treasurer
Page 144
If an asset subject to capital gains tax (CGT) is transferred by bequest, CGT on the gain that has accrued in the hands of the donor is not payable at the time of transfer, but if the recipient later disposes of the asset, CGT is generally payable on the whole of the gain from the time of acquisition by the donor to the time of disposal. This is not a tax on bequests but the realisation of tax on income accrued in the person’s lifetime.
A3–3 Parameters for a possible tax on bequests
Recommendation 25:
While no recommendation is made on the possible introduction of a tax on bequests, the Government should promote further study and community discussion of the options.
A large number of design choices would need to be made if a bequest tax were adopted. This Report does not make recommendations on these issues — further work is needed before a fully articulated proposal could be considered. It is, however, possible to suggest parameters for the most important design features.
A tax on the whole estate or on individual inheritances? A tax on bequests may be an estate tax, an inheritance tax or an accessions tax.
An estate tax applies to the whole of an individual’s estate, regardless of how many recipients there are. It could be designed to favour bequests to spouses or to other categories of recipient: bequests to such recipients could be concessionally valued or could receive a flat percentage discount. It would be relatively easy to apply, as the whole of the estate would be taxed as one unit.
An inheritance tax applies separately to each inheritance received by an individual. If a progressive rate scale were adopted for either an estate or an inheritance tax, the adoption of an inheritance tax would provide more incentive for donors to split their estates between recipients to reduce the total tax payable on the estate. To collect the same revenue from the same base of bequeathed assets, the rates for an inheritance tax would need to be higher than the rates for an estate tax. An inheritance tax accords better with an income tax system, as it taxes the bequest in the hands of the recipient rather than in the estate of the donor. An inheritance tax may be more horizontally equitable than an estate tax, in the sense that two people who receive the same amount of inheritance will generally pay the same amount of tax, regardless of the size of the estate from which the inheritance comes.
An accession tax taxes all gifts and inheritances received by a particular person on a cumulative basis. It takes account of the fact that some recipients receive a number of substantial inheritances over the course of their lives, though at the cost of some complexity. In particular, it requires the tax authorities to maintain a record of gifts and inheritances received over the course of a person’s lifetime. It could also involve adjusting past receipts for inflation. Among OECD countries, only Ireland has implemented an accessions tax.
While there are arguments on both sides, an estate tax may be the best model for Australia. It avoids the lifetime complexity of an accessions tax and is simpler to administer than an inheritance tax. It accords with a tax system structure under which income savings are
A3 — Wealth transfer taxes
Page 145
subject to relatively uniform low rates of tax and it removes incentives for donors to split up their estates to minimise the tax payable.
The breadth of the base A bequest tax would be simpler to administer and more economically efficient if it had a broad base, with no exemptions or concessions for particular asset types. Concessions for particular asset types would greatly complicate the design of the tax and would open up avenues for tax planning and avoidance. A comprehensive base would include all financial and non-financial assets, including owner-occupied housing, offset by outstanding liabilities. If a person’s net assets were less than the threshold, no tax would be payable.
Setting sensible rates A tax on bequests could have its own rate scale, which is the approach taken in most OECD countries, or some portion of the inheritance could be included in the recipient’s income for income tax purposes. The Review recommends moving away from a comprehensive nominal income benchmark towards a system where capital income is taxed at relatively uniform rates lower than the rates applying to labour income. It would not, therefore, be consistent to include inheritances in the recipient’s other personal income. Instead, a separate rate scale would be appropriate.
It would not be appropriate to specify a rate scale for an estate tax at this time: more analysis would be necessary before that could be done. Nevertheless, some parameters are clear. Given the very uneven distribution of wealth among Australian households, a tax that fell only on large estates would raise much of the revenue available. It would, therefore, be appropriate to set a substantial tax-free threshold, so that the large majority of estates would not be affected. The threshold should be indexed to wages to preserve its value in terms of community standards.
The tax could also be aligned with means testing for income support payments so that the holder of a high-value estate, assessed on a household basis, would not be eligible for means tested income support or family payments. Importantly, the tax base would include the value of owner-occupied housing.
Beyond the threshold, a fairly low flat rate would be desirable. A bequest tax should not be designed to prevent the transfer of wealth between generations, but as an efficient and equitable means of generating a relatively small proportion of total tax revenue. Too high a rate would run the risk of inducing large changes in donors’ saving decisions and would encourage more aggressive tax avoidance.
Australia's future tax system — Report to the Treasurer
Page 146
Other design issues Any option for taxing bequests and gifts would require consideration of:
• the cash flow implications for estates held predominantly in the form of illiquid assets;
• the treatment of bequests to charities, which are concessionally taxed in many countries;
• how the tax would interact with capital gains tax;
• how the tax would interact with the taxation of superannuation benefits on death;
• the treatment of non-resident donors and property located outside Australia; and
• the design of a gift tax to accompany the bequest tax. This would raise a number of difficult questions about what range of gifts from parents to children — which may take the form of Higher Education Loan Programme payments or contributions to student living expenses — would be included.