A Performance Evaluation of Two Overhead Power Line
45
IC 9510 INFORMATION CIRCULAR/2008 A Performance Evaluation of Two Overhead Power Line Proximity Warning Devices Department of Health and Human Services Centers for Disease Control and Prevention National Institute for Occupational Safety and Health
Transcript of A Performance Evaluation of Two Overhead Power Line

IC 9510 INFORMATION CIRCULAR2008
A Performance Evaluation of Two Overhead Power Line Proximity Warning Devices
Department of Health and Human Services Centers for Disease Control and Prevention National Institute for Occupational Safety and Health
Information Circular 9510 A Performance Evaluation of Two Overhead Power Line Proximity Warning Devices By Gerald T Homce PE James C Cawley PE and Michael R Yenchek PE
DEPARTMENT OF HEALTH AND HUMAN SERVICES Centers for Disease Control and Prevention
National Institute for Occupational Safety and Health Pittsburgh Research Laboratory
Pittsburgh PA
November 2008
This document is in the public domain and may be freely copied or reprinted
Disclaimer Mention of any company or product does not constitute endorsement by the National Institute for Occupational Safety and Health (NIOSH) In addition citations to Web sites external to NIOSH do not constitute NIOSH endorsement of the sponsoring organizations or their programs or products Furthermore NIOSH is not responsible for the content of these Web sites All Web addresses referenced in this document were accessible as of the publication date
Ordering Information To receive documents or other information about occupational safety and health topics contact NIOSH at
Telephone 1ndash800ndashCDCndashINFO (1ndash800ndash232ndash4636) TTY 1ndash888ndash232ndash6348 e-mail cdcinfocdcgov
or visit the NIOSH Web site at wwwcdcgovniosh
For a monthly update on news at NIOSH subscribe to NIOSH eNews by visiting wwwcdcgovniosheNews
DHHS (NIOSH) Publication No 2009ndash110
November 2008
SAFER bull HEALTHIER bull PEOPLEtrade
CONTENTS
Page Executive summary1 Introduction2 Background3
Detection of energized overhead power lines3 Proximity warning device descriptions3
SIGALARM model 2103 Allied Safety Engineering model 21005 Proximity warning device performance objective 6 Test program 7 Installation of power line proximity warning devices on the test crane 7 Test facility 8 Overhead power line test site8 Electrical power supply for tests9 Data collection process 10 Test procedures 11 Crane boom position data analysis 13 Test plan13 Results14 Test set 1 14 Test set 2 16 Test set 3 17 Test set 4 19 Test set 5 21 Test set 6 23 Test set 7 25 Test set 8 27 Test set 9 28 Test set 10 28 Summary of proximity warning device performance 29 Power line configurations 29 Crane boom configurations32 Other factors34 Use of a PWD as an early warning device34 Effect of connecting the crane chassis to a grounded power system neutral34 Effect of multiple independent power line circuits34 Effect of power line phase sequence34 Sensitivity adjustments 35 Recommendations for future research 36 References36 Appendix AmdashList of cooperators37
CONTENTSmdashContinued
ILLUSTRATIONS Page
1 SIGALARM model 210 control unit 4 2 ASE model 2100 remote and operator panels5 3 Minimum safe working distances around overhead electrical power lines 6 4 PWD probes on crane boom 8 5 Diagram of the test-site power system9 6 Example of a computer model used for analyzing crane boom position relative to over-
head power lines 10 7 Crane locations for tests involving operation from a stationary position 11 8 Grove RT522 crane on outriggers positioned adjacent to overhead power lines with
boom at 50 extension and boom tip approximately level with lower set of lines 12 9 Test set 1 layout and overhead power line configuration 15
10 Test set 2 layout and overhead power line configuration 16 11 Test set 3 layout and overhead power line configuration 18 12 Test set 4 layout and overhead power line configuration 19 13 Test set 5 layout and overhead power line configuration 21 14 Test set 6 layout and overhead power line configuration 23 15 Test set 7 layout and overhead power line configuration 25 16 Test set 8 layout and overhead power line configuration 27 17 Test set 9 layout and overhead power line configuration 28
TABLES 1 Power line configuration detail for test sets 1 through 7 13 2 Alarm distance results for test set 1 15 3 Alarm distance results for test set 2 17 4 Alarm distance results for test set 3 18 5 Alarm distance results for test set 4 20 6 Alarm distance results for test set 5 22 7 Alarm distance results for test set 6 24 8 Alarm distance results for test set 7 26 9 Summary of PWD alarm performance based on power line configuration30
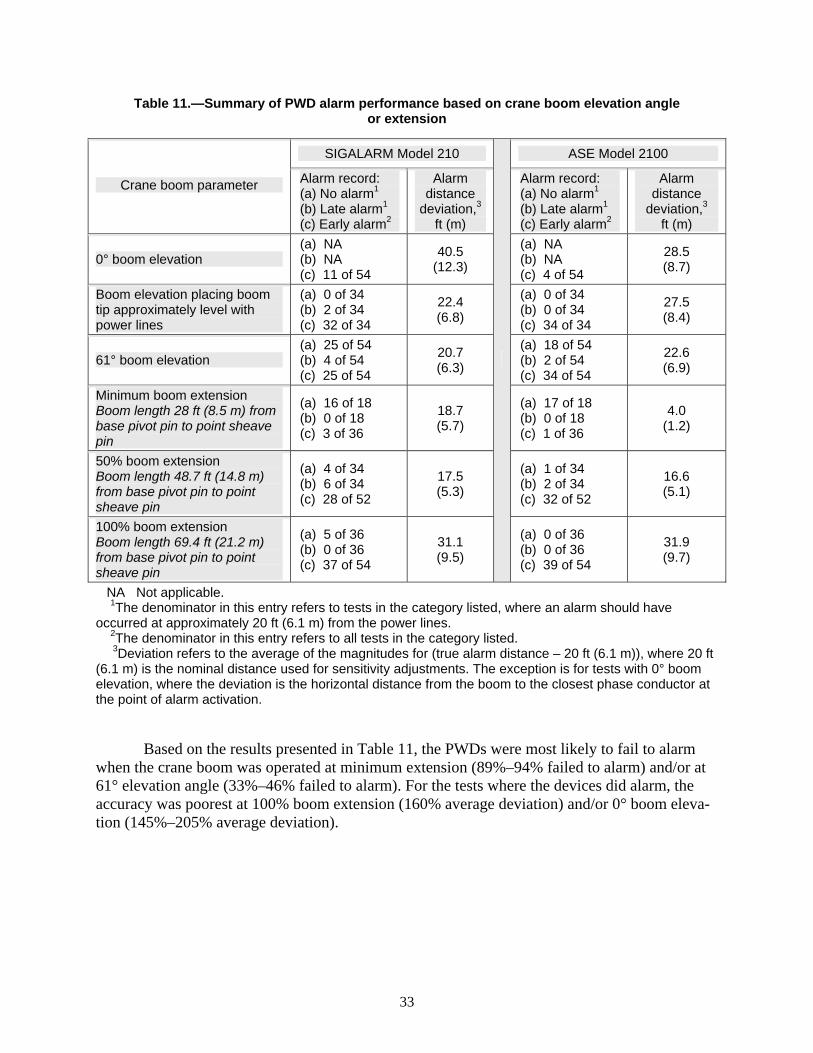
10 Summary of PWD alarm performance based on power line configuration when analysis is limited only to tests where the boom extension was at 50 and the boom elevation was such that the tip was approximately at power line level31 11 Summary of PWD alarm performance based on crane boom elevation angle or extension 33 12 Summary of PWD alarm performance changes due to reversal of power line phase sequence 35
ACRONYMS AND ABBREVIATIONS USED IN THIS REPORT
3-D three-dimensional ACSR aluminum conductor steel-reinforced ANSI American National Standards Institute ASME American Society of Mechanical Engineers AWG American wire gauge CFR Code of Federal Regulations LCD liquid crystal display NIOSH National Institute for Occupational Safety and Health OSHA Occupational Safety and Health Administration PRL Pittsburgh Research Laboratory (NIOSH) PWD proximity warning device
UNIT OF MEASURE ABBREVIATIONS USED IN THIS REPORT
cm centimeter ft foot ha hectare Hz hertz in inch kV kilovolt kVA kilovolt-ampere m meter min minute mt metric ton st short ton V volt W watt Ω ohm
A PERFORMANCE EVALUATION OF TWO OVERHEAD POWER LINE PROXIMITY WARNING DEVICES
By Gerald T Homce PE1 James C Cawley PE2 and Michael R Yenchek PE3
1Lead Research Engineer Electrical 2Senior Research Engineer Electrical (retired) 3Lead Research Engineer Electrical Pittsburgh Research Laboratory National Institute for Occupational Safety and Health Pittsburgh PA
EXECUTIVE SUMMARY
Accidental contact of overhead electrical power lines by mobile equipment is a leading cause of occupational fatalities in the United States accounting for 20 of on-the-job electroshycutions Overhead electrical power line proximity warning devices (PWDs) are intended to warn personnel if mobile equipment moves within some preselected minimum distance of an enershygized overhead electrical power line Two commercially available PWDs were tested at the National Institute for Occupational Safety and Healthrsquos (NIOSH) Pittsburgh Research Laborashytory (PRL) The objective of the tests was to document performance capabilities and limitations for these PWDs by identifying factors that can influence their operation
The two PWDs evaluated in this research are the SIGALARM Model 210 marketed by Allied Safety Systems LLC and the ASE Model 2100 from Allied Safety Engineering Both of these devices operate by measuring the electric field present around energized power lines The PWDs were installed on a government-owned 22-st (20-mt) rough terrain crane A purpose-built test site used for this research at PRL allowed operation of the crane near a variety of power line configurations operating at up to 25 kV Most of the tests involved positioning the crane adjacent to one or more overhead power lines adjusting sensitivities of the PWDs to alarm when the crane boom was approximately 20 ft (61 m) from the power lines swinging the crane boom toward the lines under a wide variety of test conditions and finally for each unique set of test conditions documenting the deviation from 20 ft (61 m) for actual alarm activation
Test results show that several factors can adversely affect PWD performance PWD alarm accuracy generally deteriorated when operating with a boom position significantly differshyent than that used for the devicersquos last sensitivity adjustment Another factor that can affect PWD performance is configuration of the overhead power line(s) involved Accuracy of alarm activashytion distances was best for simple single-circuit installations but degraded for multiple circuits on the same poles This degradation was slightly greater for installations with different voltage levels andor a combination of vertical and horizontal conductor arrangements Performance also degraded for crane operation between two intersecting power line installations especially for intersecting lines at different voltages An additional aspect of power line configuration shown to influence PWD accuracy was phase sequence on the power line circuit(s) Specific phase conshyductor arrangements and combinations particularly in multiple circuit installations resulted in either improved or degraded accuracy
Tests were also conducted to evaluate the PWDs as ldquoearly warning devicesrdquo for situ- ations such as moving a mobile crane into an unfamiliar work area Results showed that the SIGALARM Model 210 could detect energized 13-kV power lines at a distance of 75ndash88 ft (229ndash268 m) This alarm distance would allow an operator to take preventive measures before the crane is in a position from which it could contact nearby power lines
INTRODUCTION
Many of the electrical fatalities in construction mining and other industries are due to personnel accidentally contacting overhead electrical power lines with high-reaching equipment such as mobile cranes During a recent 10-year period approximately 20 of occupational electrocutions involved contact between mobile equipment and overhead power lines [Cawley and Homce 2003] In a typical power line contact accident the frame of the equipment (and possibly a suspended load in the case of mobile cranes) is energized to a high voltage relative to the surrounding ground surface Anyone touching the frame and ground simultaneously is exposed to this high voltage and can become a path for lethal levels of electrical current
Overhead electrical power line PWDs are mobile equipment-mounted safety devices intended to alert personnel if the equipment is operating too close to an energized overhead elecshytrical power line Such devices have been commercially available for more than 30 years but have not found widespread acceptance in many industries due in part to a lack of regulatory requirements for their use The Occupational Safety and Health Administration (OSHA) is currently involved in updating the standards for cranes and derricks (29 CFR4 1926550) Part of the proposed revision addresses overhead power line safety for mobile cranes and includes explicit reference to PWDs as one of several acceptable measures for protecting workers from accidental power line contacts With this proposal to accept PWDs as one means to maintain a safe distance between cranes and power lines (as specified in 29 CFR) NIOSH researchers conshycluded that an objective performance evaluation of PWDs would be valuable and timely
A performance evaluation of two commercially available overhead power line PWDs was conducted at NIOSHndashPRL The objective of the tests was to document performance capabilities and limitations for these PWDs by identifying factors that can influence their operation The overall approach for this testing called for the two PWD companies to install their devices on a government-owned 22-st (20-mt) rough terrain crane and specify procedures for their use The crane was to be operated using a wide range of boom positions near several different configurashytions of energized overhead power lines with the performance of the PWDs documented This full-scale testing took place at a purpose-built overhead power line test site at PRL PRL engishyneers coordinated and directed this research but input for developing the test protocol was solicited from a number of cooperators including the two PWD manufacturers participating in the study an equipment manufacturing trade association representative labor union representashytives OSHA a large private construction and crane rental firm with experience using PWDs and an electrical engineering consulting firm working as a NIOSH contractor A list of these particishypants can be found in Appendix A
4Code of Federal Regulations See CFR in references
2
BACKGROUND
Detection of Energized Overhead Power Lines
Energized power lines radiate both magnetic and electric fields Therefore the presence of energized power lines may be detected by measuring either the magnetic field or the electric field surrounding them The magnetic field strength at any point around power lines is in part a function of the electrical current being carried by the lines Since power line current can vary significantly magnetic field measurement cannot reliably be used to determine distance to power lines In contrast the electric field surrounding power lines is primarily a function of the voltage at which they operate and their configuration5 Therefore the key parameters that determine electric field strength at any given position near a set of conductors are fixed for a given power line installation making electric field measurement more suitable for estimating the distance to energized power lines [Hipp et al 1980]
5For a specific point in space near overhead power lines the electric field will vary depending on factors such as vertical versus horizontal phase conductor arrangement conductor spacing the presence of multiple power line circuits and the presence of a neutral conductor
Proximity Warning Device Descriptions
Two commercially available PWDs were evaluated in this study Each is designed to warn of proximity to power lines by detecting the electric field present around the phase conducshytors In general each device consists of a probe a control unit and an audible alarm The probes were deployed along the length of the boom and the control unit was installed in the crane cab accessible to the operator The control unit for each device includes a sensitivity adjustment and a user interface for alarm and PWD status information Each device measures the 60-Hz signal derived from the probe exposed to the power line electric field The resulting signal level is comshypared to the alarm threshold preselected by the operator if it is exceeded audible and visible alarms are activated If the field measurement level falls below the threshold level the alarm ceases The general procedure for adjusting the alarm threshold or ldquosensitivityrdquo of each device is to position the crane boom at the desired minimum working distance from the power lines and adjust the device to establish an alarm threshold at that boom position The two PWDs are described in more detail below
SIGALARM Model 210
The SIGALARM Model 210 marketed by Allied Safety Systems LLC is a power line PWD designed for use on telescoping boom (hydraulic) cranes [Allied Safety Systems LLC 2008] Figure 1 shows the SIGALARM Model 210 control unit This model uses an autoshymatically retracting reel for the probe to accommodate the extension and retraction of the boom and can also be equipped with additional alert devices The probe is a two-conductor insulated cable with one conductor used as the antenna and the other as a path through which to inject a device test signal at the end of the antenna (using a test button on the control module) The conshytrol module mounts in the crane cab for operator access It has rotary switches for coarse and fine
3
6
sensitivity adjustment (referred to as ldquocalibrationrdquo in the Model 210 manual) power and test switches and status indicator lights 6
Installation of the Model 210 for this research comprised an unshielded jacketed twisted pair cable for the probe When not serving as a means to inject a test signal the second conductor in the probe is simply an extension of the antenna conductor since it is connected to the antenna conductor at the tip of the crane boom The Model 210 can use any of several different cable types as a probe as described in the installation manual [Allied Safety Systems LLC 2008]
In operation the Model 210 automatically adjusts to its maximum sensitivity when powered on The sensitivity is set to the desired level by first adjusting the coarse and then fine sensitivity adjustments and when in alarm condition the unit emits a loud repetitive chirping signal When calibrated by the manufacturer at 20 ft (61 m) from the power line during testing the alarm rate was approximately two chirps per second When well beyond 20 ft (61 m) from the power lines the Model 210 produced no chirping As the electric field strength increased during boom movement the chirp began and its rate increased A rate of about two chirps per second indicated that the field strength measured by the device was equivalent to that during calibration
Figure 1mdashSIGALARM Model 210 control unit
4
Allied Safety Engineering Model 2100
The ASE Model 2100 was a microprocessor-based power line PWD developed by Allied Safety Engineering The device tested was a preproduction unit very similar to the Model 2200 on Allied Safety Engineeringrsquos Web site at the time of this writing [Allied Safety Engineering 2008] The ASE Model 2100 consisted of a cab-mounted remote panel (main control module) to which two probes (antennas) and an operator panel were connected The unit could drive multishyple external alert devices The probes consisted of two insulated conductors positioned one on each side of the boom and deployed from two automatically retracting reels The operator panel provided an LCD display of field strength sensitivity adjustments alarm status and other system information as well as several pushbuttons to allow operator input and control Figure 2 shows the Model 2100 remote and operator panels
Sensitivity was adjusted by selecting a field strength ldquoset pointrdquo when the boom was posishytioned at the desired distance from the power lines The set point and the relative field strength at the device probes were continuously displayed on the operator panel as dimensionless whole numbers scaled for easy interpretation by the operator Two audible alarmsmdasha warning signal and an alarm signalmdashwere annunciated as a series of beeps followed by a voice message At 80 of the alarm set point (this percentage is a user-selectable value) a ldquowarningrdquo voice messhysage was given indicating that continued boom movement in the same direction may result in an alarm condition The ldquoalarmrdquo voice message warned of impending power line contact
Figure 2mdashASE Model 2100 remote and operator panels
5
Proximity Warning Device Performance Objective
In the case of a mobile crane such as the one used in this research a PWD should ideally warn the equipment operator and any nearby personnel when any part of the crane or a susshypended load is closer to an energized overhead electrical power line than some preselected disshytance In most cases the minimum distance will be dictated by occupational safety regulations such as the current OSHA standards that require a clearance of at least 10 ft (30 m) for power lines at voltages up to 50 kV (29 CFR 1926550) Conversely a PWD should not alarm during operation outside the desired minimum clearance distance Such ldquofalse alarmsrdquo may cause pershysonnel to question the effectiveness of the device view it as a nuisance or perhaps ignore it completely The criteria just described strictly speaking would allow operation of a crane boom directly above or below a power line as long as the specified minimum clearance is maintained Such operation however increases the chance of an accidental line contact and should be avoided [ANSI 1995] A safer and more practical alternative is to define the limit of safe operashytion as a vertical plane at the desired clearance distance horizontally from the closest power line conductor and prohibit any part of the crane or suspended load from crossing this boundary during normal operation Figure 3 shows a three-phase power line installation in cross-section and two variations of a 10-ft (30-m) recommended safe operation boundary surrounding the conductors
13 kV
Neutral
10 ft (30 m)
Minimum clearancefrom power linescomplying with 29 CFR requirements
Preferred interpretation of
10 ft (30 m)clearance distance
[ANSI 1995]
13 kV
Neutral
10 ft (30 m)
Minimum clearance from power lines complying with 29 CFR requirements
Preferred interpretation of
10 ft (30 m) clearance distance
[ANSI 1995]
Figure 3mdashMinimum safe working distances around overhead electrical power lines
6
For most tests in this evaluation a minimum clearance distance of 20 ft (61 m) from the closest phase conductor of the power lines was used as the limit of safe operation and accordshyingly the PWDs had their sensitivities adjusted so that their alarm thresholds were reached with the boom tip approximately 20 ft (61 m) from the closest phase conductor7
7For this sensitivity adjustment distance the boom was positioned by placing the crane load block directly over a mark painted on the ground 20 ft (61 m) horizontally from the closest conductor Because of the inaccuracy inhershyent in this method and the size and shape of the boom structure the actual minimum distance from the boom to the closest conductor (as subsequently measured by computer model) was usually not precisely 20 ft (61 m) The 20-ft (61-m) ldquonominalrdquo distance however was used as a reference for all evaluations since this is the target value that would be assumed as correct by a crane operator using a similar procedure to adjust PWD sensitivity in the field
This distance was chosen to allow the crane boom to continue moving toward the power lines during testing if an alarm did not activate at or before the 20-ft (61-m) limit without bringing any part of the crane closer than 10 ft (30 m) from the lines This boundary of safe operation could have been defined as a vertical plane 20 ft (61 m) from the power lines The more literal interpretation of the boundary was used however allowing a minimum distance of 20 ft (61 m) in all directions from any energized phase conductor The main implication for the performance evaluations preshysented in this report is that movement of the boom below the power lines (at 0deg elevation angle) without activating the alarms is considered acceptable PWD operation The exceptions to the 20-ft (61-m) sensitivity setting were the tests involving the crane traveling toward the lines with the PWDs set at maximum sensitivity
TEST PROGRAM
Installation of Power Line Proximity Warning Devices on the Test Crane
Both PWDs were mounted by their manufacturers on a government-owned Grove RT522 rough-terrain crane (22-st (20-mt) capacity) Typical mounting techniques and routing of wiring were altered to avoid permanent modifications to the crane but proper probe placement was maintained
Operator control panels for both units were located in the crane cab and speakers for audible alarms were located on the base section of the boom The SIGALARM Model 210 probe reel was mounted on the lower half of the boom base section and the probe routed to the boom tip on standoffs several inches above the upper left edge of the boom Probe extensions approxishymately 24 in (61 cm) long were mounted to hang freely at the boom tip to provide extra coverage in that area The two probes for the ASE Model 2100 were extended from two reels mounted on both sides of the base section of the boom and ran along each lower outside edge of the boom to the boom tip Figure 4 shows the PWD probes mounted on the crane boom
7
Figure 4mdashPWD probes on crane boom
Test Facility
Overhead Power Line Test Site
A test site specifically designed for operating mobile equipment near overhead electrical power lines was built at NIOSHndashPRL The site is a remote approximately level 5-acre (2-ha) grass-covered area with controlled access Within this area four wooden utility poles were erected along a straight line 100 ft (305 m) apart and equipped with cross arms and necessary hardware to install one or two four-wire three-phase horizontal configuration power line circuits and a three-wire vertical configuration circuit The lines can be installed in various combinations at heights up to 45 ft (137 m) and can be powered from either end of the 300-ft (914-m) instalshylation Four ldquomovablerdquo wooden utility poles were also erected at the site These 36-ft (110-m) poles set in 55-st (5-mt) reinforced concrete blocks are designed to be moved by a forklift and can be equipped with one four-wire three-phase horizontal configuration circuit The movable poles can be positioned to create a power line circuit parallel to or intersecting the lines on the four permanent poles For both sets of poles all insulators and cross arms can accommodate cirshycuits up to 25 kV using 2 AWG ACSR conductors These overhead power line installations meet standards used by Allegheny Energy Inc a large electrical utility company headquartered near Pittsburgh serving Pennsylvania Maryland West Virginia and Virginia A nonstandard
8
safety feature included on the utility poles is a nonconductive high-visibility flag line suspended level with and 10 ft (30 m) away from the power lines (on the side of crane operation) This gives the crane operator and spotters a clear indication when the crane boom or hoist ropes are 10 ft (30 m) horizontally from the power line conductors The site also has a dedicated low-resistance (3 Ω) driven-rod electrical ground bed When the overhead power lines were configshyured for a specific test any conductors not in use were removed from the utility poles
Electrical Power Supply for Tests
A portable electrical power supply was assembled to supply overhead power line circuits at the power line test site described above It can provide two independently controlled four-wire three-phase sources isolated from utility sources and is capable of 27 kV line to line The sysshytem uses a 480-V three-phase 5000-W generator feeding two parallel branches Each branch has a three-phase variable transformer capable of providing a manually adjustable 0- to 560-V output feeding a 480-V to 27-kV 2-kVA step-up transformer Each branch can serve as an independent 0- to 27-kV four-wire three-phase supply for an overhead power line circuit Four-conductor insulated portable power cables terminated with four-prong twist-lock plugs connect all 480-V components High-voltage outputs use high-voltage insulated conductors connected to power line terminations on cross arms 10 ft (30 m) above ground level A circuit breaker at the generator output and fuses at transformer primaries provide overcurrent protection for the system All components can be moved from storage and setup for operation by a small team in 30ndash40 min Figure 5 is a diagram of the power system
Variabletransformer
0 ndash 560 V output
Variabletransformer
0 ndash 560 V output
480 Vthree-phase
generator
480V - 27kV2 kVA step-uptransformer
480V - 27kV2 kVA step-uptransformer
To overheadpower line
To overheadpower line
- Y
- Y
Variabletransformer
0 ndash 560 V output
Variable transformer
0 ndash 560 V output
Variabletransformer
0 ndash 560 V output
Variable transformer
0 ndash 560 V output
480 V three-phase
generator
480V - 27kV2 kVA step-uptransformer
480V - 27kV 2 kVA step-up transformer
480V - 27kV2 kVA step-uptransformer
480V - 27kV 2 kVA step-up transformer
To overhead power line
To overhead power line
- Y
- Y
Figure 5mdashDiagram of the test-site power system
For this test program the output for each power line circuit was monitored at the step-up transformer secondary terminals using a digital multimeter and high-voltage probe to measure one phase to neutral voltage For personnel safety access to the areas surrounding the step-up transformers and high-voltage connections at ground level were restricted using construction fencing All tests using a four-wire circuit were configured with the high-voltage output groundshying conductor tied to the test site ground bed and overhead line neutral conductor as well as a butt-wrapped grounding lead on each pole Prior to testing all line-to-line voltages were verified directly on the overhead lines using a hot-stick meter employed from an aerial manlift
9
Intersecting 13 kV overhead power line installations
Crane boom at full extensionand 61O elevation angle
Distance fromcrane hoistropes topower lines
Intersecting 13 kV overhead power line installations
Distance from crane hoist ropes to power lines
Crane boom at full extension and 61O elevation angle
Data Collection Process
Data collection for this research required documenting the crane boom position relative to the energized overhead power lines for each test in order to allow evaluation of PWD performshyance This was done by determining the relative three-dimensional (3-D) positions of the power lines and boom and recording this information as a computer model from which the relevant boom to power line distances (ldquotruerdquo distances) can be extracted The 3-D information was obtained using a ldquototal stationrdquo surveying instrument which allows precise measurement of horishyzontal and vertical angles as well as slope distance from the instrument to target points Use of the instrument required precise placement of reference targets (made of a special reflective mateshyrial) on the crane boom and the overhead power line installations
Using the survey coordinates of two reference points on either (or both) sets of overhead power lines and accurate measurements of the poles and conductors a 3-D model of the test site for each power line configuration was created Then for all tests the boom positions for both sensitivity adjustments and cases of alarm activation were mapped in the same 3-D space as the power lines Each boom model was based on the survey coordinates of two reference points on the boom and detailed boom dimensions Figure 6 is an example of a computer model for an individual test With the graphical computer models of the power lines and crane boomhoist ropes mapped in the same 3-D space the distance between the boomhoist ropes and power lines is readily determined by simply defining the shortest line between potential contact points for the two and noting its length
To verify the boom to power line distances obtained from the models manual measureshyments of the horizontal boom to power line distances (ldquoobservedrdquo distances) were made for all alarm activations These were made by noting the position of the crane load hook with respect to a distance reference grid painted on the ground at the test site The zero lines for the distance reference grid were directly below the nearest phase conductors for horizontal configuration lines (at 13-kV spacing)
Figure 6mdashExample of a computer model used for analyzing crane boom position relative to overhead power lines
10
Test Procedures
The PWDs as mounted on the crane by the manufacturers were tested by operating the crane near energized overhead power lines Different test sets varied the crane boom position relative to the power lines as well as power line configuration (number of three-phase circuits pole configuration conductor arrangement voltage level and phase sequencing) Within each test set individual tests involved swinging the boom toward the lines while at predetermined combinations of crane boom extension and elevation angle and then documenting the response of each PWD Most tests specified that the crane be operated from a stationary position (chassis supported on outriggers) However several tests involved the crane approaching the power lines to simulate entering an unfamiliar work area
A typical test for operation of the crane from a stationary position began by positioning the crane adjacent to the power lines and deploying its outriggers supported on wooden blocks For tests using a single set of poles the crane chassis centerline was parallel to the power lines and approximately 30 ft (91 m) horizontally from the closest phase conductor as shown in Figure 7(a) For two sets of poles with power lines intersecting at 90deg the crane chassis center-line bisected the angle between the power lines with the boomrsquos center of rotation approxishymately 30 ft (91 m) horizontally from the closest phase conductor of each set as shown in Figure 7(b)
BoomSwing
SwingStarting
Point
Crane
Power Lines
30 ft(91 m)
BoomSwing
SwingStarting
Point
Crane
Power Lines
30 ft(91 m)
PowerLines
30 ft(91 m)
(a) (b)
Boom Swing
Swing Starting
Point
Crane
Power Lines
30 ft (91 m)
Boom Swing
Swing Starting
Point
Crane
Power Lines
30 ft (91 m)
Power Lines
30 ft (91 m)
(a) (b)
Figure 7mdashCrane locations for tests involving operation from a stationary position
PWD sensitivities were then adjusted per on-site direction from the manufacturers The criteria used for these adjustments called for the PWDs to alarm if the crane boom or hoist ropes moved to within 20 ft (61 m) of the closest phase conductor After sensitivity adjustment the boomrsquos 3-D position relative to the power lines was documented using the total station surveying instrument Notwithstanding the 20-ft (61-m) alarm requirement the manufacturers were free to specify the specific procedures for adjusting PWD sensitivities as well as how frequently the devices would be readjusted during testing
11
The crane boom was then rotated horizontally to the swing starting point as shown in Figure 7 elevated and extended per the test plan and swung toward the power lines When either PWD alarm would activate the boom was stopped and its 3-D position relative to the power lines was documented The observed distance from the boom or hoist ropes to the power lines was also estimated using a distance reference grid painted on the ground If an alarm activated at the maximum distance from the power lines (ie before the boom was moved) this position was documented If a PWD did not alarm at or before the 20-ft (61-m) limit the boom swing was continued until alarm activation occurred or until the boom or hoist ropes were 10 ft (30 m) from the power lines The boom and hoist ropes were never allowed to come closer than 10 ft (30 m) to an energized power line during testing Note that in cases where the boom elevation was 0deg the boom was swung until directly under the closest phase conductor since at this point it was still greater than 20 ft (61 m) (vertically) from the power lines Figure 8 shows the test site and crane
Figure 8mdashGrove RT522 crane on outriggers positioned adjacent to overhead power lines with boom at 50 extension and boom tip approximately level with lower set of lines
12
For tests that simulated the crane in travel configuration approaching the power lines the PWDs were adjusted to maximum sensitivity Upon activation of an alarm the crane was stopped and set up for stationary operation on outriggers at that location Tests were then conshyducted by swinging the fully extended boom toward the power lines while at different elevations
Crane Boom Position Data Analysis
Position survey data and computer modeling were used to precisely record the relative positions of the overhead power lines and crane boom for sensitivity adjustment positions and each alarm activation point during testing The criteria used to determine the true distance between the boom or hoist ropes and the power lines for each test (from the models) was based on the position of the boom and the most likely point of contact with a power line conductor For tests where the boom was at a 0deg elevation angle or where the boom tip was at power line level the true distance is the shortest distance from the tip of the boom to the closest phase conductor For tests where the boom elevation angle was at the maximum used (61deg) the true distance is the shortest distance from the hoist ropes to the closest phase conductor Consideration of power line contact by hoisted loads was beyond the scope of this research
Test Plan
Most of the tests conducted in this research quantified the influence on PWD performshyance of variations in power line configuration and changes in crane boom parameters after initial PWD sensitivity adjustment Table 1 is a listing of test sets 1 through 7 organized according to power line configuration (crane operating from a stationary position)
Table 1mdashPower line configuration detail for test sets 1 through 7
Test set
No
No of three-phase
circuits
Circuit No 1 Circuit No 2 Relationship of two power line
circuits Voltage (kV)
Configushyration
Neutral conductor
Voltage (kV)
Configushyration
Neutral conductor
1 1 13 H Yes 2 1 25 V No1 3 2 13 H Yes 13 H Yes On same poles 4 2 13 H Yes 25 H Yes On same poles 5 2 13 H Yes 25 V No1 On same poles 6 2 13 H Yes 13 H Yes Intersect at 90deg
7 2 13 H Yes 25 H Yes Intersect at 90deg H Horizontal V Vertical 1This 25-kV power line simulates a subtransmission circuit which typically would not include a neutral
conductor
Each test set was run once with the phase conductors arranged ABC with A-phase nearest the crane for horizontal lines and at the top for vertical lines and then run again with the circuit (or one of the two circuits involved) arranged CBA in order to evaluate the effect of reversing the electrical ldquosequencerdquo of the phase conductors Within each of the 14 resulting groups of tests an individual test was run for each of 8 possible crane boom configurations These
13
configurations represented all possible combinations of three boom extension lengths (minimum 50 and maximum)8 and three elevation angles (0deg boom tip at power line height and 61deg)910
8These extensions give boom lengths of 28 ft (85 m) 487 ft (148 m) and 694 ft (212 m) respectively from base pivot pin to point sheave pin 9Sixty-one degrees was the maximum elevation angle (at minimum boom length) at which the load hook was not over the crane chassis 10With the boom at ldquominimum boom lengthrdquo it could not be positioned with the ldquoboom tip at power line heightrdquo for any power line configuration used Therefore this combination was not possible
The crane load block (hoisting hook) was positioned approximately 5 ft (15 m) from the ground for sensitivity adjustments and tests The exception to the 5-ft (15-m) load block height was for the combination of maximum boom extension and 61deg elevation angle for which the hoist block was positioned 23 ft (70 m) from the ground due to insufficient hoist rope on the crane
Additional test sets were included to examine other aspects of PWD performance such as using maximum device sensitivity for the time a crane is in transit in order to alert the operator and crew that power lines are somewhere in or near an unfamiliar work area as the crane approaches Ideally this warning would be well before the crane is in close proximity to the lines Test set 8 placed the crane in a travel configuration approaching a single set of horizontal power lines with PWDs set at maximum sensitivity to determine the greatest distance at which the lines could be detected Test set 9 had the crane with PWDs again set at maximum sensishytivity approach two sets of horizontal lines intersecting at 90deg to determine whether the alarm distance was influenced by the additional set of power lines
Test set 10 examined the effect of having the crane chassis tied directly to the power sysshytemrsquos grounded neutral while operating from a stationary position Connecting an equipment chassis to ground is sometimes suggested as a means to reduce the chance of a dangerous chassis voltage in the event of an accidental power line contact or to reduce induced charges on a piece of equipment
RESULTS
The following sections present performance data for the two PWDs tested Each section lists test and sensitivity adjustment details provides a diagram of the test layout and power line configuration and presents a table showing the distances from the overhead power lines at which the PWDs alarmed for specific conditions (or notes no alarm activation) The alarm distances as noted earlier are true distances taken from the 3-D models created for each test
Test Set 1
Test set 1 used one set of horizontal 13-kV lines Sensitivity was adjusted once prior to ABC phase sequence tests (A-phase nearest crane) and once prior to CBA phase sequence tests (C-phase nearest crane) Sensitivity was adjusted with the crane parked in the test position on its outriggers the boom extended to approximately 43 ft (131 m) (62 of full extension) the boom tip elevated to approximately phase conductor level and the boom swung to a position 20 ft (61 m) from the closest conductor11 Test layout and power line configuration are shown in Figure 9 Table 2 details performance of the PWDs for test set 1
11As described earlier the distance listed for the sensitivity adjustments is the ldquonominalrdquo distance from the power lines which was determined by using the distance reference grid painted on the ground at the test site There are slight variations in the sensitivity adjustment boom lengths listed because the boom positions were approximated in the field and then later measured precisely from the survey data-based computer models
14
Phase sequence horizontal ABC with A-phase nearest crane SIGALARM Model 210 ASE Model 2100
Boom Minimum 50 Maximum Boom Minimum 50 Maximum position extension extension extension position extension extension extension
0deg 0deg No alarm No alarm No alarm No alarm No alarm No alarm elevation elevation Boom tip Boom tip 276 361 276 518 at power (1) at power (1) (84) (110) (84) (158) line level line level
61deg 194 61deg 293 486 No alarm No alarm No alarm elevation (59) Elevation (89) (148)
Phase sequence horizontal CBA with C-phase nearest crane SIGALARM Model 210 ASE Model 2100
Boom Minimum 50 Maximum Boom Minimum 50 Maximum position extension extension extension position extension extension extension
0deg 0deg No alarm No alarm No alarm No alarm No alarm No alarm elevation elevation Boom tip Boom tip 234 386 290 534 at power (1) at power (1) (71) (118) (88) (163) line level line level
61deg 61deg 287 529 No Alarm No Alarm No Alarm No alarm elevation elevation (87) (161)
1The boom tip could not be raised to power line level with the boom at minimum extension length for any of the power line configurations used therefore this combination of extension and elevation angle was not possible
Fixed Power Lines (AA)
37 ft(113 m)
13 kV
BoomSwing
SwingStarting
Point
Crane
Fixed Power Lines
30 ft(91 m)
A
A
Fixed Power Lines (AA)
37 ft (113 m)
13 kV
Boom Swing
Swing Starting
Point
Crane
Fixed Power Lines
30 ft (91 m)
A
A
Figure 9mdashTest set 1 layout and overhead power line configuration
Table 2mdashAlarm distance results for test set 1 (Distance between boom or hoist ropes and closest phase conductor in ft (m))
15
Test Set 2
Test set 2 used one set of vertical 25-kV lines Sensitivity was adjusted once prior to ABC phase sequence tests (A-phase at top) and once prior to CBA phase sequence tests (C-phase at top) Sensitivity was adjusted with the crane parked in the test position on its outriggers the boom extended to approximately 57 ft (174 m) (82 of full extension) the boom tip elevated to approximately top phase conductor level and the boom swung to a position 20 ft (61 m) from the top conductor Test layout and power line configuration are shown in Figure 10 Table 3 details performance of the PWDs for test set 2
Fixed Power Lines (AA)
45 ft(137 m)
25 kV
BoomSwing
SwingStarting
Point
Crane
Fixed Power Lines
32 ft(98 m)
A
A
Fixed Power Lines (AA)
45 ft (137 m)
25 kV
Boom Swing
Swing Starting
Point
Crane
Fixed Power Lines
32 ft (98 m)
A
A
Figure 10mdashTest set 2 layout and overhead power line configuration
16
Phase sequence vertical ABC with A-phase at top (25 kV)
SIGALARM Model 210 ASE Model 2100
Boom Minimum 50 Maximum Boom Minimum 50 Maximum position extension extension extension position extension extension extension
0deg 0deg No alarm No alarm No alarm No alarm No alarm No alarm elevation elevation
Boom tip Boom tip 317 317 at power (1) (2) at power (1) (2) (97) (97) line level line level
61deg 121 218 61deg 121 334 No alarm No alarm elevation (37) (66) elevation (37) (102)
Phase sequence vertical CBA with C-phase at top (25 kV) SIGALARM Model 210 ASE Model 2100
Boom Minimum 50 Maximum Boom Minimum 50 Maximum position extension extension extension position extension extension extension
0deg 0deg No alarm No alarm No alarm No alarm No alarm No alarm elevation elevation
Boom tip Boom tip 321 321 at power (1) (2) at power (1) (2) (98) (98) line level line level
61deg 81 283 61deg 283 No alarm No alarm No alarm elevation (25) (86) elevation (86)
1The boom tip could not be raised to power line level with the boom at minimum extension length for any of the power line configurations used therefore this combination of extension and elevation angle was not possible 2These tests were omitted in error
Table 3mdashAlarm distance results for test set 2 (Distance between boom or hoist ropes and closest phase conductor in ft (m))
Test Set 3
Test set 3 used two sets of horizontal 13-kV lines supported on the same poles Sensishytivity was adjusted once prior to tests using ABC phase sequence on both sets of lines (A-phase nearest crane for both sets) and once prior to tests using CBA phase sequence on the upper set of lines (C-phase nearest crane for upper set) Sensitivity was adjusted with the crane parked in the test position on its outriggers the boom extended to approximately 44 ft (134 m) (63 of full extension) the boom tip elevated to approximately phase conductor level for the lower set of lines and the boom swung to a position 20 ft (61 m) from the closest conductor Test layout and power line configuration are shown in Figure 11 Table 4 details performance of the PWDs for test set 3
17
Upper set of power lines ndash phase sequence horizontal ABC with A-phase nearest crane Lower set of power lines ndash phase sequence horizontal ABC with A-phase nearest crane
SIGALARM Model 210 ASE Model 2100 Boom Minimum 50 Maximum Boom Minimum 50 Maximum
position extension extension extension position extension extension extension
0deg 0deg No alarm No alarm No alarm No alarm No alarm No alarm elevation elevation Boom tip Boom tip 272 450 2350 609 at power (1) at power (1) (83) (137) (107) (186) line level line level
61deg 296 449 61deg 370 623 No alarm No alarm elevation (90) (137) elevation (113) (190) Upper set of power lines ndash phase sequence horizontal CBA with C-phase nearest crane Lower set of power lines ndash phase sequence horizontal ABC with A-phase nearest crane
SIGALARM Model 210 ASE Model 2100 Boom Minimum 50 Maximum Boom Minimum 50 Maximum
position extension extension extension position extension extension extension
0deg 0deg No alarm No alarm No alarm No alarm No alarm No alarm elevation elevation Boom tip Boom tip 2240 319 2240 384 at power (1) at power (1) (73) (97) (73) (117) line level line level
61deg 150 61deg 223 355 No alarm No alarm No alarm elevation (46) elevation (68) (108)
1The boom tip could not be raised to power line level with the boom at minimum extension length for any of the power line configurations used therefore this combination of extension and elevation angle was not possible 2Value is the observed distance due to invalid survey data for the boom position
Fixed Power Lines (AA)
37 ft(113 m)
47 ft(143 m)
13 kV
13 kV
BoomSwing
SwingStarting
Point
Crane
Fixed Power Lines
30 ft(91 m)
A
A
Fixed Power Lines (AA)
37 ft (113 m)
47 ft (143 m)
13 kV
13 kV
Boom Swing
Swing Starting
Point
Crane
Fixed Power Lines
30 ft (91 m)
A
A
Figure 11mdashTest set 3 layout and overhead power line configuration
Table 4mdashAlarm distance results for test set 3 (Distance between boom or hoist ropes and closest phase conductor in ft (m))
18
Test Set 4
Test set 4 used two sets of horizontal power lines supported on the same poles The upper set was at 25 kV the lower set was at 13 kV Sensitivity was adjusted once prior to tests using ABC phase sequence on both sets of lines (A-phase nearest crane for both sets) and once prior to tests using CBA phase sequence on the upper set of lines (C-phase nearest crane for upper set) Sensitivity was adjusted with the crane parked in the test position on its outriggers the boom extended to approximately 43 ft (131 m) (62 of full extension) the boom tip elevated to approximately phase conductor level for the lower set of lines and the boom swung to a position 20 ft (58 m) from the closest conductor Test layout and power line configuration are shown in Figure 12 Table 5 details performance of the PWDs for test set 4
Fixed Power Lines (AA)
37 ft(113 m)
47 ft(143 m)
25 kV
13 kV
BoomSwing
SwingStarting
Point
Crane
Fixed Power Lines
29 ft(88 m)
A
A
Fixed Power Lines (AA)
37 ft (113 m)
47 ft (143 m)
25 kV
13 kV
Boom Swing
Swing Starting
Point
Crane
Fixed Power Lines
29 ft (88 m)
A
A
Figure 12mdashTest set 4 layout and overhead power line configuration
19
Upper set of power lines ndash phase sequence horizontal ABC with A-phase nearest crane (25 kV) Lower set of power lines ndash phase sequence horizontal ABC with A-phase nearest crane
SIGALARM Model 210 ASE Model 2100
Boom Minimum 50 Maximum Boom Minimum 50 Maximum position extension extension extension position extension extension extension
0deg 0deg No alarm No alarm No alarm No alarm No alarm No alarm elevation elevation
Boom tip Boom tip 228 379 293 577 at power (1) at power (1) (69) (116) (89) (176) line level line level
61deg 246 2430 61deg 345 616 No alarm No alarm elevation (75) (131) elevation (105) (188)
Upper set of power lines ndash phase sequence horizontal CBA with C-phase nearest crane (25 kV) Lower set of power lines ndash phase sequence horizontal ABC with A-phase nearest crane
SIGALARM Model 210 ASE Model 2100
Boom Minimum 50 Maximum Boom Minimum 50 Maximum position extension extension extension position extension extension extension
0deg 0deg No alarm No alarm No alarm No alarm No alarm No alarm elevation elevation
Boom tip Boom tip 211 336 297 573 at power (1) at power (1) (64) (102) (91) (175) line level line level
61deg 253 408 61deg 387 620 No alarm No alarm elevation (77) (124) elevation (118) (189)
1The boom tip could not be raised to power line level with the boom at minimum extension length for any of the power line configurations used therefore this combination of extension and elevation angle was not possible 2Value is the observed distance due to invalid survey data for the boom position
Table 5mdashAlarm distance results for test set 4 (Distance between boom or hoist ropes and closest phase conductor in ft (m))
20
Test Set 5
Test set 5 used two sets of power lines supported on the same poles The upper set was a vertical configuration at 25 kV the lower set was a horizontal configuration at 13 kV Sensitivity was adjusted once prior to tests using ABC phase sequence on both sets of lines (A-phase nearest crane for horizontal set and at top for vertical set) and once prior to tests using CBA phase sequence on the upper set of lines (C-phase at top) with the lower set remaining ABC Sensishytivity was adjusted with the crane parked in the test position on its outriggers the boom extended to approximately 44 ft (134 m) (63 of full extension) the boom tip elevated to approximately phase conductor level for the lower set of lines and the boom swung to a position 20 ft (61 m) from the closest conductor Test layout and power line configuration are shown in Figure 13 Table 6 details performance of the PWDs for test set 5
Fixed Power Lines (AA)
45 ft(137 m)
25 kV
BoomSwing
SwingStarting
Point
Crane
Fixed Power Lines
30 ft(91 m)
A
A
37 ft(113 m)
13 kV
Fixed Power Lines (AA)
45 ft (137 m)
25 kV
Boom Swing
Swing Starting
Point
Crane
Fixed Power Lines
30 ft (91 m)
A
A
37 ft (113 m)
13 kV
Figure 13mdashTest set 5 layout and overhead power line configuration
21
Upper set of power lines ndash phase sequence vertical ABC with A-phase at top (25 kV) Lower set of power lines ndash phase sequence horizontal ABC with A-phase nearest crane
SIGALARM Model 210 ASE Model 2100
Boom Minimum 50 Maximum Boom Minimum 50 Maximum position extension extension extension position extension extension extension
0deg 342 0deg No alarm No alarm No alarm No alarm No alarm elevation (104) elevation
Boom tip Boom tip 494 743 418 786 at power (1) at power (1) (151) (226) (127) (240) line level line level
61deg 2522 2650 61deg 460 2650 No alarm No alarm elevation (159) (198) elevation (140) (198)
Upper set of power lines ndash phase sequence vertical CBA with C-phase at top (25 kV) Lower set of power lines ndash phase sequence horizontal ABC with A-phase nearest crane
SIGALARM Model 210 ASE Model 2100
Boom Minimum 50 Maximum Boom Minimum 50 Maximum position extension extension extension position extension extension extension
0deg 350 412 0deg 290 No alarm No alarm No alarm elevation (107) (126) elevation (88)
Boom tip Boom tip 205 311 205 311 at power (1) at power (1) (62) (95) (62) (95) line level line level
61deg 319 2636 61deg 110 511 No alarm No alarm elevation (97) (194) elevation (34) (156)
1The boom tip could not be raised to power line level with the boom at minimum extension length for any of the power line configurations used therefore this combination of extension and elevation angle was not possible 2Alarmed at swing starting point
Table 6mdashAlarm distance results for test set 5 (Distance between boom or hoist ropes and closest phase conductor in ft (m))
22
Test Set 6
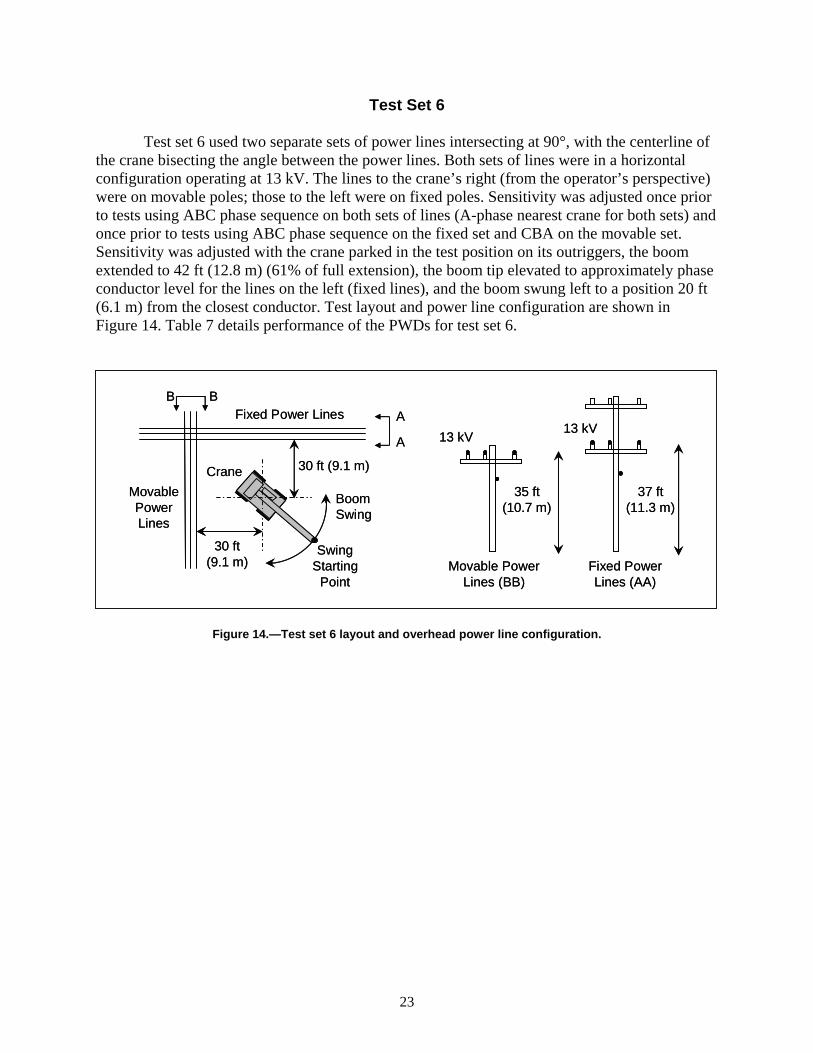
Test set 6 used two separate sets of power lines intersecting at 90deg with the centerline of the crane bisecting the angle between the power lines Both sets of lines were in a horizontal configuration operating at 13 kV The lines to the cranersquos right (from the operatorrsquos perspective) were on movable poles those to the left were on fixed poles Sensitivity was adjusted once prior to tests using ABC phase sequence on both sets of lines (A-phase nearest crane for both sets) and once prior to tests using ABC phase sequence on the fixed set and CBA on the movable set Sensitivity was adjusted with the crane parked in the test position on its outriggers the boom extended to 42 ft (128 m) (61 of full extension) the boom tip elevated to approximately phase conductor level for the lines on the left (fixed lines) and the boom swung left to a position 20 ft (61 m) from the closest conductor Test layout and power line configuration are shown in Figure 14 Table 7 details performance of the PWDs for test set 6
Fixed PowerLines (AA)
37 ft(113 m)
13 kV
BoomSwing
SwingStarting
Point
Crane
Fixed Power Lines
30 ft (91 m)
A
A 13 kV
Movable PowerLines (BB)
35 ft(107 m)
MovablePowerLines
B B
30 ft(91 m) Fixed Power
Lines (AA)
37 ft (113 m)
13 kV
Boom Swing
Swing Starting
Point
Crane
Fixed Power Lines
30 ft (91 m)
A
A 13 kV
Movable Power Lines (BB)
35 ft (107 m)
Movable Power Lines
B B
30 ft (91 m)
Figure 14mdashTest set 6 layout and overhead power line configuration
23
Fixed power lines ndash phase sequence horizontal ABC with A-phase nearest crane (left swing) Movable power lines ndash phase sequence horizontal ABC with A-phase nearest crane (right swing)
SIGALARM Model 210 ASE Model 2100
Boom Minimum 50 Maximum Boom Minimum 50 Maximum position extension extension extension position extension extension extension
Left swing Left swing Left swing Left swing Left swing Left swing No alarm No alarm No alarm No alarm No alarm No alarm0deg 0deg
elevation elevation Right swing Right swing Right swing Right swing Right swing Right swing No alarm No alarm No alarm No alarm No alarm No alarm
Left swing Left swing Left swing Left swing 293 424 293 2702 Boom tip Boom tip (89) (129) (89) (214) at power (1) at power (1)
Right swing Right swing Right swing Right swing line level line level 180 336 353 2726 (55) (102) (108) (221)
Left swing Left swing Left swing Left swing Left swing Left swing 366 2534 366 2534 No alarm No alarm 61deg (112) (163) 61deg (112) (163)elevation Right swing elevation Right swing Right swing Right swing Right swing Right swing 2534 390 2534 No alarm No alarm No alarm (163) (119) (163)
Fixed power lines ndash phase sequence horizontal CBA with C-phase nearest crane (left swing) Movable power lines ndash phase sequence horizontal ABC with A-phase nearest crane (right swing)
SIGALARM Model 210 ASE Model 2100
Boom Minimum 50 Maximum Boom Minimum 50 Maximum position extension extension extension position extension extension extension
Left swing Left swing Left swing Left swing Left swing Left swing No alarm No alarm No alarm No alarm No alarm No alarm0deg 0deg
elevation Right swing elevation Right swing Right swing Right swing Right swing Right swing 298 298 No alarm No alarm No alarm No alarm (91) (91) Left swing Left swing Left swing Left swing
291 387 291 485 Boom tip Boom tip (89) (118) (89) (148) at power (1) at power (1) Right swing Right swing Right swing Right swing line level line level 144 840 320 512
(44) (256) (98) (156) Left swing Left swing Left swing Left swing Left swing Left swing 262 419 No alarm No alarm No alarm No alarm 61deg 61deg (80) (128)
elevation elevation Right swing Right swing Right swing Right swing Right swing Right swing 278 408 No alarm No alarm No alarm No alarm (85) (124)
1The boom tip could not be raised to power line level with the boom at minimum extension length for any of the power line configurations used therefore this combination of extension and elevation angle was not possible 2Alarmed at swing starting point
Table 7mdashAlarm distance results for test set 6 (Distance between boom or hoist ropes and closest phase conductor in ft (m))
24
Test Set 7
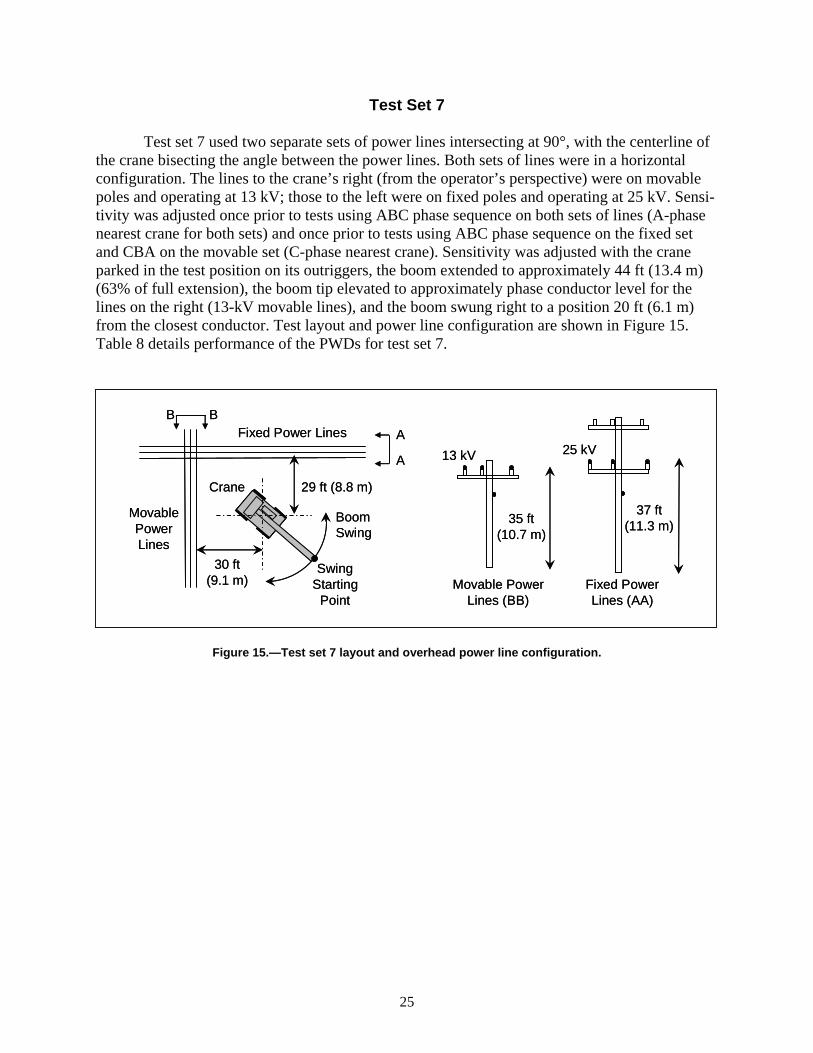
Test set 7 used two separate sets of power lines intersecting at 90deg with the centerline of the crane bisecting the angle between the power lines Both sets of lines were in a horizontal configuration The lines to the cranersquos right (from the operatorrsquos perspective) were on movable poles and operating at 13 kV those to the left were on fixed poles and operating at 25 kV Sensishytivity was adjusted once prior to tests using ABC phase sequence on both sets of lines (A-phase nearest crane for both sets) and once prior to tests using ABC phase sequence on the fixed set and CBA on the movable set (C-phase nearest crane) Sensitivity was adjusted with the crane parked in the test position on its outriggers the boom extended to approximately 44 ft (134 m) (63 of full extension) the boom tip elevated to approximately phase conductor level for the lines on the right (13-kV movable lines) and the boom swung right to a position 20 ft (61 m) from the closest conductor Test layout and power line configuration are shown in Figure 15 Table 8 details performance of the PWDs for test set 7
Fixed PowerLines (AA)
37 ft(113 m)
25 kV
BoomSwing
SwingStarting
Point
Crane
Fixed Power Lines
29 ft (88 m)
A
A 13 kV
Movable PowerLines (BB)
35 ft(107 m)
MovablePowerLines
B B
30 ft(91 m) Fixed Power
Lines (AA)
37 ft (113 m)
25 kV
Boom Swing
Swing Starting
Point
Crane
Fixed Power Lines
29 ft (88 m)
A
A 13 kV
Movable Power Lines (BB)
35 ft (107 m)
Movable Power Lines
B B
30 ft (91 m)
Figure 15mdashTest set 7 layout and overhead power line configuration
25
Fixed power lines ndash phase sequence horizontal ABC with A-phase nearest crane (left swing) (25 kV) Movable power lines ndash phase sequence horizontal ABC with A-phase nearest crane (right swing)
SIGALARM Model 210 ASE Model 2100
Boom Minimum 50 Maximum Boom Minimum 50 Maximum position extension extension extension position extension extension extension
Left swing Left swing Left swing Left swing Left swing Left swing 297 506 No alarm No alarm No alarm No alarm0deg (91) (154) 0deg elevation elevation Right swing Right swing Right swing Right swing Right swing Right swing
No alarm No alarm No alarm No alarm No alarm No alarm
Left swing Left swing Left swing Left swing 2542 2709 2542 2709 Boom tip Boom tip (165) (216) (165) (216) at power (1) at power (1)
Right swing Right swing Right swing Right swing line level line level 2569 2738 2569 2738 (173) (225) (173) (225)
Left swing Left swing Left swing Left swing Left swing Left swing 265 2447 2528 2447 2528 No alarm 61deg (81) (136) (161) 61deg (136) (161)elevation Right swing Right swing elevation Right swing Right swing Right swing Right swing 2453 2551 2453 2551 No alarm No alarm (138) (168) (138) (168)
Fixed power lines ndash phase sequence horizontal ABC with A-phase nearest crane (left swing) (25 kV) Movable power lines ndash phase sequence horizontal CBA with C-phase nearest crane (right swing)
SIGALARM Model 210 ASE Model 2100
Boom Minimum 50 Maximum Boom Minimum 50 Maximum position extension extension extension position extension extension extension
Left swing Left swing Left swing Left swing Left swing Left swing 430 2652 2807 419 638 No alarm 0deg (131) (199) (246) 0deg (128) (195)elevation Right swing Right swing elevation Right swing Right swing Right swing Right swing 2652 2797 No alarm No alarm No alarm No alarm (199) (243)
Left swing Left swing Left swing Left swing 2545 2716 2542 2716 Boom tip Boom tip (166) (218) (165) (218) at power (1) at power (1)
Right swing Right swing Right swing Right swing line level line level 2562 2733 2562 2733 (171) (223) (171) (223)
Left swing Left swing Left swing Left swing Left swing Left swing 2368 2439 2520 240 2439 2520
61deg (112) (134) (159) 61deg (73) (134) (159)elevation Right swing Right swing elevation Right swing Right swing Right swing Right swing 2446 2529 2446 2529 No alarm No alarm (136) (161) (136) (161)
1The boom tip could not be raised to power line level with the boom at minimum extension length for any of the power line configurations used therefore this combination of extension and elevation angle was not possible 2Alarmed at swing starting point
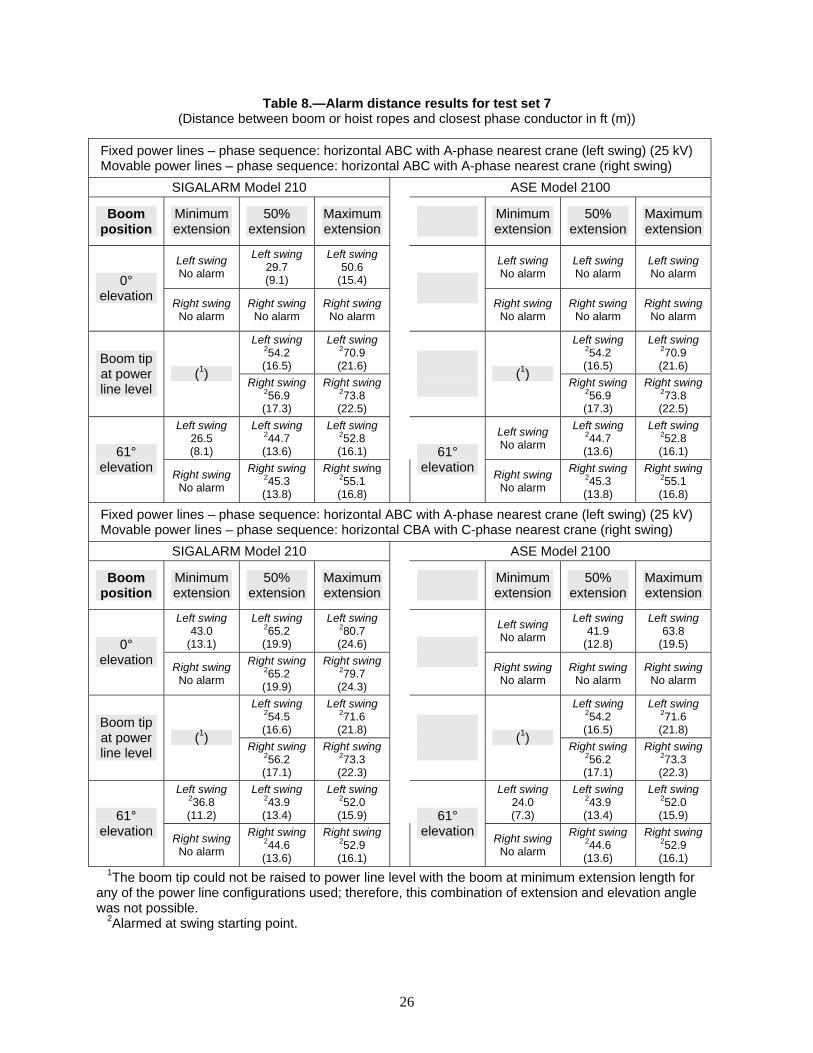
Table 8mdashAlarm distance results for test set 7 (Distance between boom or hoist ropes and closest phase conductor in ft (m))
26
For several specific cases in test set 7 while the boom was swinging toward the lines with the PWDs in an alarm state the alarms would cease and then resume closer to the lines For the SIGALARM Model 210 with CBA phase sequence on the movable lines the right swing tests combining 0deg elevation with 50 and 100 extensions had a cessation of the alarm during the swing and resumption at 278 ft (85 m) and 342 ft (104) respectively This cessation also occurred for the ASE Model 2100 for right swing tests combining the ldquoboom tip at line heightrdquo elevation with 50 and 100 extensions with the alarm resuming at 239 ft (73 m) and 333 ft (101 m) respectively This behavior was noted only in these cases but not all tests were conshytinued past the point of alarms to check for alarm cessation
Test Set 8
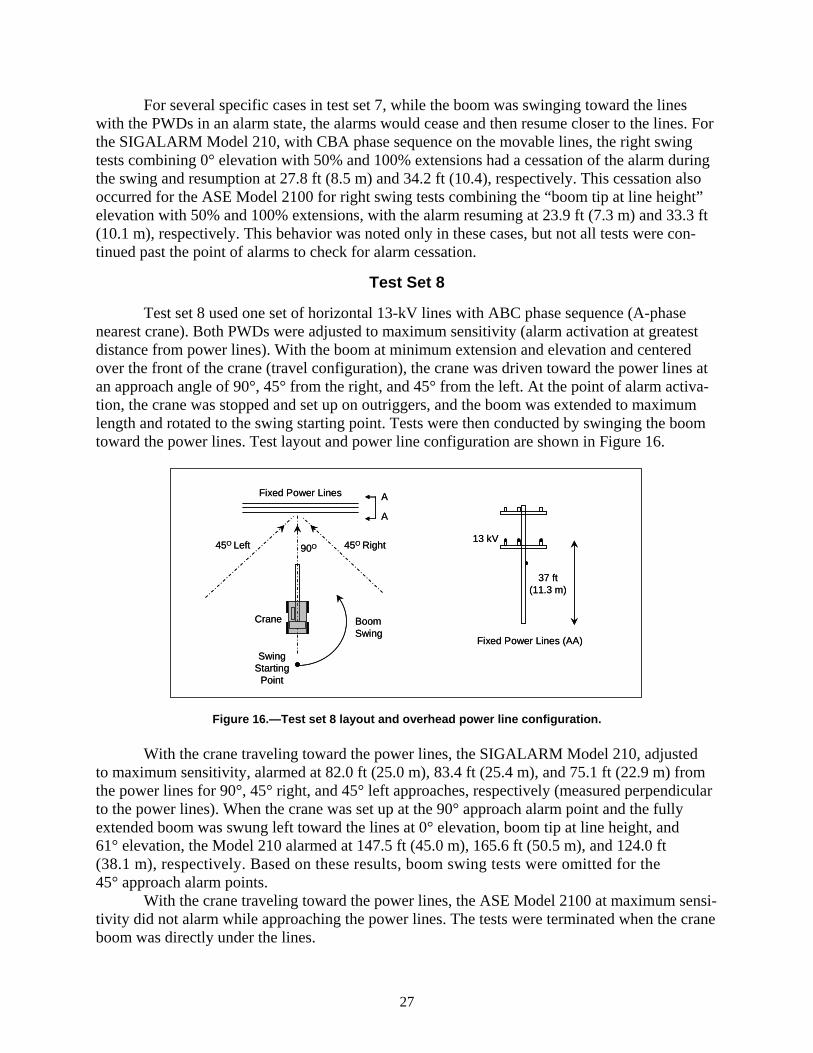
Test set 8 used one set of horizontal 13-kV lines with ABC phase sequence (A-phase nearest crane) Both PWDs were adjusted to maximum sensitivity (alarm activation at greatest distance from power lines) With the boom at minimum extension and elevation and centered over the front of the crane (travel configuration) the crane was driven toward the power lines at an approach angle of 90deg 45deg from the right and 45deg from the left At the point of alarm activashytion the crane was stopped and set up on outriggers and the boom was extended to maximum length and rotated to the swing starting point Tests were then conducted by swinging the boom toward the power lines Test layout and power line configuration are shown in Figure 16
Fixed Power Lines (AA)
37 ft(113 m)
13 kV
BoomSwing
SwingStarting
Point
Fixed Power Lines
Crane
A
A
90O 45O Right45O Left
Fixed Power Lines (AA)
37 ft (113 m)
13 kV
Boom Swing
Swing Starting
Point
Fixed Power Lines
Crane
A
A
90O 45O Right45O Left
Figure 16mdashTest set 8 layout and overhead power line configuration
With the crane traveling toward the power lines the SIGALARM Model 210 adjusted to maximum sensitivity alarmed at 820 ft (250 m) 834 ft (254 m) and 751 ft (229 m) from the power lines for 90deg 45deg right and 45deg left approaches respectively (measured perpendicular to the power lines) When the crane was set up at the 90deg approach alarm point and the fully extended boom was swung left toward the lines at 0deg elevation boom tip at line height and 61deg elevation the Model 210 alarmed at 1475 ft (450 m) 1656 ft (505 m) and 1240 ft (381 m) respectively Based on these results boom swing tests were omitted for the 45deg approach alarm points
With the crane traveling toward the power lines the ASE Model 2100 at maximum sensishytivity did not alarm while approaching the power lines The tests were terminated when the crane boom was directly under the lines
27
Test Set 9
Test set 9 used two sets of horizontal 13-kV lines with ABC phase sequence (A-phase nearest crane) intersecting at 90deg Both PWDs were adjusted to maximum sensitivity (alarm actishyvation at greatest distance from power lines) With the boom at minimum extension and elevashytion and centered over the front of the crane the crane was driven toward the power lines on a path bisecting the angle between the lines At the point of alarm activation the crane was stopped and set up on outriggers and the boom was extended to maximum length and rotated to the swing starting point Tests were then conducted by swinging the boom toward the power lines Test layout and power line configuration are shown in Figure 17
Fixed PowerLines (AA)
37 ft(113 m)
13 kV
BoomSwing
SwingStarting
Point
Crane
Fixed Power Lines A
A 13 kV
Movable PowerLines (BB)
35 ft(107 m)
MovablePowerLines
B B
Fixed Power Lines (AA)
37 ft (113 m)
13 kV
Boom Swing
Swing Starting
Point
Crane
Fixed Power Lines A
A 13 kV
Movable Power Lines (BB)
35 ft (107 m)
Movable Power Lines
B B
Figure 17mdashTest set 9 layout and overhead power line configuration
With the crane traveling toward the power lines the SIGALARM Model 210 adjusted to maximum sensitivity alarmed at 88 ft (268 m) from both sets of power lines (observed distance measured perpendicular to both sets of power lines) When the crane was set up at this location and the fully extended boom was swung right toward the portable power lines the Model 210 alarmed at 1542 ft (470 m) and 1362 ft (415 m) for the boom tip at power line height and 61deg elevation respectively No data were obtained for 0deg boom elevation
With the crane traveling toward the power lines the ASE Model 2100 adjusted to maxishymum sensitivity alarmed at 20 ft (61 m) from the power lines When the crane was set up at this location and the fully extended boom was swung right toward the portable power lines the Model 2100 alarmed at 701 ft (214 m) 623 ft (190 m) and 527 ft (161 m) for 0deg elevation boom tip at power line height and 61deg elevation respectively
Test Set 10
Connecting an equipment chassis to ground is sometimes suggested as a means to reduce the chance of a dangerous chassis voltage in the event of an accidental power line contact or to avoid an induced charge on a piece of equipment Test set 10 examined the effect on PWD pershyformance of connecting the crane chassis directly to the grounded power system neutral These tests used one set of horizontal 13-kV lines with ABC phase sequence (A-phase nearest crane) Sensitivity was adjusted once prior to testing with the crane parked in the test position on its outshyriggers the boom extended to 46 ft (140 m) (66 of full extension) the boom tip elevated to
28
approximately phase conductor level and the boom swung to a position 20 ft (61 m) from the closest conductor The same eight boom positions were used as in test sets 1 through 7 One complete series was done with the crane chassis tied directly to the grounded power system neutral then those tests were duplicated with the chassis disconnected from the system neutral (initial sensitivity adjustments were left in place for both series of tests)
For both PWDs the tests showed no significant difference in the alarm distances between the series with and without the crane chassis tied directly to the power system ground
SUMMARY OF PROXIMITY WARNING DEVICE PERFORMANCE
A review of the foregoing test results clearly illustrates that many often interrelated factors affect performance of PWDs One of the most important factors is sensitivity adjustment Both PWD manufacturers cooperating in this research adjusted the sensitivity of their devices in the same manner for each set of tests This adjustment used a relatively consistent boom position and configuration and a nominal distance of approximately 20 ft (61 m) from the power lines This adjustment was performed only twice for each of test sets 1 through 7 as detailed earlier While this approach did not optimize PWD performance for any given test it had the advantage of allowing comparisons of the effects of changes in power line and boom configurations Most of the performance assessments presented in this section highlight and rank the effects of these factors on the accuracy and reliability of the two PWDs tested
Power Line Configurations
Test sets 1 through 7 examined the effects of differences in power line configurations on PWD performance and included 284 individual tests12
12The number 284 is based on counting the same test run for each PWD as two tests
Of these 284 tests 108 had a boom elevashytion of 0deg (boom approximately level with the ground) which allowed the boom to be swung below the power lines without coming within 20 ft (61 m) (true distance) of any phase conshyductor (20 ft (61 m) was the nominal distance used for PWD sensitivity adjustments) As disshycussed earlier operating with the boom directly above or below overhead power lines can be very hazardous and should normally be avoided For these 108 tests however the horizontal boom passing below the power lines without triggering an alarm is considered acceptable PWD operation since the boom was never closer than 20 ft (61 m) (true distance) from an energized conductor Of these 108 cases 15 caused a PWD alarm which by the criteria just described conshystitutes an ldquoearly alarmrdquo The remaining 176 tests (those with the boom elevated such that the tip is at power line height or elevated to 61deg) should have all resulted in PWD alarms ideally at approximately 20 ft (61 m) from the closest phase conductor Of these 176 tests 148 produced alarms The 28 remaining tests that did not cause an alarm were stopped when the boom was 10 ft (30 m) from the power lines Of the 148 alarm activations 140 were early alarms (more than 20 ft (61 m) from power lines) and 8 were ldquolate alarmsrdquo (less than 20 ft (61 m) and more than 10 ft (30 m) from the lines)
Table 9 summarizes PWD alarm performance based on different power line configurashytions for test sets 1 through 7 The table lists the number of no alarm early alarm and late alarm cases for each test set as well as the average of alarm distance deviations from 20 ft (61 m) (magnitudes) for the tests that caused alarm activations
29
Test set No and power line configuration
SIGALARM Model 210
ASE Model 2100
Alarm record 1 (a) No alarm
1 (b) Late alarm 2 (c) Early alarm
Alarm distance
deviation3
ft (m)
Alarm record 1 (a) No alarm
1 (b) Late alarm 2 (c) Early alarm
Alarm distance
deviation3
ft (m)
1 One horizontal line set 13 kV
(a) 5 of 10 (b) 1 of 10 (c) 4 of 16
94 (29)
(a) 2 of 10 (b) 0 of 10 (c) 8 of 16
203 (62)
2 One vertical line set 25 kV
(a) 2 of 8 (b) 2 of 8 (c) 4 of 14
90 (27)
(a) 3 of 8 (b) 1 of 8 (c) 4 of 14
106 (32)
3 Two horizontal line sets
on same poles 13 kV13 kV
(a) 3 of 10 (b) 1 of 10 (c) 6 of 16
126 (38)
(a) 2 of 10 (b) 0 of 10 (c) 8 of 16
194 (59)
4 Two horizontal line sets
on same poles 25 kV13 kV
(a) 2 of 10 (b) 0 of 10 (c) 8 of 16
135 (41)
(a) 2 of 10 (b) 0 of 10 (c) 8 of 16
275 (84)
5
Two line sets one vertical over one horizontal on same poles 25 kV13 kV
(a) 2 of 10 (b) 0 of 10 (c) 11 of 16
275 (84)
(a) 2 of 10 (b) 1 of 10 (c) 8 of 16
239 (73)
6
Two horizontal line sets crossing at 90deg 13 kV13 kV
Left swing
(a) 4 of 10 (b) 0 of 10 (c) 6 of 16
182 (55)
(a) 2 of 10 (b) 0 of 10 (c) 8 of 16
219 (67)
6
Two horizontal line sets crossing at 90deg 13 kV13 kV Right swing
(a) 5 of 10 (b) 2 of 10 (c) 4 of 16
238 (73)
(a) 2 of 10 (b) 0 of 10 (c) 9 of 16
227 (69)
7
Two horizontal line sets crossing at 90deg 25 kV13 kV Left swing toward
25-kV lines
(a) 0 of 10 (b) 0 of 10 (c) 15 of 16
356 (109)
(a) 1 of 10 (b) 0 of 10 (c) 11 of 16
345 (105)
7
Two horizontal line sets crossing at 90deg 25 kV13 kV Right swing toward
13-kV lines
(a) 2 of 10 (b) 0 of 10 (c) 10 of 16
432 (132)
(a) 2 of 10 (b) 0 of 10 (c) 8 of 16
373 (114)
1The denominator in this entry refers to tests in the category listed where an alarm should have occurred at approximately 20 ft (61 m) from the power lines 2The denominator in this entry refers to all tests in the category listed 3Deviation refers to the average of the magnitudes for (true alarm distance ndash 20 ft (61 m)) where 20 ft (61 m) is the nominal distance used for sensitivity adjustments The exception is for tests with 0deg boom elevation where the deviation is the horizontal distance from the boom to the closest phase conductor at the point of alarm activation
Table 9mdashSummary of PWD alarm performance based on power line configuration
30
Test set No and power line configuration
Alarm distance deviation1 ft (m) (Boom configuration boom tip at power line level and
boom extension at 50)
SIGALARM Model 210 ASE Model 2100
1 One horizontal line set 13 kV 6 (18)
9 (27)
2 One vertical line set 25 kV ND ND
3 Two horizontal line sets on same poles 13 kV13 kV
6 (18)
10 (31)
4 Two horizontal line sets on same poles 25 kV13 kV
8 (24)
11 (34)
5 Two line sets one vertical over one horizontal on same poles 25 kV13 kV
15 (46)
12 (37)
6 Two horizontal line sets crossing at 90deg 13 kV13 kV
Left swing
9 (27)
9 (27)
6 Two horizontal line sets crossing at 90deg 13 kV13 kV Right swing
4 (12)
14 (43)
7 Two horizontal line sets crossing at 90deg 25 kV13 kV Left swing toward 25-kV lines
35 (107)
34 (104)
7 Two horizontal line sets crossing at 90deg 25 kV13 kV
Right swing toward 13-kV lines
37 (113)
37 (113)
ND No data 1Deviation refers to the average of the magnitudes for (true alarm distance ndash 20 ft (61 m)) where 20 ft (61 m) is the nominal distance used for sensitivity adjustments
Table 10 summarizes PWD alarm performance based on different power line configurashytions for test sets 1 through 7 when analysis was limited only to tests where the boom extension was at 50 and the boom elevation was such that the tip was approximately at power line level This configuration approximated the general position used for sensitivity adjustments so the performance data do not include the adverse effects of having the boom fully retracted andor at 0deg elevation (usually resulting in no alarm) or at full extension andor 61deg elevation (often causshying early alarms)
Table 10mdashSummary of PWD alarm performance based on power line configuration when analysis is limited only to tests where the boom extension was at 50
and the boom elevation was such that the tip was approximately at power line level
In analyzing the foregoing data no distinct pattern emerges with respect to PWDs failing to alarm or alarming late based only on the influence of power line configuration An examinashytion of the deviations in alarm distance however for the cases where the devices did alarm shows that accuracy was best for simple single-circuit installations (45ndash100 average devishyation) but degraded somewhat for multiple circuits on the same poles (65ndash138 average
31
deviation) This degradation was slightly greater for installations with different voltage levels andor both vertical and horizontal conductor arrangements Performance degraded further for crane operation between two intersecting power line installations (90ndash215 average devishyation) The worst accuracy was associated with intersecting line installations at different voltages
When analysis is limited to only the data from tests where the boom position approxishymated sensitivity adjustment conditions (Table 10) PWD accuracy displays a pattern similar to that in the results for all boom positions In the limited data case however PWD performance seemed to be more sensitive to and adversely affected by the presence of two different voltage levels near the crane
Another behavior seen in the data is the tendency of the SIGALARM PWD to be more accurate when swinging left versus right with the crane positioned between intersecting power line sets This may be due to placement of the SIGALARM probe on the left side of the boom
Crane Boom Configurations
Test sets 1 through 7 were also used to examine the effects of different crane boom posishytions on PWD performance This evaluation included the 284 individual tests described previshyously of which 108 tests with 0deg boom should have produced no alarm and the remaining 176 should have ideally caused the PWDs to alarm at approximately 20 ft (61 m) from the power lines Table 11 details the results for these tests when grouped according to boom angle and boom extension The table lists the number of no alarm early alarm and late alarm cases for each boom parameter individually as well as the average of alarm distance deviations from 20 ft (61 m) (magnitudes) for the tests that caused alarm activations
32
Table 11mdashSummary of PWD alarm performance based on crane boom elevation angle or extension
SIGALARM Model 210 ASE Model 2100
Alarm record Alarm Alarm record Alarm Crane boom parameter 1 1 (a) No alarm distance (a) No alarm distance 1 1 (b) Late alarm deviation3 (b) Late alarm deviation3
2 2 (c) Early alarm ft (m) (c) Early alarm ft (m) (a) NA (a) NA 405 285 0deg boom elevation (b) NA (b) NA (123) (87) (c) 11 of 54 (c) 4 of 54
Boom elevation placing boom (a) 0 of 34 (a) 0 of 34 224 275 tip approximately level with (b) 2 of 34 (b) 0 of 34 (68) (84) power lines (c) 32 of 34 (c) 34 of 34 (a) 25 of 54 (a) 18 of 54 207 226 61deg boom elevation (b) 4 of 54 (b) 2 of 54 (63) (69) (c) 25 of 54 (c) 34 of 54
Minimum boom extension (a) 16 of 18 (a) 17 of 18 Boom length 28 ft (85 m) from 187 40 (b) 0 of 18 (b) 0 of 18 base pivot pin to point sheave (57) (12) (c) 3 of 36 (c) 1 of 36 pin 50 boom extension (a) 4 of 34 (a) 1 of 34 Boom length 487 ft (148 m) 175 166 (b) 6 of 34 (b) 2 of 34 from base pivot pin to point (53) (51) (c) 28 of 52 (c) 32 of 52 sheave pin 100 boom extension (a) 5 of 36 (a) 0 of 36 Boom length 694 ft (212 m) 311 319 (b) 0 of 36 (b) 0 of 36 from base pivot pin to point (95) (97) (c) 37 of 54 (c) 39 of 54 sheave pin
NA Not applicable 1The denominator in this entry refers to tests in the category listed where an alarm should have occurred at approximately 20 ft (61 m) from the power lines 2The denominator in this entry refers to all tests in the category listed 3Deviation refers to the average of the magnitudes for (true alarm distance ndash 20 ft (61 m)) where 20 ft (61 m) is the nominal distance used for sensitivity adjustments The exception is for tests with 0deg boom elevation where the deviation is the horizontal distance from the boom to the closest phase conductor at the point of alarm activation
Based on the results presented in Table 11 the PWDs were most likely to fail to alarm when the crane boom was operated at minimum extension (89ndash94 failed to alarm) andor at 61deg elevation angle (33ndash46 failed to alarm) For the tests where the devices did alarm the accuracy was poorest at 100 boom extension (160 average deviation) andor 0deg boom elevashytion (145ndash205 average deviation)
33
Other Factors
Use of a PWD as an Early Warning Device
Test sets 8 and 9 emulated the use of a PWD to provide an ldquoearly warningrdquo of a power line(s) for a crane traveling into an unfamiliar work area With the crane in travel configuration and both PWDs set at maximum sensitivity the SIGALARM Model 210 alarmed at 75ndash82 ft (229ndash250 m) from a single set of 13-kV power lines (depending on approach angle) and 88 ft (268 m) from two intersecting sets of 13-kV power lines These alarm distances should be suffishycient for an operator to take preventive measures before the crane is in a position from which it could contact nearby power lines The ASE Model 2100 allowed the crane in travel configurashytion to approach and travel under the single set of 13-kV lines without alarm activation but did alarm at a point 20 ft (61 m) from the two intersecting sets of 13-kV power lines
Effect of Connecting the Crane Chassis to a Grounded Power System Neutral
Test set 10 examined the effect of directly connecting the crane chassis to the solidly grounded neutral of a three-phase overhead power line system (all other testing had no delibershyate direct connection of the chassis to the power system neutral) For the test conditions used the PWDs showed no significant difference in performance due to connection of the crane chassis to a grounded power system neutral
Effect of Multiple Independent Power Line Circuits
Several tests under test set 7 created conditions under which PWD alarm activation would cease and then resume during one continuous swing of the boom toward a set of power lines This behavior was documented for two power line sets intersecting at 90deg operating at different voltages and having opposite phase sequencing PWD sensitivities were adjusted at 20 ft (61 m) from the lower voltage lines and the boom swing (wherein the alarm dropout occurred) was toward the lower voltage lines while simultaneously moving away from the higher voltage lines While this behavior was not thoroughly investigated during this research the sevshyeral cases in which it was noted clearly illustrate that PWD performance can be compromised when a crane is simultaneously exposed to electric fields from multiple independent overhead power line circuits
Effect of Power Line Phase Sequence
In test sets 1 through 7 one varied parameter was the phase sequence for the three-phase circuit involved or for one of two circuits when two sets of power lines were used This is an important issue since there is no convention in distribution power line construction standards for the relative position of specific phases in a three-phase overhead line installation and any effect of phase sequence on PWD performance will be random For test sets 1 through 7 tests were run with the sequence as ABC on all circuits with A-phase nearest the crane (or with A at the top for a vertical conductor arrangement) The tests were then run again with the phase sequence reversed (CBA) either on the one circuit involved or on one of two circuits used Table 12 details the variations in PWD accuracy due to introduction of CBA phase sequence
34
Test set No and power line configuration
Change in PWD alarm distance deviation due to 1 introduction of CBA phase sequence
SIGALARM Model 210 ASE Model 2100
1 One horizontal line set 13 kV 16 increase 7 increase
2 One vertical line set 25 kV 31 increase 7 decrease
3 Two horizontal line sets on same poles 13 kV13 kV 47 decrease 60 decrease
4 Two horizontal line sets on same poles 25 kV13 kV 25 decrease 3 increase
5 Two line sets one vertical over one horizontal on same poles 25 kV13 kV 41 decrease 63 decrease
6 Two horizontal line sets crossing at 90deg 13 kV13 kV
Left swing 36 decrease 36 decrease
6 Two horizontal line sets crossing at 90deg 13 kV13 kV Right swing
36 increase 39 decrease
7 Two horizontal line sets crossing at 90deg 25 kV13 kV Left swing toward 25-kV lines
40 increase 10 increase
7 Two horizontal line sets crossing at 90deg 25 kV13 kV
Right swing toward 13-kV lines 29 increase 2 decrease
1Change in alarm distance deviation was calculated as ((change in average of alarm distance deviation magnitudes for tests with CBA phase sequence divide average of alarm distance deviation magnitudes for tests with ABC phase sequence) times 100) Deviation was defined as follows (true alarm distance minus 20 ft (61 m)) for tests producing alarms (except tests with 0deg boom elevation) or the horizontal distance from the boom to the closest phase conductor for tests with 0deg boom elevation or 10 ft (30 m) for tests that should have caused an alarm but did not (In the last case the boom swing was stopped 10 ft (30 m) from the closest phase conductor when no alarm occurred) See ldquoResultsrdquo section for details on reversal of three-phase sequence for each test configuration
Table 12mdashSummary of PWD alarm performance changes due to reversal of power line phase sequence
Results in Table 12 indicate that the PWDs tested were normally more accurate when two power line circuits on the same poles had opposite phase sequences compared to the same cirshycuits with matching sequences This was also the pattern for intersecting power line circuits at the same voltage (notwithstanding the SIGALARMrsquos poorer performance for right swings) Opposite phase sequence however was more likely to degrade accuracy for intersecting power line circuits operating at different voltages
Sensitivity Adjustments
Manufacturerrsquos literature for the SIGALARM Model 210 recommends that if the device is to be used as a ldquoproximity warning devicerdquo as opposed to an ldquoautomatic early power line warning devicerdquo the device should be ldquocalibratedrdquo (sensitivity-adjusted) with the boom retracted
35
to the minimum length expected to be used and positioned at a distance from the power lines at least twice that required by 29 CFR or state regulations The literature adds that if a specific boom extension is to be used for an extended period the device should be calibrated with the boom at that length [Allied Safety Systems LLC 2008] Manufacturerrsquos literature for the ASE Model 2200 (similar to the Model 2100 used in this testing) recommends that the ldquosetpointrdquo be selected based on electric field strength with the boom at approximately 45deg elevation the boom tip approximately 10 ft (30 m) higher than power line level and a minimum distance from the nearest conductor of no less than 10 ft (30 m) [Allied Safety Engineering 2008]
Sensitivity adjustment of PWDs is an issue that directly affects the practical utility of these devices The test results detailed in this report clearly reveal that many factors can degrade the performance of the PWDs Foremost among these is change in boom length and elevation angle after a sensitivity adjustment has been made As a result selecting the boom position for sensitivity adjustment and more importantly recognizing when sensitivity should be readjusted become important decisions for the user of either PWD tested For crane operation that involves frequent changes in crane position andor boom and load configuration frequent PWD sensishytivity adjustments can improve performance Frequent readjustments however could reach a point where it is a distraction and annoyance to the operator and crew Ultimately a decision must be reached that balances both PWD accuracy and practicality without compromising pershysonnel safety
RECOMMENDATIONS FOR FUTURE RESEARCH
Results from this research indicate that several issues need further investigation PWD performance should be evaluated for crane operation involving only small changes in boom length (less than plusmn 5 ft (15 m) and boom elevation angle (less than plusmn 8deg) This may be a more accurate representation of ldquotypicalrdquo crane operation in the field Two specific areas that warrant more study are crane operation near multiple independent overhead power line circuits and anomalies associated with power line circuit phase sequence reversal Both of these factors can have an adverse and from the operatorrsquos perspective unpredictable effect on PWD performance In addition research should be conducted to develop and evaluate PWD technologies that can avoid the limitations of electric field measurement that have been highlighted in this report
REFERENCES
Allied Safety Engineering [2008] Proximity warning device ASE model 2200 [httpalliedsafetyengcommode=pwd] Date accessed May 2008 Allied Safety Systems LLC [2008] SIGALARM [httpwwwsigalarminccom sigalarmhtm] Date accessed May 2008
ANSI [1995] American national standard for mobile and locomotive cranes New York American National Standards Institute ANSIASME B305
Cawley JC Homce GT [2003] Occupational electrical injuries in the United States 1992ndash1998 and recommendations for safety research J Safety Res 34(3)241ndash248
CFR Code of federal regulations Washington DC US Government Printing Office Office of the Federal Register
Hipp JE Henson FD Martin PE Phillips GN [1980] Evaluation of proximity warning devices Phase I interim report San Antonio TX Southwest Research Institute pp 11ndash13 US Bureau of Mines contract No J0188082 NTIS No PB 80-144413
36
APPENDIX AmdashLIST OF COOPERATORS
Below is a list of the cooperators involved in developing the test plan for the performance evaluation of overhead electrical power line PWDs described in this report
bull Allied Safety Systems LLC (SIGALARM) (PWD manufacturer) Lance Burney bull Allied Safety Engineering (PWD manufacturer) Irvin Nickerson bull Association of Equipment Manufacturers Richard Dressler bull International Union of Operating Engineers AFL-CIO Emmett Russell bull Center for Construction Research and Training (formerly known as the Center to Protect Workersrsquo Rights) Michael McCann PhD CIH bull Occupational Safety and Health Administration Kenneth Klouse bull Zachry Construction Corp Joseph Collins bull LMK Engineers (NIOSH contractor) Jan Shingler PE Joseph Deane PE and George Gehring PE
37
Delivering on the Nationrsquos promise safety and health at work for all people through research and prevention
To receive NIOSH documents or more information about occupational safety and health topics contact NIOSH at
1ndash800ndashCDCndashINFO (1ndash800ndash232ndash4636) TTY 1ndash888ndash232ndash6348 e-mail cdcinfocdcgov
or visit the NIOSH Web site at wwwcdcgovniosh
For a monthly update on news at NIOSH subscribe to NIOSH eNews by visiting wwwcdcgovniosheNews
DHHS (NIOSH) Publication No 2009ndash110
SAFER bull HEALTHIER bull PEOPLEtrade

Information Circular 9510 A Performance Evaluation of Two Overhead Power Line Proximity Warning Devices By Gerald T Homce PE James C Cawley PE and Michael R Yenchek PE
DEPARTMENT OF HEALTH AND HUMAN SERVICES Centers for Disease Control and Prevention
National Institute for Occupational Safety and Health Pittsburgh Research Laboratory
Pittsburgh PA
November 2008
This document is in the public domain and may be freely copied or reprinted
Disclaimer Mention of any company or product does not constitute endorsement by the National Institute for Occupational Safety and Health (NIOSH) In addition citations to Web sites external to NIOSH do not constitute NIOSH endorsement of the sponsoring organizations or their programs or products Furthermore NIOSH is not responsible for the content of these Web sites All Web addresses referenced in this document were accessible as of the publication date
Ordering Information To receive documents or other information about occupational safety and health topics contact NIOSH at
Telephone 1ndash800ndashCDCndashINFO (1ndash800ndash232ndash4636) TTY 1ndash888ndash232ndash6348 e-mail cdcinfocdcgov
or visit the NIOSH Web site at wwwcdcgovniosh
For a monthly update on news at NIOSH subscribe to NIOSH eNews by visiting wwwcdcgovniosheNews
DHHS (NIOSH) Publication No 2009ndash110
November 2008
SAFER bull HEALTHIER bull PEOPLEtrade
CONTENTS
Page Executive summary1 Introduction2 Background3
Detection of energized overhead power lines3 Proximity warning device descriptions3
SIGALARM model 2103 Allied Safety Engineering model 21005 Proximity warning device performance objective 6 Test program 7 Installation of power line proximity warning devices on the test crane 7 Test facility 8 Overhead power line test site8 Electrical power supply for tests9 Data collection process 10 Test procedures 11 Crane boom position data analysis 13 Test plan13 Results14 Test set 1 14 Test set 2 16 Test set 3 17 Test set 4 19 Test set 5 21 Test set 6 23 Test set 7 25 Test set 8 27 Test set 9 28 Test set 10 28 Summary of proximity warning device performance 29 Power line configurations 29 Crane boom configurations32 Other factors34 Use of a PWD as an early warning device34 Effect of connecting the crane chassis to a grounded power system neutral34 Effect of multiple independent power line circuits34 Effect of power line phase sequence34 Sensitivity adjustments 35 Recommendations for future research 36 References36 Appendix AmdashList of cooperators37
CONTENTSmdashContinued
ILLUSTRATIONS Page
1 SIGALARM model 210 control unit 4 2 ASE model 2100 remote and operator panels5 3 Minimum safe working distances around overhead electrical power lines 6 4 PWD probes on crane boom 8 5 Diagram of the test-site power system9 6 Example of a computer model used for analyzing crane boom position relative to over-
head power lines 10 7 Crane locations for tests involving operation from a stationary position 11 8 Grove RT522 crane on outriggers positioned adjacent to overhead power lines with
boom at 50 extension and boom tip approximately level with lower set of lines 12 9 Test set 1 layout and overhead power line configuration 15
10 Test set 2 layout and overhead power line configuration 16 11 Test set 3 layout and overhead power line configuration 18 12 Test set 4 layout and overhead power line configuration 19 13 Test set 5 layout and overhead power line configuration 21 14 Test set 6 layout and overhead power line configuration 23 15 Test set 7 layout and overhead power line configuration 25 16 Test set 8 layout and overhead power line configuration 27 17 Test set 9 layout and overhead power line configuration 28
TABLES 1 Power line configuration detail for test sets 1 through 7 13 2 Alarm distance results for test set 1 15 3 Alarm distance results for test set 2 17 4 Alarm distance results for test set 3 18 5 Alarm distance results for test set 4 20 6 Alarm distance results for test set 5 22 7 Alarm distance results for test set 6 24 8 Alarm distance results for test set 7 26 9 Summary of PWD alarm performance based on power line configuration30
10 Summary of PWD alarm performance based on power line configuration when analysis is limited only to tests where the boom extension was at 50 and the boom elevation was such that the tip was approximately at power line level31 11 Summary of PWD alarm performance based on crane boom elevation angle or extension 33 12 Summary of PWD alarm performance changes due to reversal of power line phase sequence 35
ACRONYMS AND ABBREVIATIONS USED IN THIS REPORT
3-D three-dimensional ACSR aluminum conductor steel-reinforced ANSI American National Standards Institute ASME American Society of Mechanical Engineers AWG American wire gauge CFR Code of Federal Regulations LCD liquid crystal display NIOSH National Institute for Occupational Safety and Health OSHA Occupational Safety and Health Administration PRL Pittsburgh Research Laboratory (NIOSH) PWD proximity warning device
UNIT OF MEASURE ABBREVIATIONS USED IN THIS REPORT
cm centimeter ft foot ha hectare Hz hertz in inch kV kilovolt kVA kilovolt-ampere m meter min minute mt metric ton st short ton V volt W watt Ω ohm
A PERFORMANCE EVALUATION OF TWO OVERHEAD POWER LINE PROXIMITY WARNING DEVICES
By Gerald T Homce PE1 James C Cawley PE2 and Michael R Yenchek PE3
1Lead Research Engineer Electrical 2Senior Research Engineer Electrical (retired) 3Lead Research Engineer Electrical Pittsburgh Research Laboratory National Institute for Occupational Safety and Health Pittsburgh PA
EXECUTIVE SUMMARY
Accidental contact of overhead electrical power lines by mobile equipment is a leading cause of occupational fatalities in the United States accounting for 20 of on-the-job electroshycutions Overhead electrical power line proximity warning devices (PWDs) are intended to warn personnel if mobile equipment moves within some preselected minimum distance of an enershygized overhead electrical power line Two commercially available PWDs were tested at the National Institute for Occupational Safety and Healthrsquos (NIOSH) Pittsburgh Research Laborashytory (PRL) The objective of the tests was to document performance capabilities and limitations for these PWDs by identifying factors that can influence their operation
The two PWDs evaluated in this research are the SIGALARM Model 210 marketed by Allied Safety Systems LLC and the ASE Model 2100 from Allied Safety Engineering Both of these devices operate by measuring the electric field present around energized power lines The PWDs were installed on a government-owned 22-st (20-mt) rough terrain crane A purpose-built test site used for this research at PRL allowed operation of the crane near a variety of power line configurations operating at up to 25 kV Most of the tests involved positioning the crane adjacent to one or more overhead power lines adjusting sensitivities of the PWDs to alarm when the crane boom was approximately 20 ft (61 m) from the power lines swinging the crane boom toward the lines under a wide variety of test conditions and finally for each unique set of test conditions documenting the deviation from 20 ft (61 m) for actual alarm activation
Test results show that several factors can adversely affect PWD performance PWD alarm accuracy generally deteriorated when operating with a boom position significantly differshyent than that used for the devicersquos last sensitivity adjustment Another factor that can affect PWD performance is configuration of the overhead power line(s) involved Accuracy of alarm activashytion distances was best for simple single-circuit installations but degraded for multiple circuits on the same poles This degradation was slightly greater for installations with different voltage levels andor a combination of vertical and horizontal conductor arrangements Performance also degraded for crane operation between two intersecting power line installations especially for intersecting lines at different voltages An additional aspect of power line configuration shown to influence PWD accuracy was phase sequence on the power line circuit(s) Specific phase conshyductor arrangements and combinations particularly in multiple circuit installations resulted in either improved or degraded accuracy
Tests were also conducted to evaluate the PWDs as ldquoearly warning devicesrdquo for situ- ations such as moving a mobile crane into an unfamiliar work area Results showed that the SIGALARM Model 210 could detect energized 13-kV power lines at a distance of 75ndash88 ft (229ndash268 m) This alarm distance would allow an operator to take preventive measures before the crane is in a position from which it could contact nearby power lines
INTRODUCTION
Many of the electrical fatalities in construction mining and other industries are due to personnel accidentally contacting overhead electrical power lines with high-reaching equipment such as mobile cranes During a recent 10-year period approximately 20 of occupational electrocutions involved contact between mobile equipment and overhead power lines [Cawley and Homce 2003] In a typical power line contact accident the frame of the equipment (and possibly a suspended load in the case of mobile cranes) is energized to a high voltage relative to the surrounding ground surface Anyone touching the frame and ground simultaneously is exposed to this high voltage and can become a path for lethal levels of electrical current
Overhead electrical power line PWDs are mobile equipment-mounted safety devices intended to alert personnel if the equipment is operating too close to an energized overhead elecshytrical power line Such devices have been commercially available for more than 30 years but have not found widespread acceptance in many industries due in part to a lack of regulatory requirements for their use The Occupational Safety and Health Administration (OSHA) is currently involved in updating the standards for cranes and derricks (29 CFR4 1926550) Part of the proposed revision addresses overhead power line safety for mobile cranes and includes explicit reference to PWDs as one of several acceptable measures for protecting workers from accidental power line contacts With this proposal to accept PWDs as one means to maintain a safe distance between cranes and power lines (as specified in 29 CFR) NIOSH researchers conshycluded that an objective performance evaluation of PWDs would be valuable and timely
A performance evaluation of two commercially available overhead power line PWDs was conducted at NIOSHndashPRL The objective of the tests was to document performance capabilities and limitations for these PWDs by identifying factors that can influence their operation The overall approach for this testing called for the two PWD companies to install their devices on a government-owned 22-st (20-mt) rough terrain crane and specify procedures for their use The crane was to be operated using a wide range of boom positions near several different configurashytions of energized overhead power lines with the performance of the PWDs documented This full-scale testing took place at a purpose-built overhead power line test site at PRL PRL engishyneers coordinated and directed this research but input for developing the test protocol was solicited from a number of cooperators including the two PWD manufacturers participating in the study an equipment manufacturing trade association representative labor union representashytives OSHA a large private construction and crane rental firm with experience using PWDs and an electrical engineering consulting firm working as a NIOSH contractor A list of these particishypants can be found in Appendix A
4Code of Federal Regulations See CFR in references
2
BACKGROUND
Detection of Energized Overhead Power Lines
Energized power lines radiate both magnetic and electric fields Therefore the presence of energized power lines may be detected by measuring either the magnetic field or the electric field surrounding them The magnetic field strength at any point around power lines is in part a function of the electrical current being carried by the lines Since power line current can vary significantly magnetic field measurement cannot reliably be used to determine distance to power lines In contrast the electric field surrounding power lines is primarily a function of the voltage at which they operate and their configuration5 Therefore the key parameters that determine electric field strength at any given position near a set of conductors are fixed for a given power line installation making electric field measurement more suitable for estimating the distance to energized power lines [Hipp et al 1980]
5For a specific point in space near overhead power lines the electric field will vary depending on factors such as vertical versus horizontal phase conductor arrangement conductor spacing the presence of multiple power line circuits and the presence of a neutral conductor
Proximity Warning Device Descriptions
Two commercially available PWDs were evaluated in this study Each is designed to warn of proximity to power lines by detecting the electric field present around the phase conducshytors In general each device consists of a probe a control unit and an audible alarm The probes were deployed along the length of the boom and the control unit was installed in the crane cab accessible to the operator The control unit for each device includes a sensitivity adjustment and a user interface for alarm and PWD status information Each device measures the 60-Hz signal derived from the probe exposed to the power line electric field The resulting signal level is comshypared to the alarm threshold preselected by the operator if it is exceeded audible and visible alarms are activated If the field measurement level falls below the threshold level the alarm ceases The general procedure for adjusting the alarm threshold or ldquosensitivityrdquo of each device is to position the crane boom at the desired minimum working distance from the power lines and adjust the device to establish an alarm threshold at that boom position The two PWDs are described in more detail below
SIGALARM Model 210
The SIGALARM Model 210 marketed by Allied Safety Systems LLC is a power line PWD designed for use on telescoping boom (hydraulic) cranes [Allied Safety Systems LLC 2008] Figure 1 shows the SIGALARM Model 210 control unit This model uses an autoshymatically retracting reel for the probe to accommodate the extension and retraction of the boom and can also be equipped with additional alert devices The probe is a two-conductor insulated cable with one conductor used as the antenna and the other as a path through which to inject a device test signal at the end of the antenna (using a test button on the control module) The conshytrol module mounts in the crane cab for operator access It has rotary switches for coarse and fine
3
6
sensitivity adjustment (referred to as ldquocalibrationrdquo in the Model 210 manual) power and test switches and status indicator lights 6
Installation of the Model 210 for this research comprised an unshielded jacketed twisted pair cable for the probe When not serving as a means to inject a test signal the second conductor in the probe is simply an extension of the antenna conductor since it is connected to the antenna conductor at the tip of the crane boom The Model 210 can use any of several different cable types as a probe as described in the installation manual [Allied Safety Systems LLC 2008]
In operation the Model 210 automatically adjusts to its maximum sensitivity when powered on The sensitivity is set to the desired level by first adjusting the coarse and then fine sensitivity adjustments and when in alarm condition the unit emits a loud repetitive chirping signal When calibrated by the manufacturer at 20 ft (61 m) from the power line during testing the alarm rate was approximately two chirps per second When well beyond 20 ft (61 m) from the power lines the Model 210 produced no chirping As the electric field strength increased during boom movement the chirp began and its rate increased A rate of about two chirps per second indicated that the field strength measured by the device was equivalent to that during calibration
Figure 1mdashSIGALARM Model 210 control unit
4
Allied Safety Engineering Model 2100
The ASE Model 2100 was a microprocessor-based power line PWD developed by Allied Safety Engineering The device tested was a preproduction unit very similar to the Model 2200 on Allied Safety Engineeringrsquos Web site at the time of this writing [Allied Safety Engineering 2008] The ASE Model 2100 consisted of a cab-mounted remote panel (main control module) to which two probes (antennas) and an operator panel were connected The unit could drive multishyple external alert devices The probes consisted of two insulated conductors positioned one on each side of the boom and deployed from two automatically retracting reels The operator panel provided an LCD display of field strength sensitivity adjustments alarm status and other system information as well as several pushbuttons to allow operator input and control Figure 2 shows the Model 2100 remote and operator panels
Sensitivity was adjusted by selecting a field strength ldquoset pointrdquo when the boom was posishytioned at the desired distance from the power lines The set point and the relative field strength at the device probes were continuously displayed on the operator panel as dimensionless whole numbers scaled for easy interpretation by the operator Two audible alarmsmdasha warning signal and an alarm signalmdashwere annunciated as a series of beeps followed by a voice message At 80 of the alarm set point (this percentage is a user-selectable value) a ldquowarningrdquo voice messhysage was given indicating that continued boom movement in the same direction may result in an alarm condition The ldquoalarmrdquo voice message warned of impending power line contact
Figure 2mdashASE Model 2100 remote and operator panels
5
Proximity Warning Device Performance Objective
In the case of a mobile crane such as the one used in this research a PWD should ideally warn the equipment operator and any nearby personnel when any part of the crane or a susshypended load is closer to an energized overhead electrical power line than some preselected disshytance In most cases the minimum distance will be dictated by occupational safety regulations such as the current OSHA standards that require a clearance of at least 10 ft (30 m) for power lines at voltages up to 50 kV (29 CFR 1926550) Conversely a PWD should not alarm during operation outside the desired minimum clearance distance Such ldquofalse alarmsrdquo may cause pershysonnel to question the effectiveness of the device view it as a nuisance or perhaps ignore it completely The criteria just described strictly speaking would allow operation of a crane boom directly above or below a power line as long as the specified minimum clearance is maintained Such operation however increases the chance of an accidental line contact and should be avoided [ANSI 1995] A safer and more practical alternative is to define the limit of safe operashytion as a vertical plane at the desired clearance distance horizontally from the closest power line conductor and prohibit any part of the crane or suspended load from crossing this boundary during normal operation Figure 3 shows a three-phase power line installation in cross-section and two variations of a 10-ft (30-m) recommended safe operation boundary surrounding the conductors
13 kV
Neutral
10 ft (30 m)
Minimum clearancefrom power linescomplying with 29 CFR requirements
Preferred interpretation of
10 ft (30 m)clearance distance
[ANSI 1995]
13 kV
Neutral
10 ft (30 m)
Minimum clearance from power lines complying with 29 CFR requirements
Preferred interpretation of
10 ft (30 m) clearance distance
[ANSI 1995]
Figure 3mdashMinimum safe working distances around overhead electrical power lines
6
For most tests in this evaluation a minimum clearance distance of 20 ft (61 m) from the closest phase conductor of the power lines was used as the limit of safe operation and accordshyingly the PWDs had their sensitivities adjusted so that their alarm thresholds were reached with the boom tip approximately 20 ft (61 m) from the closest phase conductor7
7For this sensitivity adjustment distance the boom was positioned by placing the crane load block directly over a mark painted on the ground 20 ft (61 m) horizontally from the closest conductor Because of the inaccuracy inhershyent in this method and the size and shape of the boom structure the actual minimum distance from the boom to the closest conductor (as subsequently measured by computer model) was usually not precisely 20 ft (61 m) The 20-ft (61-m) ldquonominalrdquo distance however was used as a reference for all evaluations since this is the target value that would be assumed as correct by a crane operator using a similar procedure to adjust PWD sensitivity in the field
This distance was chosen to allow the crane boom to continue moving toward the power lines during testing if an alarm did not activate at or before the 20-ft (61-m) limit without bringing any part of the crane closer than 10 ft (30 m) from the lines This boundary of safe operation could have been defined as a vertical plane 20 ft (61 m) from the power lines The more literal interpretation of the boundary was used however allowing a minimum distance of 20 ft (61 m) in all directions from any energized phase conductor The main implication for the performance evaluations preshysented in this report is that movement of the boom below the power lines (at 0deg elevation angle) without activating the alarms is considered acceptable PWD operation The exceptions to the 20-ft (61-m) sensitivity setting were the tests involving the crane traveling toward the lines with the PWDs set at maximum sensitivity
TEST PROGRAM
Installation of Power Line Proximity Warning Devices on the Test Crane
Both PWDs were mounted by their manufacturers on a government-owned Grove RT522 rough-terrain crane (22-st (20-mt) capacity) Typical mounting techniques and routing of wiring were altered to avoid permanent modifications to the crane but proper probe placement was maintained
Operator control panels for both units were located in the crane cab and speakers for audible alarms were located on the base section of the boom The SIGALARM Model 210 probe reel was mounted on the lower half of the boom base section and the probe routed to the boom tip on standoffs several inches above the upper left edge of the boom Probe extensions approxishymately 24 in (61 cm) long were mounted to hang freely at the boom tip to provide extra coverage in that area The two probes for the ASE Model 2100 were extended from two reels mounted on both sides of the base section of the boom and ran along each lower outside edge of the boom to the boom tip Figure 4 shows the PWD probes mounted on the crane boom
7
Figure 4mdashPWD probes on crane boom
Test Facility
Overhead Power Line Test Site
A test site specifically designed for operating mobile equipment near overhead electrical power lines was built at NIOSHndashPRL The site is a remote approximately level 5-acre (2-ha) grass-covered area with controlled access Within this area four wooden utility poles were erected along a straight line 100 ft (305 m) apart and equipped with cross arms and necessary hardware to install one or two four-wire three-phase horizontal configuration power line circuits and a three-wire vertical configuration circuit The lines can be installed in various combinations at heights up to 45 ft (137 m) and can be powered from either end of the 300-ft (914-m) instalshylation Four ldquomovablerdquo wooden utility poles were also erected at the site These 36-ft (110-m) poles set in 55-st (5-mt) reinforced concrete blocks are designed to be moved by a forklift and can be equipped with one four-wire three-phase horizontal configuration circuit The movable poles can be positioned to create a power line circuit parallel to or intersecting the lines on the four permanent poles For both sets of poles all insulators and cross arms can accommodate cirshycuits up to 25 kV using 2 AWG ACSR conductors These overhead power line installations meet standards used by Allegheny Energy Inc a large electrical utility company headquartered near Pittsburgh serving Pennsylvania Maryland West Virginia and Virginia A nonstandard
8
safety feature included on the utility poles is a nonconductive high-visibility flag line suspended level with and 10 ft (30 m) away from the power lines (on the side of crane operation) This gives the crane operator and spotters a clear indication when the crane boom or hoist ropes are 10 ft (30 m) horizontally from the power line conductors The site also has a dedicated low-resistance (3 Ω) driven-rod electrical ground bed When the overhead power lines were configshyured for a specific test any conductors not in use were removed from the utility poles
Electrical Power Supply for Tests
A portable electrical power supply was assembled to supply overhead power line circuits at the power line test site described above It can provide two independently controlled four-wire three-phase sources isolated from utility sources and is capable of 27 kV line to line The sysshytem uses a 480-V three-phase 5000-W generator feeding two parallel branches Each branch has a three-phase variable transformer capable of providing a manually adjustable 0- to 560-V output feeding a 480-V to 27-kV 2-kVA step-up transformer Each branch can serve as an independent 0- to 27-kV four-wire three-phase supply for an overhead power line circuit Four-conductor insulated portable power cables terminated with four-prong twist-lock plugs connect all 480-V components High-voltage outputs use high-voltage insulated conductors connected to power line terminations on cross arms 10 ft (30 m) above ground level A circuit breaker at the generator output and fuses at transformer primaries provide overcurrent protection for the system All components can be moved from storage and setup for operation by a small team in 30ndash40 min Figure 5 is a diagram of the power system
Variabletransformer
0 ndash 560 V output
Variabletransformer
0 ndash 560 V output
480 Vthree-phase
generator
480V - 27kV2 kVA step-uptransformer
480V - 27kV2 kVA step-uptransformer
To overheadpower line
To overheadpower line
- Y
- Y
Variabletransformer
0 ndash 560 V output
Variable transformer
0 ndash 560 V output
Variabletransformer
0 ndash 560 V output
Variable transformer
0 ndash 560 V output
480 V three-phase
generator
480V - 27kV2 kVA step-uptransformer
480V - 27kV 2 kVA step-up transformer
480V - 27kV2 kVA step-uptransformer
480V - 27kV 2 kVA step-up transformer
To overhead power line
To overhead power line
- Y
- Y
Figure 5mdashDiagram of the test-site power system
For this test program the output for each power line circuit was monitored at the step-up transformer secondary terminals using a digital multimeter and high-voltage probe to measure one phase to neutral voltage For personnel safety access to the areas surrounding the step-up transformers and high-voltage connections at ground level were restricted using construction fencing All tests using a four-wire circuit were configured with the high-voltage output groundshying conductor tied to the test site ground bed and overhead line neutral conductor as well as a butt-wrapped grounding lead on each pole Prior to testing all line-to-line voltages were verified directly on the overhead lines using a hot-stick meter employed from an aerial manlift
9
Intersecting 13 kV overhead power line installations
Crane boom at full extensionand 61O elevation angle
Distance fromcrane hoistropes topower lines
Intersecting 13 kV overhead power line installations
Distance from crane hoist ropes to power lines
Crane boom at full extension and 61O elevation angle
Data Collection Process
Data collection for this research required documenting the crane boom position relative to the energized overhead power lines for each test in order to allow evaluation of PWD performshyance This was done by determining the relative three-dimensional (3-D) positions of the power lines and boom and recording this information as a computer model from which the relevant boom to power line distances (ldquotruerdquo distances) can be extracted The 3-D information was obtained using a ldquototal stationrdquo surveying instrument which allows precise measurement of horishyzontal and vertical angles as well as slope distance from the instrument to target points Use of the instrument required precise placement of reference targets (made of a special reflective mateshyrial) on the crane boom and the overhead power line installations
Using the survey coordinates of two reference points on either (or both) sets of overhead power lines and accurate measurements of the poles and conductors a 3-D model of the test site for each power line configuration was created Then for all tests the boom positions for both sensitivity adjustments and cases of alarm activation were mapped in the same 3-D space as the power lines Each boom model was based on the survey coordinates of two reference points on the boom and detailed boom dimensions Figure 6 is an example of a computer model for an individual test With the graphical computer models of the power lines and crane boomhoist ropes mapped in the same 3-D space the distance between the boomhoist ropes and power lines is readily determined by simply defining the shortest line between potential contact points for the two and noting its length
To verify the boom to power line distances obtained from the models manual measureshyments of the horizontal boom to power line distances (ldquoobservedrdquo distances) were made for all alarm activations These were made by noting the position of the crane load hook with respect to a distance reference grid painted on the ground at the test site The zero lines for the distance reference grid were directly below the nearest phase conductors for horizontal configuration lines (at 13-kV spacing)
Figure 6mdashExample of a computer model used for analyzing crane boom position relative to overhead power lines
10
Test Procedures
The PWDs as mounted on the crane by the manufacturers were tested by operating the crane near energized overhead power lines Different test sets varied the crane boom position relative to the power lines as well as power line configuration (number of three-phase circuits pole configuration conductor arrangement voltage level and phase sequencing) Within each test set individual tests involved swinging the boom toward the lines while at predetermined combinations of crane boom extension and elevation angle and then documenting the response of each PWD Most tests specified that the crane be operated from a stationary position (chassis supported on outriggers) However several tests involved the crane approaching the power lines to simulate entering an unfamiliar work area
A typical test for operation of the crane from a stationary position began by positioning the crane adjacent to the power lines and deploying its outriggers supported on wooden blocks For tests using a single set of poles the crane chassis centerline was parallel to the power lines and approximately 30 ft (91 m) horizontally from the closest phase conductor as shown in Figure 7(a) For two sets of poles with power lines intersecting at 90deg the crane chassis center-line bisected the angle between the power lines with the boomrsquos center of rotation approxishymately 30 ft (91 m) horizontally from the closest phase conductor of each set as shown in Figure 7(b)
BoomSwing
SwingStarting
Point
Crane
Power Lines
30 ft(91 m)
BoomSwing
SwingStarting
Point
Crane
Power Lines
30 ft(91 m)
PowerLines
30 ft(91 m)
(a) (b)
Boom Swing
Swing Starting
Point
Crane
Power Lines
30 ft (91 m)
Boom Swing
Swing Starting
Point
Crane
Power Lines
30 ft (91 m)
Power Lines
30 ft (91 m)
(a) (b)
Figure 7mdashCrane locations for tests involving operation from a stationary position
PWD sensitivities were then adjusted per on-site direction from the manufacturers The criteria used for these adjustments called for the PWDs to alarm if the crane boom or hoist ropes moved to within 20 ft (61 m) of the closest phase conductor After sensitivity adjustment the boomrsquos 3-D position relative to the power lines was documented using the total station surveying instrument Notwithstanding the 20-ft (61-m) alarm requirement the manufacturers were free to specify the specific procedures for adjusting PWD sensitivities as well as how frequently the devices would be readjusted during testing
11
The crane boom was then rotated horizontally to the swing starting point as shown in Figure 7 elevated and extended per the test plan and swung toward the power lines When either PWD alarm would activate the boom was stopped and its 3-D position relative to the power lines was documented The observed distance from the boom or hoist ropes to the power lines was also estimated using a distance reference grid painted on the ground If an alarm activated at the maximum distance from the power lines (ie before the boom was moved) this position was documented If a PWD did not alarm at or before the 20-ft (61-m) limit the boom swing was continued until alarm activation occurred or until the boom or hoist ropes were 10 ft (30 m) from the power lines The boom and hoist ropes were never allowed to come closer than 10 ft (30 m) to an energized power line during testing Note that in cases where the boom elevation was 0deg the boom was swung until directly under the closest phase conductor since at this point it was still greater than 20 ft (61 m) (vertically) from the power lines Figure 8 shows the test site and crane
Figure 8mdashGrove RT522 crane on outriggers positioned adjacent to overhead power lines with boom at 50 extension and boom tip approximately level with lower set of lines
12
For tests that simulated the crane in travel configuration approaching the power lines the PWDs were adjusted to maximum sensitivity Upon activation of an alarm the crane was stopped and set up for stationary operation on outriggers at that location Tests were then conshyducted by swinging the fully extended boom toward the power lines while at different elevations
Crane Boom Position Data Analysis
Position survey data and computer modeling were used to precisely record the relative positions of the overhead power lines and crane boom for sensitivity adjustment positions and each alarm activation point during testing The criteria used to determine the true distance between the boom or hoist ropes and the power lines for each test (from the models) was based on the position of the boom and the most likely point of contact with a power line conductor For tests where the boom was at a 0deg elevation angle or where the boom tip was at power line level the true distance is the shortest distance from the tip of the boom to the closest phase conductor For tests where the boom elevation angle was at the maximum used (61deg) the true distance is the shortest distance from the hoist ropes to the closest phase conductor Consideration of power line contact by hoisted loads was beyond the scope of this research
Test Plan
Most of the tests conducted in this research quantified the influence on PWD performshyance of variations in power line configuration and changes in crane boom parameters after initial PWD sensitivity adjustment Table 1 is a listing of test sets 1 through 7 organized according to power line configuration (crane operating from a stationary position)
Table 1mdashPower line configuration detail for test sets 1 through 7
Test set
No
No of three-phase
circuits
Circuit No 1 Circuit No 2 Relationship of two power line
circuits Voltage (kV)
Configushyration
Neutral conductor
Voltage (kV)
Configushyration
Neutral conductor
1 1 13 H Yes 2 1 25 V No1 3 2 13 H Yes 13 H Yes On same poles 4 2 13 H Yes 25 H Yes On same poles 5 2 13 H Yes 25 V No1 On same poles 6 2 13 H Yes 13 H Yes Intersect at 90deg
7 2 13 H Yes 25 H Yes Intersect at 90deg H Horizontal V Vertical 1This 25-kV power line simulates a subtransmission circuit which typically would not include a neutral
conductor
Each test set was run once with the phase conductors arranged ABC with A-phase nearest the crane for horizontal lines and at the top for vertical lines and then run again with the circuit (or one of the two circuits involved) arranged CBA in order to evaluate the effect of reversing the electrical ldquosequencerdquo of the phase conductors Within each of the 14 resulting groups of tests an individual test was run for each of 8 possible crane boom configurations These
13
configurations represented all possible combinations of three boom extension lengths (minimum 50 and maximum)8 and three elevation angles (0deg boom tip at power line height and 61deg)910
8These extensions give boom lengths of 28 ft (85 m) 487 ft (148 m) and 694 ft (212 m) respectively from base pivot pin to point sheave pin 9Sixty-one degrees was the maximum elevation angle (at minimum boom length) at which the load hook was not over the crane chassis 10With the boom at ldquominimum boom lengthrdquo it could not be positioned with the ldquoboom tip at power line heightrdquo for any power line configuration used Therefore this combination was not possible
The crane load block (hoisting hook) was positioned approximately 5 ft (15 m) from the ground for sensitivity adjustments and tests The exception to the 5-ft (15-m) load block height was for the combination of maximum boom extension and 61deg elevation angle for which the hoist block was positioned 23 ft (70 m) from the ground due to insufficient hoist rope on the crane
Additional test sets were included to examine other aspects of PWD performance such as using maximum device sensitivity for the time a crane is in transit in order to alert the operator and crew that power lines are somewhere in or near an unfamiliar work area as the crane approaches Ideally this warning would be well before the crane is in close proximity to the lines Test set 8 placed the crane in a travel configuration approaching a single set of horizontal power lines with PWDs set at maximum sensitivity to determine the greatest distance at which the lines could be detected Test set 9 had the crane with PWDs again set at maximum sensishytivity approach two sets of horizontal lines intersecting at 90deg to determine whether the alarm distance was influenced by the additional set of power lines
Test set 10 examined the effect of having the crane chassis tied directly to the power sysshytemrsquos grounded neutral while operating from a stationary position Connecting an equipment chassis to ground is sometimes suggested as a means to reduce the chance of a dangerous chassis voltage in the event of an accidental power line contact or to reduce induced charges on a piece of equipment
RESULTS
The following sections present performance data for the two PWDs tested Each section lists test and sensitivity adjustment details provides a diagram of the test layout and power line configuration and presents a table showing the distances from the overhead power lines at which the PWDs alarmed for specific conditions (or notes no alarm activation) The alarm distances as noted earlier are true distances taken from the 3-D models created for each test
Test Set 1
Test set 1 used one set of horizontal 13-kV lines Sensitivity was adjusted once prior to ABC phase sequence tests (A-phase nearest crane) and once prior to CBA phase sequence tests (C-phase nearest crane) Sensitivity was adjusted with the crane parked in the test position on its outriggers the boom extended to approximately 43 ft (131 m) (62 of full extension) the boom tip elevated to approximately phase conductor level and the boom swung to a position 20 ft (61 m) from the closest conductor11 Test layout and power line configuration are shown in Figure 9 Table 2 details performance of the PWDs for test set 1
11As described earlier the distance listed for the sensitivity adjustments is the ldquonominalrdquo distance from the power lines which was determined by using the distance reference grid painted on the ground at the test site There are slight variations in the sensitivity adjustment boom lengths listed because the boom positions were approximated in the field and then later measured precisely from the survey data-based computer models
14
Phase sequence horizontal ABC with A-phase nearest crane SIGALARM Model 210 ASE Model 2100
Boom Minimum 50 Maximum Boom Minimum 50 Maximum position extension extension extension position extension extension extension
0deg 0deg No alarm No alarm No alarm No alarm No alarm No alarm elevation elevation Boom tip Boom tip 276 361 276 518 at power (1) at power (1) (84) (110) (84) (158) line level line level
61deg 194 61deg 293 486 No alarm No alarm No alarm elevation (59) Elevation (89) (148)
Phase sequence horizontal CBA with C-phase nearest crane SIGALARM Model 210 ASE Model 2100
Boom Minimum 50 Maximum Boom Minimum 50 Maximum position extension extension extension position extension extension extension
0deg 0deg No alarm No alarm No alarm No alarm No alarm No alarm elevation elevation Boom tip Boom tip 234 386 290 534 at power (1) at power (1) (71) (118) (88) (163) line level line level
61deg 61deg 287 529 No Alarm No Alarm No Alarm No alarm elevation elevation (87) (161)
1The boom tip could not be raised to power line level with the boom at minimum extension length for any of the power line configurations used therefore this combination of extension and elevation angle was not possible
Fixed Power Lines (AA)
37 ft(113 m)
13 kV
BoomSwing
SwingStarting
Point
Crane
Fixed Power Lines
30 ft(91 m)
A
A
Fixed Power Lines (AA)
37 ft (113 m)
13 kV
Boom Swing
Swing Starting
Point
Crane
Fixed Power Lines
30 ft (91 m)
A
A
Figure 9mdashTest set 1 layout and overhead power line configuration
Table 2mdashAlarm distance results for test set 1 (Distance between boom or hoist ropes and closest phase conductor in ft (m))
15
Test Set 2
Test set 2 used one set of vertical 25-kV lines Sensitivity was adjusted once prior to ABC phase sequence tests (A-phase at top) and once prior to CBA phase sequence tests (C-phase at top) Sensitivity was adjusted with the crane parked in the test position on its outriggers the boom extended to approximately 57 ft (174 m) (82 of full extension) the boom tip elevated to approximately top phase conductor level and the boom swung to a position 20 ft (61 m) from the top conductor Test layout and power line configuration are shown in Figure 10 Table 3 details performance of the PWDs for test set 2
Fixed Power Lines (AA)
45 ft(137 m)
25 kV
BoomSwing
SwingStarting
Point
Crane
Fixed Power Lines
32 ft(98 m)
A
A
Fixed Power Lines (AA)
45 ft (137 m)
25 kV
Boom Swing
Swing Starting
Point
Crane
Fixed Power Lines
32 ft (98 m)
A
A
Figure 10mdashTest set 2 layout and overhead power line configuration
16
Phase sequence vertical ABC with A-phase at top (25 kV)
SIGALARM Model 210 ASE Model 2100
Boom Minimum 50 Maximum Boom Minimum 50 Maximum position extension extension extension position extension extension extension
0deg 0deg No alarm No alarm No alarm No alarm No alarm No alarm elevation elevation
Boom tip Boom tip 317 317 at power (1) (2) at power (1) (2) (97) (97) line level line level
61deg 121 218 61deg 121 334 No alarm No alarm elevation (37) (66) elevation (37) (102)
Phase sequence vertical CBA with C-phase at top (25 kV) SIGALARM Model 210 ASE Model 2100
Boom Minimum 50 Maximum Boom Minimum 50 Maximum position extension extension extension position extension extension extension
0deg 0deg No alarm No alarm No alarm No alarm No alarm No alarm elevation elevation
Boom tip Boom tip 321 321 at power (1) (2) at power (1) (2) (98) (98) line level line level
61deg 81 283 61deg 283 No alarm No alarm No alarm elevation (25) (86) elevation (86)
1The boom tip could not be raised to power line level with the boom at minimum extension length for any of the power line configurations used therefore this combination of extension and elevation angle was not possible 2These tests were omitted in error
Table 3mdashAlarm distance results for test set 2 (Distance between boom or hoist ropes and closest phase conductor in ft (m))
Test Set 3
Test set 3 used two sets of horizontal 13-kV lines supported on the same poles Sensishytivity was adjusted once prior to tests using ABC phase sequence on both sets of lines (A-phase nearest crane for both sets) and once prior to tests using CBA phase sequence on the upper set of lines (C-phase nearest crane for upper set) Sensitivity was adjusted with the crane parked in the test position on its outriggers the boom extended to approximately 44 ft (134 m) (63 of full extension) the boom tip elevated to approximately phase conductor level for the lower set of lines and the boom swung to a position 20 ft (61 m) from the closest conductor Test layout and power line configuration are shown in Figure 11 Table 4 details performance of the PWDs for test set 3
17
Upper set of power lines ndash phase sequence horizontal ABC with A-phase nearest crane Lower set of power lines ndash phase sequence horizontal ABC with A-phase nearest crane
SIGALARM Model 210 ASE Model 2100 Boom Minimum 50 Maximum Boom Minimum 50 Maximum
position extension extension extension position extension extension extension
0deg 0deg No alarm No alarm No alarm No alarm No alarm No alarm elevation elevation Boom tip Boom tip 272 450 2350 609 at power (1) at power (1) (83) (137) (107) (186) line level line level
61deg 296 449 61deg 370 623 No alarm No alarm elevation (90) (137) elevation (113) (190) Upper set of power lines ndash phase sequence horizontal CBA with C-phase nearest crane Lower set of power lines ndash phase sequence horizontal ABC with A-phase nearest crane
SIGALARM Model 210 ASE Model 2100 Boom Minimum 50 Maximum Boom Minimum 50 Maximum
position extension extension extension position extension extension extension
0deg 0deg No alarm No alarm No alarm No alarm No alarm No alarm elevation elevation Boom tip Boom tip 2240 319 2240 384 at power (1) at power (1) (73) (97) (73) (117) line level line level
61deg 150 61deg 223 355 No alarm No alarm No alarm elevation (46) elevation (68) (108)
1The boom tip could not be raised to power line level with the boom at minimum extension length for any of the power line configurations used therefore this combination of extension and elevation angle was not possible 2Value is the observed distance due to invalid survey data for the boom position
Fixed Power Lines (AA)
37 ft(113 m)
47 ft(143 m)
13 kV
13 kV
BoomSwing
SwingStarting
Point
Crane
Fixed Power Lines
30 ft(91 m)
A
A
Fixed Power Lines (AA)
37 ft (113 m)
47 ft (143 m)
13 kV
13 kV
Boom Swing
Swing Starting
Point
Crane
Fixed Power Lines
30 ft (91 m)
A
A
Figure 11mdashTest set 3 layout and overhead power line configuration
Table 4mdashAlarm distance results for test set 3 (Distance between boom or hoist ropes and closest phase conductor in ft (m))
18
Test Set 4
Test set 4 used two sets of horizontal power lines supported on the same poles The upper set was at 25 kV the lower set was at 13 kV Sensitivity was adjusted once prior to tests using ABC phase sequence on both sets of lines (A-phase nearest crane for both sets) and once prior to tests using CBA phase sequence on the upper set of lines (C-phase nearest crane for upper set) Sensitivity was adjusted with the crane parked in the test position on its outriggers the boom extended to approximately 43 ft (131 m) (62 of full extension) the boom tip elevated to approximately phase conductor level for the lower set of lines and the boom swung to a position 20 ft (58 m) from the closest conductor Test layout and power line configuration are shown in Figure 12 Table 5 details performance of the PWDs for test set 4
Fixed Power Lines (AA)
37 ft(113 m)
47 ft(143 m)
25 kV
13 kV
BoomSwing
SwingStarting
Point
Crane
Fixed Power Lines
29 ft(88 m)
A
A
Fixed Power Lines (AA)
37 ft (113 m)
47 ft (143 m)
25 kV
13 kV
Boom Swing
Swing Starting
Point
Crane
Fixed Power Lines
29 ft (88 m)
A
A
Figure 12mdashTest set 4 layout and overhead power line configuration
19
Upper set of power lines ndash phase sequence horizontal ABC with A-phase nearest crane (25 kV) Lower set of power lines ndash phase sequence horizontal ABC with A-phase nearest crane
SIGALARM Model 210 ASE Model 2100
Boom Minimum 50 Maximum Boom Minimum 50 Maximum position extension extension extension position extension extension extension
0deg 0deg No alarm No alarm No alarm No alarm No alarm No alarm elevation elevation
Boom tip Boom tip 228 379 293 577 at power (1) at power (1) (69) (116) (89) (176) line level line level
61deg 246 2430 61deg 345 616 No alarm No alarm elevation (75) (131) elevation (105) (188)
Upper set of power lines ndash phase sequence horizontal CBA with C-phase nearest crane (25 kV) Lower set of power lines ndash phase sequence horizontal ABC with A-phase nearest crane
SIGALARM Model 210 ASE Model 2100
Boom Minimum 50 Maximum Boom Minimum 50 Maximum position extension extension extension position extension extension extension
0deg 0deg No alarm No alarm No alarm No alarm No alarm No alarm elevation elevation
Boom tip Boom tip 211 336 297 573 at power (1) at power (1) (64) (102) (91) (175) line level line level
61deg 253 408 61deg 387 620 No alarm No alarm elevation (77) (124) elevation (118) (189)
1The boom tip could not be raised to power line level with the boom at minimum extension length for any of the power line configurations used therefore this combination of extension and elevation angle was not possible 2Value is the observed distance due to invalid survey data for the boom position
Table 5mdashAlarm distance results for test set 4 (Distance between boom or hoist ropes and closest phase conductor in ft (m))
20
Test Set 5
Test set 5 used two sets of power lines supported on the same poles The upper set was a vertical configuration at 25 kV the lower set was a horizontal configuration at 13 kV Sensitivity was adjusted once prior to tests using ABC phase sequence on both sets of lines (A-phase nearest crane for horizontal set and at top for vertical set) and once prior to tests using CBA phase sequence on the upper set of lines (C-phase at top) with the lower set remaining ABC Sensishytivity was adjusted with the crane parked in the test position on its outriggers the boom extended to approximately 44 ft (134 m) (63 of full extension) the boom tip elevated to approximately phase conductor level for the lower set of lines and the boom swung to a position 20 ft (61 m) from the closest conductor Test layout and power line configuration are shown in Figure 13 Table 6 details performance of the PWDs for test set 5
Fixed Power Lines (AA)
45 ft(137 m)
25 kV
BoomSwing
SwingStarting
Point
Crane
Fixed Power Lines
30 ft(91 m)
A
A
37 ft(113 m)
13 kV
Fixed Power Lines (AA)
45 ft (137 m)
25 kV
Boom Swing
Swing Starting
Point
Crane
Fixed Power Lines
30 ft (91 m)
A
A
37 ft (113 m)
13 kV
Figure 13mdashTest set 5 layout and overhead power line configuration
21
Upper set of power lines ndash phase sequence vertical ABC with A-phase at top (25 kV) Lower set of power lines ndash phase sequence horizontal ABC with A-phase nearest crane
SIGALARM Model 210 ASE Model 2100
Boom Minimum 50 Maximum Boom Minimum 50 Maximum position extension extension extension position extension extension extension
0deg 342 0deg No alarm No alarm No alarm No alarm No alarm elevation (104) elevation
Boom tip Boom tip 494 743 418 786 at power (1) at power (1) (151) (226) (127) (240) line level line level
61deg 2522 2650 61deg 460 2650 No alarm No alarm elevation (159) (198) elevation (140) (198)
Upper set of power lines ndash phase sequence vertical CBA with C-phase at top (25 kV) Lower set of power lines ndash phase sequence horizontal ABC with A-phase nearest crane
SIGALARM Model 210 ASE Model 2100
Boom Minimum 50 Maximum Boom Minimum 50 Maximum position extension extension extension position extension extension extension
0deg 350 412 0deg 290 No alarm No alarm No alarm elevation (107) (126) elevation (88)
Boom tip Boom tip 205 311 205 311 at power (1) at power (1) (62) (95) (62) (95) line level line level
61deg 319 2636 61deg 110 511 No alarm No alarm elevation (97) (194) elevation (34) (156)
1The boom tip could not be raised to power line level with the boom at minimum extension length for any of the power line configurations used therefore this combination of extension and elevation angle was not possible 2Alarmed at swing starting point
Table 6mdashAlarm distance results for test set 5 (Distance between boom or hoist ropes and closest phase conductor in ft (m))
22
Test Set 6
Test set 6 used two separate sets of power lines intersecting at 90deg with the centerline of the crane bisecting the angle between the power lines Both sets of lines were in a horizontal configuration operating at 13 kV The lines to the cranersquos right (from the operatorrsquos perspective) were on movable poles those to the left were on fixed poles Sensitivity was adjusted once prior to tests using ABC phase sequence on both sets of lines (A-phase nearest crane for both sets) and once prior to tests using ABC phase sequence on the fixed set and CBA on the movable set Sensitivity was adjusted with the crane parked in the test position on its outriggers the boom extended to 42 ft (128 m) (61 of full extension) the boom tip elevated to approximately phase conductor level for the lines on the left (fixed lines) and the boom swung left to a position 20 ft (61 m) from the closest conductor Test layout and power line configuration are shown in Figure 14 Table 7 details performance of the PWDs for test set 6
Fixed PowerLines (AA)
37 ft(113 m)
13 kV
BoomSwing
SwingStarting
Point
Crane
Fixed Power Lines
30 ft (91 m)
A
A 13 kV
Movable PowerLines (BB)
35 ft(107 m)
MovablePowerLines
B B
30 ft(91 m) Fixed Power
Lines (AA)
37 ft (113 m)
13 kV
Boom Swing
Swing Starting
Point
Crane
Fixed Power Lines
30 ft (91 m)
A
A 13 kV
Movable Power Lines (BB)
35 ft (107 m)
Movable Power Lines
B B
30 ft (91 m)
Figure 14mdashTest set 6 layout and overhead power line configuration
23
Fixed power lines ndash phase sequence horizontal ABC with A-phase nearest crane (left swing) Movable power lines ndash phase sequence horizontal ABC with A-phase nearest crane (right swing)
SIGALARM Model 210 ASE Model 2100
Boom Minimum 50 Maximum Boom Minimum 50 Maximum position extension extension extension position extension extension extension
Left swing Left swing Left swing Left swing Left swing Left swing No alarm No alarm No alarm No alarm No alarm No alarm0deg 0deg
elevation elevation Right swing Right swing Right swing Right swing Right swing Right swing No alarm No alarm No alarm No alarm No alarm No alarm
Left swing Left swing Left swing Left swing 293 424 293 2702 Boom tip Boom tip (89) (129) (89) (214) at power (1) at power (1)
Right swing Right swing Right swing Right swing line level line level 180 336 353 2726 (55) (102) (108) (221)
Left swing Left swing Left swing Left swing Left swing Left swing 366 2534 366 2534 No alarm No alarm 61deg (112) (163) 61deg (112) (163)elevation Right swing elevation Right swing Right swing Right swing Right swing Right swing 2534 390 2534 No alarm No alarm No alarm (163) (119) (163)
Fixed power lines ndash phase sequence horizontal CBA with C-phase nearest crane (left swing) Movable power lines ndash phase sequence horizontal ABC with A-phase nearest crane (right swing)
SIGALARM Model 210 ASE Model 2100
Boom Minimum 50 Maximum Boom Minimum 50 Maximum position extension extension extension position extension extension extension
Left swing Left swing Left swing Left swing Left swing Left swing No alarm No alarm No alarm No alarm No alarm No alarm0deg 0deg
elevation Right swing elevation Right swing Right swing Right swing Right swing Right swing 298 298 No alarm No alarm No alarm No alarm (91) (91) Left swing Left swing Left swing Left swing
291 387 291 485 Boom tip Boom tip (89) (118) (89) (148) at power (1) at power (1) Right swing Right swing Right swing Right swing line level line level 144 840 320 512
(44) (256) (98) (156) Left swing Left swing Left swing Left swing Left swing Left swing 262 419 No alarm No alarm No alarm No alarm 61deg 61deg (80) (128)
elevation elevation Right swing Right swing Right swing Right swing Right swing Right swing 278 408 No alarm No alarm No alarm No alarm (85) (124)
1The boom tip could not be raised to power line level with the boom at minimum extension length for any of the power line configurations used therefore this combination of extension and elevation angle was not possible 2Alarmed at swing starting point
Table 7mdashAlarm distance results for test set 6 (Distance between boom or hoist ropes and closest phase conductor in ft (m))
24
Test Set 7
Test set 7 used two separate sets of power lines intersecting at 90deg with the centerline of the crane bisecting the angle between the power lines Both sets of lines were in a horizontal configuration The lines to the cranersquos right (from the operatorrsquos perspective) were on movable poles and operating at 13 kV those to the left were on fixed poles and operating at 25 kV Sensishytivity was adjusted once prior to tests using ABC phase sequence on both sets of lines (A-phase nearest crane for both sets) and once prior to tests using ABC phase sequence on the fixed set and CBA on the movable set (C-phase nearest crane) Sensitivity was adjusted with the crane parked in the test position on its outriggers the boom extended to approximately 44 ft (134 m) (63 of full extension) the boom tip elevated to approximately phase conductor level for the lines on the right (13-kV movable lines) and the boom swung right to a position 20 ft (61 m) from the closest conductor Test layout and power line configuration are shown in Figure 15 Table 8 details performance of the PWDs for test set 7
Fixed PowerLines (AA)
37 ft(113 m)
25 kV
BoomSwing
SwingStarting
Point
Crane
Fixed Power Lines
29 ft (88 m)
A
A 13 kV
Movable PowerLines (BB)
35 ft(107 m)
MovablePowerLines
B B
30 ft(91 m) Fixed Power
Lines (AA)
37 ft (113 m)
25 kV
Boom Swing
Swing Starting
Point
Crane
Fixed Power Lines
29 ft (88 m)
A
A 13 kV
Movable Power Lines (BB)
35 ft (107 m)
Movable Power Lines
B B
30 ft (91 m)
Figure 15mdashTest set 7 layout and overhead power line configuration
25
Fixed power lines ndash phase sequence horizontal ABC with A-phase nearest crane (left swing) (25 kV) Movable power lines ndash phase sequence horizontal ABC with A-phase nearest crane (right swing)
SIGALARM Model 210 ASE Model 2100
Boom Minimum 50 Maximum Boom Minimum 50 Maximum position extension extension extension position extension extension extension
Left swing Left swing Left swing Left swing Left swing Left swing 297 506 No alarm No alarm No alarm No alarm0deg (91) (154) 0deg elevation elevation Right swing Right swing Right swing Right swing Right swing Right swing
No alarm No alarm No alarm No alarm No alarm No alarm
Left swing Left swing Left swing Left swing 2542 2709 2542 2709 Boom tip Boom tip (165) (216) (165) (216) at power (1) at power (1)
Right swing Right swing Right swing Right swing line level line level 2569 2738 2569 2738 (173) (225) (173) (225)
Left swing Left swing Left swing Left swing Left swing Left swing 265 2447 2528 2447 2528 No alarm 61deg (81) (136) (161) 61deg (136) (161)elevation Right swing Right swing elevation Right swing Right swing Right swing Right swing 2453 2551 2453 2551 No alarm No alarm (138) (168) (138) (168)
Fixed power lines ndash phase sequence horizontal ABC with A-phase nearest crane (left swing) (25 kV) Movable power lines ndash phase sequence horizontal CBA with C-phase nearest crane (right swing)
SIGALARM Model 210 ASE Model 2100
Boom Minimum 50 Maximum Boom Minimum 50 Maximum position extension extension extension position extension extension extension
Left swing Left swing Left swing Left swing Left swing Left swing 430 2652 2807 419 638 No alarm 0deg (131) (199) (246) 0deg (128) (195)elevation Right swing Right swing elevation Right swing Right swing Right swing Right swing 2652 2797 No alarm No alarm No alarm No alarm (199) (243)
Left swing Left swing Left swing Left swing 2545 2716 2542 2716 Boom tip Boom tip (166) (218) (165) (218) at power (1) at power (1)
Right swing Right swing Right swing Right swing line level line level 2562 2733 2562 2733 (171) (223) (171) (223)
Left swing Left swing Left swing Left swing Left swing Left swing 2368 2439 2520 240 2439 2520
61deg (112) (134) (159) 61deg (73) (134) (159)elevation Right swing Right swing elevation Right swing Right swing Right swing Right swing 2446 2529 2446 2529 No alarm No alarm (136) (161) (136) (161)
1The boom tip could not be raised to power line level with the boom at minimum extension length for any of the power line configurations used therefore this combination of extension and elevation angle was not possible 2Alarmed at swing starting point
Table 8mdashAlarm distance results for test set 7 (Distance between boom or hoist ropes and closest phase conductor in ft (m))
26
For several specific cases in test set 7 while the boom was swinging toward the lines with the PWDs in an alarm state the alarms would cease and then resume closer to the lines For the SIGALARM Model 210 with CBA phase sequence on the movable lines the right swing tests combining 0deg elevation with 50 and 100 extensions had a cessation of the alarm during the swing and resumption at 278 ft (85 m) and 342 ft (104) respectively This cessation also occurred for the ASE Model 2100 for right swing tests combining the ldquoboom tip at line heightrdquo elevation with 50 and 100 extensions with the alarm resuming at 239 ft (73 m) and 333 ft (101 m) respectively This behavior was noted only in these cases but not all tests were conshytinued past the point of alarms to check for alarm cessation
Test Set 8
Test set 8 used one set of horizontal 13-kV lines with ABC phase sequence (A-phase nearest crane) Both PWDs were adjusted to maximum sensitivity (alarm activation at greatest distance from power lines) With the boom at minimum extension and elevation and centered over the front of the crane (travel configuration) the crane was driven toward the power lines at an approach angle of 90deg 45deg from the right and 45deg from the left At the point of alarm activashytion the crane was stopped and set up on outriggers and the boom was extended to maximum length and rotated to the swing starting point Tests were then conducted by swinging the boom toward the power lines Test layout and power line configuration are shown in Figure 16
Fixed Power Lines (AA)
37 ft(113 m)
13 kV
BoomSwing
SwingStarting
Point
Fixed Power Lines
Crane
A
A
90O 45O Right45O Left
Fixed Power Lines (AA)
37 ft (113 m)
13 kV
Boom Swing
Swing Starting
Point
Fixed Power Lines
Crane
A
A
90O 45O Right45O Left
Figure 16mdashTest set 8 layout and overhead power line configuration
With the crane traveling toward the power lines the SIGALARM Model 210 adjusted to maximum sensitivity alarmed at 820 ft (250 m) 834 ft (254 m) and 751 ft (229 m) from the power lines for 90deg 45deg right and 45deg left approaches respectively (measured perpendicular to the power lines) When the crane was set up at the 90deg approach alarm point and the fully extended boom was swung left toward the lines at 0deg elevation boom tip at line height and 61deg elevation the Model 210 alarmed at 1475 ft (450 m) 1656 ft (505 m) and 1240 ft (381 m) respectively Based on these results boom swing tests were omitted for the 45deg approach alarm points
With the crane traveling toward the power lines the ASE Model 2100 at maximum sensishytivity did not alarm while approaching the power lines The tests were terminated when the crane boom was directly under the lines
27
Test Set 9
Test set 9 used two sets of horizontal 13-kV lines with ABC phase sequence (A-phase nearest crane) intersecting at 90deg Both PWDs were adjusted to maximum sensitivity (alarm actishyvation at greatest distance from power lines) With the boom at minimum extension and elevashytion and centered over the front of the crane the crane was driven toward the power lines on a path bisecting the angle between the lines At the point of alarm activation the crane was stopped and set up on outriggers and the boom was extended to maximum length and rotated to the swing starting point Tests were then conducted by swinging the boom toward the power lines Test layout and power line configuration are shown in Figure 17
Fixed PowerLines (AA)
37 ft(113 m)
13 kV
BoomSwing
SwingStarting
Point
Crane
Fixed Power Lines A
A 13 kV
Movable PowerLines (BB)
35 ft(107 m)
MovablePowerLines
B B
Fixed Power Lines (AA)
37 ft (113 m)
13 kV
Boom Swing
Swing Starting
Point
Crane
Fixed Power Lines A
A 13 kV
Movable Power Lines (BB)
35 ft (107 m)
Movable Power Lines
B B
Figure 17mdashTest set 9 layout and overhead power line configuration
With the crane traveling toward the power lines the SIGALARM Model 210 adjusted to maximum sensitivity alarmed at 88 ft (268 m) from both sets of power lines (observed distance measured perpendicular to both sets of power lines) When the crane was set up at this location and the fully extended boom was swung right toward the portable power lines the Model 210 alarmed at 1542 ft (470 m) and 1362 ft (415 m) for the boom tip at power line height and 61deg elevation respectively No data were obtained for 0deg boom elevation
With the crane traveling toward the power lines the ASE Model 2100 adjusted to maxishymum sensitivity alarmed at 20 ft (61 m) from the power lines When the crane was set up at this location and the fully extended boom was swung right toward the portable power lines the Model 2100 alarmed at 701 ft (214 m) 623 ft (190 m) and 527 ft (161 m) for 0deg elevation boom tip at power line height and 61deg elevation respectively
Test Set 10
Connecting an equipment chassis to ground is sometimes suggested as a means to reduce the chance of a dangerous chassis voltage in the event of an accidental power line contact or to avoid an induced charge on a piece of equipment Test set 10 examined the effect on PWD pershyformance of connecting the crane chassis directly to the grounded power system neutral These tests used one set of horizontal 13-kV lines with ABC phase sequence (A-phase nearest crane) Sensitivity was adjusted once prior to testing with the crane parked in the test position on its outshyriggers the boom extended to 46 ft (140 m) (66 of full extension) the boom tip elevated to
28
approximately phase conductor level and the boom swung to a position 20 ft (61 m) from the closest conductor The same eight boom positions were used as in test sets 1 through 7 One complete series was done with the crane chassis tied directly to the grounded power system neutral then those tests were duplicated with the chassis disconnected from the system neutral (initial sensitivity adjustments were left in place for both series of tests)
For both PWDs the tests showed no significant difference in the alarm distances between the series with and without the crane chassis tied directly to the power system ground
SUMMARY OF PROXIMITY WARNING DEVICE PERFORMANCE
A review of the foregoing test results clearly illustrates that many often interrelated factors affect performance of PWDs One of the most important factors is sensitivity adjustment Both PWD manufacturers cooperating in this research adjusted the sensitivity of their devices in the same manner for each set of tests This adjustment used a relatively consistent boom position and configuration and a nominal distance of approximately 20 ft (61 m) from the power lines This adjustment was performed only twice for each of test sets 1 through 7 as detailed earlier While this approach did not optimize PWD performance for any given test it had the advantage of allowing comparisons of the effects of changes in power line and boom configurations Most of the performance assessments presented in this section highlight and rank the effects of these factors on the accuracy and reliability of the two PWDs tested
Power Line Configurations
Test sets 1 through 7 examined the effects of differences in power line configurations on PWD performance and included 284 individual tests12
12The number 284 is based on counting the same test run for each PWD as two tests
Of these 284 tests 108 had a boom elevashytion of 0deg (boom approximately level with the ground) which allowed the boom to be swung below the power lines without coming within 20 ft (61 m) (true distance) of any phase conshyductor (20 ft (61 m) was the nominal distance used for PWD sensitivity adjustments) As disshycussed earlier operating with the boom directly above or below overhead power lines can be very hazardous and should normally be avoided For these 108 tests however the horizontal boom passing below the power lines without triggering an alarm is considered acceptable PWD operation since the boom was never closer than 20 ft (61 m) (true distance) from an energized conductor Of these 108 cases 15 caused a PWD alarm which by the criteria just described conshystitutes an ldquoearly alarmrdquo The remaining 176 tests (those with the boom elevated such that the tip is at power line height or elevated to 61deg) should have all resulted in PWD alarms ideally at approximately 20 ft (61 m) from the closest phase conductor Of these 176 tests 148 produced alarms The 28 remaining tests that did not cause an alarm were stopped when the boom was 10 ft (30 m) from the power lines Of the 148 alarm activations 140 were early alarms (more than 20 ft (61 m) from power lines) and 8 were ldquolate alarmsrdquo (less than 20 ft (61 m) and more than 10 ft (30 m) from the lines)
Table 9 summarizes PWD alarm performance based on different power line configurashytions for test sets 1 through 7 The table lists the number of no alarm early alarm and late alarm cases for each test set as well as the average of alarm distance deviations from 20 ft (61 m) (magnitudes) for the tests that caused alarm activations
29
Test set No and power line configuration
SIGALARM Model 210
ASE Model 2100
Alarm record 1 (a) No alarm
1 (b) Late alarm 2 (c) Early alarm
Alarm distance
deviation3
ft (m)
Alarm record 1 (a) No alarm
1 (b) Late alarm 2 (c) Early alarm
Alarm distance
deviation3
ft (m)
1 One horizontal line set 13 kV
(a) 5 of 10 (b) 1 of 10 (c) 4 of 16
94 (29)
(a) 2 of 10 (b) 0 of 10 (c) 8 of 16
203 (62)
2 One vertical line set 25 kV
(a) 2 of 8 (b) 2 of 8 (c) 4 of 14
90 (27)
(a) 3 of 8 (b) 1 of 8 (c) 4 of 14
106 (32)
3 Two horizontal line sets
on same poles 13 kV13 kV
(a) 3 of 10 (b) 1 of 10 (c) 6 of 16
126 (38)
(a) 2 of 10 (b) 0 of 10 (c) 8 of 16
194 (59)
4 Two horizontal line sets
on same poles 25 kV13 kV
(a) 2 of 10 (b) 0 of 10 (c) 8 of 16
135 (41)
(a) 2 of 10 (b) 0 of 10 (c) 8 of 16
275 (84)
5
Two line sets one vertical over one horizontal on same poles 25 kV13 kV
(a) 2 of 10 (b) 0 of 10 (c) 11 of 16
275 (84)
(a) 2 of 10 (b) 1 of 10 (c) 8 of 16
239 (73)
6
Two horizontal line sets crossing at 90deg 13 kV13 kV
Left swing
(a) 4 of 10 (b) 0 of 10 (c) 6 of 16
182 (55)
(a) 2 of 10 (b) 0 of 10 (c) 8 of 16
219 (67)
6
Two horizontal line sets crossing at 90deg 13 kV13 kV Right swing
(a) 5 of 10 (b) 2 of 10 (c) 4 of 16
238 (73)
(a) 2 of 10 (b) 0 of 10 (c) 9 of 16
227 (69)
7
Two horizontal line sets crossing at 90deg 25 kV13 kV Left swing toward
25-kV lines
(a) 0 of 10 (b) 0 of 10 (c) 15 of 16
356 (109)
(a) 1 of 10 (b) 0 of 10 (c) 11 of 16
345 (105)
7
Two horizontal line sets crossing at 90deg 25 kV13 kV Right swing toward
13-kV lines
(a) 2 of 10 (b) 0 of 10 (c) 10 of 16
432 (132)
(a) 2 of 10 (b) 0 of 10 (c) 8 of 16
373 (114)
1The denominator in this entry refers to tests in the category listed where an alarm should have occurred at approximately 20 ft (61 m) from the power lines 2The denominator in this entry refers to all tests in the category listed 3Deviation refers to the average of the magnitudes for (true alarm distance ndash 20 ft (61 m)) where 20 ft (61 m) is the nominal distance used for sensitivity adjustments The exception is for tests with 0deg boom elevation where the deviation is the horizontal distance from the boom to the closest phase conductor at the point of alarm activation
Table 9mdashSummary of PWD alarm performance based on power line configuration
30
Test set No and power line configuration
Alarm distance deviation1 ft (m) (Boom configuration boom tip at power line level and
boom extension at 50)
SIGALARM Model 210 ASE Model 2100
1 One horizontal line set 13 kV 6 (18)
9 (27)
2 One vertical line set 25 kV ND ND
3 Two horizontal line sets on same poles 13 kV13 kV
6 (18)
10 (31)
4 Two horizontal line sets on same poles 25 kV13 kV
8 (24)
11 (34)
5 Two line sets one vertical over one horizontal on same poles 25 kV13 kV
15 (46)
12 (37)
6 Two horizontal line sets crossing at 90deg 13 kV13 kV
Left swing
9 (27)
9 (27)
6 Two horizontal line sets crossing at 90deg 13 kV13 kV Right swing
4 (12)
14 (43)
7 Two horizontal line sets crossing at 90deg 25 kV13 kV Left swing toward 25-kV lines
35 (107)
34 (104)
7 Two horizontal line sets crossing at 90deg 25 kV13 kV
Right swing toward 13-kV lines
37 (113)
37 (113)
ND No data 1Deviation refers to the average of the magnitudes for (true alarm distance ndash 20 ft (61 m)) where 20 ft (61 m) is the nominal distance used for sensitivity adjustments
Table 10 summarizes PWD alarm performance based on different power line configurashytions for test sets 1 through 7 when analysis was limited only to tests where the boom extension was at 50 and the boom elevation was such that the tip was approximately at power line level This configuration approximated the general position used for sensitivity adjustments so the performance data do not include the adverse effects of having the boom fully retracted andor at 0deg elevation (usually resulting in no alarm) or at full extension andor 61deg elevation (often causshying early alarms)
Table 10mdashSummary of PWD alarm performance based on power line configuration when analysis is limited only to tests where the boom extension was at 50
and the boom elevation was such that the tip was approximately at power line level
In analyzing the foregoing data no distinct pattern emerges with respect to PWDs failing to alarm or alarming late based only on the influence of power line configuration An examinashytion of the deviations in alarm distance however for the cases where the devices did alarm shows that accuracy was best for simple single-circuit installations (45ndash100 average devishyation) but degraded somewhat for multiple circuits on the same poles (65ndash138 average
31
deviation) This degradation was slightly greater for installations with different voltage levels andor both vertical and horizontal conductor arrangements Performance degraded further for crane operation between two intersecting power line installations (90ndash215 average devishyation) The worst accuracy was associated with intersecting line installations at different voltages
When analysis is limited to only the data from tests where the boom position approxishymated sensitivity adjustment conditions (Table 10) PWD accuracy displays a pattern similar to that in the results for all boom positions In the limited data case however PWD performance seemed to be more sensitive to and adversely affected by the presence of two different voltage levels near the crane
Another behavior seen in the data is the tendency of the SIGALARM PWD to be more accurate when swinging left versus right with the crane positioned between intersecting power line sets This may be due to placement of the SIGALARM probe on the left side of the boom
Crane Boom Configurations
Test sets 1 through 7 were also used to examine the effects of different crane boom posishytions on PWD performance This evaluation included the 284 individual tests described previshyously of which 108 tests with 0deg boom should have produced no alarm and the remaining 176 should have ideally caused the PWDs to alarm at approximately 20 ft (61 m) from the power lines Table 11 details the results for these tests when grouped according to boom angle and boom extension The table lists the number of no alarm early alarm and late alarm cases for each boom parameter individually as well as the average of alarm distance deviations from 20 ft (61 m) (magnitudes) for the tests that caused alarm activations
32
Table 11mdashSummary of PWD alarm performance based on crane boom elevation angle or extension
SIGALARM Model 210 ASE Model 2100
Alarm record Alarm Alarm record Alarm Crane boom parameter 1 1 (a) No alarm distance (a) No alarm distance 1 1 (b) Late alarm deviation3 (b) Late alarm deviation3
2 2 (c) Early alarm ft (m) (c) Early alarm ft (m) (a) NA (a) NA 405 285 0deg boom elevation (b) NA (b) NA (123) (87) (c) 11 of 54 (c) 4 of 54
Boom elevation placing boom (a) 0 of 34 (a) 0 of 34 224 275 tip approximately level with (b) 2 of 34 (b) 0 of 34 (68) (84) power lines (c) 32 of 34 (c) 34 of 34 (a) 25 of 54 (a) 18 of 54 207 226 61deg boom elevation (b) 4 of 54 (b) 2 of 54 (63) (69) (c) 25 of 54 (c) 34 of 54
Minimum boom extension (a) 16 of 18 (a) 17 of 18 Boom length 28 ft (85 m) from 187 40 (b) 0 of 18 (b) 0 of 18 base pivot pin to point sheave (57) (12) (c) 3 of 36 (c) 1 of 36 pin 50 boom extension (a) 4 of 34 (a) 1 of 34 Boom length 487 ft (148 m) 175 166 (b) 6 of 34 (b) 2 of 34 from base pivot pin to point (53) (51) (c) 28 of 52 (c) 32 of 52 sheave pin 100 boom extension (a) 5 of 36 (a) 0 of 36 Boom length 694 ft (212 m) 311 319 (b) 0 of 36 (b) 0 of 36 from base pivot pin to point (95) (97) (c) 37 of 54 (c) 39 of 54 sheave pin
NA Not applicable 1The denominator in this entry refers to tests in the category listed where an alarm should have occurred at approximately 20 ft (61 m) from the power lines 2The denominator in this entry refers to all tests in the category listed 3Deviation refers to the average of the magnitudes for (true alarm distance ndash 20 ft (61 m)) where 20 ft (61 m) is the nominal distance used for sensitivity adjustments The exception is for tests with 0deg boom elevation where the deviation is the horizontal distance from the boom to the closest phase conductor at the point of alarm activation
Based on the results presented in Table 11 the PWDs were most likely to fail to alarm when the crane boom was operated at minimum extension (89ndash94 failed to alarm) andor at 61deg elevation angle (33ndash46 failed to alarm) For the tests where the devices did alarm the accuracy was poorest at 100 boom extension (160 average deviation) andor 0deg boom elevashytion (145ndash205 average deviation)
33
Other Factors
Use of a PWD as an Early Warning Device
Test sets 8 and 9 emulated the use of a PWD to provide an ldquoearly warningrdquo of a power line(s) for a crane traveling into an unfamiliar work area With the crane in travel configuration and both PWDs set at maximum sensitivity the SIGALARM Model 210 alarmed at 75ndash82 ft (229ndash250 m) from a single set of 13-kV power lines (depending on approach angle) and 88 ft (268 m) from two intersecting sets of 13-kV power lines These alarm distances should be suffishycient for an operator to take preventive measures before the crane is in a position from which it could contact nearby power lines The ASE Model 2100 allowed the crane in travel configurashytion to approach and travel under the single set of 13-kV lines without alarm activation but did alarm at a point 20 ft (61 m) from the two intersecting sets of 13-kV power lines
Effect of Connecting the Crane Chassis to a Grounded Power System Neutral
Test set 10 examined the effect of directly connecting the crane chassis to the solidly grounded neutral of a three-phase overhead power line system (all other testing had no delibershyate direct connection of the chassis to the power system neutral) For the test conditions used the PWDs showed no significant difference in performance due to connection of the crane chassis to a grounded power system neutral
Effect of Multiple Independent Power Line Circuits
Several tests under test set 7 created conditions under which PWD alarm activation would cease and then resume during one continuous swing of the boom toward a set of power lines This behavior was documented for two power line sets intersecting at 90deg operating at different voltages and having opposite phase sequencing PWD sensitivities were adjusted at 20 ft (61 m) from the lower voltage lines and the boom swing (wherein the alarm dropout occurred) was toward the lower voltage lines while simultaneously moving away from the higher voltage lines While this behavior was not thoroughly investigated during this research the sevshyeral cases in which it was noted clearly illustrate that PWD performance can be compromised when a crane is simultaneously exposed to electric fields from multiple independent overhead power line circuits
Effect of Power Line Phase Sequence
In test sets 1 through 7 one varied parameter was the phase sequence for the three-phase circuit involved or for one of two circuits when two sets of power lines were used This is an important issue since there is no convention in distribution power line construction standards for the relative position of specific phases in a three-phase overhead line installation and any effect of phase sequence on PWD performance will be random For test sets 1 through 7 tests were run with the sequence as ABC on all circuits with A-phase nearest the crane (or with A at the top for a vertical conductor arrangement) The tests were then run again with the phase sequence reversed (CBA) either on the one circuit involved or on one of two circuits used Table 12 details the variations in PWD accuracy due to introduction of CBA phase sequence
34
Test set No and power line configuration
Change in PWD alarm distance deviation due to 1 introduction of CBA phase sequence
SIGALARM Model 210 ASE Model 2100
1 One horizontal line set 13 kV 16 increase 7 increase
2 One vertical line set 25 kV 31 increase 7 decrease
3 Two horizontal line sets on same poles 13 kV13 kV 47 decrease 60 decrease
4 Two horizontal line sets on same poles 25 kV13 kV 25 decrease 3 increase
5 Two line sets one vertical over one horizontal on same poles 25 kV13 kV 41 decrease 63 decrease
6 Two horizontal line sets crossing at 90deg 13 kV13 kV
Left swing 36 decrease 36 decrease
6 Two horizontal line sets crossing at 90deg 13 kV13 kV Right swing
36 increase 39 decrease
7 Two horizontal line sets crossing at 90deg 25 kV13 kV Left swing toward 25-kV lines
40 increase 10 increase
7 Two horizontal line sets crossing at 90deg 25 kV13 kV
Right swing toward 13-kV lines 29 increase 2 decrease
1Change in alarm distance deviation was calculated as ((change in average of alarm distance deviation magnitudes for tests with CBA phase sequence divide average of alarm distance deviation magnitudes for tests with ABC phase sequence) times 100) Deviation was defined as follows (true alarm distance minus 20 ft (61 m)) for tests producing alarms (except tests with 0deg boom elevation) or the horizontal distance from the boom to the closest phase conductor for tests with 0deg boom elevation or 10 ft (30 m) for tests that should have caused an alarm but did not (In the last case the boom swing was stopped 10 ft (30 m) from the closest phase conductor when no alarm occurred) See ldquoResultsrdquo section for details on reversal of three-phase sequence for each test configuration
Table 12mdashSummary of PWD alarm performance changes due to reversal of power line phase sequence
Results in Table 12 indicate that the PWDs tested were normally more accurate when two power line circuits on the same poles had opposite phase sequences compared to the same cirshycuits with matching sequences This was also the pattern for intersecting power line circuits at the same voltage (notwithstanding the SIGALARMrsquos poorer performance for right swings) Opposite phase sequence however was more likely to degrade accuracy for intersecting power line circuits operating at different voltages
Sensitivity Adjustments
Manufacturerrsquos literature for the SIGALARM Model 210 recommends that if the device is to be used as a ldquoproximity warning devicerdquo as opposed to an ldquoautomatic early power line warning devicerdquo the device should be ldquocalibratedrdquo (sensitivity-adjusted) with the boom retracted
35
to the minimum length expected to be used and positioned at a distance from the power lines at least twice that required by 29 CFR or state regulations The literature adds that if a specific boom extension is to be used for an extended period the device should be calibrated with the boom at that length [Allied Safety Systems LLC 2008] Manufacturerrsquos literature for the ASE Model 2200 (similar to the Model 2100 used in this testing) recommends that the ldquosetpointrdquo be selected based on electric field strength with the boom at approximately 45deg elevation the boom tip approximately 10 ft (30 m) higher than power line level and a minimum distance from the nearest conductor of no less than 10 ft (30 m) [Allied Safety Engineering 2008]
Sensitivity adjustment of PWDs is an issue that directly affects the practical utility of these devices The test results detailed in this report clearly reveal that many factors can degrade the performance of the PWDs Foremost among these is change in boom length and elevation angle after a sensitivity adjustment has been made As a result selecting the boom position for sensitivity adjustment and more importantly recognizing when sensitivity should be readjusted become important decisions for the user of either PWD tested For crane operation that involves frequent changes in crane position andor boom and load configuration frequent PWD sensishytivity adjustments can improve performance Frequent readjustments however could reach a point where it is a distraction and annoyance to the operator and crew Ultimately a decision must be reached that balances both PWD accuracy and practicality without compromising pershysonnel safety
RECOMMENDATIONS FOR FUTURE RESEARCH
Results from this research indicate that several issues need further investigation PWD performance should be evaluated for crane operation involving only small changes in boom length (less than plusmn 5 ft (15 m) and boom elevation angle (less than plusmn 8deg) This may be a more accurate representation of ldquotypicalrdquo crane operation in the field Two specific areas that warrant more study are crane operation near multiple independent overhead power line circuits and anomalies associated with power line circuit phase sequence reversal Both of these factors can have an adverse and from the operatorrsquos perspective unpredictable effect on PWD performance In addition research should be conducted to develop and evaluate PWD technologies that can avoid the limitations of electric field measurement that have been highlighted in this report
REFERENCES
Allied Safety Engineering [2008] Proximity warning device ASE model 2200 [httpalliedsafetyengcommode=pwd] Date accessed May 2008 Allied Safety Systems LLC [2008] SIGALARM [httpwwwsigalarminccom sigalarmhtm] Date accessed May 2008
ANSI [1995] American national standard for mobile and locomotive cranes New York American National Standards Institute ANSIASME B305
Cawley JC Homce GT [2003] Occupational electrical injuries in the United States 1992ndash1998 and recommendations for safety research J Safety Res 34(3)241ndash248
CFR Code of federal regulations Washington DC US Government Printing Office Office of the Federal Register
Hipp JE Henson FD Martin PE Phillips GN [1980] Evaluation of proximity warning devices Phase I interim report San Antonio TX Southwest Research Institute pp 11ndash13 US Bureau of Mines contract No J0188082 NTIS No PB 80-144413
36
APPENDIX AmdashLIST OF COOPERATORS
Below is a list of the cooperators involved in developing the test plan for the performance evaluation of overhead electrical power line PWDs described in this report
bull Allied Safety Systems LLC (SIGALARM) (PWD manufacturer) Lance Burney bull Allied Safety Engineering (PWD manufacturer) Irvin Nickerson bull Association of Equipment Manufacturers Richard Dressler bull International Union of Operating Engineers AFL-CIO Emmett Russell bull Center for Construction Research and Training (formerly known as the Center to Protect Workersrsquo Rights) Michael McCann PhD CIH bull Occupational Safety and Health Administration Kenneth Klouse bull Zachry Construction Corp Joseph Collins bull LMK Engineers (NIOSH contractor) Jan Shingler PE Joseph Deane PE and George Gehring PE
37
Delivering on the Nationrsquos promise safety and health at work for all people through research and prevention
To receive NIOSH documents or more information about occupational safety and health topics contact NIOSH at
1ndash800ndashCDCndashINFO (1ndash800ndash232ndash4636) TTY 1ndash888ndash232ndash6348 e-mail cdcinfocdcgov
or visit the NIOSH Web site at wwwcdcgovniosh
For a monthly update on news at NIOSH subscribe to NIOSH eNews by visiting wwwcdcgovniosheNews
DHHS (NIOSH) Publication No 2009ndash110
SAFER bull HEALTHIER bull PEOPLEtrade

6
sensitivity adjustment (referred to as ldquocalibrationrdquo in the Model 210 manual) power and test switches and status indicator lights 6
Installation of the Model 210 for this research comprised an unshielded jacketed twisted pair cable for the probe When not serving as a means to inject a test signal the second conductor in the probe is simply an extension of the antenna conductor since it is connected to the antenna conductor at the tip of the crane boom The Model 210 can use any of several different cable types as a probe as described in the installation manual [Allied Safety Systems LLC 2008]
In operation the Model 210 automatically adjusts to its maximum sensitivity when powered on The sensitivity is set to the desired level by first adjusting the coarse and then fine sensitivity adjustments and when in alarm condition the unit emits a loud repetitive chirping signal When calibrated by the manufacturer at 20 ft (61 m) from the power line during testing the alarm rate was approximately two chirps per second When well beyond 20 ft (61 m) from the power lines the Model 210 produced no chirping As the electric field strength increased during boom movement the chirp began and its rate increased A rate of about two chirps per second indicated that the field strength measured by the device was equivalent to that during calibration
Figure 1mdashSIGALARM Model 210 control unit
4
Allied Safety Engineering Model 2100
The ASE Model 2100 was a microprocessor-based power line PWD developed by Allied Safety Engineering The device tested was a preproduction unit very similar to the Model 2200 on Allied Safety Engineeringrsquos Web site at the time of this writing [Allied Safety Engineering 2008] The ASE Model 2100 consisted of a cab-mounted remote panel (main control module) to which two probes (antennas) and an operator panel were connected The unit could drive multishyple external alert devices The probes consisted of two insulated conductors positioned one on each side of the boom and deployed from two automatically retracting reels The operator panel provided an LCD display of field strength sensitivity adjustments alarm status and other system information as well as several pushbuttons to allow operator input and control Figure 2 shows the Model 2100 remote and operator panels
Sensitivity was adjusted by selecting a field strength ldquoset pointrdquo when the boom was posishytioned at the desired distance from the power lines The set point and the relative field strength at the device probes were continuously displayed on the operator panel as dimensionless whole numbers scaled for easy interpretation by the operator Two audible alarmsmdasha warning signal and an alarm signalmdashwere annunciated as a series of beeps followed by a voice message At 80 of the alarm set point (this percentage is a user-selectable value) a ldquowarningrdquo voice messhysage was given indicating that continued boom movement in the same direction may result in an alarm condition The ldquoalarmrdquo voice message warned of impending power line contact
Figure 2mdashASE Model 2100 remote and operator panels
5
Proximity Warning Device Performance Objective
In the case of a mobile crane such as the one used in this research a PWD should ideally warn the equipment operator and any nearby personnel when any part of the crane or a susshypended load is closer to an energized overhead electrical power line than some preselected disshytance In most cases the minimum distance will be dictated by occupational safety regulations such as the current OSHA standards that require a clearance of at least 10 ft (30 m) for power lines at voltages up to 50 kV (29 CFR 1926550) Conversely a PWD should not alarm during operation outside the desired minimum clearance distance Such ldquofalse alarmsrdquo may cause pershysonnel to question the effectiveness of the device view it as a nuisance or perhaps ignore it completely The criteria just described strictly speaking would allow operation of a crane boom directly above or below a power line as long as the specified minimum clearance is maintained Such operation however increases the chance of an accidental line contact and should be avoided [ANSI 1995] A safer and more practical alternative is to define the limit of safe operashytion as a vertical plane at the desired clearance distance horizontally from the closest power line conductor and prohibit any part of the crane or suspended load from crossing this boundary during normal operation Figure 3 shows a three-phase power line installation in cross-section and two variations of a 10-ft (30-m) recommended safe operation boundary surrounding the conductors
13 kV
Neutral
10 ft (30 m)
Minimum clearancefrom power linescomplying with 29 CFR requirements
Preferred interpretation of
10 ft (30 m)clearance distance
[ANSI 1995]
13 kV
Neutral
10 ft (30 m)
Minimum clearance from power lines complying with 29 CFR requirements
Preferred interpretation of
10 ft (30 m) clearance distance
[ANSI 1995]
Figure 3mdashMinimum safe working distances around overhead electrical power lines
6
For most tests in this evaluation a minimum clearance distance of 20 ft (61 m) from the closest phase conductor of the power lines was used as the limit of safe operation and accordshyingly the PWDs had their sensitivities adjusted so that their alarm thresholds were reached with the boom tip approximately 20 ft (61 m) from the closest phase conductor7
7For this sensitivity adjustment distance the boom was positioned by placing the crane load block directly over a mark painted on the ground 20 ft (61 m) horizontally from the closest conductor Because of the inaccuracy inhershyent in this method and the size and shape of the boom structure the actual minimum distance from the boom to the closest conductor (as subsequently measured by computer model) was usually not precisely 20 ft (61 m) The 20-ft (61-m) ldquonominalrdquo distance however was used as a reference for all evaluations since this is the target value that would be assumed as correct by a crane operator using a similar procedure to adjust PWD sensitivity in the field
This distance was chosen to allow the crane boom to continue moving toward the power lines during testing if an alarm did not activate at or before the 20-ft (61-m) limit without bringing any part of the crane closer than 10 ft (30 m) from the lines This boundary of safe operation could have been defined as a vertical plane 20 ft (61 m) from the power lines The more literal interpretation of the boundary was used however allowing a minimum distance of 20 ft (61 m) in all directions from any energized phase conductor The main implication for the performance evaluations preshysented in this report is that movement of the boom below the power lines (at 0deg elevation angle) without activating the alarms is considered acceptable PWD operation The exceptions to the 20-ft (61-m) sensitivity setting were the tests involving the crane traveling toward the lines with the PWDs set at maximum sensitivity
TEST PROGRAM
Installation of Power Line Proximity Warning Devices on the Test Crane
Both PWDs were mounted by their manufacturers on a government-owned Grove RT522 rough-terrain crane (22-st (20-mt) capacity) Typical mounting techniques and routing of wiring were altered to avoid permanent modifications to the crane but proper probe placement was maintained
Operator control panels for both units were located in the crane cab and speakers for audible alarms were located on the base section of the boom The SIGALARM Model 210 probe reel was mounted on the lower half of the boom base section and the probe routed to the boom tip on standoffs several inches above the upper left edge of the boom Probe extensions approxishymately 24 in (61 cm) long were mounted to hang freely at the boom tip to provide extra coverage in that area The two probes for the ASE Model 2100 were extended from two reels mounted on both sides of the base section of the boom and ran along each lower outside edge of the boom to the boom tip Figure 4 shows the PWD probes mounted on the crane boom
7
Figure 4mdashPWD probes on crane boom
Test Facility
Overhead Power Line Test Site
A test site specifically designed for operating mobile equipment near overhead electrical power lines was built at NIOSHndashPRL The site is a remote approximately level 5-acre (2-ha) grass-covered area with controlled access Within this area four wooden utility poles were erected along a straight line 100 ft (305 m) apart and equipped with cross arms and necessary hardware to install one or two four-wire three-phase horizontal configuration power line circuits and a three-wire vertical configuration circuit The lines can be installed in various combinations at heights up to 45 ft (137 m) and can be powered from either end of the 300-ft (914-m) instalshylation Four ldquomovablerdquo wooden utility poles were also erected at the site These 36-ft (110-m) poles set in 55-st (5-mt) reinforced concrete blocks are designed to be moved by a forklift and can be equipped with one four-wire three-phase horizontal configuration circuit The movable poles can be positioned to create a power line circuit parallel to or intersecting the lines on the four permanent poles For both sets of poles all insulators and cross arms can accommodate cirshycuits up to 25 kV using 2 AWG ACSR conductors These overhead power line installations meet standards used by Allegheny Energy Inc a large electrical utility company headquartered near Pittsburgh serving Pennsylvania Maryland West Virginia and Virginia A nonstandard
8
safety feature included on the utility poles is a nonconductive high-visibility flag line suspended level with and 10 ft (30 m) away from the power lines (on the side of crane operation) This gives the crane operator and spotters a clear indication when the crane boom or hoist ropes are 10 ft (30 m) horizontally from the power line conductors The site also has a dedicated low-resistance (3 Ω) driven-rod electrical ground bed When the overhead power lines were configshyured for a specific test any conductors not in use were removed from the utility poles
Electrical Power Supply for Tests
A portable electrical power supply was assembled to supply overhead power line circuits at the power line test site described above It can provide two independently controlled four-wire three-phase sources isolated from utility sources and is capable of 27 kV line to line The sysshytem uses a 480-V three-phase 5000-W generator feeding two parallel branches Each branch has a three-phase variable transformer capable of providing a manually adjustable 0- to 560-V output feeding a 480-V to 27-kV 2-kVA step-up transformer Each branch can serve as an independent 0- to 27-kV four-wire three-phase supply for an overhead power line circuit Four-conductor insulated portable power cables terminated with four-prong twist-lock plugs connect all 480-V components High-voltage outputs use high-voltage insulated conductors connected to power line terminations on cross arms 10 ft (30 m) above ground level A circuit breaker at the generator output and fuses at transformer primaries provide overcurrent protection for the system All components can be moved from storage and setup for operation by a small team in 30ndash40 min Figure 5 is a diagram of the power system
Variabletransformer
0 ndash 560 V output
Variabletransformer
0 ndash 560 V output
480 Vthree-phase
generator
480V - 27kV2 kVA step-uptransformer
480V - 27kV2 kVA step-uptransformer
To overheadpower line
To overheadpower line
- Y
- Y
Variabletransformer
0 ndash 560 V output
Variable transformer
0 ndash 560 V output
Variabletransformer
0 ndash 560 V output
Variable transformer
0 ndash 560 V output
480 V three-phase
generator
480V - 27kV2 kVA step-uptransformer
480V - 27kV 2 kVA step-up transformer
480V - 27kV2 kVA step-uptransformer
480V - 27kV 2 kVA step-up transformer
To overhead power line
To overhead power line
- Y
- Y
Figure 5mdashDiagram of the test-site power system
For this test program the output for each power line circuit was monitored at the step-up transformer secondary terminals using a digital multimeter and high-voltage probe to measure one phase to neutral voltage For personnel safety access to the areas surrounding the step-up transformers and high-voltage connections at ground level were restricted using construction fencing All tests using a four-wire circuit were configured with the high-voltage output groundshying conductor tied to the test site ground bed and overhead line neutral conductor as well as a butt-wrapped grounding lead on each pole Prior to testing all line-to-line voltages were verified directly on the overhead lines using a hot-stick meter employed from an aerial manlift
9
Intersecting 13 kV overhead power line installations
Crane boom at full extensionand 61O elevation angle
Distance fromcrane hoistropes topower lines
Intersecting 13 kV overhead power line installations
Distance from crane hoist ropes to power lines
Crane boom at full extension and 61O elevation angle
Data Collection Process
Data collection for this research required documenting the crane boom position relative to the energized overhead power lines for each test in order to allow evaluation of PWD performshyance This was done by determining the relative three-dimensional (3-D) positions of the power lines and boom and recording this information as a computer model from which the relevant boom to power line distances (ldquotruerdquo distances) can be extracted The 3-D information was obtained using a ldquototal stationrdquo surveying instrument which allows precise measurement of horishyzontal and vertical angles as well as slope distance from the instrument to target points Use of the instrument required precise placement of reference targets (made of a special reflective mateshyrial) on the crane boom and the overhead power line installations
Using the survey coordinates of two reference points on either (or both) sets of overhead power lines and accurate measurements of the poles and conductors a 3-D model of the test site for each power line configuration was created Then for all tests the boom positions for both sensitivity adjustments and cases of alarm activation were mapped in the same 3-D space as the power lines Each boom model was based on the survey coordinates of two reference points on the boom and detailed boom dimensions Figure 6 is an example of a computer model for an individual test With the graphical computer models of the power lines and crane boomhoist ropes mapped in the same 3-D space the distance between the boomhoist ropes and power lines is readily determined by simply defining the shortest line between potential contact points for the two and noting its length
To verify the boom to power line distances obtained from the models manual measureshyments of the horizontal boom to power line distances (ldquoobservedrdquo distances) were made for all alarm activations These were made by noting the position of the crane load hook with respect to a distance reference grid painted on the ground at the test site The zero lines for the distance reference grid were directly below the nearest phase conductors for horizontal configuration lines (at 13-kV spacing)
Figure 6mdashExample of a computer model used for analyzing crane boom position relative to overhead power lines
10
Test Procedures
The PWDs as mounted on the crane by the manufacturers were tested by operating the crane near energized overhead power lines Different test sets varied the crane boom position relative to the power lines as well as power line configuration (number of three-phase circuits pole configuration conductor arrangement voltage level and phase sequencing) Within each test set individual tests involved swinging the boom toward the lines while at predetermined combinations of crane boom extension and elevation angle and then documenting the response of each PWD Most tests specified that the crane be operated from a stationary position (chassis supported on outriggers) However several tests involved the crane approaching the power lines to simulate entering an unfamiliar work area
A typical test for operation of the crane from a stationary position began by positioning the crane adjacent to the power lines and deploying its outriggers supported on wooden blocks For tests using a single set of poles the crane chassis centerline was parallel to the power lines and approximately 30 ft (91 m) horizontally from the closest phase conductor as shown in Figure 7(a) For two sets of poles with power lines intersecting at 90deg the crane chassis center-line bisected the angle between the power lines with the boomrsquos center of rotation approxishymately 30 ft (91 m) horizontally from the closest phase conductor of each set as shown in Figure 7(b)
BoomSwing
SwingStarting
Point
Crane
Power Lines
30 ft(91 m)
BoomSwing
SwingStarting
Point
Crane
Power Lines
30 ft(91 m)
PowerLines
30 ft(91 m)
(a) (b)
Boom Swing
Swing Starting
Point
Crane
Power Lines
30 ft (91 m)
Boom Swing
Swing Starting
Point
Crane
Power Lines
30 ft (91 m)
Power Lines
30 ft (91 m)
(a) (b)
Figure 7mdashCrane locations for tests involving operation from a stationary position
PWD sensitivities were then adjusted per on-site direction from the manufacturers The criteria used for these adjustments called for the PWDs to alarm if the crane boom or hoist ropes moved to within 20 ft (61 m) of the closest phase conductor After sensitivity adjustment the boomrsquos 3-D position relative to the power lines was documented using the total station surveying instrument Notwithstanding the 20-ft (61-m) alarm requirement the manufacturers were free to specify the specific procedures for adjusting PWD sensitivities as well as how frequently the devices would be readjusted during testing
11
The crane boom was then rotated horizontally to the swing starting point as shown in Figure 7 elevated and extended per the test plan and swung toward the power lines When either PWD alarm would activate the boom was stopped and its 3-D position relative to the power lines was documented The observed distance from the boom or hoist ropes to the power lines was also estimated using a distance reference grid painted on the ground If an alarm activated at the maximum distance from the power lines (ie before the boom was moved) this position was documented If a PWD did not alarm at or before the 20-ft (61-m) limit the boom swing was continued until alarm activation occurred or until the boom or hoist ropes were 10 ft (30 m) from the power lines The boom and hoist ropes were never allowed to come closer than 10 ft (30 m) to an energized power line during testing Note that in cases where the boom elevation was 0deg the boom was swung until directly under the closest phase conductor since at this point it was still greater than 20 ft (61 m) (vertically) from the power lines Figure 8 shows the test site and crane
Figure 8mdashGrove RT522 crane on outriggers positioned adjacent to overhead power lines with boom at 50 extension and boom tip approximately level with lower set of lines
12
For tests that simulated the crane in travel configuration approaching the power lines the PWDs were adjusted to maximum sensitivity Upon activation of an alarm the crane was stopped and set up for stationary operation on outriggers at that location Tests were then conshyducted by swinging the fully extended boom toward the power lines while at different elevations
Crane Boom Position Data Analysis
Position survey data and computer modeling were used to precisely record the relative positions of the overhead power lines and crane boom for sensitivity adjustment positions and each alarm activation point during testing The criteria used to determine the true distance between the boom or hoist ropes and the power lines for each test (from the models) was based on the position of the boom and the most likely point of contact with a power line conductor For tests where the boom was at a 0deg elevation angle or where the boom tip was at power line level the true distance is the shortest distance from the tip of the boom to the closest phase conductor For tests where the boom elevation angle was at the maximum used (61deg) the true distance is the shortest distance from the hoist ropes to the closest phase conductor Consideration of power line contact by hoisted loads was beyond the scope of this research
Test Plan
Most of the tests conducted in this research quantified the influence on PWD performshyance of variations in power line configuration and changes in crane boom parameters after initial PWD sensitivity adjustment Table 1 is a listing of test sets 1 through 7 organized according to power line configuration (crane operating from a stationary position)
Table 1mdashPower line configuration detail for test sets 1 through 7
Test set
No
No of three-phase
circuits
Circuit No 1 Circuit No 2 Relationship of two power line
circuits Voltage (kV)
Configushyration
Neutral conductor
Voltage (kV)
Configushyration
Neutral conductor
1 1 13 H Yes 2 1 25 V No1 3 2 13 H Yes 13 H Yes On same poles 4 2 13 H Yes 25 H Yes On same poles 5 2 13 H Yes 25 V No1 On same poles 6 2 13 H Yes 13 H Yes Intersect at 90deg
7 2 13 H Yes 25 H Yes Intersect at 90deg H Horizontal V Vertical 1This 25-kV power line simulates a subtransmission circuit which typically would not include a neutral
conductor
Each test set was run once with the phase conductors arranged ABC with A-phase nearest the crane for horizontal lines and at the top for vertical lines and then run again with the circuit (or one of the two circuits involved) arranged CBA in order to evaluate the effect of reversing the electrical ldquosequencerdquo of the phase conductors Within each of the 14 resulting groups of tests an individual test was run for each of 8 possible crane boom configurations These
13
configurations represented all possible combinations of three boom extension lengths (minimum 50 and maximum)8 and three elevation angles (0deg boom tip at power line height and 61deg)910
8These extensions give boom lengths of 28 ft (85 m) 487 ft (148 m) and 694 ft (212 m) respectively from base pivot pin to point sheave pin 9Sixty-one degrees was the maximum elevation angle (at minimum boom length) at which the load hook was not over the crane chassis 10With the boom at ldquominimum boom lengthrdquo it could not be positioned with the ldquoboom tip at power line heightrdquo for any power line configuration used Therefore this combination was not possible
The crane load block (hoisting hook) was positioned approximately 5 ft (15 m) from the ground for sensitivity adjustments and tests The exception to the 5-ft (15-m) load block height was for the combination of maximum boom extension and 61deg elevation angle for which the hoist block was positioned 23 ft (70 m) from the ground due to insufficient hoist rope on the crane
Additional test sets were included to examine other aspects of PWD performance such as using maximum device sensitivity for the time a crane is in transit in order to alert the operator and crew that power lines are somewhere in or near an unfamiliar work area as the crane approaches Ideally this warning would be well before the crane is in close proximity to the lines Test set 8 placed the crane in a travel configuration approaching a single set of horizontal power lines with PWDs set at maximum sensitivity to determine the greatest distance at which the lines could be detected Test set 9 had the crane with PWDs again set at maximum sensishytivity approach two sets of horizontal lines intersecting at 90deg to determine whether the alarm distance was influenced by the additional set of power lines
Test set 10 examined the effect of having the crane chassis tied directly to the power sysshytemrsquos grounded neutral while operating from a stationary position Connecting an equipment chassis to ground is sometimes suggested as a means to reduce the chance of a dangerous chassis voltage in the event of an accidental power line contact or to reduce induced charges on a piece of equipment
RESULTS
The following sections present performance data for the two PWDs tested Each section lists test and sensitivity adjustment details provides a diagram of the test layout and power line configuration and presents a table showing the distances from the overhead power lines at which the PWDs alarmed for specific conditions (or notes no alarm activation) The alarm distances as noted earlier are true distances taken from the 3-D models created for each test
Test Set 1
Test set 1 used one set of horizontal 13-kV lines Sensitivity was adjusted once prior to ABC phase sequence tests (A-phase nearest crane) and once prior to CBA phase sequence tests (C-phase nearest crane) Sensitivity was adjusted with the crane parked in the test position on its outriggers the boom extended to approximately 43 ft (131 m) (62 of full extension) the boom tip elevated to approximately phase conductor level and the boom swung to a position 20 ft (61 m) from the closest conductor11 Test layout and power line configuration are shown in Figure 9 Table 2 details performance of the PWDs for test set 1
11As described earlier the distance listed for the sensitivity adjustments is the ldquonominalrdquo distance from the power lines which was determined by using the distance reference grid painted on the ground at the test site There are slight variations in the sensitivity adjustment boom lengths listed because the boom positions were approximated in the field and then later measured precisely from the survey data-based computer models
14
Phase sequence horizontal ABC with A-phase nearest crane SIGALARM Model 210 ASE Model 2100
Boom Minimum 50 Maximum Boom Minimum 50 Maximum position extension extension extension position extension extension extension
0deg 0deg No alarm No alarm No alarm No alarm No alarm No alarm elevation elevation Boom tip Boom tip 276 361 276 518 at power (1) at power (1) (84) (110) (84) (158) line level line level
61deg 194 61deg 293 486 No alarm No alarm No alarm elevation (59) Elevation (89) (148)
Phase sequence horizontal CBA with C-phase nearest crane SIGALARM Model 210 ASE Model 2100
Boom Minimum 50 Maximum Boom Minimum 50 Maximum position extension extension extension position extension extension extension
0deg 0deg No alarm No alarm No alarm No alarm No alarm No alarm elevation elevation Boom tip Boom tip 234 386 290 534 at power (1) at power (1) (71) (118) (88) (163) line level line level
61deg 61deg 287 529 No Alarm No Alarm No Alarm No alarm elevation elevation (87) (161)
1The boom tip could not be raised to power line level with the boom at minimum extension length for any of the power line configurations used therefore this combination of extension and elevation angle was not possible
Fixed Power Lines (AA)
37 ft(113 m)
13 kV
BoomSwing
SwingStarting
Point
Crane
Fixed Power Lines
30 ft(91 m)
A
A
Fixed Power Lines (AA)
37 ft (113 m)
13 kV
Boom Swing
Swing Starting
Point
Crane
Fixed Power Lines
30 ft (91 m)
A
A
Figure 9mdashTest set 1 layout and overhead power line configuration
Table 2mdashAlarm distance results for test set 1 (Distance between boom or hoist ropes and closest phase conductor in ft (m))
15
Test Set 2
Test set 2 used one set of vertical 25-kV lines Sensitivity was adjusted once prior to ABC phase sequence tests (A-phase at top) and once prior to CBA phase sequence tests (C-phase at top) Sensitivity was adjusted with the crane parked in the test position on its outriggers the boom extended to approximately 57 ft (174 m) (82 of full extension) the boom tip elevated to approximately top phase conductor level and the boom swung to a position 20 ft (61 m) from the top conductor Test layout and power line configuration are shown in Figure 10 Table 3 details performance of the PWDs for test set 2
Fixed Power Lines (AA)
45 ft(137 m)
25 kV
BoomSwing
SwingStarting
Point
Crane
Fixed Power Lines
32 ft(98 m)
A
A
Fixed Power Lines (AA)
45 ft (137 m)
25 kV
Boom Swing
Swing Starting
Point
Crane
Fixed Power Lines
32 ft (98 m)
A
A
Figure 10mdashTest set 2 layout and overhead power line configuration
16
Phase sequence vertical ABC with A-phase at top (25 kV)
SIGALARM Model 210 ASE Model 2100
Boom Minimum 50 Maximum Boom Minimum 50 Maximum position extension extension extension position extension extension extension
0deg 0deg No alarm No alarm No alarm No alarm No alarm No alarm elevation elevation
Boom tip Boom tip 317 317 at power (1) (2) at power (1) (2) (97) (97) line level line level
61deg 121 218 61deg 121 334 No alarm No alarm elevation (37) (66) elevation (37) (102)
Phase sequence vertical CBA with C-phase at top (25 kV) SIGALARM Model 210 ASE Model 2100
Boom Minimum 50 Maximum Boom Minimum 50 Maximum position extension extension extension position extension extension extension
0deg 0deg No alarm No alarm No alarm No alarm No alarm No alarm elevation elevation
Boom tip Boom tip 321 321 at power (1) (2) at power (1) (2) (98) (98) line level line level
61deg 81 283 61deg 283 No alarm No alarm No alarm elevation (25) (86) elevation (86)
1The boom tip could not be raised to power line level with the boom at minimum extension length for any of the power line configurations used therefore this combination of extension and elevation angle was not possible 2These tests were omitted in error
Table 3mdashAlarm distance results for test set 2 (Distance between boom or hoist ropes and closest phase conductor in ft (m))
Test Set 3
Test set 3 used two sets of horizontal 13-kV lines supported on the same poles Sensishytivity was adjusted once prior to tests using ABC phase sequence on both sets of lines (A-phase nearest crane for both sets) and once prior to tests using CBA phase sequence on the upper set of lines (C-phase nearest crane for upper set) Sensitivity was adjusted with the crane parked in the test position on its outriggers the boom extended to approximately 44 ft (134 m) (63 of full extension) the boom tip elevated to approximately phase conductor level for the lower set of lines and the boom swung to a position 20 ft (61 m) from the closest conductor Test layout and power line configuration are shown in Figure 11 Table 4 details performance of the PWDs for test set 3
17
Upper set of power lines ndash phase sequence horizontal ABC with A-phase nearest crane Lower set of power lines ndash phase sequence horizontal ABC with A-phase nearest crane
SIGALARM Model 210 ASE Model 2100 Boom Minimum 50 Maximum Boom Minimum 50 Maximum
position extension extension extension position extension extension extension
0deg 0deg No alarm No alarm No alarm No alarm No alarm No alarm elevation elevation Boom tip Boom tip 272 450 2350 609 at power (1) at power (1) (83) (137) (107) (186) line level line level
61deg 296 449 61deg 370 623 No alarm No alarm elevation (90) (137) elevation (113) (190) Upper set of power lines ndash phase sequence horizontal CBA with C-phase nearest crane Lower set of power lines ndash phase sequence horizontal ABC with A-phase nearest crane
SIGALARM Model 210 ASE Model 2100 Boom Minimum 50 Maximum Boom Minimum 50 Maximum
position extension extension extension position extension extension extension
0deg 0deg No alarm No alarm No alarm No alarm No alarm No alarm elevation elevation Boom tip Boom tip 2240 319 2240 384 at power (1) at power (1) (73) (97) (73) (117) line level line level
61deg 150 61deg 223 355 No alarm No alarm No alarm elevation (46) elevation (68) (108)
1The boom tip could not be raised to power line level with the boom at minimum extension length for any of the power line configurations used therefore this combination of extension and elevation angle was not possible 2Value is the observed distance due to invalid survey data for the boom position
Fixed Power Lines (AA)
37 ft(113 m)
47 ft(143 m)
13 kV
13 kV
BoomSwing
SwingStarting
Point
Crane
Fixed Power Lines
30 ft(91 m)
A
A
Fixed Power Lines (AA)
37 ft (113 m)
47 ft (143 m)
13 kV
13 kV
Boom Swing
Swing Starting
Point
Crane
Fixed Power Lines
30 ft (91 m)
A
A
Figure 11mdashTest set 3 layout and overhead power line configuration
Table 4mdashAlarm distance results for test set 3 (Distance between boom or hoist ropes and closest phase conductor in ft (m))
18
Test Set 4
Test set 4 used two sets of horizontal power lines supported on the same poles The upper set was at 25 kV the lower set was at 13 kV Sensitivity was adjusted once prior to tests using ABC phase sequence on both sets of lines (A-phase nearest crane for both sets) and once prior to tests using CBA phase sequence on the upper set of lines (C-phase nearest crane for upper set) Sensitivity was adjusted with the crane parked in the test position on its outriggers the boom extended to approximately 43 ft (131 m) (62 of full extension) the boom tip elevated to approximately phase conductor level for the lower set of lines and the boom swung to a position 20 ft (58 m) from the closest conductor Test layout and power line configuration are shown in Figure 12 Table 5 details performance of the PWDs for test set 4
Fixed Power Lines (AA)
37 ft(113 m)
47 ft(143 m)
25 kV
13 kV
BoomSwing
SwingStarting
Point
Crane
Fixed Power Lines
29 ft(88 m)
A
A
Fixed Power Lines (AA)
37 ft (113 m)
47 ft (143 m)
25 kV
13 kV
Boom Swing
Swing Starting
Point
Crane
Fixed Power Lines
29 ft (88 m)
A
A
Figure 12mdashTest set 4 layout and overhead power line configuration
19
Upper set of power lines ndash phase sequence horizontal ABC with A-phase nearest crane (25 kV) Lower set of power lines ndash phase sequence horizontal ABC with A-phase nearest crane
SIGALARM Model 210 ASE Model 2100
Boom Minimum 50 Maximum Boom Minimum 50 Maximum position extension extension extension position extension extension extension
0deg 0deg No alarm No alarm No alarm No alarm No alarm No alarm elevation elevation
Boom tip Boom tip 228 379 293 577 at power (1) at power (1) (69) (116) (89) (176) line level line level
61deg 246 2430 61deg 345 616 No alarm No alarm elevation (75) (131) elevation (105) (188)
Upper set of power lines ndash phase sequence horizontal CBA with C-phase nearest crane (25 kV) Lower set of power lines ndash phase sequence horizontal ABC with A-phase nearest crane
SIGALARM Model 210 ASE Model 2100
Boom Minimum 50 Maximum Boom Minimum 50 Maximum position extension extension extension position extension extension extension
0deg 0deg No alarm No alarm No alarm No alarm No alarm No alarm elevation elevation
Boom tip Boom tip 211 336 297 573 at power (1) at power (1) (64) (102) (91) (175) line level line level
61deg 253 408 61deg 387 620 No alarm No alarm elevation (77) (124) elevation (118) (189)
1The boom tip could not be raised to power line level with the boom at minimum extension length for any of the power line configurations used therefore this combination of extension and elevation angle was not possible 2Value is the observed distance due to invalid survey data for the boom position
Table 5mdashAlarm distance results for test set 4 (Distance between boom or hoist ropes and closest phase conductor in ft (m))
20
Test Set 5
Test set 5 used two sets of power lines supported on the same poles The upper set was a vertical configuration at 25 kV the lower set was a horizontal configuration at 13 kV Sensitivity was adjusted once prior to tests using ABC phase sequence on both sets of lines (A-phase nearest crane for horizontal set and at top for vertical set) and once prior to tests using CBA phase sequence on the upper set of lines (C-phase at top) with the lower set remaining ABC Sensishytivity was adjusted with the crane parked in the test position on its outriggers the boom extended to approximately 44 ft (134 m) (63 of full extension) the boom tip elevated to approximately phase conductor level for the lower set of lines and the boom swung to a position 20 ft (61 m) from the closest conductor Test layout and power line configuration are shown in Figure 13 Table 6 details performance of the PWDs for test set 5
Fixed Power Lines (AA)
45 ft(137 m)
25 kV
BoomSwing
SwingStarting
Point
Crane
Fixed Power Lines
30 ft(91 m)
A
A
37 ft(113 m)
13 kV
Fixed Power Lines (AA)
45 ft (137 m)
25 kV
Boom Swing
Swing Starting
Point
Crane
Fixed Power Lines
30 ft (91 m)
A
A
37 ft (113 m)
13 kV
Figure 13mdashTest set 5 layout and overhead power line configuration
21
Upper set of power lines ndash phase sequence vertical ABC with A-phase at top (25 kV) Lower set of power lines ndash phase sequence horizontal ABC with A-phase nearest crane
SIGALARM Model 210 ASE Model 2100
Boom Minimum 50 Maximum Boom Minimum 50 Maximum position extension extension extension position extension extension extension
0deg 342 0deg No alarm No alarm No alarm No alarm No alarm elevation (104) elevation
Boom tip Boom tip 494 743 418 786 at power (1) at power (1) (151) (226) (127) (240) line level line level
61deg 2522 2650 61deg 460 2650 No alarm No alarm elevation (159) (198) elevation (140) (198)
Upper set of power lines ndash phase sequence vertical CBA with C-phase at top (25 kV) Lower set of power lines ndash phase sequence horizontal ABC with A-phase nearest crane
SIGALARM Model 210 ASE Model 2100
Boom Minimum 50 Maximum Boom Minimum 50 Maximum position extension extension extension position extension extension extension
0deg 350 412 0deg 290 No alarm No alarm No alarm elevation (107) (126) elevation (88)
Boom tip Boom tip 205 311 205 311 at power (1) at power (1) (62) (95) (62) (95) line level line level
61deg 319 2636 61deg 110 511 No alarm No alarm elevation (97) (194) elevation (34) (156)
1The boom tip could not be raised to power line level with the boom at minimum extension length for any of the power line configurations used therefore this combination of extension and elevation angle was not possible 2Alarmed at swing starting point
Table 6mdashAlarm distance results for test set 5 (Distance between boom or hoist ropes and closest phase conductor in ft (m))
22
Test Set 6
Test set 6 used two separate sets of power lines intersecting at 90deg with the centerline of the crane bisecting the angle between the power lines Both sets of lines were in a horizontal configuration operating at 13 kV The lines to the cranersquos right (from the operatorrsquos perspective) were on movable poles those to the left were on fixed poles Sensitivity was adjusted once prior to tests using ABC phase sequence on both sets of lines (A-phase nearest crane for both sets) and once prior to tests using ABC phase sequence on the fixed set and CBA on the movable set Sensitivity was adjusted with the crane parked in the test position on its outriggers the boom extended to 42 ft (128 m) (61 of full extension) the boom tip elevated to approximately phase conductor level for the lines on the left (fixed lines) and the boom swung left to a position 20 ft (61 m) from the closest conductor Test layout and power line configuration are shown in Figure 14 Table 7 details performance of the PWDs for test set 6
Fixed PowerLines (AA)
37 ft(113 m)
13 kV
BoomSwing
SwingStarting
Point
Crane
Fixed Power Lines
30 ft (91 m)
A
A 13 kV
Movable PowerLines (BB)
35 ft(107 m)
MovablePowerLines
B B
30 ft(91 m) Fixed Power
Lines (AA)
37 ft (113 m)
13 kV
Boom Swing
Swing Starting
Point
Crane
Fixed Power Lines
30 ft (91 m)
A
A 13 kV
Movable Power Lines (BB)
35 ft (107 m)
Movable Power Lines
B B
30 ft (91 m)
Figure 14mdashTest set 6 layout and overhead power line configuration
23
Fixed power lines ndash phase sequence horizontal ABC with A-phase nearest crane (left swing) Movable power lines ndash phase sequence horizontal ABC with A-phase nearest crane (right swing)
SIGALARM Model 210 ASE Model 2100
Boom Minimum 50 Maximum Boom Minimum 50 Maximum position extension extension extension position extension extension extension
Left swing Left swing Left swing Left swing Left swing Left swing No alarm No alarm No alarm No alarm No alarm No alarm0deg 0deg
elevation elevation Right swing Right swing Right swing Right swing Right swing Right swing No alarm No alarm No alarm No alarm No alarm No alarm
Left swing Left swing Left swing Left swing 293 424 293 2702 Boom tip Boom tip (89) (129) (89) (214) at power (1) at power (1)
Right swing Right swing Right swing Right swing line level line level 180 336 353 2726 (55) (102) (108) (221)
Left swing Left swing Left swing Left swing Left swing Left swing 366 2534 366 2534 No alarm No alarm 61deg (112) (163) 61deg (112) (163)elevation Right swing elevation Right swing Right swing Right swing Right swing Right swing 2534 390 2534 No alarm No alarm No alarm (163) (119) (163)
Fixed power lines ndash phase sequence horizontal CBA with C-phase nearest crane (left swing) Movable power lines ndash phase sequence horizontal ABC with A-phase nearest crane (right swing)
SIGALARM Model 210 ASE Model 2100
Boom Minimum 50 Maximum Boom Minimum 50 Maximum position extension extension extension position extension extension extension
Left swing Left swing Left swing Left swing Left swing Left swing No alarm No alarm No alarm No alarm No alarm No alarm0deg 0deg
elevation Right swing elevation Right swing Right swing Right swing Right swing Right swing 298 298 No alarm No alarm No alarm No alarm (91) (91) Left swing Left swing Left swing Left swing
291 387 291 485 Boom tip Boom tip (89) (118) (89) (148) at power (1) at power (1) Right swing Right swing Right swing Right swing line level line level 144 840 320 512
(44) (256) (98) (156) Left swing Left swing Left swing Left swing Left swing Left swing 262 419 No alarm No alarm No alarm No alarm 61deg 61deg (80) (128)
elevation elevation Right swing Right swing Right swing Right swing Right swing Right swing 278 408 No alarm No alarm No alarm No alarm (85) (124)
1The boom tip could not be raised to power line level with the boom at minimum extension length for any of the power line configurations used therefore this combination of extension and elevation angle was not possible 2Alarmed at swing starting point
Table 7mdashAlarm distance results for test set 6 (Distance between boom or hoist ropes and closest phase conductor in ft (m))
24
Test Set 7
Test set 7 used two separate sets of power lines intersecting at 90deg with the centerline of the crane bisecting the angle between the power lines Both sets of lines were in a horizontal configuration The lines to the cranersquos right (from the operatorrsquos perspective) were on movable poles and operating at 13 kV those to the left were on fixed poles and operating at 25 kV Sensishytivity was adjusted once prior to tests using ABC phase sequence on both sets of lines (A-phase nearest crane for both sets) and once prior to tests using ABC phase sequence on the fixed set and CBA on the movable set (C-phase nearest crane) Sensitivity was adjusted with the crane parked in the test position on its outriggers the boom extended to approximately 44 ft (134 m) (63 of full extension) the boom tip elevated to approximately phase conductor level for the lines on the right (13-kV movable lines) and the boom swung right to a position 20 ft (61 m) from the closest conductor Test layout and power line configuration are shown in Figure 15 Table 8 details performance of the PWDs for test set 7
Fixed PowerLines (AA)
37 ft(113 m)
25 kV
BoomSwing
SwingStarting
Point
Crane
Fixed Power Lines
29 ft (88 m)
A
A 13 kV
Movable PowerLines (BB)
35 ft(107 m)
MovablePowerLines
B B
30 ft(91 m) Fixed Power
Lines (AA)
37 ft (113 m)
25 kV
Boom Swing
Swing Starting
Point
Crane
Fixed Power Lines
29 ft (88 m)
A
A 13 kV
Movable Power Lines (BB)
35 ft (107 m)
Movable Power Lines
B B
30 ft (91 m)
Figure 15mdashTest set 7 layout and overhead power line configuration
25
Fixed power lines ndash phase sequence horizontal ABC with A-phase nearest crane (left swing) (25 kV) Movable power lines ndash phase sequence horizontal ABC with A-phase nearest crane (right swing)
SIGALARM Model 210 ASE Model 2100
Boom Minimum 50 Maximum Boom Minimum 50 Maximum position extension extension extension position extension extension extension
Left swing Left swing Left swing Left swing Left swing Left swing 297 506 No alarm No alarm No alarm No alarm0deg (91) (154) 0deg elevation elevation Right swing Right swing Right swing Right swing Right swing Right swing
No alarm No alarm No alarm No alarm No alarm No alarm
Left swing Left swing Left swing Left swing 2542 2709 2542 2709 Boom tip Boom tip (165) (216) (165) (216) at power (1) at power (1)
Right swing Right swing Right swing Right swing line level line level 2569 2738 2569 2738 (173) (225) (173) (225)
Left swing Left swing Left swing Left swing Left swing Left swing 265 2447 2528 2447 2528 No alarm 61deg (81) (136) (161) 61deg (136) (161)elevation Right swing Right swing elevation Right swing Right swing Right swing Right swing 2453 2551 2453 2551 No alarm No alarm (138) (168) (138) (168)
Fixed power lines ndash phase sequence horizontal ABC with A-phase nearest crane (left swing) (25 kV) Movable power lines ndash phase sequence horizontal CBA with C-phase nearest crane (right swing)
SIGALARM Model 210 ASE Model 2100
Boom Minimum 50 Maximum Boom Minimum 50 Maximum position extension extension extension position extension extension extension
Left swing Left swing Left swing Left swing Left swing Left swing 430 2652 2807 419 638 No alarm 0deg (131) (199) (246) 0deg (128) (195)elevation Right swing Right swing elevation Right swing Right swing Right swing Right swing 2652 2797 No alarm No alarm No alarm No alarm (199) (243)
Left swing Left swing Left swing Left swing 2545 2716 2542 2716 Boom tip Boom tip (166) (218) (165) (218) at power (1) at power (1)
Right swing Right swing Right swing Right swing line level line level 2562 2733 2562 2733 (171) (223) (171) (223)
Left swing Left swing Left swing Left swing Left swing Left swing 2368 2439 2520 240 2439 2520
61deg (112) (134) (159) 61deg (73) (134) (159)elevation Right swing Right swing elevation Right swing Right swing Right swing Right swing 2446 2529 2446 2529 No alarm No alarm (136) (161) (136) (161)
1The boom tip could not be raised to power line level with the boom at minimum extension length for any of the power line configurations used therefore this combination of extension and elevation angle was not possible 2Alarmed at swing starting point
Table 8mdashAlarm distance results for test set 7 (Distance between boom or hoist ropes and closest phase conductor in ft (m))
26
For several specific cases in test set 7 while the boom was swinging toward the lines with the PWDs in an alarm state the alarms would cease and then resume closer to the lines For the SIGALARM Model 210 with CBA phase sequence on the movable lines the right swing tests combining 0deg elevation with 50 and 100 extensions had a cessation of the alarm during the swing and resumption at 278 ft (85 m) and 342 ft (104) respectively This cessation also occurred for the ASE Model 2100 for right swing tests combining the ldquoboom tip at line heightrdquo elevation with 50 and 100 extensions with the alarm resuming at 239 ft (73 m) and 333 ft (101 m) respectively This behavior was noted only in these cases but not all tests were conshytinued past the point of alarms to check for alarm cessation
Test Set 8
Test set 8 used one set of horizontal 13-kV lines with ABC phase sequence (A-phase nearest crane) Both PWDs were adjusted to maximum sensitivity (alarm activation at greatest distance from power lines) With the boom at minimum extension and elevation and centered over the front of the crane (travel configuration) the crane was driven toward the power lines at an approach angle of 90deg 45deg from the right and 45deg from the left At the point of alarm activashytion the crane was stopped and set up on outriggers and the boom was extended to maximum length and rotated to the swing starting point Tests were then conducted by swinging the boom toward the power lines Test layout and power line configuration are shown in Figure 16
Fixed Power Lines (AA)
37 ft(113 m)
13 kV
BoomSwing
SwingStarting
Point
Fixed Power Lines
Crane
A
A
90O 45O Right45O Left
Fixed Power Lines (AA)
37 ft (113 m)
13 kV
Boom Swing
Swing Starting
Point
Fixed Power Lines
Crane
A
A
90O 45O Right45O Left
Figure 16mdashTest set 8 layout and overhead power line configuration
With the crane traveling toward the power lines the SIGALARM Model 210 adjusted to maximum sensitivity alarmed at 820 ft (250 m) 834 ft (254 m) and 751 ft (229 m) from the power lines for 90deg 45deg right and 45deg left approaches respectively (measured perpendicular to the power lines) When the crane was set up at the 90deg approach alarm point and the fully extended boom was swung left toward the lines at 0deg elevation boom tip at line height and 61deg elevation the Model 210 alarmed at 1475 ft (450 m) 1656 ft (505 m) and 1240 ft (381 m) respectively Based on these results boom swing tests were omitted for the 45deg approach alarm points
With the crane traveling toward the power lines the ASE Model 2100 at maximum sensishytivity did not alarm while approaching the power lines The tests were terminated when the crane boom was directly under the lines
27
Test Set 9
Test set 9 used two sets of horizontal 13-kV lines with ABC phase sequence (A-phase nearest crane) intersecting at 90deg Both PWDs were adjusted to maximum sensitivity (alarm actishyvation at greatest distance from power lines) With the boom at minimum extension and elevashytion and centered over the front of the crane the crane was driven toward the power lines on a path bisecting the angle between the lines At the point of alarm activation the crane was stopped and set up on outriggers and the boom was extended to maximum length and rotated to the swing starting point Tests were then conducted by swinging the boom toward the power lines Test layout and power line configuration are shown in Figure 17
Fixed PowerLines (AA)
37 ft(113 m)
13 kV
BoomSwing
SwingStarting
Point
Crane
Fixed Power Lines A
A 13 kV
Movable PowerLines (BB)
35 ft(107 m)
MovablePowerLines
B B
Fixed Power Lines (AA)
37 ft (113 m)
13 kV
Boom Swing
Swing Starting
Point
Crane
Fixed Power Lines A
A 13 kV
Movable Power Lines (BB)
35 ft (107 m)
Movable Power Lines
B B
Figure 17mdashTest set 9 layout and overhead power line configuration
With the crane traveling toward the power lines the SIGALARM Model 210 adjusted to maximum sensitivity alarmed at 88 ft (268 m) from both sets of power lines (observed distance measured perpendicular to both sets of power lines) When the crane was set up at this location and the fully extended boom was swung right toward the portable power lines the Model 210 alarmed at 1542 ft (470 m) and 1362 ft (415 m) for the boom tip at power line height and 61deg elevation respectively No data were obtained for 0deg boom elevation
With the crane traveling toward the power lines the ASE Model 2100 adjusted to maxishymum sensitivity alarmed at 20 ft (61 m) from the power lines When the crane was set up at this location and the fully extended boom was swung right toward the portable power lines the Model 2100 alarmed at 701 ft (214 m) 623 ft (190 m) and 527 ft (161 m) for 0deg elevation boom tip at power line height and 61deg elevation respectively
Test Set 10
Connecting an equipment chassis to ground is sometimes suggested as a means to reduce the chance of a dangerous chassis voltage in the event of an accidental power line contact or to avoid an induced charge on a piece of equipment Test set 10 examined the effect on PWD pershyformance of connecting the crane chassis directly to the grounded power system neutral These tests used one set of horizontal 13-kV lines with ABC phase sequence (A-phase nearest crane) Sensitivity was adjusted once prior to testing with the crane parked in the test position on its outshyriggers the boom extended to 46 ft (140 m) (66 of full extension) the boom tip elevated to
28
approximately phase conductor level and the boom swung to a position 20 ft (61 m) from the closest conductor The same eight boom positions were used as in test sets 1 through 7 One complete series was done with the crane chassis tied directly to the grounded power system neutral then those tests were duplicated with the chassis disconnected from the system neutral (initial sensitivity adjustments were left in place for both series of tests)
For both PWDs the tests showed no significant difference in the alarm distances between the series with and without the crane chassis tied directly to the power system ground
SUMMARY OF PROXIMITY WARNING DEVICE PERFORMANCE
A review of the foregoing test results clearly illustrates that many often interrelated factors affect performance of PWDs One of the most important factors is sensitivity adjustment Both PWD manufacturers cooperating in this research adjusted the sensitivity of their devices in the same manner for each set of tests This adjustment used a relatively consistent boom position and configuration and a nominal distance of approximately 20 ft (61 m) from the power lines This adjustment was performed only twice for each of test sets 1 through 7 as detailed earlier While this approach did not optimize PWD performance for any given test it had the advantage of allowing comparisons of the effects of changes in power line and boom configurations Most of the performance assessments presented in this section highlight and rank the effects of these factors on the accuracy and reliability of the two PWDs tested
Power Line Configurations
Test sets 1 through 7 examined the effects of differences in power line configurations on PWD performance and included 284 individual tests12
12The number 284 is based on counting the same test run for each PWD as two tests
Of these 284 tests 108 had a boom elevashytion of 0deg (boom approximately level with the ground) which allowed the boom to be swung below the power lines without coming within 20 ft (61 m) (true distance) of any phase conshyductor (20 ft (61 m) was the nominal distance used for PWD sensitivity adjustments) As disshycussed earlier operating with the boom directly above or below overhead power lines can be very hazardous and should normally be avoided For these 108 tests however the horizontal boom passing below the power lines without triggering an alarm is considered acceptable PWD operation since the boom was never closer than 20 ft (61 m) (true distance) from an energized conductor Of these 108 cases 15 caused a PWD alarm which by the criteria just described conshystitutes an ldquoearly alarmrdquo The remaining 176 tests (those with the boom elevated such that the tip is at power line height or elevated to 61deg) should have all resulted in PWD alarms ideally at approximately 20 ft (61 m) from the closest phase conductor Of these 176 tests 148 produced alarms The 28 remaining tests that did not cause an alarm were stopped when the boom was 10 ft (30 m) from the power lines Of the 148 alarm activations 140 were early alarms (more than 20 ft (61 m) from power lines) and 8 were ldquolate alarmsrdquo (less than 20 ft (61 m) and more than 10 ft (30 m) from the lines)
Table 9 summarizes PWD alarm performance based on different power line configurashytions for test sets 1 through 7 The table lists the number of no alarm early alarm and late alarm cases for each test set as well as the average of alarm distance deviations from 20 ft (61 m) (magnitudes) for the tests that caused alarm activations
29
Test set No and power line configuration
SIGALARM Model 210
ASE Model 2100
Alarm record 1 (a) No alarm
1 (b) Late alarm 2 (c) Early alarm
Alarm distance
deviation3
ft (m)
Alarm record 1 (a) No alarm
1 (b) Late alarm 2 (c) Early alarm
Alarm distance
deviation3
ft (m)
1 One horizontal line set 13 kV
(a) 5 of 10 (b) 1 of 10 (c) 4 of 16
94 (29)
(a) 2 of 10 (b) 0 of 10 (c) 8 of 16
203 (62)
2 One vertical line set 25 kV
(a) 2 of 8 (b) 2 of 8 (c) 4 of 14
90 (27)
(a) 3 of 8 (b) 1 of 8 (c) 4 of 14
106 (32)
3 Two horizontal line sets
on same poles 13 kV13 kV
(a) 3 of 10 (b) 1 of 10 (c) 6 of 16
126 (38)
(a) 2 of 10 (b) 0 of 10 (c) 8 of 16
194 (59)
4 Two horizontal line sets
on same poles 25 kV13 kV
(a) 2 of 10 (b) 0 of 10 (c) 8 of 16
135 (41)
(a) 2 of 10 (b) 0 of 10 (c) 8 of 16
275 (84)
5
Two line sets one vertical over one horizontal on same poles 25 kV13 kV
(a) 2 of 10 (b) 0 of 10 (c) 11 of 16
275 (84)
(a) 2 of 10 (b) 1 of 10 (c) 8 of 16
239 (73)
6
Two horizontal line sets crossing at 90deg 13 kV13 kV
Left swing
(a) 4 of 10 (b) 0 of 10 (c) 6 of 16
182 (55)
(a) 2 of 10 (b) 0 of 10 (c) 8 of 16
219 (67)
6
Two horizontal line sets crossing at 90deg 13 kV13 kV Right swing
(a) 5 of 10 (b) 2 of 10 (c) 4 of 16
238 (73)
(a) 2 of 10 (b) 0 of 10 (c) 9 of 16
227 (69)
7
Two horizontal line sets crossing at 90deg 25 kV13 kV Left swing toward
25-kV lines
(a) 0 of 10 (b) 0 of 10 (c) 15 of 16
356 (109)
(a) 1 of 10 (b) 0 of 10 (c) 11 of 16
345 (105)
7
Two horizontal line sets crossing at 90deg 25 kV13 kV Right swing toward
13-kV lines
(a) 2 of 10 (b) 0 of 10 (c) 10 of 16
432 (132)
(a) 2 of 10 (b) 0 of 10 (c) 8 of 16
373 (114)
1The denominator in this entry refers to tests in the category listed where an alarm should have occurred at approximately 20 ft (61 m) from the power lines 2The denominator in this entry refers to all tests in the category listed 3Deviation refers to the average of the magnitudes for (true alarm distance ndash 20 ft (61 m)) where 20 ft (61 m) is the nominal distance used for sensitivity adjustments The exception is for tests with 0deg boom elevation where the deviation is the horizontal distance from the boom to the closest phase conductor at the point of alarm activation
Table 9mdashSummary of PWD alarm performance based on power line configuration
30
Test set No and power line configuration
Alarm distance deviation1 ft (m) (Boom configuration boom tip at power line level and
boom extension at 50)
SIGALARM Model 210 ASE Model 2100
1 One horizontal line set 13 kV 6 (18)
9 (27)
2 One vertical line set 25 kV ND ND
3 Two horizontal line sets on same poles 13 kV13 kV
6 (18)
10 (31)
4 Two horizontal line sets on same poles 25 kV13 kV
8 (24)
11 (34)
5 Two line sets one vertical over one horizontal on same poles 25 kV13 kV
15 (46)
12 (37)
6 Two horizontal line sets crossing at 90deg 13 kV13 kV
Left swing
9 (27)
9 (27)
6 Two horizontal line sets crossing at 90deg 13 kV13 kV Right swing
4 (12)
14 (43)
7 Two horizontal line sets crossing at 90deg 25 kV13 kV Left swing toward 25-kV lines
35 (107)
34 (104)
7 Two horizontal line sets crossing at 90deg 25 kV13 kV
Right swing toward 13-kV lines
37 (113)
37 (113)
ND No data 1Deviation refers to the average of the magnitudes for (true alarm distance ndash 20 ft (61 m)) where 20 ft (61 m) is the nominal distance used for sensitivity adjustments
Table 10 summarizes PWD alarm performance based on different power line configurashytions for test sets 1 through 7 when analysis was limited only to tests where the boom extension was at 50 and the boom elevation was such that the tip was approximately at power line level This configuration approximated the general position used for sensitivity adjustments so the performance data do not include the adverse effects of having the boom fully retracted andor at 0deg elevation (usually resulting in no alarm) or at full extension andor 61deg elevation (often causshying early alarms)
Table 10mdashSummary of PWD alarm performance based on power line configuration when analysis is limited only to tests where the boom extension was at 50
and the boom elevation was such that the tip was approximately at power line level
In analyzing the foregoing data no distinct pattern emerges with respect to PWDs failing to alarm or alarming late based only on the influence of power line configuration An examinashytion of the deviations in alarm distance however for the cases where the devices did alarm shows that accuracy was best for simple single-circuit installations (45ndash100 average devishyation) but degraded somewhat for multiple circuits on the same poles (65ndash138 average
31
deviation) This degradation was slightly greater for installations with different voltage levels andor both vertical and horizontal conductor arrangements Performance degraded further for crane operation between two intersecting power line installations (90ndash215 average devishyation) The worst accuracy was associated with intersecting line installations at different voltages
When analysis is limited to only the data from tests where the boom position approxishymated sensitivity adjustment conditions (Table 10) PWD accuracy displays a pattern similar to that in the results for all boom positions In the limited data case however PWD performance seemed to be more sensitive to and adversely affected by the presence of two different voltage levels near the crane
Another behavior seen in the data is the tendency of the SIGALARM PWD to be more accurate when swinging left versus right with the crane positioned between intersecting power line sets This may be due to placement of the SIGALARM probe on the left side of the boom
Crane Boom Configurations
Test sets 1 through 7 were also used to examine the effects of different crane boom posishytions on PWD performance This evaluation included the 284 individual tests described previshyously of which 108 tests with 0deg boom should have produced no alarm and the remaining 176 should have ideally caused the PWDs to alarm at approximately 20 ft (61 m) from the power lines Table 11 details the results for these tests when grouped according to boom angle and boom extension The table lists the number of no alarm early alarm and late alarm cases for each boom parameter individually as well as the average of alarm distance deviations from 20 ft (61 m) (magnitudes) for the tests that caused alarm activations
32
Table 11mdashSummary of PWD alarm performance based on crane boom elevation angle or extension
SIGALARM Model 210 ASE Model 2100
Alarm record Alarm Alarm record Alarm Crane boom parameter 1 1 (a) No alarm distance (a) No alarm distance 1 1 (b) Late alarm deviation3 (b) Late alarm deviation3
2 2 (c) Early alarm ft (m) (c) Early alarm ft (m) (a) NA (a) NA 405 285 0deg boom elevation (b) NA (b) NA (123) (87) (c) 11 of 54 (c) 4 of 54
Boom elevation placing boom (a) 0 of 34 (a) 0 of 34 224 275 tip approximately level with (b) 2 of 34 (b) 0 of 34 (68) (84) power lines (c) 32 of 34 (c) 34 of 34 (a) 25 of 54 (a) 18 of 54 207 226 61deg boom elevation (b) 4 of 54 (b) 2 of 54 (63) (69) (c) 25 of 54 (c) 34 of 54
Minimum boom extension (a) 16 of 18 (a) 17 of 18 Boom length 28 ft (85 m) from 187 40 (b) 0 of 18 (b) 0 of 18 base pivot pin to point sheave (57) (12) (c) 3 of 36 (c) 1 of 36 pin 50 boom extension (a) 4 of 34 (a) 1 of 34 Boom length 487 ft (148 m) 175 166 (b) 6 of 34 (b) 2 of 34 from base pivot pin to point (53) (51) (c) 28 of 52 (c) 32 of 52 sheave pin 100 boom extension (a) 5 of 36 (a) 0 of 36 Boom length 694 ft (212 m) 311 319 (b) 0 of 36 (b) 0 of 36 from base pivot pin to point (95) (97) (c) 37 of 54 (c) 39 of 54 sheave pin
NA Not applicable 1The denominator in this entry refers to tests in the category listed where an alarm should have occurred at approximately 20 ft (61 m) from the power lines 2The denominator in this entry refers to all tests in the category listed 3Deviation refers to the average of the magnitudes for (true alarm distance ndash 20 ft (61 m)) where 20 ft (61 m) is the nominal distance used for sensitivity adjustments The exception is for tests with 0deg boom elevation where the deviation is the horizontal distance from the boom to the closest phase conductor at the point of alarm activation
Based on the results presented in Table 11 the PWDs were most likely to fail to alarm when the crane boom was operated at minimum extension (89ndash94 failed to alarm) andor at 61deg elevation angle (33ndash46 failed to alarm) For the tests where the devices did alarm the accuracy was poorest at 100 boom extension (160 average deviation) andor 0deg boom elevashytion (145ndash205 average deviation)
33
Other Factors
Use of a PWD as an Early Warning Device
Test sets 8 and 9 emulated the use of a PWD to provide an ldquoearly warningrdquo of a power line(s) for a crane traveling into an unfamiliar work area With the crane in travel configuration and both PWDs set at maximum sensitivity the SIGALARM Model 210 alarmed at 75ndash82 ft (229ndash250 m) from a single set of 13-kV power lines (depending on approach angle) and 88 ft (268 m) from two intersecting sets of 13-kV power lines These alarm distances should be suffishycient for an operator to take preventive measures before the crane is in a position from which it could contact nearby power lines The ASE Model 2100 allowed the crane in travel configurashytion to approach and travel under the single set of 13-kV lines without alarm activation but did alarm at a point 20 ft (61 m) from the two intersecting sets of 13-kV power lines
Effect of Connecting the Crane Chassis to a Grounded Power System Neutral
Test set 10 examined the effect of directly connecting the crane chassis to the solidly grounded neutral of a three-phase overhead power line system (all other testing had no delibershyate direct connection of the chassis to the power system neutral) For the test conditions used the PWDs showed no significant difference in performance due to connection of the crane chassis to a grounded power system neutral
Effect of Multiple Independent Power Line Circuits
Several tests under test set 7 created conditions under which PWD alarm activation would cease and then resume during one continuous swing of the boom toward a set of power lines This behavior was documented for two power line sets intersecting at 90deg operating at different voltages and having opposite phase sequencing PWD sensitivities were adjusted at 20 ft (61 m) from the lower voltage lines and the boom swing (wherein the alarm dropout occurred) was toward the lower voltage lines while simultaneously moving away from the higher voltage lines While this behavior was not thoroughly investigated during this research the sevshyeral cases in which it was noted clearly illustrate that PWD performance can be compromised when a crane is simultaneously exposed to electric fields from multiple independent overhead power line circuits
Effect of Power Line Phase Sequence
In test sets 1 through 7 one varied parameter was the phase sequence for the three-phase circuit involved or for one of two circuits when two sets of power lines were used This is an important issue since there is no convention in distribution power line construction standards for the relative position of specific phases in a three-phase overhead line installation and any effect of phase sequence on PWD performance will be random For test sets 1 through 7 tests were run with the sequence as ABC on all circuits with A-phase nearest the crane (or with A at the top for a vertical conductor arrangement) The tests were then run again with the phase sequence reversed (CBA) either on the one circuit involved or on one of two circuits used Table 12 details the variations in PWD accuracy due to introduction of CBA phase sequence
34
Test set No and power line configuration
Change in PWD alarm distance deviation due to 1 introduction of CBA phase sequence
SIGALARM Model 210 ASE Model 2100
1 One horizontal line set 13 kV 16 increase 7 increase
2 One vertical line set 25 kV 31 increase 7 decrease
3 Two horizontal line sets on same poles 13 kV13 kV 47 decrease 60 decrease
4 Two horizontal line sets on same poles 25 kV13 kV 25 decrease 3 increase
5 Two line sets one vertical over one horizontal on same poles 25 kV13 kV 41 decrease 63 decrease
6 Two horizontal line sets crossing at 90deg 13 kV13 kV
Left swing 36 decrease 36 decrease
6 Two horizontal line sets crossing at 90deg 13 kV13 kV Right swing
36 increase 39 decrease
7 Two horizontal line sets crossing at 90deg 25 kV13 kV Left swing toward 25-kV lines
40 increase 10 increase
7 Two horizontal line sets crossing at 90deg 25 kV13 kV
Right swing toward 13-kV lines 29 increase 2 decrease
1Change in alarm distance deviation was calculated as ((change in average of alarm distance deviation magnitudes for tests with CBA phase sequence divide average of alarm distance deviation magnitudes for tests with ABC phase sequence) times 100) Deviation was defined as follows (true alarm distance minus 20 ft (61 m)) for tests producing alarms (except tests with 0deg boom elevation) or the horizontal distance from the boom to the closest phase conductor for tests with 0deg boom elevation or 10 ft (30 m) for tests that should have caused an alarm but did not (In the last case the boom swing was stopped 10 ft (30 m) from the closest phase conductor when no alarm occurred) See ldquoResultsrdquo section for details on reversal of three-phase sequence for each test configuration
Table 12mdashSummary of PWD alarm performance changes due to reversal of power line phase sequence
Results in Table 12 indicate that the PWDs tested were normally more accurate when two power line circuits on the same poles had opposite phase sequences compared to the same cirshycuits with matching sequences This was also the pattern for intersecting power line circuits at the same voltage (notwithstanding the SIGALARMrsquos poorer performance for right swings) Opposite phase sequence however was more likely to degrade accuracy for intersecting power line circuits operating at different voltages
Sensitivity Adjustments
Manufacturerrsquos literature for the SIGALARM Model 210 recommends that if the device is to be used as a ldquoproximity warning devicerdquo as opposed to an ldquoautomatic early power line warning devicerdquo the device should be ldquocalibratedrdquo (sensitivity-adjusted) with the boom retracted
35
to the minimum length expected to be used and positioned at a distance from the power lines at least twice that required by 29 CFR or state regulations The literature adds that if a specific boom extension is to be used for an extended period the device should be calibrated with the boom at that length [Allied Safety Systems LLC 2008] Manufacturerrsquos literature for the ASE Model 2200 (similar to the Model 2100 used in this testing) recommends that the ldquosetpointrdquo be selected based on electric field strength with the boom at approximately 45deg elevation the boom tip approximately 10 ft (30 m) higher than power line level and a minimum distance from the nearest conductor of no less than 10 ft (30 m) [Allied Safety Engineering 2008]
Sensitivity adjustment of PWDs is an issue that directly affects the practical utility of these devices The test results detailed in this report clearly reveal that many factors can degrade the performance of the PWDs Foremost among these is change in boom length and elevation angle after a sensitivity adjustment has been made As a result selecting the boom position for sensitivity adjustment and more importantly recognizing when sensitivity should be readjusted become important decisions for the user of either PWD tested For crane operation that involves frequent changes in crane position andor boom and load configuration frequent PWD sensishytivity adjustments can improve performance Frequent readjustments however could reach a point where it is a distraction and annoyance to the operator and crew Ultimately a decision must be reached that balances both PWD accuracy and practicality without compromising pershysonnel safety
RECOMMENDATIONS FOR FUTURE RESEARCH
Results from this research indicate that several issues need further investigation PWD performance should be evaluated for crane operation involving only small changes in boom length (less than plusmn 5 ft (15 m) and boom elevation angle (less than plusmn 8deg) This may be a more accurate representation of ldquotypicalrdquo crane operation in the field Two specific areas that warrant more study are crane operation near multiple independent overhead power line circuits and anomalies associated with power line circuit phase sequence reversal Both of these factors can have an adverse and from the operatorrsquos perspective unpredictable effect on PWD performance In addition research should be conducted to develop and evaluate PWD technologies that can avoid the limitations of electric field measurement that have been highlighted in this report
REFERENCES
Allied Safety Engineering [2008] Proximity warning device ASE model 2200 [httpalliedsafetyengcommode=pwd] Date accessed May 2008 Allied Safety Systems LLC [2008] SIGALARM [httpwwwsigalarminccom sigalarmhtm] Date accessed May 2008
ANSI [1995] American national standard for mobile and locomotive cranes New York American National Standards Institute ANSIASME B305
Cawley JC Homce GT [2003] Occupational electrical injuries in the United States 1992ndash1998 and recommendations for safety research J Safety Res 34(3)241ndash248
CFR Code of federal regulations Washington DC US Government Printing Office Office of the Federal Register
Hipp JE Henson FD Martin PE Phillips GN [1980] Evaluation of proximity warning devices Phase I interim report San Antonio TX Southwest Research Institute pp 11ndash13 US Bureau of Mines contract No J0188082 NTIS No PB 80-144413
36
APPENDIX AmdashLIST OF COOPERATORS
Below is a list of the cooperators involved in developing the test plan for the performance evaluation of overhead electrical power line PWDs described in this report
bull Allied Safety Systems LLC (SIGALARM) (PWD manufacturer) Lance Burney bull Allied Safety Engineering (PWD manufacturer) Irvin Nickerson bull Association of Equipment Manufacturers Richard Dressler bull International Union of Operating Engineers AFL-CIO Emmett Russell bull Center for Construction Research and Training (formerly known as the Center to Protect Workersrsquo Rights) Michael McCann PhD CIH bull Occupational Safety and Health Administration Kenneth Klouse bull Zachry Construction Corp Joseph Collins bull LMK Engineers (NIOSH contractor) Jan Shingler PE Joseph Deane PE and George Gehring PE
37
Delivering on the Nationrsquos promise safety and health at work for all people through research and prevention
To receive NIOSH documents or more information about occupational safety and health topics contact NIOSH at
1ndash800ndashCDCndashINFO (1ndash800ndash232ndash4636) TTY 1ndash888ndash232ndash6348 e-mail cdcinfocdcgov
or visit the NIOSH Web site at wwwcdcgovniosh
For a monthly update on news at NIOSH subscribe to NIOSH eNews by visiting wwwcdcgovniosheNews
DHHS (NIOSH) Publication No 2009ndash110
SAFER bull HEALTHIER bull PEOPLEtrade
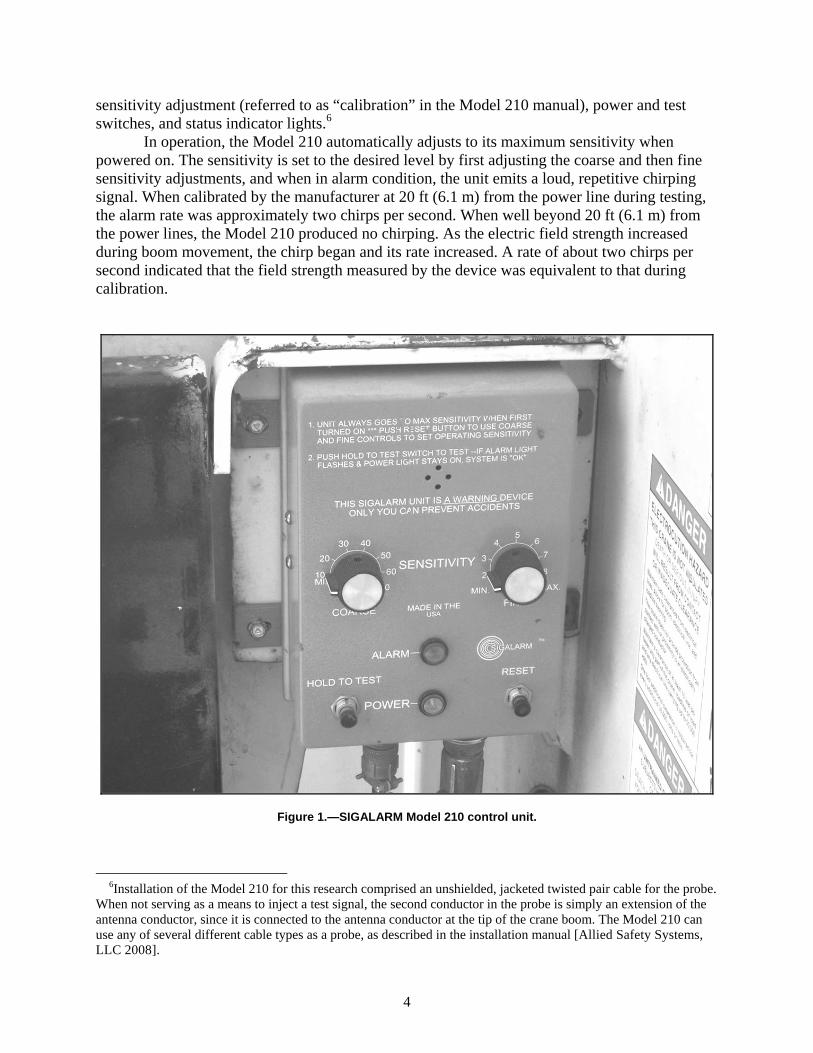

Intersecting 13 kV overhead power line installations
Crane boom at full extensionand 61O elevation angle
Distance fromcrane hoistropes topower lines
Intersecting 13 kV overhead power line installations
Distance from crane hoist ropes to power lines
Crane boom at full extension and 61O elevation angle
Data Collection Process
Data collection for this research required documenting the crane boom position relative to the energized overhead power lines for each test in order to allow evaluation of PWD performshyance This was done by determining the relative three-dimensional (3-D) positions of the power lines and boom and recording this information as a computer model from which the relevant boom to power line distances (ldquotruerdquo distances) can be extracted The 3-D information was obtained using a ldquototal stationrdquo surveying instrument which allows precise measurement of horishyzontal and vertical angles as well as slope distance from the instrument to target points Use of the instrument required precise placement of reference targets (made of a special reflective mateshyrial) on the crane boom and the overhead power line installations
Using the survey coordinates of two reference points on either (or both) sets of overhead power lines and accurate measurements of the poles and conductors a 3-D model of the test site for each power line configuration was created Then for all tests the boom positions for both sensitivity adjustments and cases of alarm activation were mapped in the same 3-D space as the power lines Each boom model was based on the survey coordinates of two reference points on the boom and detailed boom dimensions Figure 6 is an example of a computer model for an individual test With the graphical computer models of the power lines and crane boomhoist ropes mapped in the same 3-D space the distance between the boomhoist ropes and power lines is readily determined by simply defining the shortest line between potential contact points for the two and noting its length
To verify the boom to power line distances obtained from the models manual measureshyments of the horizontal boom to power line distances (ldquoobservedrdquo distances) were made for all alarm activations These were made by noting the position of the crane load hook with respect to a distance reference grid painted on the ground at the test site The zero lines for the distance reference grid were directly below the nearest phase conductors for horizontal configuration lines (at 13-kV spacing)
Figure 6mdashExample of a computer model used for analyzing crane boom position relative to overhead power lines
10
Test Procedures
The PWDs as mounted on the crane by the manufacturers were tested by operating the crane near energized overhead power lines Different test sets varied the crane boom position relative to the power lines as well as power line configuration (number of three-phase circuits pole configuration conductor arrangement voltage level and phase sequencing) Within each test set individual tests involved swinging the boom toward the lines while at predetermined combinations of crane boom extension and elevation angle and then documenting the response of each PWD Most tests specified that the crane be operated from a stationary position (chassis supported on outriggers) However several tests involved the crane approaching the power lines to simulate entering an unfamiliar work area
A typical test for operation of the crane from a stationary position began by positioning the crane adjacent to the power lines and deploying its outriggers supported on wooden blocks For tests using a single set of poles the crane chassis centerline was parallel to the power lines and approximately 30 ft (91 m) horizontally from the closest phase conductor as shown in Figure 7(a) For two sets of poles with power lines intersecting at 90deg the crane chassis center-line bisected the angle between the power lines with the boomrsquos center of rotation approxishymately 30 ft (91 m) horizontally from the closest phase conductor of each set as shown in Figure 7(b)
BoomSwing
SwingStarting
Point
Crane
Power Lines
30 ft(91 m)
BoomSwing
SwingStarting
Point
Crane
Power Lines
30 ft(91 m)
PowerLines
30 ft(91 m)
(a) (b)
Boom Swing
Swing Starting
Point
Crane
Power Lines
30 ft (91 m)
Boom Swing
Swing Starting
Point
Crane
Power Lines
30 ft (91 m)
Power Lines
30 ft (91 m)
(a) (b)
Figure 7mdashCrane locations for tests involving operation from a stationary position
PWD sensitivities were then adjusted per on-site direction from the manufacturers The criteria used for these adjustments called for the PWDs to alarm if the crane boom or hoist ropes moved to within 20 ft (61 m) of the closest phase conductor After sensitivity adjustment the boomrsquos 3-D position relative to the power lines was documented using the total station surveying instrument Notwithstanding the 20-ft (61-m) alarm requirement the manufacturers were free to specify the specific procedures for adjusting PWD sensitivities as well as how frequently the devices would be readjusted during testing
11
The crane boom was then rotated horizontally to the swing starting point as shown in Figure 7 elevated and extended per the test plan and swung toward the power lines When either PWD alarm would activate the boom was stopped and its 3-D position relative to the power lines was documented The observed distance from the boom or hoist ropes to the power lines was also estimated using a distance reference grid painted on the ground If an alarm activated at the maximum distance from the power lines (ie before the boom was moved) this position was documented If a PWD did not alarm at or before the 20-ft (61-m) limit the boom swing was continued until alarm activation occurred or until the boom or hoist ropes were 10 ft (30 m) from the power lines The boom and hoist ropes were never allowed to come closer than 10 ft (30 m) to an energized power line during testing Note that in cases where the boom elevation was 0deg the boom was swung until directly under the closest phase conductor since at this point it was still greater than 20 ft (61 m) (vertically) from the power lines Figure 8 shows the test site and crane
Figure 8mdashGrove RT522 crane on outriggers positioned adjacent to overhead power lines with boom at 50 extension and boom tip approximately level with lower set of lines
12
For tests that simulated the crane in travel configuration approaching the power lines the PWDs were adjusted to maximum sensitivity Upon activation of an alarm the crane was stopped and set up for stationary operation on outriggers at that location Tests were then conshyducted by swinging the fully extended boom toward the power lines while at different elevations
Crane Boom Position Data Analysis
Position survey data and computer modeling were used to precisely record the relative positions of the overhead power lines and crane boom for sensitivity adjustment positions and each alarm activation point during testing The criteria used to determine the true distance between the boom or hoist ropes and the power lines for each test (from the models) was based on the position of the boom and the most likely point of contact with a power line conductor For tests where the boom was at a 0deg elevation angle or where the boom tip was at power line level the true distance is the shortest distance from the tip of the boom to the closest phase conductor For tests where the boom elevation angle was at the maximum used (61deg) the true distance is the shortest distance from the hoist ropes to the closest phase conductor Consideration of power line contact by hoisted loads was beyond the scope of this research
Test Plan
Most of the tests conducted in this research quantified the influence on PWD performshyance of variations in power line configuration and changes in crane boom parameters after initial PWD sensitivity adjustment Table 1 is a listing of test sets 1 through 7 organized according to power line configuration (crane operating from a stationary position)
Table 1mdashPower line configuration detail for test sets 1 through 7
Test set
No
No of three-phase
circuits
Circuit No 1 Circuit No 2 Relationship of two power line
circuits Voltage (kV)
Configushyration
Neutral conductor
Voltage (kV)
Configushyration
Neutral conductor
1 1 13 H Yes 2 1 25 V No1 3 2 13 H Yes 13 H Yes On same poles 4 2 13 H Yes 25 H Yes On same poles 5 2 13 H Yes 25 V No1 On same poles 6 2 13 H Yes 13 H Yes Intersect at 90deg
7 2 13 H Yes 25 H Yes Intersect at 90deg H Horizontal V Vertical 1This 25-kV power line simulates a subtransmission circuit which typically would not include a neutral
conductor
Each test set was run once with the phase conductors arranged ABC with A-phase nearest the crane for horizontal lines and at the top for vertical lines and then run again with the circuit (or one of the two circuits involved) arranged CBA in order to evaluate the effect of reversing the electrical ldquosequencerdquo of the phase conductors Within each of the 14 resulting groups of tests an individual test was run for each of 8 possible crane boom configurations These
13
configurations represented all possible combinations of three boom extension lengths (minimum 50 and maximum)8 and three elevation angles (0deg boom tip at power line height and 61deg)910
8These extensions give boom lengths of 28 ft (85 m) 487 ft (148 m) and 694 ft (212 m) respectively from base pivot pin to point sheave pin 9Sixty-one degrees was the maximum elevation angle (at minimum boom length) at which the load hook was not over the crane chassis 10With the boom at ldquominimum boom lengthrdquo it could not be positioned with the ldquoboom tip at power line heightrdquo for any power line configuration used Therefore this combination was not possible
The crane load block (hoisting hook) was positioned approximately 5 ft (15 m) from the ground for sensitivity adjustments and tests The exception to the 5-ft (15-m) load block height was for the combination of maximum boom extension and 61deg elevation angle for which the hoist block was positioned 23 ft (70 m) from the ground due to insufficient hoist rope on the crane
Additional test sets were included to examine other aspects of PWD performance such as using maximum device sensitivity for the time a crane is in transit in order to alert the operator and crew that power lines are somewhere in or near an unfamiliar work area as the crane approaches Ideally this warning would be well before the crane is in close proximity to the lines Test set 8 placed the crane in a travel configuration approaching a single set of horizontal power lines with PWDs set at maximum sensitivity to determine the greatest distance at which the lines could be detected Test set 9 had the crane with PWDs again set at maximum sensishytivity approach two sets of horizontal lines intersecting at 90deg to determine whether the alarm distance was influenced by the additional set of power lines
Test set 10 examined the effect of having the crane chassis tied directly to the power sysshytemrsquos grounded neutral while operating from a stationary position Connecting an equipment chassis to ground is sometimes suggested as a means to reduce the chance of a dangerous chassis voltage in the event of an accidental power line contact or to reduce induced charges on a piece of equipment
RESULTS
The following sections present performance data for the two PWDs tested Each section lists test and sensitivity adjustment details provides a diagram of the test layout and power line configuration and presents a table showing the distances from the overhead power lines at which the PWDs alarmed for specific conditions (or notes no alarm activation) The alarm distances as noted earlier are true distances taken from the 3-D models created for each test
Test Set 1
Test set 1 used one set of horizontal 13-kV lines Sensitivity was adjusted once prior to ABC phase sequence tests (A-phase nearest crane) and once prior to CBA phase sequence tests (C-phase nearest crane) Sensitivity was adjusted with the crane parked in the test position on its outriggers the boom extended to approximately 43 ft (131 m) (62 of full extension) the boom tip elevated to approximately phase conductor level and the boom swung to a position 20 ft (61 m) from the closest conductor11 Test layout and power line configuration are shown in Figure 9 Table 2 details performance of the PWDs for test set 1
11As described earlier the distance listed for the sensitivity adjustments is the ldquonominalrdquo distance from the power lines which was determined by using the distance reference grid painted on the ground at the test site There are slight variations in the sensitivity adjustment boom lengths listed because the boom positions were approximated in the field and then later measured precisely from the survey data-based computer models
14
Phase sequence horizontal ABC with A-phase nearest crane SIGALARM Model 210 ASE Model 2100
Boom Minimum 50 Maximum Boom Minimum 50 Maximum position extension extension extension position extension extension extension
0deg 0deg No alarm No alarm No alarm No alarm No alarm No alarm elevation elevation Boom tip Boom tip 276 361 276 518 at power (1) at power (1) (84) (110) (84) (158) line level line level
61deg 194 61deg 293 486 No alarm No alarm No alarm elevation (59) Elevation (89) (148)
Phase sequence horizontal CBA with C-phase nearest crane SIGALARM Model 210 ASE Model 2100
Boom Minimum 50 Maximum Boom Minimum 50 Maximum position extension extension extension position extension extension extension
0deg 0deg No alarm No alarm No alarm No alarm No alarm No alarm elevation elevation Boom tip Boom tip 234 386 290 534 at power (1) at power (1) (71) (118) (88) (163) line level line level
61deg 61deg 287 529 No Alarm No Alarm No Alarm No alarm elevation elevation (87) (161)
1The boom tip could not be raised to power line level with the boom at minimum extension length for any of the power line configurations used therefore this combination of extension and elevation angle was not possible
Fixed Power Lines (AA)
37 ft(113 m)
13 kV
BoomSwing
SwingStarting
Point
Crane
Fixed Power Lines
30 ft(91 m)
A
A
Fixed Power Lines (AA)
37 ft (113 m)
13 kV
Boom Swing
Swing Starting
Point
Crane
Fixed Power Lines
30 ft (91 m)
A
A
Figure 9mdashTest set 1 layout and overhead power line configuration
Table 2mdashAlarm distance results for test set 1 (Distance between boom or hoist ropes and closest phase conductor in ft (m))
15
Test Set 2
Test set 2 used one set of vertical 25-kV lines Sensitivity was adjusted once prior to ABC phase sequence tests (A-phase at top) and once prior to CBA phase sequence tests (C-phase at top) Sensitivity was adjusted with the crane parked in the test position on its outriggers the boom extended to approximately 57 ft (174 m) (82 of full extension) the boom tip elevated to approximately top phase conductor level and the boom swung to a position 20 ft (61 m) from the top conductor Test layout and power line configuration are shown in Figure 10 Table 3 details performance of the PWDs for test set 2
Fixed Power Lines (AA)
45 ft(137 m)
25 kV
BoomSwing
SwingStarting
Point
Crane
Fixed Power Lines
32 ft(98 m)
A
A
Fixed Power Lines (AA)
45 ft (137 m)
25 kV
Boom Swing
Swing Starting
Point
Crane
Fixed Power Lines
32 ft (98 m)
A
A
Figure 10mdashTest set 2 layout and overhead power line configuration
16
Phase sequence vertical ABC with A-phase at top (25 kV)
SIGALARM Model 210 ASE Model 2100
Boom Minimum 50 Maximum Boom Minimum 50 Maximum position extension extension extension position extension extension extension
0deg 0deg No alarm No alarm No alarm No alarm No alarm No alarm elevation elevation
Boom tip Boom tip 317 317 at power (1) (2) at power (1) (2) (97) (97) line level line level
61deg 121 218 61deg 121 334 No alarm No alarm elevation (37) (66) elevation (37) (102)
Phase sequence vertical CBA with C-phase at top (25 kV) SIGALARM Model 210 ASE Model 2100
Boom Minimum 50 Maximum Boom Minimum 50 Maximum position extension extension extension position extension extension extension
0deg 0deg No alarm No alarm No alarm No alarm No alarm No alarm elevation elevation
Boom tip Boom tip 321 321 at power (1) (2) at power (1) (2) (98) (98) line level line level
61deg 81 283 61deg 283 No alarm No alarm No alarm elevation (25) (86) elevation (86)
1The boom tip could not be raised to power line level with the boom at minimum extension length for any of the power line configurations used therefore this combination of extension and elevation angle was not possible 2These tests were omitted in error
Table 3mdashAlarm distance results for test set 2 (Distance between boom or hoist ropes and closest phase conductor in ft (m))
Test Set 3
Test set 3 used two sets of horizontal 13-kV lines supported on the same poles Sensishytivity was adjusted once prior to tests using ABC phase sequence on both sets of lines (A-phase nearest crane for both sets) and once prior to tests using CBA phase sequence on the upper set of lines (C-phase nearest crane for upper set) Sensitivity was adjusted with the crane parked in the test position on its outriggers the boom extended to approximately 44 ft (134 m) (63 of full extension) the boom tip elevated to approximately phase conductor level for the lower set of lines and the boom swung to a position 20 ft (61 m) from the closest conductor Test layout and power line configuration are shown in Figure 11 Table 4 details performance of the PWDs for test set 3
17
Upper set of power lines ndash phase sequence horizontal ABC with A-phase nearest crane Lower set of power lines ndash phase sequence horizontal ABC with A-phase nearest crane
SIGALARM Model 210 ASE Model 2100 Boom Minimum 50 Maximum Boom Minimum 50 Maximum
position extension extension extension position extension extension extension
0deg 0deg No alarm No alarm No alarm No alarm No alarm No alarm elevation elevation Boom tip Boom tip 272 450 2350 609 at power (1) at power (1) (83) (137) (107) (186) line level line level
61deg 296 449 61deg 370 623 No alarm No alarm elevation (90) (137) elevation (113) (190) Upper set of power lines ndash phase sequence horizontal CBA with C-phase nearest crane Lower set of power lines ndash phase sequence horizontal ABC with A-phase nearest crane
SIGALARM Model 210 ASE Model 2100 Boom Minimum 50 Maximum Boom Minimum 50 Maximum
position extension extension extension position extension extension extension
0deg 0deg No alarm No alarm No alarm No alarm No alarm No alarm elevation elevation Boom tip Boom tip 2240 319 2240 384 at power (1) at power (1) (73) (97) (73) (117) line level line level
61deg 150 61deg 223 355 No alarm No alarm No alarm elevation (46) elevation (68) (108)
1The boom tip could not be raised to power line level with the boom at minimum extension length for any of the power line configurations used therefore this combination of extension and elevation angle was not possible 2Value is the observed distance due to invalid survey data for the boom position
Fixed Power Lines (AA)
37 ft(113 m)
47 ft(143 m)
13 kV
13 kV
BoomSwing
SwingStarting
Point
Crane
Fixed Power Lines
30 ft(91 m)
A
A
Fixed Power Lines (AA)
37 ft (113 m)
47 ft (143 m)
13 kV
13 kV
Boom Swing
Swing Starting
Point
Crane
Fixed Power Lines
30 ft (91 m)
A
A
Figure 11mdashTest set 3 layout and overhead power line configuration
Table 4mdashAlarm distance results for test set 3 (Distance between boom or hoist ropes and closest phase conductor in ft (m))
18
Test Set 4
Test set 4 used two sets of horizontal power lines supported on the same poles The upper set was at 25 kV the lower set was at 13 kV Sensitivity was adjusted once prior to tests using ABC phase sequence on both sets of lines (A-phase nearest crane for both sets) and once prior to tests using CBA phase sequence on the upper set of lines (C-phase nearest crane for upper set) Sensitivity was adjusted with the crane parked in the test position on its outriggers the boom extended to approximately 43 ft (131 m) (62 of full extension) the boom tip elevated to approximately phase conductor level for the lower set of lines and the boom swung to a position 20 ft (58 m) from the closest conductor Test layout and power line configuration are shown in Figure 12 Table 5 details performance of the PWDs for test set 4
Fixed Power Lines (AA)
37 ft(113 m)
47 ft(143 m)
25 kV
13 kV
BoomSwing
SwingStarting
Point
Crane
Fixed Power Lines
29 ft(88 m)
A
A
Fixed Power Lines (AA)
37 ft (113 m)
47 ft (143 m)
25 kV
13 kV
Boom Swing
Swing Starting
Point
Crane
Fixed Power Lines
29 ft (88 m)
A
A
Figure 12mdashTest set 4 layout and overhead power line configuration
19
Upper set of power lines ndash phase sequence horizontal ABC with A-phase nearest crane (25 kV) Lower set of power lines ndash phase sequence horizontal ABC with A-phase nearest crane
SIGALARM Model 210 ASE Model 2100
Boom Minimum 50 Maximum Boom Minimum 50 Maximum position extension extension extension position extension extension extension
0deg 0deg No alarm No alarm No alarm No alarm No alarm No alarm elevation elevation
Boom tip Boom tip 228 379 293 577 at power (1) at power (1) (69) (116) (89) (176) line level line level
61deg 246 2430 61deg 345 616 No alarm No alarm elevation (75) (131) elevation (105) (188)
Upper set of power lines ndash phase sequence horizontal CBA with C-phase nearest crane (25 kV) Lower set of power lines ndash phase sequence horizontal ABC with A-phase nearest crane
SIGALARM Model 210 ASE Model 2100
Boom Minimum 50 Maximum Boom Minimum 50 Maximum position extension extension extension position extension extension extension
0deg 0deg No alarm No alarm No alarm No alarm No alarm No alarm elevation elevation
Boom tip Boom tip 211 336 297 573 at power (1) at power (1) (64) (102) (91) (175) line level line level
61deg 253 408 61deg 387 620 No alarm No alarm elevation (77) (124) elevation (118) (189)
1The boom tip could not be raised to power line level with the boom at minimum extension length for any of the power line configurations used therefore this combination of extension and elevation angle was not possible 2Value is the observed distance due to invalid survey data for the boom position
Table 5mdashAlarm distance results for test set 4 (Distance between boom or hoist ropes and closest phase conductor in ft (m))
20
Test Set 5
Test set 5 used two sets of power lines supported on the same poles The upper set was a vertical configuration at 25 kV the lower set was a horizontal configuration at 13 kV Sensitivity was adjusted once prior to tests using ABC phase sequence on both sets of lines (A-phase nearest crane for horizontal set and at top for vertical set) and once prior to tests using CBA phase sequence on the upper set of lines (C-phase at top) with the lower set remaining ABC Sensishytivity was adjusted with the crane parked in the test position on its outriggers the boom extended to approximately 44 ft (134 m) (63 of full extension) the boom tip elevated to approximately phase conductor level for the lower set of lines and the boom swung to a position 20 ft (61 m) from the closest conductor Test layout and power line configuration are shown in Figure 13 Table 6 details performance of the PWDs for test set 5
Fixed Power Lines (AA)
45 ft(137 m)
25 kV
BoomSwing
SwingStarting
Point
Crane
Fixed Power Lines
30 ft(91 m)
A
A
37 ft(113 m)
13 kV
Fixed Power Lines (AA)
45 ft (137 m)
25 kV
Boom Swing
Swing Starting
Point
Crane
Fixed Power Lines
30 ft (91 m)
A
A
37 ft (113 m)
13 kV
Figure 13mdashTest set 5 layout and overhead power line configuration
21
Upper set of power lines ndash phase sequence vertical ABC with A-phase at top (25 kV) Lower set of power lines ndash phase sequence horizontal ABC with A-phase nearest crane
SIGALARM Model 210 ASE Model 2100
Boom Minimum 50 Maximum Boom Minimum 50 Maximum position extension extension extension position extension extension extension
0deg 342 0deg No alarm No alarm No alarm No alarm No alarm elevation (104) elevation
Boom tip Boom tip 494 743 418 786 at power (1) at power (1) (151) (226) (127) (240) line level line level
61deg 2522 2650 61deg 460 2650 No alarm No alarm elevation (159) (198) elevation (140) (198)
Upper set of power lines ndash phase sequence vertical CBA with C-phase at top (25 kV) Lower set of power lines ndash phase sequence horizontal ABC with A-phase nearest crane
SIGALARM Model 210 ASE Model 2100
Boom Minimum 50 Maximum Boom Minimum 50 Maximum position extension extension extension position extension extension extension
0deg 350 412 0deg 290 No alarm No alarm No alarm elevation (107) (126) elevation (88)
Boom tip Boom tip 205 311 205 311 at power (1) at power (1) (62) (95) (62) (95) line level line level
61deg 319 2636 61deg 110 511 No alarm No alarm elevation (97) (194) elevation (34) (156)
1The boom tip could not be raised to power line level with the boom at minimum extension length for any of the power line configurations used therefore this combination of extension and elevation angle was not possible 2Alarmed at swing starting point
Table 6mdashAlarm distance results for test set 5 (Distance between boom or hoist ropes and closest phase conductor in ft (m))
22
Test Set 6
Test set 6 used two separate sets of power lines intersecting at 90deg with the centerline of the crane bisecting the angle between the power lines Both sets of lines were in a horizontal configuration operating at 13 kV The lines to the cranersquos right (from the operatorrsquos perspective) were on movable poles those to the left were on fixed poles Sensitivity was adjusted once prior to tests using ABC phase sequence on both sets of lines (A-phase nearest crane for both sets) and once prior to tests using ABC phase sequence on the fixed set and CBA on the movable set Sensitivity was adjusted with the crane parked in the test position on its outriggers the boom extended to 42 ft (128 m) (61 of full extension) the boom tip elevated to approximately phase conductor level for the lines on the left (fixed lines) and the boom swung left to a position 20 ft (61 m) from the closest conductor Test layout and power line configuration are shown in Figure 14 Table 7 details performance of the PWDs for test set 6
Fixed PowerLines (AA)
37 ft(113 m)
13 kV
BoomSwing
SwingStarting
Point
Crane
Fixed Power Lines
30 ft (91 m)
A
A 13 kV
Movable PowerLines (BB)
35 ft(107 m)
MovablePowerLines
B B
30 ft(91 m) Fixed Power
Lines (AA)
37 ft (113 m)
13 kV
Boom Swing
Swing Starting
Point
Crane
Fixed Power Lines
30 ft (91 m)
A
A 13 kV
Movable Power Lines (BB)
35 ft (107 m)
Movable Power Lines
B B
30 ft (91 m)
Figure 14mdashTest set 6 layout and overhead power line configuration
23
Fixed power lines ndash phase sequence horizontal ABC with A-phase nearest crane (left swing) Movable power lines ndash phase sequence horizontal ABC with A-phase nearest crane (right swing)
SIGALARM Model 210 ASE Model 2100
Boom Minimum 50 Maximum Boom Minimum 50 Maximum position extension extension extension position extension extension extension
Left swing Left swing Left swing Left swing Left swing Left swing No alarm No alarm No alarm No alarm No alarm No alarm0deg 0deg
elevation elevation Right swing Right swing Right swing Right swing Right swing Right swing No alarm No alarm No alarm No alarm No alarm No alarm
Left swing Left swing Left swing Left swing 293 424 293 2702 Boom tip Boom tip (89) (129) (89) (214) at power (1) at power (1)
Right swing Right swing Right swing Right swing line level line level 180 336 353 2726 (55) (102) (108) (221)
Left swing Left swing Left swing Left swing Left swing Left swing 366 2534 366 2534 No alarm No alarm 61deg (112) (163) 61deg (112) (163)elevation Right swing elevation Right swing Right swing Right swing Right swing Right swing 2534 390 2534 No alarm No alarm No alarm (163) (119) (163)
Fixed power lines ndash phase sequence horizontal CBA with C-phase nearest crane (left swing) Movable power lines ndash phase sequence horizontal ABC with A-phase nearest crane (right swing)
SIGALARM Model 210 ASE Model 2100
Boom Minimum 50 Maximum Boom Minimum 50 Maximum position extension extension extension position extension extension extension
Left swing Left swing Left swing Left swing Left swing Left swing No alarm No alarm No alarm No alarm No alarm No alarm0deg 0deg
elevation Right swing elevation Right swing Right swing Right swing Right swing Right swing 298 298 No alarm No alarm No alarm No alarm (91) (91) Left swing Left swing Left swing Left swing
291 387 291 485 Boom tip Boom tip (89) (118) (89) (148) at power (1) at power (1) Right swing Right swing Right swing Right swing line level line level 144 840 320 512
(44) (256) (98) (156) Left swing Left swing Left swing Left swing Left swing Left swing 262 419 No alarm No alarm No alarm No alarm 61deg 61deg (80) (128)
elevation elevation Right swing Right swing Right swing Right swing Right swing Right swing 278 408 No alarm No alarm No alarm No alarm (85) (124)
1The boom tip could not be raised to power line level with the boom at minimum extension length for any of the power line configurations used therefore this combination of extension and elevation angle was not possible 2Alarmed at swing starting point
Table 7mdashAlarm distance results for test set 6 (Distance between boom or hoist ropes and closest phase conductor in ft (m))
24
Test Set 7
Test set 7 used two separate sets of power lines intersecting at 90deg with the centerline of the crane bisecting the angle between the power lines Both sets of lines were in a horizontal configuration The lines to the cranersquos right (from the operatorrsquos perspective) were on movable poles and operating at 13 kV those to the left were on fixed poles and operating at 25 kV Sensishytivity was adjusted once prior to tests using ABC phase sequence on both sets of lines (A-phase nearest crane for both sets) and once prior to tests using ABC phase sequence on the fixed set and CBA on the movable set (C-phase nearest crane) Sensitivity was adjusted with the crane parked in the test position on its outriggers the boom extended to approximately 44 ft (134 m) (63 of full extension) the boom tip elevated to approximately phase conductor level for the lines on the right (13-kV movable lines) and the boom swung right to a position 20 ft (61 m) from the closest conductor Test layout and power line configuration are shown in Figure 15 Table 8 details performance of the PWDs for test set 7
Fixed PowerLines (AA)
37 ft(113 m)
25 kV
BoomSwing
SwingStarting
Point
Crane
Fixed Power Lines
29 ft (88 m)
A
A 13 kV
Movable PowerLines (BB)
35 ft(107 m)
MovablePowerLines
B B
30 ft(91 m) Fixed Power
Lines (AA)
37 ft (113 m)
25 kV
Boom Swing
Swing Starting
Point
Crane
Fixed Power Lines
29 ft (88 m)
A
A 13 kV
Movable Power Lines (BB)
35 ft (107 m)
Movable Power Lines
B B
30 ft (91 m)
Figure 15mdashTest set 7 layout and overhead power line configuration
25
Fixed power lines ndash phase sequence horizontal ABC with A-phase nearest crane (left swing) (25 kV) Movable power lines ndash phase sequence horizontal ABC with A-phase nearest crane (right swing)
SIGALARM Model 210 ASE Model 2100
Boom Minimum 50 Maximum Boom Minimum 50 Maximum position extension extension extension position extension extension extension
Left swing Left swing Left swing Left swing Left swing Left swing 297 506 No alarm No alarm No alarm No alarm0deg (91) (154) 0deg elevation elevation Right swing Right swing Right swing Right swing Right swing Right swing
No alarm No alarm No alarm No alarm No alarm No alarm
Left swing Left swing Left swing Left swing 2542 2709 2542 2709 Boom tip Boom tip (165) (216) (165) (216) at power (1) at power (1)
Right swing Right swing Right swing Right swing line level line level 2569 2738 2569 2738 (173) (225) (173) (225)
Left swing Left swing Left swing Left swing Left swing Left swing 265 2447 2528 2447 2528 No alarm 61deg (81) (136) (161) 61deg (136) (161)elevation Right swing Right swing elevation Right swing Right swing Right swing Right swing 2453 2551 2453 2551 No alarm No alarm (138) (168) (138) (168)
Fixed power lines ndash phase sequence horizontal ABC with A-phase nearest crane (left swing) (25 kV) Movable power lines ndash phase sequence horizontal CBA with C-phase nearest crane (right swing)
SIGALARM Model 210 ASE Model 2100
Boom Minimum 50 Maximum Boom Minimum 50 Maximum position extension extension extension position extension extension extension
Left swing Left swing Left swing Left swing Left swing Left swing 430 2652 2807 419 638 No alarm 0deg (131) (199) (246) 0deg (128) (195)elevation Right swing Right swing elevation Right swing Right swing Right swing Right swing 2652 2797 No alarm No alarm No alarm No alarm (199) (243)
Left swing Left swing Left swing Left swing 2545 2716 2542 2716 Boom tip Boom tip (166) (218) (165) (218) at power (1) at power (1)
Right swing Right swing Right swing Right swing line level line level 2562 2733 2562 2733 (171) (223) (171) (223)
Left swing Left swing Left swing Left swing Left swing Left swing 2368 2439 2520 240 2439 2520
61deg (112) (134) (159) 61deg (73) (134) (159)elevation Right swing Right swing elevation Right swing Right swing Right swing Right swing 2446 2529 2446 2529 No alarm No alarm (136) (161) (136) (161)
1The boom tip could not be raised to power line level with the boom at minimum extension length for any of the power line configurations used therefore this combination of extension and elevation angle was not possible 2Alarmed at swing starting point
Table 8mdashAlarm distance results for test set 7 (Distance between boom or hoist ropes and closest phase conductor in ft (m))
26
For several specific cases in test set 7 while the boom was swinging toward the lines with the PWDs in an alarm state the alarms would cease and then resume closer to the lines For the SIGALARM Model 210 with CBA phase sequence on the movable lines the right swing tests combining 0deg elevation with 50 and 100 extensions had a cessation of the alarm during the swing and resumption at 278 ft (85 m) and 342 ft (104) respectively This cessation also occurred for the ASE Model 2100 for right swing tests combining the ldquoboom tip at line heightrdquo elevation with 50 and 100 extensions with the alarm resuming at 239 ft (73 m) and 333 ft (101 m) respectively This behavior was noted only in these cases but not all tests were conshytinued past the point of alarms to check for alarm cessation
Test Set 8
Test set 8 used one set of horizontal 13-kV lines with ABC phase sequence (A-phase nearest crane) Both PWDs were adjusted to maximum sensitivity (alarm activation at greatest distance from power lines) With the boom at minimum extension and elevation and centered over the front of the crane (travel configuration) the crane was driven toward the power lines at an approach angle of 90deg 45deg from the right and 45deg from the left At the point of alarm activashytion the crane was stopped and set up on outriggers and the boom was extended to maximum length and rotated to the swing starting point Tests were then conducted by swinging the boom toward the power lines Test layout and power line configuration are shown in Figure 16
Fixed Power Lines (AA)
37 ft(113 m)
13 kV
BoomSwing
SwingStarting
Point
Fixed Power Lines
Crane
A
A
90O 45O Right45O Left
Fixed Power Lines (AA)
37 ft (113 m)
13 kV
Boom Swing
Swing Starting
Point
Fixed Power Lines
Crane
A
A
90O 45O Right45O Left
Figure 16mdashTest set 8 layout and overhead power line configuration
With the crane traveling toward the power lines the SIGALARM Model 210 adjusted to maximum sensitivity alarmed at 820 ft (250 m) 834 ft (254 m) and 751 ft (229 m) from the power lines for 90deg 45deg right and 45deg left approaches respectively (measured perpendicular to the power lines) When the crane was set up at the 90deg approach alarm point and the fully extended boom was swung left toward the lines at 0deg elevation boom tip at line height and 61deg elevation the Model 210 alarmed at 1475 ft (450 m) 1656 ft (505 m) and 1240 ft (381 m) respectively Based on these results boom swing tests were omitted for the 45deg approach alarm points
With the crane traveling toward the power lines the ASE Model 2100 at maximum sensishytivity did not alarm while approaching the power lines The tests were terminated when the crane boom was directly under the lines
27
Test Set 9
Test set 9 used two sets of horizontal 13-kV lines with ABC phase sequence (A-phase nearest crane) intersecting at 90deg Both PWDs were adjusted to maximum sensitivity (alarm actishyvation at greatest distance from power lines) With the boom at minimum extension and elevashytion and centered over the front of the crane the crane was driven toward the power lines on a path bisecting the angle between the lines At the point of alarm activation the crane was stopped and set up on outriggers and the boom was extended to maximum length and rotated to the swing starting point Tests were then conducted by swinging the boom toward the power lines Test layout and power line configuration are shown in Figure 17
Fixed PowerLines (AA)
37 ft(113 m)
13 kV
BoomSwing
SwingStarting
Point
Crane
Fixed Power Lines A
A 13 kV
Movable PowerLines (BB)
35 ft(107 m)
MovablePowerLines
B B
Fixed Power Lines (AA)
37 ft (113 m)
13 kV
Boom Swing
Swing Starting
Point
Crane
Fixed Power Lines A
A 13 kV
Movable Power Lines (BB)
35 ft (107 m)
Movable Power Lines
B B
Figure 17mdashTest set 9 layout and overhead power line configuration
With the crane traveling toward the power lines the SIGALARM Model 210 adjusted to maximum sensitivity alarmed at 88 ft (268 m) from both sets of power lines (observed distance measured perpendicular to both sets of power lines) When the crane was set up at this location and the fully extended boom was swung right toward the portable power lines the Model 210 alarmed at 1542 ft (470 m) and 1362 ft (415 m) for the boom tip at power line height and 61deg elevation respectively No data were obtained for 0deg boom elevation
With the crane traveling toward the power lines the ASE Model 2100 adjusted to maxishymum sensitivity alarmed at 20 ft (61 m) from the power lines When the crane was set up at this location and the fully extended boom was swung right toward the portable power lines the Model 2100 alarmed at 701 ft (214 m) 623 ft (190 m) and 527 ft (161 m) for 0deg elevation boom tip at power line height and 61deg elevation respectively
Test Set 10
Connecting an equipment chassis to ground is sometimes suggested as a means to reduce the chance of a dangerous chassis voltage in the event of an accidental power line contact or to avoid an induced charge on a piece of equipment Test set 10 examined the effect on PWD pershyformance of connecting the crane chassis directly to the grounded power system neutral These tests used one set of horizontal 13-kV lines with ABC phase sequence (A-phase nearest crane) Sensitivity was adjusted once prior to testing with the crane parked in the test position on its outshyriggers the boom extended to 46 ft (140 m) (66 of full extension) the boom tip elevated to
28
approximately phase conductor level and the boom swung to a position 20 ft (61 m) from the closest conductor The same eight boom positions were used as in test sets 1 through 7 One complete series was done with the crane chassis tied directly to the grounded power system neutral then those tests were duplicated with the chassis disconnected from the system neutral (initial sensitivity adjustments were left in place for both series of tests)
For both PWDs the tests showed no significant difference in the alarm distances between the series with and without the crane chassis tied directly to the power system ground
SUMMARY OF PROXIMITY WARNING DEVICE PERFORMANCE
A review of the foregoing test results clearly illustrates that many often interrelated factors affect performance of PWDs One of the most important factors is sensitivity adjustment Both PWD manufacturers cooperating in this research adjusted the sensitivity of their devices in the same manner for each set of tests This adjustment used a relatively consistent boom position and configuration and a nominal distance of approximately 20 ft (61 m) from the power lines This adjustment was performed only twice for each of test sets 1 through 7 as detailed earlier While this approach did not optimize PWD performance for any given test it had the advantage of allowing comparisons of the effects of changes in power line and boom configurations Most of the performance assessments presented in this section highlight and rank the effects of these factors on the accuracy and reliability of the two PWDs tested
Power Line Configurations
Test sets 1 through 7 examined the effects of differences in power line configurations on PWD performance and included 284 individual tests12
12The number 284 is based on counting the same test run for each PWD as two tests
Of these 284 tests 108 had a boom elevashytion of 0deg (boom approximately level with the ground) which allowed the boom to be swung below the power lines without coming within 20 ft (61 m) (true distance) of any phase conshyductor (20 ft (61 m) was the nominal distance used for PWD sensitivity adjustments) As disshycussed earlier operating with the boom directly above or below overhead power lines can be very hazardous and should normally be avoided For these 108 tests however the horizontal boom passing below the power lines without triggering an alarm is considered acceptable PWD operation since the boom was never closer than 20 ft (61 m) (true distance) from an energized conductor Of these 108 cases 15 caused a PWD alarm which by the criteria just described conshystitutes an ldquoearly alarmrdquo The remaining 176 tests (those with the boom elevated such that the tip is at power line height or elevated to 61deg) should have all resulted in PWD alarms ideally at approximately 20 ft (61 m) from the closest phase conductor Of these 176 tests 148 produced alarms The 28 remaining tests that did not cause an alarm were stopped when the boom was 10 ft (30 m) from the power lines Of the 148 alarm activations 140 were early alarms (more than 20 ft (61 m) from power lines) and 8 were ldquolate alarmsrdquo (less than 20 ft (61 m) and more than 10 ft (30 m) from the lines)
Table 9 summarizes PWD alarm performance based on different power line configurashytions for test sets 1 through 7 The table lists the number of no alarm early alarm and late alarm cases for each test set as well as the average of alarm distance deviations from 20 ft (61 m) (magnitudes) for the tests that caused alarm activations
29
Test set No and power line configuration
SIGALARM Model 210
ASE Model 2100
Alarm record 1 (a) No alarm
1 (b) Late alarm 2 (c) Early alarm
Alarm distance
deviation3
ft (m)
Alarm record 1 (a) No alarm
1 (b) Late alarm 2 (c) Early alarm
Alarm distance
deviation3
ft (m)
1 One horizontal line set 13 kV
(a) 5 of 10 (b) 1 of 10 (c) 4 of 16
94 (29)
(a) 2 of 10 (b) 0 of 10 (c) 8 of 16
203 (62)
2 One vertical line set 25 kV
(a) 2 of 8 (b) 2 of 8 (c) 4 of 14
90 (27)
(a) 3 of 8 (b) 1 of 8 (c) 4 of 14
106 (32)
3 Two horizontal line sets
on same poles 13 kV13 kV
(a) 3 of 10 (b) 1 of 10 (c) 6 of 16
126 (38)
(a) 2 of 10 (b) 0 of 10 (c) 8 of 16
194 (59)
4 Two horizontal line sets
on same poles 25 kV13 kV
(a) 2 of 10 (b) 0 of 10 (c) 8 of 16
135 (41)
(a) 2 of 10 (b) 0 of 10 (c) 8 of 16
275 (84)
5
Two line sets one vertical over one horizontal on same poles 25 kV13 kV
(a) 2 of 10 (b) 0 of 10 (c) 11 of 16
275 (84)
(a) 2 of 10 (b) 1 of 10 (c) 8 of 16
239 (73)
6
Two horizontal line sets crossing at 90deg 13 kV13 kV
Left swing
(a) 4 of 10 (b) 0 of 10 (c) 6 of 16
182 (55)
(a) 2 of 10 (b) 0 of 10 (c) 8 of 16
219 (67)
6
Two horizontal line sets crossing at 90deg 13 kV13 kV Right swing
(a) 5 of 10 (b) 2 of 10 (c) 4 of 16
238 (73)
(a) 2 of 10 (b) 0 of 10 (c) 9 of 16
227 (69)
7
Two horizontal line sets crossing at 90deg 25 kV13 kV Left swing toward
25-kV lines
(a) 0 of 10 (b) 0 of 10 (c) 15 of 16
356 (109)
(a) 1 of 10 (b) 0 of 10 (c) 11 of 16
345 (105)
7
Two horizontal line sets crossing at 90deg 25 kV13 kV Right swing toward
13-kV lines
(a) 2 of 10 (b) 0 of 10 (c) 10 of 16
432 (132)
(a) 2 of 10 (b) 0 of 10 (c) 8 of 16
373 (114)
1The denominator in this entry refers to tests in the category listed where an alarm should have occurred at approximately 20 ft (61 m) from the power lines 2The denominator in this entry refers to all tests in the category listed 3Deviation refers to the average of the magnitudes for (true alarm distance ndash 20 ft (61 m)) where 20 ft (61 m) is the nominal distance used for sensitivity adjustments The exception is for tests with 0deg boom elevation where the deviation is the horizontal distance from the boom to the closest phase conductor at the point of alarm activation
Table 9mdashSummary of PWD alarm performance based on power line configuration
30
Test set No and power line configuration
Alarm distance deviation1 ft (m) (Boom configuration boom tip at power line level and
boom extension at 50)
SIGALARM Model 210 ASE Model 2100
1 One horizontal line set 13 kV 6 (18)
9 (27)
2 One vertical line set 25 kV ND ND
3 Two horizontal line sets on same poles 13 kV13 kV
6 (18)
10 (31)
4 Two horizontal line sets on same poles 25 kV13 kV
8 (24)
11 (34)
5 Two line sets one vertical over one horizontal on same poles 25 kV13 kV
15 (46)
12 (37)
6 Two horizontal line sets crossing at 90deg 13 kV13 kV
Left swing
9 (27)
9 (27)
6 Two horizontal line sets crossing at 90deg 13 kV13 kV Right swing
4 (12)
14 (43)
7 Two horizontal line sets crossing at 90deg 25 kV13 kV Left swing toward 25-kV lines
35 (107)
34 (104)
7 Two horizontal line sets crossing at 90deg 25 kV13 kV
Right swing toward 13-kV lines
37 (113)
37 (113)
ND No data 1Deviation refers to the average of the magnitudes for (true alarm distance ndash 20 ft (61 m)) where 20 ft (61 m) is the nominal distance used for sensitivity adjustments
Table 10 summarizes PWD alarm performance based on different power line configurashytions for test sets 1 through 7 when analysis was limited only to tests where the boom extension was at 50 and the boom elevation was such that the tip was approximately at power line level This configuration approximated the general position used for sensitivity adjustments so the performance data do not include the adverse effects of having the boom fully retracted andor at 0deg elevation (usually resulting in no alarm) or at full extension andor 61deg elevation (often causshying early alarms)
Table 10mdashSummary of PWD alarm performance based on power line configuration when analysis is limited only to tests where the boom extension was at 50
and the boom elevation was such that the tip was approximately at power line level
In analyzing the foregoing data no distinct pattern emerges with respect to PWDs failing to alarm or alarming late based only on the influence of power line configuration An examinashytion of the deviations in alarm distance however for the cases where the devices did alarm shows that accuracy was best for simple single-circuit installations (45ndash100 average devishyation) but degraded somewhat for multiple circuits on the same poles (65ndash138 average
31
deviation) This degradation was slightly greater for installations with different voltage levels andor both vertical and horizontal conductor arrangements Performance degraded further for crane operation between two intersecting power line installations (90ndash215 average devishyation) The worst accuracy was associated with intersecting line installations at different voltages
When analysis is limited to only the data from tests where the boom position approxishymated sensitivity adjustment conditions (Table 10) PWD accuracy displays a pattern similar to that in the results for all boom positions In the limited data case however PWD performance seemed to be more sensitive to and adversely affected by the presence of two different voltage levels near the crane
Another behavior seen in the data is the tendency of the SIGALARM PWD to be more accurate when swinging left versus right with the crane positioned between intersecting power line sets This may be due to placement of the SIGALARM probe on the left side of the boom
Crane Boom Configurations
Test sets 1 through 7 were also used to examine the effects of different crane boom posishytions on PWD performance This evaluation included the 284 individual tests described previshyously of which 108 tests with 0deg boom should have produced no alarm and the remaining 176 should have ideally caused the PWDs to alarm at approximately 20 ft (61 m) from the power lines Table 11 details the results for these tests when grouped according to boom angle and boom extension The table lists the number of no alarm early alarm and late alarm cases for each boom parameter individually as well as the average of alarm distance deviations from 20 ft (61 m) (magnitudes) for the tests that caused alarm activations
32
Table 11mdashSummary of PWD alarm performance based on crane boom elevation angle or extension
SIGALARM Model 210 ASE Model 2100
Alarm record Alarm Alarm record Alarm Crane boom parameter 1 1 (a) No alarm distance (a) No alarm distance 1 1 (b) Late alarm deviation3 (b) Late alarm deviation3
2 2 (c) Early alarm ft (m) (c) Early alarm ft (m) (a) NA (a) NA 405 285 0deg boom elevation (b) NA (b) NA (123) (87) (c) 11 of 54 (c) 4 of 54
Boom elevation placing boom (a) 0 of 34 (a) 0 of 34 224 275 tip approximately level with (b) 2 of 34 (b) 0 of 34 (68) (84) power lines (c) 32 of 34 (c) 34 of 34 (a) 25 of 54 (a) 18 of 54 207 226 61deg boom elevation (b) 4 of 54 (b) 2 of 54 (63) (69) (c) 25 of 54 (c) 34 of 54
Minimum boom extension (a) 16 of 18 (a) 17 of 18 Boom length 28 ft (85 m) from 187 40 (b) 0 of 18 (b) 0 of 18 base pivot pin to point sheave (57) (12) (c) 3 of 36 (c) 1 of 36 pin 50 boom extension (a) 4 of 34 (a) 1 of 34 Boom length 487 ft (148 m) 175 166 (b) 6 of 34 (b) 2 of 34 from base pivot pin to point (53) (51) (c) 28 of 52 (c) 32 of 52 sheave pin 100 boom extension (a) 5 of 36 (a) 0 of 36 Boom length 694 ft (212 m) 311 319 (b) 0 of 36 (b) 0 of 36 from base pivot pin to point (95) (97) (c) 37 of 54 (c) 39 of 54 sheave pin
NA Not applicable 1The denominator in this entry refers to tests in the category listed where an alarm should have occurred at approximately 20 ft (61 m) from the power lines 2The denominator in this entry refers to all tests in the category listed 3Deviation refers to the average of the magnitudes for (true alarm distance ndash 20 ft (61 m)) where 20 ft (61 m) is the nominal distance used for sensitivity adjustments The exception is for tests with 0deg boom elevation where the deviation is the horizontal distance from the boom to the closest phase conductor at the point of alarm activation
Based on the results presented in Table 11 the PWDs were most likely to fail to alarm when the crane boom was operated at minimum extension (89ndash94 failed to alarm) andor at 61deg elevation angle (33ndash46 failed to alarm) For the tests where the devices did alarm the accuracy was poorest at 100 boom extension (160 average deviation) andor 0deg boom elevashytion (145ndash205 average deviation)
33
Other Factors
Use of a PWD as an Early Warning Device
Test sets 8 and 9 emulated the use of a PWD to provide an ldquoearly warningrdquo of a power line(s) for a crane traveling into an unfamiliar work area With the crane in travel configuration and both PWDs set at maximum sensitivity the SIGALARM Model 210 alarmed at 75ndash82 ft (229ndash250 m) from a single set of 13-kV power lines (depending on approach angle) and 88 ft (268 m) from two intersecting sets of 13-kV power lines These alarm distances should be suffishycient for an operator to take preventive measures before the crane is in a position from which it could contact nearby power lines The ASE Model 2100 allowed the crane in travel configurashytion to approach and travel under the single set of 13-kV lines without alarm activation but did alarm at a point 20 ft (61 m) from the two intersecting sets of 13-kV power lines
Effect of Connecting the Crane Chassis to a Grounded Power System Neutral
Test set 10 examined the effect of directly connecting the crane chassis to the solidly grounded neutral of a three-phase overhead power line system (all other testing had no delibershyate direct connection of the chassis to the power system neutral) For the test conditions used the PWDs showed no significant difference in performance due to connection of the crane chassis to a grounded power system neutral
Effect of Multiple Independent Power Line Circuits
Several tests under test set 7 created conditions under which PWD alarm activation would cease and then resume during one continuous swing of the boom toward a set of power lines This behavior was documented for two power line sets intersecting at 90deg operating at different voltages and having opposite phase sequencing PWD sensitivities were adjusted at 20 ft (61 m) from the lower voltage lines and the boom swing (wherein the alarm dropout occurred) was toward the lower voltage lines while simultaneously moving away from the higher voltage lines While this behavior was not thoroughly investigated during this research the sevshyeral cases in which it was noted clearly illustrate that PWD performance can be compromised when a crane is simultaneously exposed to electric fields from multiple independent overhead power line circuits
Effect of Power Line Phase Sequence
In test sets 1 through 7 one varied parameter was the phase sequence for the three-phase circuit involved or for one of two circuits when two sets of power lines were used This is an important issue since there is no convention in distribution power line construction standards for the relative position of specific phases in a three-phase overhead line installation and any effect of phase sequence on PWD performance will be random For test sets 1 through 7 tests were run with the sequence as ABC on all circuits with A-phase nearest the crane (or with A at the top for a vertical conductor arrangement) The tests were then run again with the phase sequence reversed (CBA) either on the one circuit involved or on one of two circuits used Table 12 details the variations in PWD accuracy due to introduction of CBA phase sequence
34
Test set No and power line configuration
Change in PWD alarm distance deviation due to 1 introduction of CBA phase sequence
SIGALARM Model 210 ASE Model 2100
1 One horizontal line set 13 kV 16 increase 7 increase
2 One vertical line set 25 kV 31 increase 7 decrease
3 Two horizontal line sets on same poles 13 kV13 kV 47 decrease 60 decrease
4 Two horizontal line sets on same poles 25 kV13 kV 25 decrease 3 increase
5 Two line sets one vertical over one horizontal on same poles 25 kV13 kV 41 decrease 63 decrease
6 Two horizontal line sets crossing at 90deg 13 kV13 kV
Left swing 36 decrease 36 decrease
6 Two horizontal line sets crossing at 90deg 13 kV13 kV Right swing
36 increase 39 decrease
7 Two horizontal line sets crossing at 90deg 25 kV13 kV Left swing toward 25-kV lines
40 increase 10 increase
7 Two horizontal line sets crossing at 90deg 25 kV13 kV
Right swing toward 13-kV lines 29 increase 2 decrease
1Change in alarm distance deviation was calculated as ((change in average of alarm distance deviation magnitudes for tests with CBA phase sequence divide average of alarm distance deviation magnitudes for tests with ABC phase sequence) times 100) Deviation was defined as follows (true alarm distance minus 20 ft (61 m)) for tests producing alarms (except tests with 0deg boom elevation) or the horizontal distance from the boom to the closest phase conductor for tests with 0deg boom elevation or 10 ft (30 m) for tests that should have caused an alarm but did not (In the last case the boom swing was stopped 10 ft (30 m) from the closest phase conductor when no alarm occurred) See ldquoResultsrdquo section for details on reversal of three-phase sequence for each test configuration
Table 12mdashSummary of PWD alarm performance changes due to reversal of power line phase sequence
Results in Table 12 indicate that the PWDs tested were normally more accurate when two power line circuits on the same poles had opposite phase sequences compared to the same cirshycuits with matching sequences This was also the pattern for intersecting power line circuits at the same voltage (notwithstanding the SIGALARMrsquos poorer performance for right swings) Opposite phase sequence however was more likely to degrade accuracy for intersecting power line circuits operating at different voltages
Sensitivity Adjustments
Manufacturerrsquos literature for the SIGALARM Model 210 recommends that if the device is to be used as a ldquoproximity warning devicerdquo as opposed to an ldquoautomatic early power line warning devicerdquo the device should be ldquocalibratedrdquo (sensitivity-adjusted) with the boom retracted
35
to the minimum length expected to be used and positioned at a distance from the power lines at least twice that required by 29 CFR or state regulations The literature adds that if a specific boom extension is to be used for an extended period the device should be calibrated with the boom at that length [Allied Safety Systems LLC 2008] Manufacturerrsquos literature for the ASE Model 2200 (similar to the Model 2100 used in this testing) recommends that the ldquosetpointrdquo be selected based on electric field strength with the boom at approximately 45deg elevation the boom tip approximately 10 ft (30 m) higher than power line level and a minimum distance from the nearest conductor of no less than 10 ft (30 m) [Allied Safety Engineering 2008]
Sensitivity adjustment of PWDs is an issue that directly affects the practical utility of these devices The test results detailed in this report clearly reveal that many factors can degrade the performance of the PWDs Foremost among these is change in boom length and elevation angle after a sensitivity adjustment has been made As a result selecting the boom position for sensitivity adjustment and more importantly recognizing when sensitivity should be readjusted become important decisions for the user of either PWD tested For crane operation that involves frequent changes in crane position andor boom and load configuration frequent PWD sensishytivity adjustments can improve performance Frequent readjustments however could reach a point where it is a distraction and annoyance to the operator and crew Ultimately a decision must be reached that balances both PWD accuracy and practicality without compromising pershysonnel safety
RECOMMENDATIONS FOR FUTURE RESEARCH
Results from this research indicate that several issues need further investigation PWD performance should be evaluated for crane operation involving only small changes in boom length (less than plusmn 5 ft (15 m) and boom elevation angle (less than plusmn 8deg) This may be a more accurate representation of ldquotypicalrdquo crane operation in the field Two specific areas that warrant more study are crane operation near multiple independent overhead power line circuits and anomalies associated with power line circuit phase sequence reversal Both of these factors can have an adverse and from the operatorrsquos perspective unpredictable effect on PWD performance In addition research should be conducted to develop and evaluate PWD technologies that can avoid the limitations of electric field measurement that have been highlighted in this report
REFERENCES
Allied Safety Engineering [2008] Proximity warning device ASE model 2200 [httpalliedsafetyengcommode=pwd] Date accessed May 2008 Allied Safety Systems LLC [2008] SIGALARM [httpwwwsigalarminccom sigalarmhtm] Date accessed May 2008
ANSI [1995] American national standard for mobile and locomotive cranes New York American National Standards Institute ANSIASME B305
Cawley JC Homce GT [2003] Occupational electrical injuries in the United States 1992ndash1998 and recommendations for safety research J Safety Res 34(3)241ndash248
CFR Code of federal regulations Washington DC US Government Printing Office Office of the Federal Register
Hipp JE Henson FD Martin PE Phillips GN [1980] Evaluation of proximity warning devices Phase I interim report San Antonio TX Southwest Research Institute pp 11ndash13 US Bureau of Mines contract No J0188082 NTIS No PB 80-144413
36
APPENDIX AmdashLIST OF COOPERATORS
Below is a list of the cooperators involved in developing the test plan for the performance evaluation of overhead electrical power line PWDs described in this report
bull Allied Safety Systems LLC (SIGALARM) (PWD manufacturer) Lance Burney bull Allied Safety Engineering (PWD manufacturer) Irvin Nickerson bull Association of Equipment Manufacturers Richard Dressler bull International Union of Operating Engineers AFL-CIO Emmett Russell bull Center for Construction Research and Training (formerly known as the Center to Protect Workersrsquo Rights) Michael McCann PhD CIH bull Occupational Safety and Health Administration Kenneth Klouse bull Zachry Construction Corp Joseph Collins bull LMK Engineers (NIOSH contractor) Jan Shingler PE Joseph Deane PE and George Gehring PE
37
Delivering on the Nationrsquos promise safety and health at work for all people through research and prevention
To receive NIOSH documents or more information about occupational safety and health topics contact NIOSH at
1ndash800ndashCDCndashINFO (1ndash800ndash232ndash4636) TTY 1ndash888ndash232ndash6348 e-mail cdcinfocdcgov
or visit the NIOSH Web site at wwwcdcgovniosh
For a monthly update on news at NIOSH subscribe to NIOSH eNews by visiting wwwcdcgovniosheNews
DHHS (NIOSH) Publication No 2009ndash110
SAFER bull HEALTHIER bull PEOPLEtrade
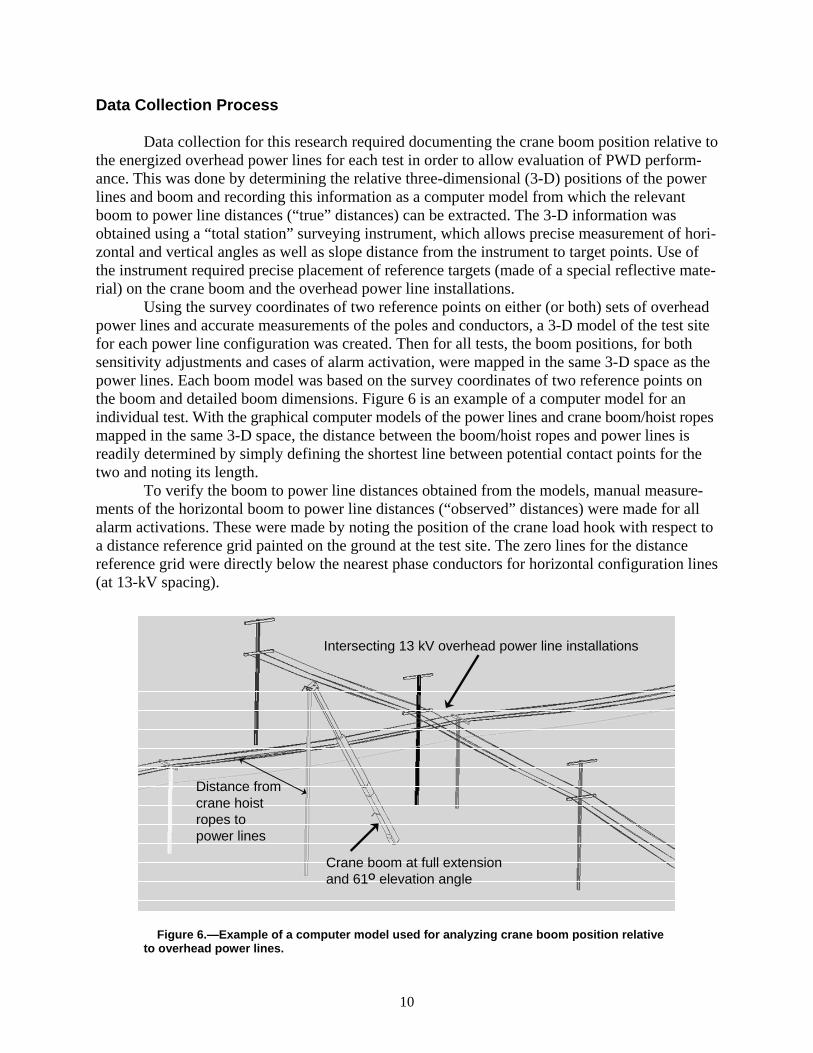
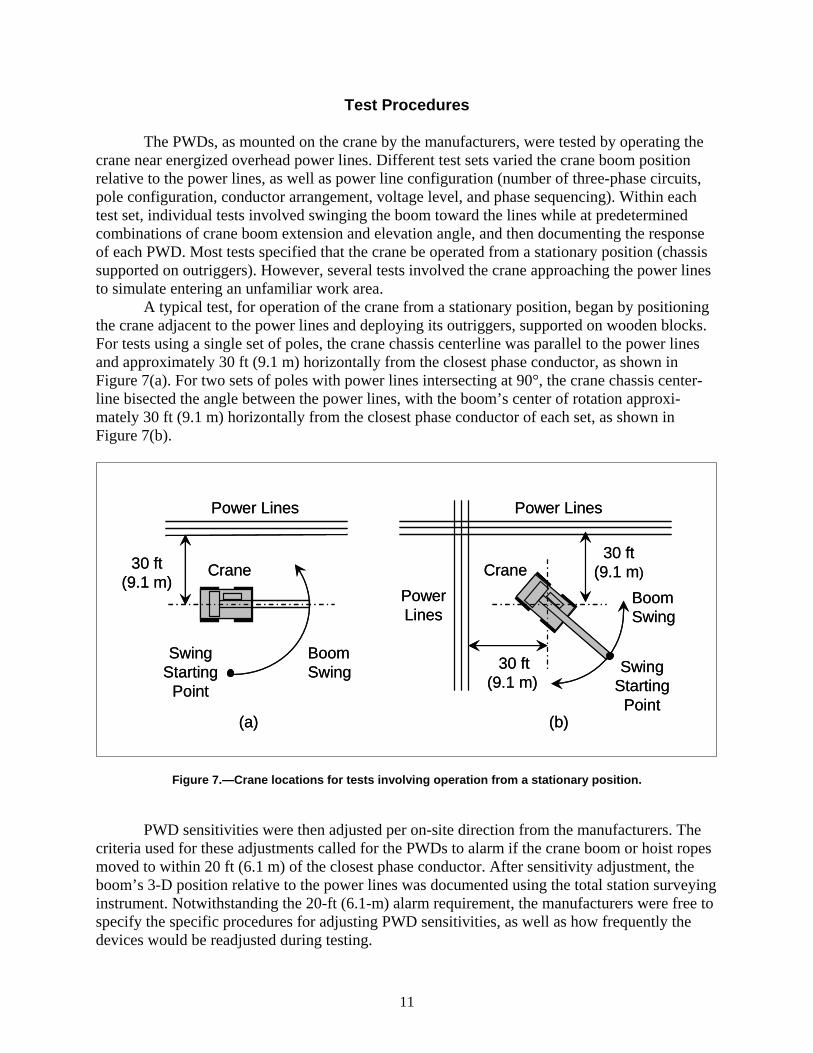
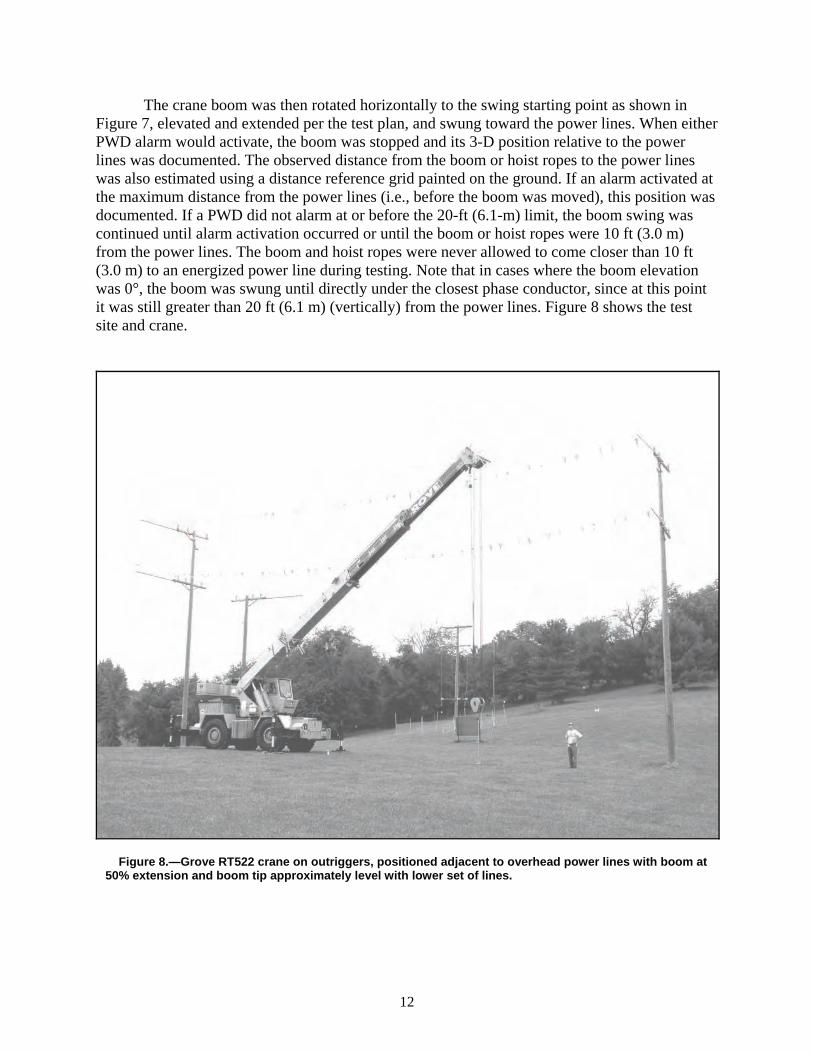
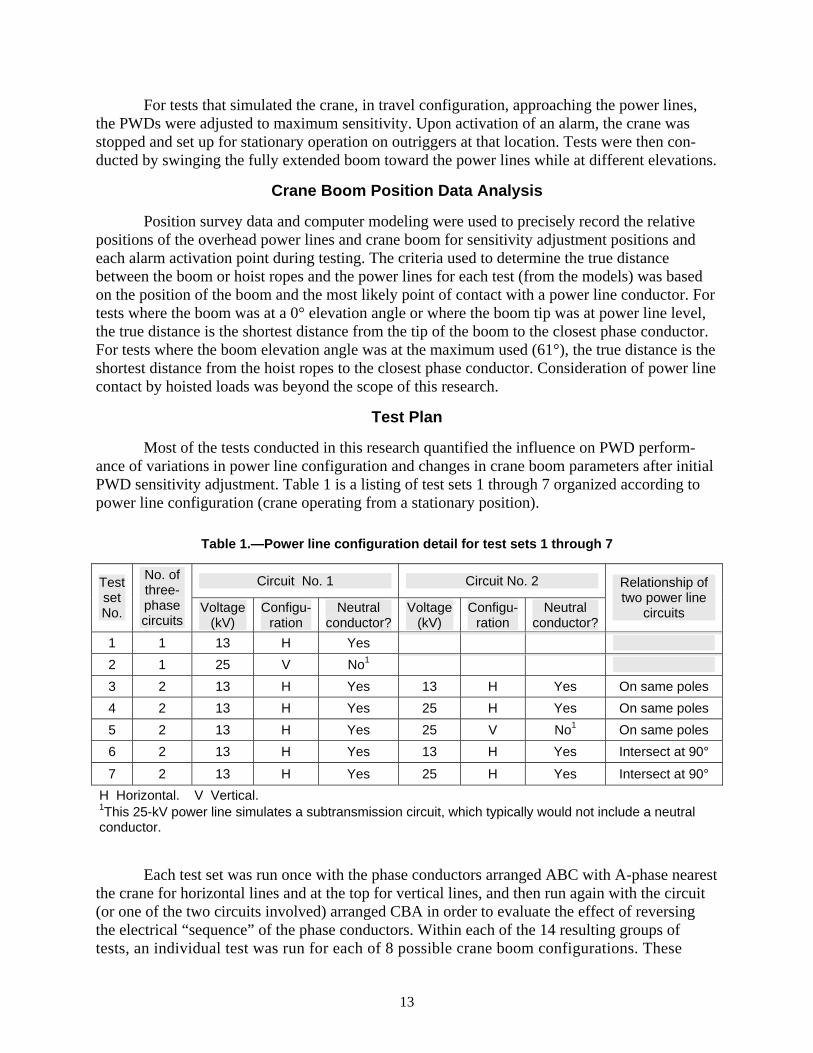
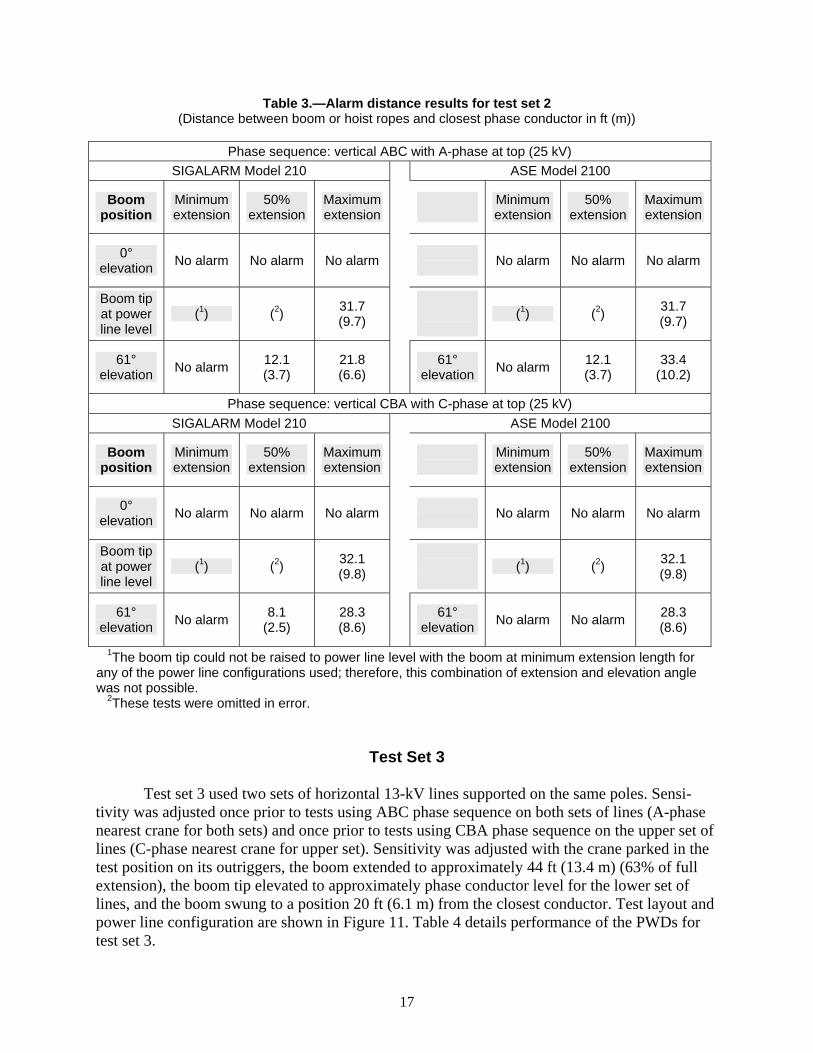
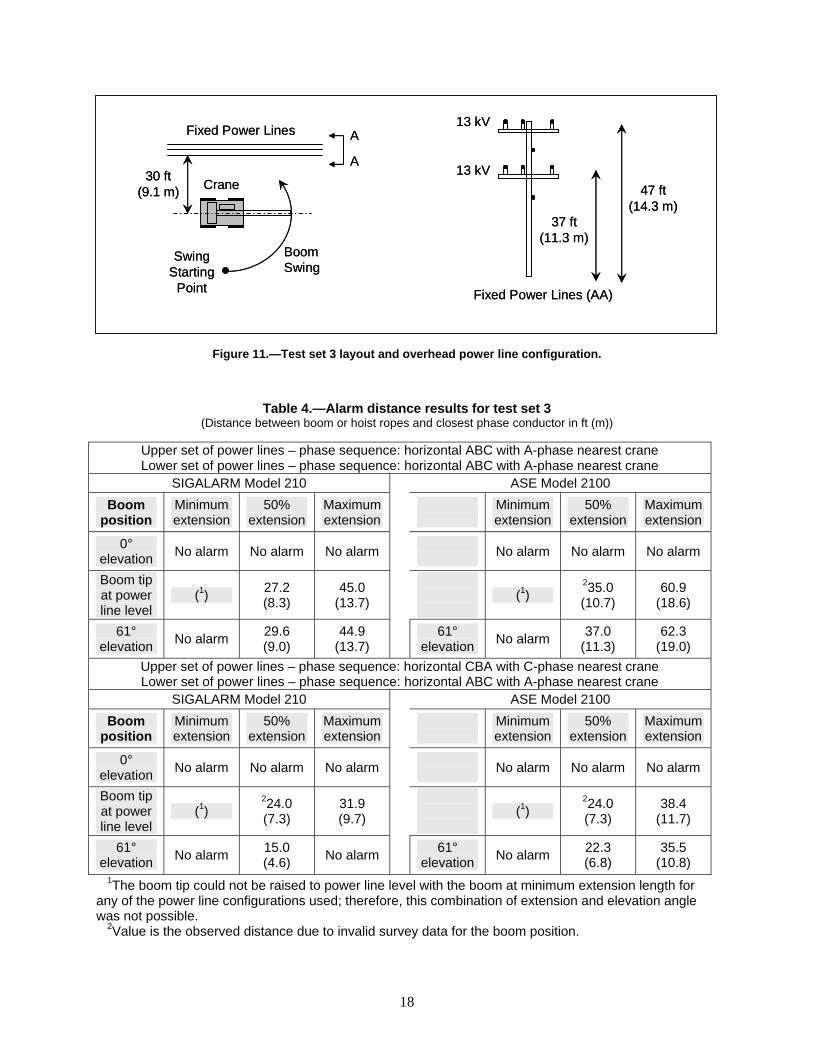
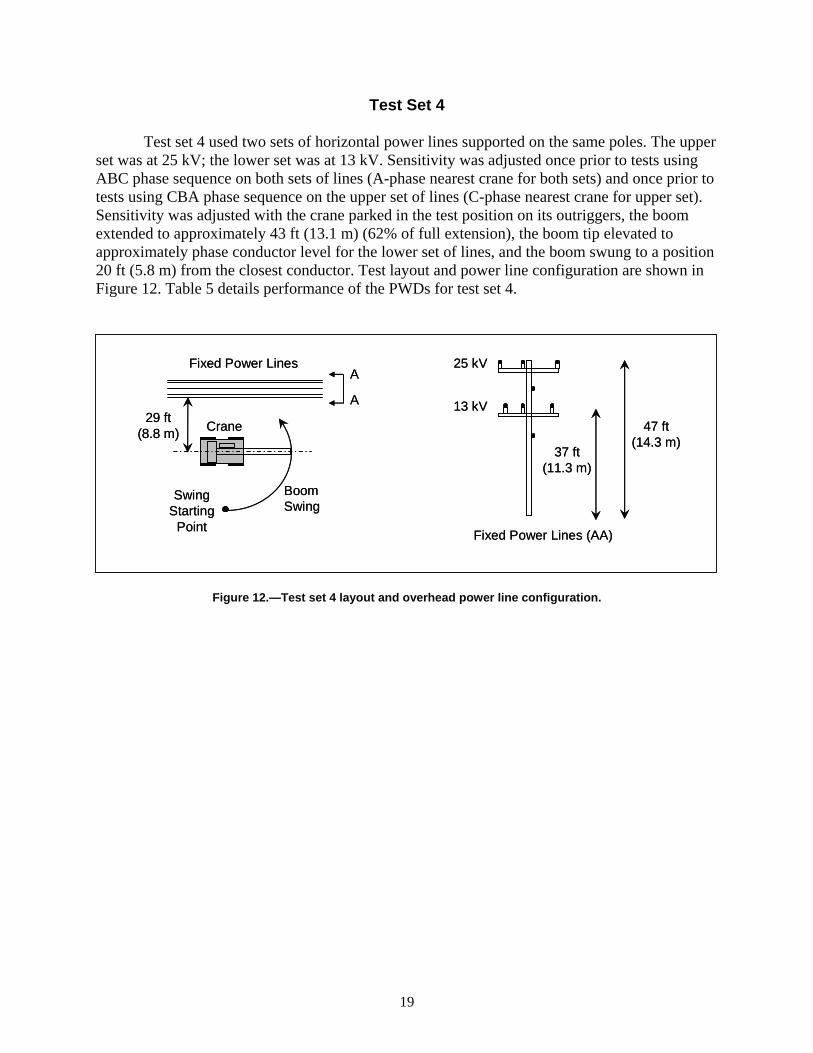
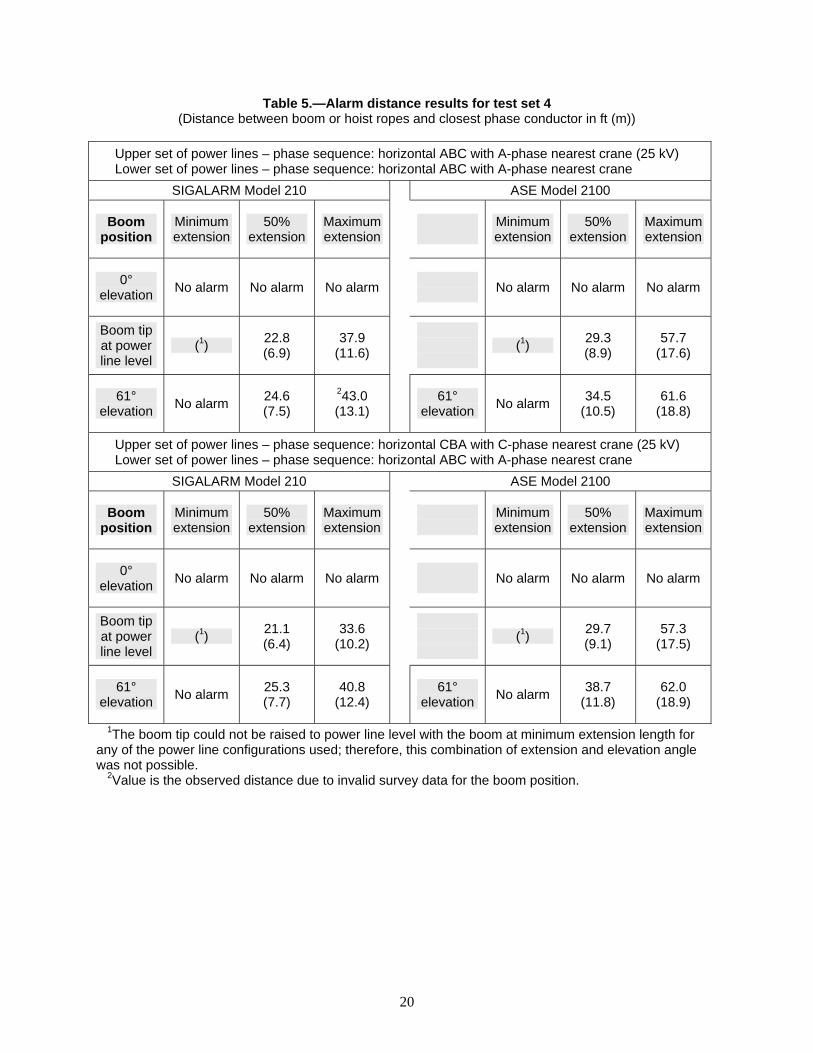
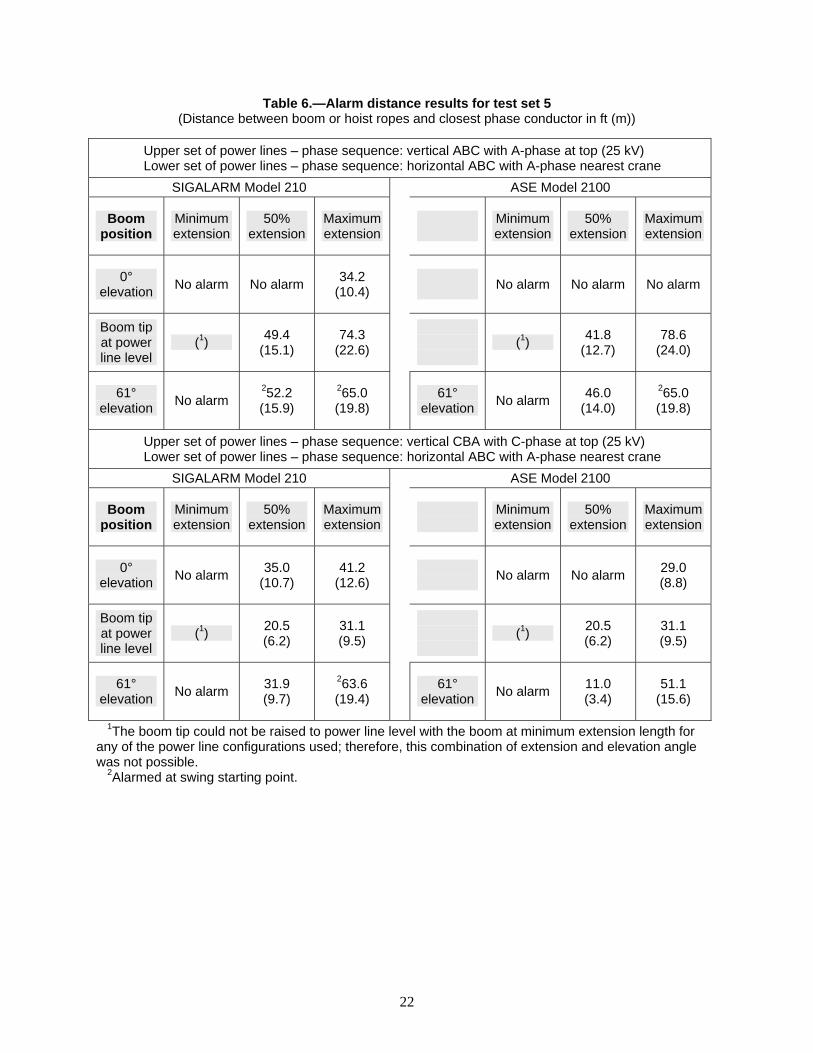