a performance comparison of dell and hp desktop systems a principled technologies test report
31
A PERFORMANCE COMPARISON OF DELL AND HP DESKTOP SYSTEMS MAY 2011 A PRINCIPLED TECHNOLOGIES TEST REPORT Commissioned by Dell Inc. Workers can be only as productive as their tools allow them to be. On a sluggish system, the most basic office tasks can become exercises in frustration, lowering user productivity and morale. Principled Technologies ran a series of industry-standard benchmarks to measure system performance. We tested two Dell desktops powered by 2 nd generation Intel Core processors, a mid-range Dell Vostro™ 460 Mini Tower and a high-end Dell OptiPlex™ 990 Mini Tower, and two HP desktops powered by AMD processors, a mid-range HP Pavilion Slimline s5750z and a high-end HP Pavilion p6750z. The Intel Core processor-based Dell systems consistently delivered higher benchmark scores—as much as 148.4 percent higher—than the corresponding HP Pavilion systems, making Dell a great choice for productivity in the workplace.
Transcript of a performance comparison of dell and hp desktop systems a principled technologies test report

R
A PERFORMANCE COMPARISON OF DELL AND HP DESKTOP SYSTEMS
MAY 2011
A PRINCIPLED TECHNOLOGIES TEST REPORT Commissioned by Dell Inc.
Workers can be only as productive as their tools allow them to be. On a
sluggish system, the most basic office tasks can become exercises in frustration,
lowering user productivity and morale.
Principled Technologies ran a series of industry-standard benchmarks to
measure system performance. We tested two Dell desktops powered by 2nd
generation Intel Core processors, a mid-range Dell Vostro™ 460 Mini Tower and
a high-end Dell OptiPlex™ 990 Mini Tower, and two HP desktops powered by
AMD processors, a mid-range HP Pavilion Slimline s5750z and a high-end HP
Pavilion p6750z.
The Intel Core processor-based Dell systems consistently delivered higher
benchmark scores—as much as 148.4 percent higher—than the corresponding
HP Pavilion systems, making Dell a great choice for productivity in the workplace.

A Principled Technologies test report 2
A performance comparison of Dell and HP desktop systems
DELL AND INTEL DELIVER PERFORMANCE Responsive performance enhances worker productivity. That’s why, when choosing desktop systems
for the workplace, it makes sense to purchase systems powerful enough to execute tasks quickly and
efficiently.
In our tests, we found that the Intel Core processor-based Dell Vostro 460 Mini Tower and Dell
OptiPlex 990 delivered considerably better performance than comparable AMD processor-based HP systems—
with gains up to 148.4 percent. (To learn more about the systems we tested, see Appendix A. To learn more
about how we tested, see Appendix B.)
SYSmark 2007 Preview v1.06 measures system performance in four workload scenarios: e-learning,
office productivity, video creation, and 3D modeling. Figure 1 shows the SYSmark 2007 Preview performance
for four desktop systems. The Dell Vostro 460 Mini Tower, with a score of 244, outperformed the HP Pavilion
Slimline s5750z (which had a score of 144) by 69.4 percent. The Dell OptiPlex 990 Mini Tower’s score of 276
was 69.3 percent higher than the HP Pavilion p6750z score of 163.
MAXON CINEBENCH consists of two main components. The first test sequence targets the computer’s
main processor. CINEBENCH plays a scene that makes use of various CPU-intensive features. During the first
run, the benchmark uses only one
CPU or CPU core to determine a
reference value. On computers
that have multiple CPUs or cores,
CINEBENCH will run a second test
using all available CPU power. The
benchmark produces a single-CPU
score for all computers, and a
multiple-CPU score for those
computers with multiple cores.
244
144
276
163
0
100
200
300
Dell Vostro 460Mini Tower
(Intel Core i5-2400)
HP PavilionSlimline s5750z
(AMD Athlon IIX4 640)
Dell OptiPlex990 Mini
Tower(Intel Core i7-
2600)
HP Pavilionp6750z
(AMD PhenomII X4 840)
Mid-range systems High-end systems
Sco
re
SYSmark 2007 Preview v1.06 Rating
Figure 1: SYSmark 2007 Preview productivity results for our test systems. Higher numbers are better.
A Principled Technologies test report 3
A performance comparison of Dell and HP desktop systems
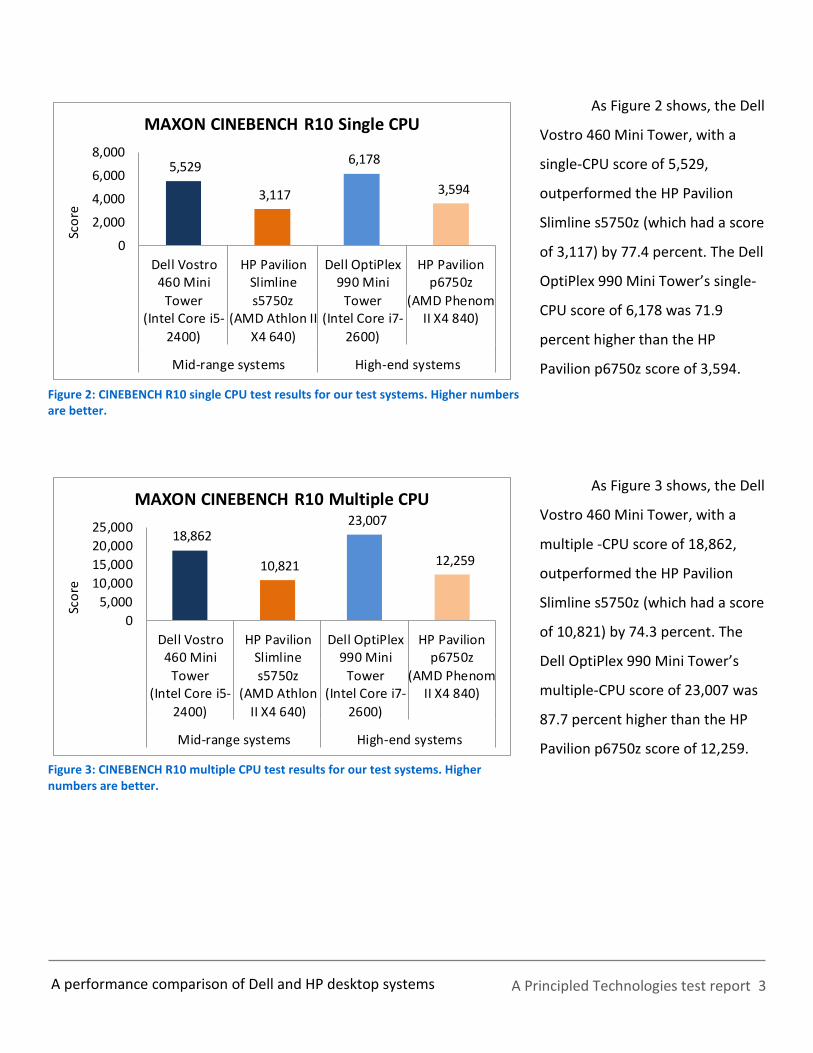
As Figure 2 shows, the Dell
Vostro 460 Mini Tower, with a
single-CPU score of 5,529,
outperformed the HP Pavilion
Slimline s5750z (which had a score
of 3,117) by 77.4 percent. The Dell
OptiPlex 990 Mini Tower’s single-
CPU score of 6,178 was 71.9
percent higher than the HP
Pavilion p6750z score of 3,594.
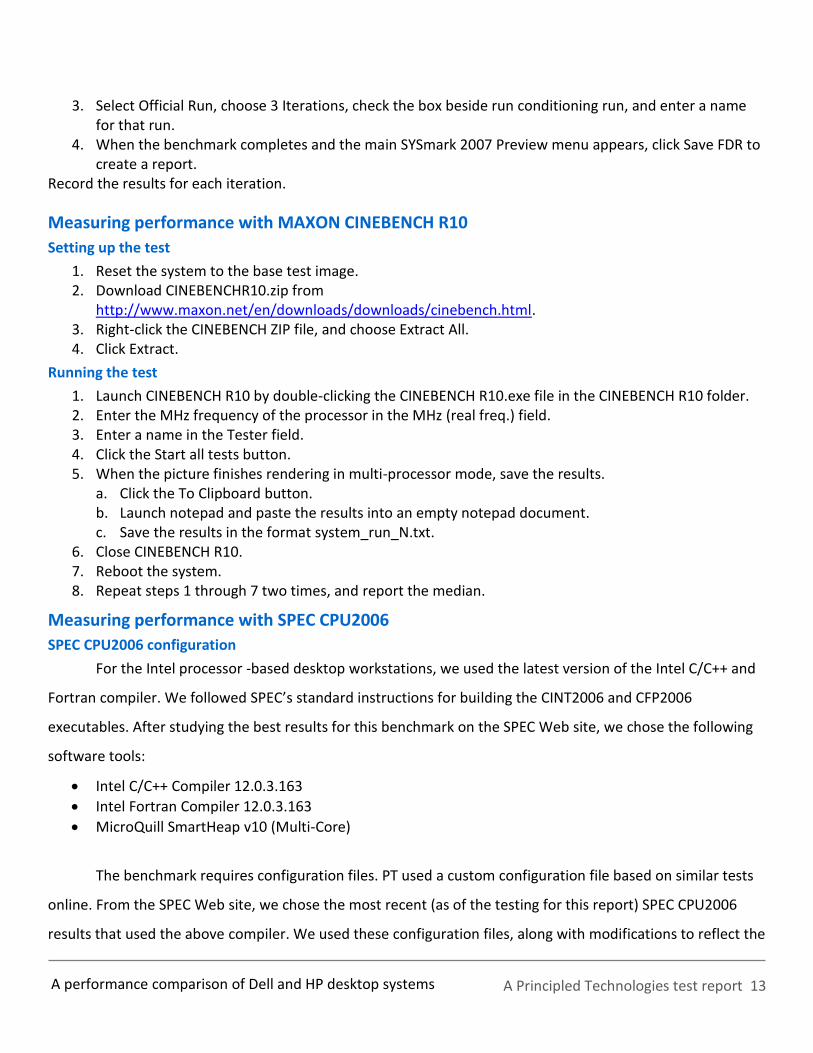
As Figure 3 shows, the Dell
Vostro 460 Mini Tower, with a
multiple -CPU score of 18,862,
outperformed the HP Pavilion
Slimline s5750z (which had a score
of 10,821) by 74.3 percent. The
Dell OptiPlex 990 Mini Tower’s
multiple-CPU score of 23,007 was
87.7 percent higher than the HP
Pavilion p6750z score of 12,259.
5,529
3,117
6,178
3,594
0
2,000
4,000
6,000
8,000
Dell Vostro460 Mini
Tower(Intel Core i5-
2400)
HP PavilionSlimline
s5750z(AMD Athlon II
X4 640)
Dell OptiPlex990 Mini
Tower(Intel Core i7-
2600)
HP Pavilionp6750z
(AMD PhenomII X4 840)
Mid-range systems High-end systems
Sco
re
MAXON CINEBENCH R10 Single CPU
Figure 2: CINEBENCH R10 single CPU test results for our test systems. Higher numbers are better.
18,862
10,821
23,007
12,259
0
5,000
10,000
15,000
20,000
25,000
Dell Vostro460 Mini
Tower(Intel Core i5-
2400)
HP PavilionSlimline
s5750z(AMD Athlon
II X4 640)
Dell OptiPlex990 Mini
Tower(Intel Core i7-
2600)
HP Pavilionp6750z
(AMD PhenomII X4 840)
Mid-range systems High-end systems
Sco
re
MAXON CINEBENCH R10 Multiple CPU
Figure 3: CINEBENCH R10 multiple CPU test results for our test systems. Higher numbers are better.

A Principled Technologies test report 4
A performance comparison of Dell and HP desktop systems
As Figure 4 shows, the Dell
Vostro 460 Mini Tower, with a
SPECint score of 118.0,
outperformed the HP Pavilion
Slimline s5750z by 115.3 percent.
The Dell OptiPlex 990 Mini
Tower’s multiple-CPU score of
155.0 was 148.4 percent higher
than the HP Pavilion p6750z score
of 62.4.
As Figure 5 shows, the Dell
Vostro 460 Mini Tower, with a
SPECfp score of 91.5,
outperformed the HP Pavilion
Slimline s5750z (which had a score
of 50.2) by 82.3 percent. The Dell
OptiPlex 990 Mini Tower’s
multiple-CPU score of 111.0 was
97.2 percent higher than the HP
Pavilion p6750z score of 56.3.
TEST RESULTS Figures 6 and 7 show a detailed breakdown of benchmark results for the four test systems. These
results represent the median of three test runs. Appendix C presents the results from all three BAPCo SYSmark
2007 and MAXON CINEBENCH runs, and Appendix E presents detailed results for our SPEC CPU2006 testing.
118.0
54.8
155.0
62.4
0306090
120150180
Dell Vostro 460Mini Tower
(Intel Core i5-2400)
HP PavilionSlimline s5750z
(AMD Athlon IIX4 640)
Dell OptiPlex990 Mini
Tower(Intel Core i7-
2600)
HP Pavilionp6750z
(AMD PhenomII X4 840)
Mid-range systems High-end systems
Sco
re
SPECint_rate_base_2006
Figure 4: SPECint_rate_base_2006 test results for our test systems. Higher numbers are better.
91.5
50.2
111.0
56.3
0
30
60
90
120
Dell Vostro 460Mini Tower
(Intel Core i5-2400)
HP PavilionSlimline s5750z
(AMD Athlon IIX4 640)
Dell OptiPlex990 Mini
Tower(Intel Core i7-
2600)
HP Pavilionp6750z
(AMD PhenomII X4 840)
Mid-range systems High-end systems
Sco
re
SPECfp_rate_base_2006
Figure 5: SPECfp_rate_base_2006 test results for our test systems. Higher numbers are better.

A Principled Technologies test report 5
A performance comparison of Dell and HP desktop systems
Mid-range systems Dell Vostro 460
Mini Tower (Intel Core i5-2400)
HP Pavilion Slimline s5750z
(AMD Athlon II X4 640)
Percentage improvement with
Dell Vostro 460 Mini Tower
(Intel Core i5-2400)
BAPCo SYSmark 2007 Preview v1.06 244.0 144.0 69.4%
MAXON CINEBENCH R10 Single CPU 5,529.0 3,117.0 77.4%
MAXON CINEBENCH R10 Multiple CPU 18,862.0 10,821.0 74.3%
SPEC CPU2006 SPECint_rate_base_2006 118.0 54.8 115.3%
SPEC CPU2006 SPECfp_rate_base_2006 91.5 50.2 82.3%
Figure 6: Benchmark score for the mid-range systems. Higher numbers are better.
High-end systems Dell OptiPlex 990
Mini Tower (Intel Core i7-2600)
HP Pavilion p6750z
(AMD Phenom II X4 840)
Percentage improvement with Dell OptiPlex 990
Mini Tower (Intel Core i7-2600)
BAPCo SYSmark 2007 Preview v1.06 276.0 163.0 69.3%
MAXON CINEBENCH R10 Single CPU 6,178.0 3,594.0 71.9%
MAXON CINEBENCH R10 Multiple CPU 23,007.0 12,259.0 87.7%
SPEC CPU2006 SPECint_rate_base_2006 155.0 62.4 148.4%
SPEC CPU2006 SPECfp_rate_base_2006 111.0 56.3 97.2%
Figure 7: Benchmark score for the high-end systems. Higher numbers are better.
SUMMARY
Workers need desktop systems that allow them to do their jobs, in a timely manner and without the
frustration and delays that underperforming systems cause. In our tests, we found that Dell desktops powered
by the Intel Core processor family outperformed comparable HP desktops. With up to 148.4 percent increased
performance over HP systems, Dell desktops are an excellent choice to meet workers’ performance and
productivity needs.

A Principled Technologies test report 6
A performance comparison of Dell and HP desktop systems
APPENDIX A – DETAILED SYSTEM CONFIGURATION INFORMATION Figure 8 presents each test system and the details of its configuration.
System
Dell Vostro 460 Mini Tower
(Intel Core i5-2400)
Dell OptiPlex 990 Mini Tower
(Intel Core i7-2600)
HP Pavilion Slimline s5750z
(AMD Athlon II X4 640)
HP Pavilion p6750z
(AMD Phenom II X4 840)
General
Number of processor packages
1 1 1 1
Number of cores per processor
4 4 4 4
Number of hardware threads per core
4 8 4 4
System power management policy
Dell Dell Balanced Balanced
Processor power-saving option
Enhanced Intel SpeedStep® Technology
Enhanced Intel SpeedStep Technology
AMD PowerNow!™ Technology (Cool’n’Quiet™ Technology)
AMD PowerNow! Technology (Cool’n’Quiet Technology)
System dimensions (length x width x height)
17.5” x 7” x 14.25”
16.5” x 7” x 14.25”
15.25" x 4.5" x 12.25"
16.5” x 7” x 15.75”
System weight (lbs.) 22 20 13 18
CPU
Vendor Intel Intel AMD AMD
Name Core i5 Core i7 Athlon II X4 Phenom II X4
Model number 2400 2600 640 840
Stepping D2 D2 PH-E0 PH-E0
Socket type and number of pins
Socket 1155 LGA Socket 1155 LGA Socket AM3 (938) Socket AM3 (938)
Core frequency (GHz) 3.10 3.40 3.00 2.90
Bus frequency 5 GT/s 5 GT/s 4,000 MHz HyperTransport™ Technology
2,000 MHz HyperTransport Technology
L1 cache 32 KB + 32 KB (per core)
32 KB + 32 KB (per core)
64 KB + 64 KB (per core)
64 KB +64 KB (per core)
L2 cache 1 MB (256 KB per core)
1 MB (256 KB per core)
2 MB (512 KB per core)
2 MB (512 KB per core)
L3 cache 6 MB 8 MB N/A 6 MB
Platform
Vendor Dell Dell FOXCONN FOXCONN

A Principled Technologies test report 7
A performance comparison of Dell and HP desktop systems
System
Dell Vostro 460 Mini Tower
(Intel Core i5-2400)
Dell OptiPlex 990 Mini Tower
(Intel Core i7-2600)
HP Pavilion Slimline s5750z
(AMD Athlon II X4 640)
HP Pavilion p6750z
(AMD Phenom II X4 840)
Motherboard model number
OY2MRG 06D7TR 2B1 2AB1
Motherboard chipset H67 ID1C4E AMD 785G AMD 785G
BIOS name and version Dell A03 (02/15/2011)
Dell Inc. A02 (02/26/2011)
American Megatrends Inc. 6.06 (03/22/2011)
American Megatrends Inc. 6.06 (03/22/2011)
Memory module(s)
Vendor and model number Micron Tech. 8JTF25664AZ-1G4D1
Samsung M378B5273DH0-CH9
Samsung M378B5773CH0-CH9
Hyundai HMT125U6TFR8C-H9
Type PC3-10600 PC3-10600 PC3-10600 PC3-10600
Speed (MHz) 1,333 1,333 1,333 1,333
Speed running in the system (MHz)
1,333 1,333 1,333 1,333
Timing/Latency (tCL-tRCD-tRP-tRASmin)
9-9-9-24 9-9-9-24 9-9-9-24 9-9-9-24
Size (MB) 4,096 8,192 4,096 8,192
Number of memory module(s)
2 x 2,048 MB 2 x 4,096 MB 2 x 2,048 MB 4 x 2,048 MB
Chip organization (single-sided/double-sided)
Single-sided Double-sided Single-sided Double-sided
Channel (single/dual) Dual Dual Dual Dual
Hard disk
Vendor and model number Western Digital WD5000AAKX-753CA0
Seagate ST3500413AS
Western Digital WD50000AAKS-60Z1A0
Seagate ST315003 41AS
Number of disks in system 1 1 1 1
Size (GB) 500 500 500 1,500
Buffer size (MB) 16 16 16 32
RPM 7,200 7,200 7,200 7,200
Type SATA 3Gb/s SATA 3Gb/s SATA 3Gb/s SATA 3Gb/s
Controller Intel H67 Intel ID1C4E AMD SB700 AMD SB700
Driver Intel 10.0.0.1046 (09/13/2010)
Intel 10.1.0.1008 (11/06/2010)
AMD 1.2.1.238 (10/08/2010)
AMD 1.2.1.238 (10/08/2010)
Operating system
Name Windows® 7 Ultimate
Windows 7 Ultimate
Windows 7 Ultimate
Windows 7 Ultimate
Build number 7600 7600 7600 7600

A Principled Technologies test report 8
A performance comparison of Dell and HP desktop systems
System
Dell Vostro 460 Mini Tower
(Intel Core i5-2400)
Dell OptiPlex 990 Mini Tower
(Intel Core i7-2600)
HP Pavilion Slimline s5750z
(AMD Athlon II X4 640)
HP Pavilion p6750z
(AMD Phenom II X4 840)
Service Pack SP1 (for SPEC CPU2006 testing only)
SP1 (for SPEC CPU2006 testing only)
SP1 (for SPEC CPU2006 testing only)
SP1 (for SPEC CPU2006 testing only)
File system NTFS NTFS NTFS NTFS
Kernel ACPI x64 – based PC
ACPI x64 – based PC
ACPI x64 – based PC
ACPI x64 – based PC
Language English English English English
Microsoft DirectX® version DirectX 11 DirectX 11 DirectX 11 DirectX 11
Graphics
Vendor and model number AMD Radeon™ HD 6450
2 x AMD Radeon HD 6450
AMD Radeon HD 4200
AMD Radeon HD 6570
Type Discrete Discrete Discrete Discrete
Chipset ATI Radeon HD 6450
ATI Radeon HD 6450
ATI Radeon HD 4200
ATI Radeon HD 6570
BIOS version 113-AD00200-101-PE
113-C2640500-100
BR34448.bin 113-AC89900-102-PE
Total available graphics memory (MB)
2,807 4,851 1,919 4,083
Dedicated video memory (MB)
1,024 2,048 256 1,024
System video memory (MB)
0 0 0 0
Shared system memory (MB)
1,783 2,803 1,663 3,059
Resolution 1,280 x 1,024 x 32-bit
1,280 x 1,024 x 32-bit
1,280 x 1,024 x 32-bit
1,280 x 1,024 x 32-bit
Driver ATI Technologies Inc. 8.812.0.0 (01/04/2011)
ATI Technologies Inc. 8.783.2.2000 (11/16/2010)
ATI Technologies Inc. 8.733.0.0 (05/11/2010)
ATI Technologies Inc. 8.784.1.0 (11/23/2010)
Sound card/subsystem
Vendor and model number Realtek High Definition Audio
Realtek High Definition Audio
Realtek High Definition Audio
Creative SB X-Fi
Driver
Realtek Semiconductor Corp. 6.0.1.6141 (06/22/2010)
Realtek Semiconductor Corp. 6.0.1.5883 (09/14/2010)
Realtek Semiconductor Corp. 6.0.1.6196 (09/07/2010)
Creative 6.0.1.6 (03/05/2010)
Ethernet

A Principled Technologies test report 9
A performance comparison of Dell and HP desktop systems
System
Dell Vostro 460 Mini Tower
(Intel Core i5-2400)
Dell OptiPlex 990 Mini Tower
(Intel Core i7-2600)
HP Pavilion Slimline s5750z
(AMD Athlon II X4 640)
HP Pavilion p6750z
(AMD Phenom II X4 840)
Vendor and model number Broadcom NetLink Gigabit
Intel 82579LM Gigabit
Realtek PCIe FE Family
Realtek PCIe FE Family
Driver Broadcom 14.2.0.7 (07/20/2010)
Intel 11.8.81.0 (10/28/2010)
Realtek 7.26.902.2010 (09/02/2010)
Realtek 7.26.902.2010 (09/02/2010)
Optical drive(s)
Vendor and model number HL-DT-ST CH20N TSSTcorp TS-H653H
HP DH16ABLH HP DH16ABLH
Type BD-ROM CD/DVD-RW CD/DVD-RW CD/DVD-RW
USB ports
Number 8 10 6 6
Type 2.0 2.0 2.0 2.0
Other eSATA, HDMI, Media Card Reader
eSATA Media Card Reader
Media Card Reader
Monitor
LCD type Optiquest® Q7 Optiquest Q7 Optiquest Q7 Optiquest Q7
Screen size 17” 17” 17” 17”
Refresh rate (Hz) 60 60 60 60
Figure 8: Configuration information for the four test systems.

A Principled Technologies test report 10
A performance comparison of Dell and HP desktop systems
APPENDIX B – ABOUT OUR TESTING SYSmark 2007 Preview v1.06
SYSmark 2007 Preview is a performance metric BAPCo created to measure system performance.
SYSmark 2007 Preview determines its overall rating from the mean result from four workload scenarios: e-
learning, office productivity, video creation, and 3D modeling. SYSmark 2007 Preview records the time the
system takes to complete each individual operation in each scenario.
SYSmark 2007 Preview consists of the following applications and corresponding tasks: Adobe® After®
Effects 7 (e-learning), Adobe Illustrator® CS2 (video creation), Adobe Photoshop® CS2 (video creation),
AutoDesk® 3ds Max® 8 (3D modeling), Macromedia® Flash 8 (e-learning), Microsoft® Excel® 2003 (office
productivity), Microsoft Outlook® 2003 (office productivity), Microsoft PowerPoint® 2003 (office productivity),
Microsoft Word 2003 (office productivity), Microsoft Project 2003 (office productivity), Microsoft Windows
Media™ Encoder 9 series (video creation), Sony® Vegas 7 (video creation), SketchUp 5 (3D modeling), and
WinZip® 10.0 (office productivity).
To learn more, visit http://www.bapco.com/support/sysmark2007preview/Help/Help.html.
MAXON CINEBENCH R10
CINEBENCH is a free, real-world cross platform test suite designed to evaluate and compare the CPU
and graphics performance across various systems and platforms. Based on MAXON CINEMA 4D software,
which creates 3D content, the benchmark consists of two main components: the graphics-card performance
test, and the CPU performance test.
CINEBENCH uses the processing power of a system to render 3D scenes that stress all available
processor cores, and reports performance in points (pts). Higher scores are better, as they indicate a faster
processor.
To learn more, visit http://www.maxon.net.
SPEC CPU 2006
The SPEC CPU2006 workload includes two benchmark suites: CINT2006 and CFP2006. (Note: SPEC and
SPECint are trademarks of the Standard Performance Evaluation Corporation.) The CINT2006 benchmark
focuses on measuring and comparing compute-intensive integer performance, while CFP2006 measures and
compares compute-intensive floating-point performance. We ran both benchmarks.

A Principled Technologies test report 11
A performance comparison of Dell and HP desktop systems
Figure 9 lists the 12 applications that compose the CINT2006 benchmark. SPEC wrote nine of the
applications in C and three (471.omnetpp, 473.astar, 483.xalancbmk) in C++. A CINT2006 run performs each of
the 12 applications three times and reports the median for each. It also calculates the geometric mean of
those 12 results to produce an overall score.
Name Application area
400.perlbench Programming language
401.bzip2 Compression
403.gcc C compiler
429.mcf Combinatorial optimization
445.gobmk Artificial intelligence: Go
456.hmmer Search gene sequence
458.sjeng Artificial intelligence: chess
462.libquantum Physics/quantum computing
464.h264ref Video compression
471.omnetpp Discrete event simulation
473.astar Path-finding algorithms
483.xalancbmk XML processing
Figure 9: The applications that make up the CINT2006 benchmark.
Figure 10 lists the 17 applications that compose the CFP2006 benchmark. SPEC wrote six of the
applications in FORTRAN, three using C, four using both FORTRAN and C, and four in C++.
A CFP2006 run performs each of the 17 application (tasks) three times and reports the median for
each. It also calculates the geometric mean of those 17 results to produce an overall score.

A Principled Technologies test report 12
A performance comparison of Dell and HP desktop systems
Measuring performance with BAPCo SYSmark 2007 Preview v1.06
Setting up the test
1. Reset the system to the base test image. 2. Disable the User Account Control.
a. Click StartControl Panel. b. At the User Accounts and Family Safety settings screen, click Add or remove user account. c. At the User Account Control screen, click Continue. d. Click Go to the main User Accounts page. e. At the Make changes to your user account screen, click Turn User Account Control on or off. f. At the User Account Control screen, click Continue. g. Uncheck Use User Account Control to help protect your computer, and click OK. h. At the You must restart your computer to apply these changes screen, click Restart Now.
3. Purchase and install SYSmark 2007 Preview v1.05 from https://www.bapcostore.com/store/product.php?productid=16165&cat=251&page=1.
4. At the Welcome to InstallShield Wizard screen, click Next. 5. At the License Agreement screen, select I accept the terms in the License Agreement, and click Next. 6. At the Choose Destination Location screen, click Next. 7. At the Ready to Install the Program screen, click Install. 8. When the installation is complete, click Finish.
Running the test
1. Launch SYSmark 2007 Preview by double-clicking the desktop icon. 2. Click Run.
Name Application area
410.bwaves Fluid Dynamics
416.gamess Quantum Chemistry
433.mic Physics/Quantum Chromodynamics
434.zeusmp Physics/CFD
435.gromacs Biochemistry/Molecular Dynamics
436.cactusADM Physics/General Relativity
437.leslie3d Fluid Dynamics
444.namd Biology/Molecular Dynamics
447.dealII Finite Element Analysis
450.soplex Linear Programming, Optimization
453.povray Image Ray-tracing
454.calculix Structural Mechanics
459.GemsFDTD Computational Electromagnetics
465.tonto Quantum Chemistry
470.lBM Fluid Dynamics
481.wrf Weather
482.sphinx3 Speech recognition Figure 10: The applications that make up the CFP2006 benchmark.
A Principled Technologies test report 13
A performance comparison of Dell and HP desktop systems
3. Select Official Run, choose 3 Iterations, check the box beside run conditioning run, and enter a name for that run.
4. When the benchmark completes and the main SYSmark 2007 Preview menu appears, click Save FDR to create a report.
Record the results for each iteration.
Measuring performance with MAXON CINEBENCH R10
Setting up the test
1. Reset the system to the base test image. 2. Download CINEBENCHR10.zip from
http://www.maxon.net/en/downloads/downloads/cinebench.html. 3. Right-click the CINEBENCH ZIP file, and choose Extract All. 4. Click Extract.
Running the test
1. Launch CINEBENCH R10 by double-clicking the CINEBENCH R10.exe file in the CINEBENCH R10 folder. 2. Enter the MHz frequency of the processor in the MHz (real freq.) field. 3. Enter a name in the Tester field. 4. Click the Start all tests button. 5. When the picture finishes rendering in multi-processor mode, save the results.
a. Click the To Clipboard button. b. Launch notepad and paste the results into an empty notepad document. c. Save the results in the format system_run_N.txt.
6. Close CINEBENCH R10. 7. Reboot the system. 8. Repeat steps 1 through 7 two times, and report the median.
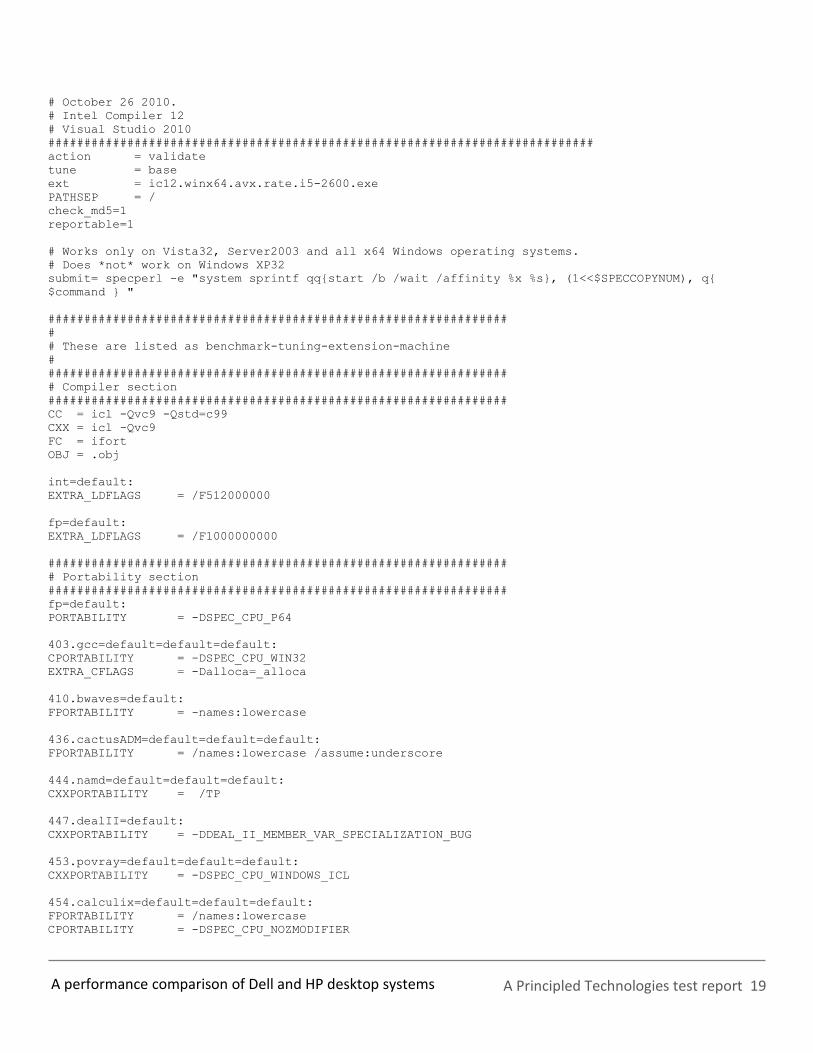
Measuring performance with SPEC CPU2006
SPEC CPU2006 configuration
For the Intel processor -based desktop workstations, we used the latest version of the Intel C/C++ and
Fortran compiler. We followed SPEC’s standard instructions for building the CINT2006 and CFP2006
executables. After studying the best results for this benchmark on the SPEC Web site, we chose the following
software tools:
Intel C/C++ Compiler 12.0.3.163
Intel Fortran Compiler 12.0.3.163
MicroQuill SmartHeap v10 (Multi-Core)
The benchmark requires configuration files. PT used a custom configuration file based on similar tests
online. From the SPEC Web site, we chose the most recent (as of the testing for this report) SPEC CPU2006
results that used the above compiler. We used these configuration files, along with modifications to reflect the

A Principled Technologies test report 14
A performance comparison of Dell and HP desktop systems
appropriate system information about the system under test, in our testing. The configuration files we used
appear in Appendix D.
To begin the benchmark, we performed the following steps:
Open a command prompt.
Change to the c:\cpu2006 directory.
Type shrc.bat at the command prompt.
Type the runspec command as recommended in the configuration file for the system you are testing.
When the run completes, the benchmark puts the results in the directory c:\cpu2006\result. The result
file names are of the form CFP2006.<number>.<suffix> and CINT2006.<number>.suffix. The suffixes are html,
asc, raw, and pdf. The number is three digits and associates a result file with its log, e.g., CFP2006.002.asc and
log.002.
Appendix E provides the SPECint_rate_base2006 and SPECfp_rate_base2006 output results for the test
systems.

A Principled Technologies test report 15
A performance comparison of Dell and HP desktop systems
APPENDIX C – DETAILED RESULTS Figures 11 and 12 present the detailed test results for the systems. For detailed SPEC CPU2006 results,
see Appendix E.
Mid-range systems Dell Vostro 460 Mini Tower
(Intel Core i5-2400) HP Slimline s5750z
(AMD Athlon II X4 640)
Run 1 Run 2 Run 3 Run 1 Run 2 Run 3
BAPCo SYSmark 2007 Preview v1.06
SYSmark 2007 Preview v1.06 - E-Learning 211 218 216 111 113 113
SYSmark 2007 Preview v1.06 - VideoCreation 282 297 291 228 233 236
SYSmark 2007 Preview v1.06 - Productivity 225 227 219 105 103 104
SYSmark 2007 Preview v1.06 - 3D 256 256 255 158 158 158
MAXON CINEBENCH R10
CB Single 5,529 5,551 5,495 3,156 3,117 3,106
CB Dual 18,993 18,862 18,821 11,020 10,821 10,748
Open GL 7,153 7,184 7,174 2,585 2,585 2,582
Multiprocessor Speedup 3.44 3.40 3.43 3.49 3.47 3.46
Figure 11: Benchmark results for the two mid-range desktop systems. Higher numbers are better.
High-end systems Dell OptiPlex 990 Mini Tower
(Intel Core i7-2600) HP Pavilion p6750z
(AMD Phenom II X4 840)
Run 1 Run 2 Run 3 Run 1 Run 2 Run 3
BAPCo SYSmark 2007 Preview v1.06
SYSmark 2007 Preview v1.06 - E-Learning 229 241 240 133 135 136
SYSmark 2007 Preview v1.06 - VideoCreation 321 324 330 228 236 242
SYSmark 2007 Preview v1.06 - Productivity 254 265 254 128 134 133
SYSmark 2007 Preview v1.06 - 3D 294 293 292 171 170 170
MAXON CINEBENCH R10
CB Single 5,955 6,186 6,178 3,615 3,581 3,594
CB Dual 22,666 23,112 23,007 12,444 12,259 11,996
Open GL 7,988 8,019 7,955 6521 6,466 6,474
Multiprocessor Speedup 3.81 3.74 3.72 3.44 3.42 3.34
Figure 12: Benchmark results, for the two high-end desktop systems. Higher numbers are better.

A Principled Technologies test report 16
A performance comparison of Dell and HP desktop systems
APPENDIX D – SPEC CPU2006 CONFIGURATION FILES Dell Vostro 460 Mini Tower (Intel Core i5-2400) # Invocation command line:
# C:\CPU200~1.APR\bin\runspec --rate 4 -c cpu2006.i5-2400.cfg -T base --flagsurl=Intel-ic12-win32-
revB.xml,Intel-Windows-Platform-Settings.xml -o asc int
# output_root was not used for this run
############################################################################
# This is a sample config file. It was tested with:
#
# Compiler name/version: Intel Compiler 12, MS VS 2008
# Operating system version: Windows Vista (64-bit)
# Hardware: Intel processors supporting
# AVX instructions
#
# If your platform uses different versions, different
# hardware or operates in a different mode (for
# example, 32- vs. 64-bit mode), there is the possibiliy
# that this configuration file may not work as-is.
#
# Note that issues with compilation should be directed
# to the compiler vendor. Information about SPEC technical
# support can be found in the techsupport document in the
# Docs directory of your benchmark installation.
#
# This config file uses the SmartHeap library and if you
# do not have a licensed copy, please remove all
# instances of shlW32M.lib from this config file.
#
# Also note that this is a sample configuration. It
# is expected to work for the environment in which
# it was tested; it is not guaranteed that this is
# the config file that will provide the best performance.
#
#
# Note that you might find a more recent config file for
# your platform with the posted results at
# http://www.spec.org/cpu2006
############################################################################
# SPEC CPU2006 Intel Windows Vista64/Win7-64 config file
# October 26 2010.
# Intel Compiler 12
# Visual Studio 2010
############################################################################
action = validate
tune = base
ext = ic12.winx64.avx.rate.i5-2400.exe
PATHSEP = /
check_md5=1
reportable=1
# Works only on Vista32, Server2003 and all x64 Windows operating systems.
# Does *not* work on Windows XP32
submit= specperl -e "system sprintf qq{start /b /wait /affinity %x %s}, (1<<$SPECCOPYNUM), q{
$command } "
################################################################
#
# These are listed as benchmark-tuning-extension-machine
#
################################################################

A Principled Technologies test report 17
A performance comparison of Dell and HP desktop systems
# Compiler section
################################################################
CC = icl -Qvc9 -Qstd=c99
CXX = icl -Qvc9
FC = ifort
OBJ = .obj
int=default:
EXTRA_LDFLAGS = /F512000000
fp=default:
EXTRA_LDFLAGS = /F1000000000
################################################################
# Portability section
################################################################
fp=default:
PORTABILITY = -DSPEC_CPU_P64
403.gcc=default=default=default:
CPORTABILITY = -DSPEC_CPU_WIN32
EXTRA_CFLAGS = -Dalloca=_alloca
410.bwaves=default:
FPORTABILITY = -names:lowercase
436.cactusADM=default=default=default:
FPORTABILITY = /names:lowercase /assume:underscore
444.namd=default=default=default:
CXXPORTABILITY = /TP
447.dealII=default:
CXXPORTABILITY = -DDEAL_II_MEMBER_VAR_SPECIALIZATION_BUG
453.povray=default=default=default:
CXXPORTABILITY = -DSPEC_CPU_WINDOWS_ICL
454.calculix=default=default=default:
FPORTABILITY = /names:lowercase
CPORTABILITY = -DSPEC_CPU_NOZMODIFIER
464.h264ref=default=default=default:
CPORTABILITY = -DWIN32 -DSPEC_CPU_NO_INTTYPES
481.wrf=default:
CPORTABILITY = -DSPEC_CPU_WINDOWS_ICL
483.xalancbmk=default=default=default:
CXXPORTABILITY = -Qoption,cpp,--no_wchar_t_keyword
################################################################
# Library Tuning Flags
################################################################
471.omnetpp,473.astar,483.xalancbmk=default:
EXTRA_LIBS= c:\cpu2006\shlW32M.lib
LDOUT= -Fe$@ -link /FORCE:MULTIPLE
################################################################
# Baseline Tuning Flags
# default baseline for int and fp 2006
################################################################
int=base=default=default:

A Principled Technologies test report 18
A performance comparison of Dell and HP desktop systems
OPTIMIZE= -QxAVX -Qipo -O3 -Qprec-div- -Qopt-prefetch
CXXOPTIMIZE= -Qcxx-features
fp=base=default=default:
OPTIMIZE= -QxAVX -Qipo -O3 -Qprec-div- -Qansi-alias
COPTIMIZE= -Qauto-ilp32
CXXOPTIMIZE= -Qcxx-features -Qauto-ilp32
EXTRA_CXXLIBS= c:\cpu2006\shlW64M.lib
LDOUT= -Fe$@ -link /FORCE:MULTIPLE
fp=peak:
COPTIMIZE= -Qauto-ilp32
CXXOPTIMIZE= -Qauto-ilp32
EXTRA_CXXLIBS= c:\cpu2006\shlW64M.lib
LDOUT= -Fe$@ -link /FORCE:MULTIPLE
################################################################
# Peak Tuning Flags
# default peak for int and fp 2006
################################################################
Dell OptiPlex 990 Mini Tower (Intel Core i7-2600) # Invocation command line:
# C:\CPU200~1.APR\bin\runspec --rate 8 --define smt-on --define cores=4 -c cpu2006.i5-2600.cfg -T
base --flagsurl=Intel-ic12-win32-revB.xml,Intel-Windows-Platform-Settings.xml -o asc int
# output_root was not used for this run
############################################################################
# This is a sample config file. It was tested with:
#
# Compiler name/version: Intel Compiler 12, MS VS 2008
# Operating system version: Windows Vista (64-bit)
# Hardware: Intel processors supporting
# AVX instructions
#
# If your platform uses different versions, different
# hardware or operates in a different mode (for
# example, 32- vs. 64-bit mode), there is the possibiliy
# that this configuration file may not work as-is.
#
# Note that issues with compilation should be directed
# to the compiler vendor. Information about SPEC technical
# support can be found in the techsupport document in the
# Docs directory of your benchmark installation.
#
# This config file uses the SmartHeap library and if you
# do not have a licensed copy, please remove all
# instances of shlW32M.lib from this config file.
#
# Also note that this is a sample configuration. It
# is expected to work for the environment in which
# it was tested; it is not guaranteed that this is
# the config file that will provide the best performance.
#
#
# Note that you might find a more recent config file for
# your platform with the posted results at
# http://www.spec.org/cpu2006
############################################################################
# SPEC CPU2006 Intel Windows Vista64/Win7-64 config file
A Principled Technologies test report 19
A performance comparison of Dell and HP desktop systems
# October 26 2010.
# Intel Compiler 12
# Visual Studio 2010
############################################################################
action = validate
tune = base
ext = ic12.winx64.avx.rate.i5-2600.exe
PATHSEP = /
check_md5=1
reportable=1
# Works only on Vista32, Server2003 and all x64 Windows operating systems.
# Does *not* work on Windows XP32
submit= specperl -e "system sprintf qq{start /b /wait /affinity %x %s}, (1<<$SPECCOPYNUM), q{
$command } "
################################################################
#
# These are listed as benchmark-tuning-extension-machine
#
################################################################
# Compiler section
################################################################
CC = icl -Qvc9 -Qstd=c99
CXX = icl -Qvc9
FC = ifort
OBJ = .obj
int=default:
EXTRA_LDFLAGS = /F512000000
fp=default:
EXTRA_LDFLAGS = /F1000000000
################################################################
# Portability section
################################################################
fp=default:
PORTABILITY = -DSPEC_CPU_P64
403.gcc=default=default=default:
CPORTABILITY = -DSPEC_CPU_WIN32
EXTRA_CFLAGS = -Dalloca=_alloca
410.bwaves=default:
FPORTABILITY = -names:lowercase
436.cactusADM=default=default=default:
FPORTABILITY = /names:lowercase /assume:underscore
444.namd=default=default=default:
CXXPORTABILITY = /TP
447.dealII=default:
CXXPORTABILITY = -DDEAL_II_MEMBER_VAR_SPECIALIZATION_BUG
453.povray=default=default=default:
CXXPORTABILITY = -DSPEC_CPU_WINDOWS_ICL
454.calculix=default=default=default:
FPORTABILITY = /names:lowercase
CPORTABILITY = -DSPEC_CPU_NOZMODIFIER

A Principled Technologies test report 20
A performance comparison of Dell and HP desktop systems
464.h264ref=default=default=default:
CPORTABILITY = -DWIN32 -DSPEC_CPU_NO_INTTYPES
481.wrf=default:
CPORTABILITY = -DSPEC_CPU_WINDOWS_ICL
483.xalancbmk=default=default=default:
CXXPORTABILITY = -Qoption,cpp,--no_wchar_t_keyword
################################################################
# Library Tuning Flags
################################################################
471.omnetpp,473.astar,483.xalancbmk=default:
EXTRA_LIBS= c:\cpu2006\shlW32M.lib
LDOUT= -Fe$@ -link /FORCE:MULTIPLE
################################################################
# Baseline Tuning Flags
# default baseline for int and fp 2006
################################################################
int=base=default=default:
OPTIMIZE= -QxAVX -Qipo -O3 -Qprec-div- -Qopt-prefetch
CXXOPTIMIZE= -Qcxx-features
fp=base=default=default:
OPTIMIZE= -QxAVX -Qipo -O3 -Qprec-div- -Qansi-alias
COPTIMIZE= -Qauto-ilp32
CXXOPTIMIZE= -Qcxx-features -Qauto-ilp32
EXTRA_CXXLIBS= c:\cpu2006\shlW64M.lib
LDOUT= -Fe$@ -link /FORCE:MULTIPLE
fp=peak:
COPTIMIZE= -Qauto-ilp32
CXXOPTIMIZE= -Qauto-ilp32
EXTRA_CXXLIBS= c:\cpu2006\shlW64M.lib
LDOUT= -Fe$@ -link /FORCE:MULTIPLE
################################################################
# Peak Tuning Flags
# default peak for int and fp 2006
################################################################
HP Pavilion Slimline s5750z (AMD Athlon II X4 640) and HP Pavilion p6750z (AMD Phenom II X4 840) # Invocation command line:
# C:\CPU200~1.IC1\bin\runspec --rate 4 -c cpu2006.phenom.cfg -T base --flagsurl=Intel-ic11.0-win32-
revA.xml,Intel-Win32-Platform.xml -o asc int
# output_root was not used for this run
############################################################################
############################################################################
# This is a sample config file. It was tested with:
#
# Compiler name/version: Intel Compiler 11.0 , MS VS 2008
# Operating system version: Windows Vista (32-bit and 64-bit)
# Hardware: Intel processors supporting
# Streaming SIMD Extensions 2
#
# If your platform uses different versions, different
# hardware or operates in a different mode (for
# example, 32- vs. 64-bit mode), there is the possibiliy
# that this configuration file may not work as-is.

A Principled Technologies test report 21
A performance comparison of Dell and HP desktop systems
#
# Note that issues with compilation should be directed
# to the compiler vendor. Information about SPEC technical
# support can be found in the techsupport document in the
# Docs directory of your benchmark installation.
#
# This config file uses the SmartHeap library and if you
# do not have a licensed copy, please remove all
# instances of shlW32M.lib from this config file.
#
# Also note that this is a sample configuration. It
# is expected to work for the environment in which
# it was tested; it is not guaranteed that this is
# the config file that will provide the best performance.
#
#
# Note that you might find a more recent config file for
# your platform with the posted results at
# http://www.spec.org/cpu2006
############################################################################
# SPEC CPU2006 Intel Windows XP/Vista32 config file
# Oct 03 2008. Intel Compiler 11.0 Visual Studio 2008
############################################################################
action = validate
tune = base
ext = cpu2006.1.0.ic11.0.win32.sse2.rate.exe
PATHSEP = /
check_md5=1
reportable=1
flagsurl000 = http://www.spec.org/cpu2006/flags/Intel-ic11.0-win32-revA.xml
# Works only on Vista32, Server2003 and all x64 Windows operating systems.
# Does *not* work on Win XP32
submit= specperl -e "system sprintf qq{start /b /wait /affinity %x %s}, (1<<$SPECCOPYNUM), q{
$command } "
################################################################
#
# These are listed as benchmark-tuning-extension-machine
#
################################################################
# Compiler section
################################################################
CC = icl -Qvc9 -Qc99
CXX = icl -Qvc9
FC = ifort
OBJ = .obj
int=default:
EXTRA_LDFLAGS = /F512000000
fp=default:
EXTRA_LDFLAGS = /F1000000000
################################################################
# Portability section
################################################################
403.gcc=default=default=default:
CPORTABILITY = -DSPEC_CPU_WIN32
EXTRA_CFLAGS = -Dalloca=_alloca
436.cactusADM=default=default=default:
FPORTABILITY = -Qlowercase /assume:underscore

A Principled Technologies test report 22
A performance comparison of Dell and HP desktop systems
444.namd=default=default=default:
CXXPORTABILITY = -TP
447.dealII=default=default=default:
PORTABILITY = -DDEAL_II_MEMBER_VAR_SPECIALIZATION_BUG
453.povray=default=default=default:
CXXPORTABILITY = -DSPEC_CPU_WINDOWS_ICL
454.calculix=default=default=default:
PORTABILITY = -Qlowercase -DSPEC_CPU_NOZMODIFIER
464.h264ref=default=default=default:
PORTABILITY = -DSPEC_CPU_NO_INTTYPES -DWIN32
481.wrf=default:
CPORTABILITY = -DSPEC_CPU_WINDOWS_ICL
483.xalancbmk=default=default=default:
CXXPORTABILITY = -Qoption,cpp,--no_wchar_t_keyword
################################################################
# Library Tuning Flags
################################################################
all_cpp=default:
EXTRA_LIBS= c:\cpu2006\shlW32M.lib
LDOUT= -Fe$@ -link /FORCE:MULTIPLE
################################################################
# Baseline Tuning Flags
# default baseline for int and fp 2006
################################################################
int=base=default=default:
OPTIMIZE= /arch:SSE2 -Qipo -O3 -Qprec-div- -Qopt-prefetch
CXXOPTIMIZE= -Qcxx-features
sw_base_ptrsize = 32-bit
fp=base=default=default:
OPTIMIZE= /arch:SSE2 -Qipo -O3 -Qprec-div- -Qopt-prefetch
CXXOPTIMIZE= -Qcxx-features
################################################################
# Peak Tuning Flags
# default peak for int and fp 2006
################################################################

A Principled Technologies test report 23
A performance comparison of Dell and HP desktop systems
APPENDIX E – DETAILED SPEC CPU2006 RESULTS
Mid-range systems
Dell Vostro 460 Mini Tower (Intel Core i5-2400)

A Principled Technologies test report 24
A performance comparison of Dell and HP desktop systems
A Principled Technologies test report 25
A performance comparison of Dell and HP desktop systems
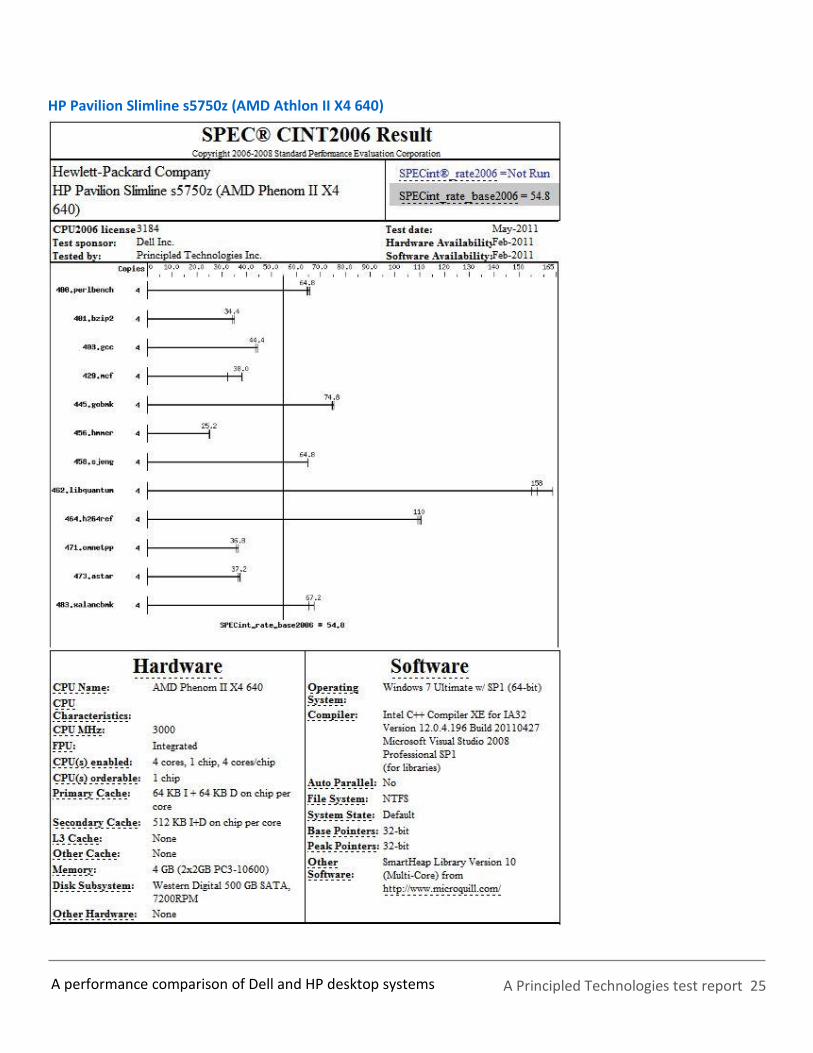
HP Pavilion Slimline s5750z (AMD Athlon II X4 640)

A Principled Technologies test report 26
A performance comparison of Dell and HP desktop systems

A Principled Technologies test report 27
A performance comparison of Dell and HP desktop systems
High-end systems
Dell OptiPlex 990 Mini Tower (Intel Core i7-2600)

A Principled Technologies test report 28
A performance comparison of Dell and HP desktop systems

A Principled Technologies test report 29
A performance comparison of Dell and HP desktop systems
HP Pavilion p6750z (AMD Phenom II X4 840)

A Principled Technologies test report 30
A performance comparison of Dell and HP desktop systems

A Principled Technologies test report 31
A performance comparison of Dell and HP desktop systems
ABOUT PRINCIPLED TECHNOLOGIES
Principled Technologies, Inc. 1007 Slater Road, Suite 300 Durham, NC, 27703 www.principledtechnologies.com
We provide industry-leading technology assessment and fact-based marketing services. We bring to every assignment extensive experience with and expertise in all aspects of technology testing and analysis, from researching new technologies, to developing new methodologies, to testing with existing and new tools. When the assessment is complete, we know how to present the results to a broad range of target audiences. We provide our clients with the materials they need, from market-focused data to use in their own collateral to custom sales aids, such as test reports, performance assessments, and white papers. Every document reflects the results of our trusted independent analysis. We provide customized services that focus on our clients’ individual requirements. Whether the technology involves hardware, software, Web sites, or services, we offer the experience, expertise, and tools to help our clients assess how it will fare against its competition, its performance, its market readiness, and its quality and reliability. Our founders, Mark L. Van Name and Bill Catchings, have worked together in technology assessment for over 20 years. As journalists, they published over a thousand articles on a wide array of technology subjects. They created and led the Ziff-Davis Benchmark Operation, which developed such industry-standard benchmarks as Ziff Davis Media’s Winstone and WebBench. They founded and led eTesting Labs, and after the acquisition of that company by Lionbridge Technologies were the head and CTO of VeriTest.
Principled Technologies is a registered trademark of Principled Technologies, Inc. All other product names are the trademarks of their respective owners.
Disclaimer of Warranties; Limitation of Liability: PRINCIPLED TECHNOLOGIES, INC. HAS MADE REASONABLE EFFORTS TO ENSURE THE ACCURACY AND VALIDITY OF ITS TESTING, HOWEVER, PRINCIPLED TECHNOLOGIES, INC. SPECIFICALLY DISCLAIMS ANY WARRANTY, EXPRESSED OR IMPLIED, RELATING TO THE TEST RESULTS AND ANALYSIS, THEIR ACCURACY, COMPLETENESS OR QUALITY, INCLUDING ANY IMPLIED WARRANTY OF FITNESS FOR ANY PARTICULAR PURPOSE. ALL PERSONS OR ENTITIES RELYING ON THE RESULTS OF ANY TESTING DO SO AT THEIR OWN RISK, AND AGREE THAT PRINCIPLED TECHNOLOGIES, INC., ITS EMPLOYEES AND ITS SUBCONTRACTORS SHALL HAVE NO LIABILITY WHATSOEVER FROM ANY CLAIM OF LOSS OR DAMAGE ON ACCOUNT OF ANY ALLEGED ERROR OR DEFECT IN ANY TESTING PROCEDURE OR RESULT. IN NO EVENT SHALL PRINCIPLED TECHNOLOGIES, INC. BE LIABLE FOR INDIRECT, SPECIAL, INCIDENTAL, OR CONSEQUENTIAL DAMAGES IN CONNECTION WITH ITS TESTING, EVEN IF ADVISED OF THE POSSIBILITY OF SUCH DAMAGES. IN NO EVENT SHALL PRINCIPLED TECHNOLOGIES, INC.’S LIABILITY, INCLUDING FOR DIRECT DAMAGES, EXCEED THE AMOUNTS PAID IN CONNECTION WITH PRINCIPLED TECHNOLOGIES, INC.’S TESTING. CUSTOMER’S SOLE AND EXCLUSIVE REMEDIES ARE AS SET FORTH HEREIN.