A Performance-Based Evaluation Model for Rewarding Merit in Italian Schools
20
A Performance-Based Evaluation Model for Rewarding Merit in Italian Schools Donatella Poliandri, INVALSI Paola Muzzioli, INVALSI Isabella Quadrelli, INVALSI Sara Romiti, INVALSI Rome, 3-5 October 2012
description
A Performance-Based Evaluation Model for Rewarding Merit in Italian Schools. Donatella Poliandri, INVALSI Paola Muzzioli, INVALSI Isabella Quadrelli, INVALSI Sara Romiti, INVALSI. Rome, 3-5 October 2012. Evaluation and Development of Quality in schools (VSQ). - PowerPoint PPT Presentation
Transcript of A Performance-Based Evaluation Model for Rewarding Merit in Italian Schools

A Performance-Based Evaluation Model for Rewarding Merit in Italian Schools
Donatella Poliandri, INVALSI
Paola Muzzioli, INVALSI
Isabella Quadrelli, INVALSI
Sara Romiti, INVALSI
Rome, 3-5 October 2012

Evaluation and Development of Quality in schools (VSQ)
VSQ is a pilot study carried out by the Italian Ministry of Education (MIUR), INVALSI and Sapienza University of Rome
Its objectives are: to design a model for school evaluation; to acknowledge excellence and promote support for school
improvement.
The project integrates two perspectives:1. Merit rewarding. Top performing schools receive financial
rewards (competition mechanism). 2. School improvement. low performing schools are
supported to start an improvement plan (equal opportunity approach).

Aim of this presentation

The theoretical framework
Sen’s concepts of merit and meritocracy, in Merit and Justice (2000)

Merit and Justice
According to Sen, we can scarcely dispense with rewarding actions which produce good results, at least for their incentive effect.
Does rewarding merit necessarily produce inequality?
As merit is a derivative and contingent concept, equality or equal opportunities could be the leading criteria to define merit.
“The art of developing an incentive system lies in delineating the content of merit in such a way that it helps to generate valued consequences” (Sen
2000. p. 9)
“The art of developing an incentive system lies in delineating the content of merit in such a way that it helps to generate valued consequences” (Sen
2000. p. 9)
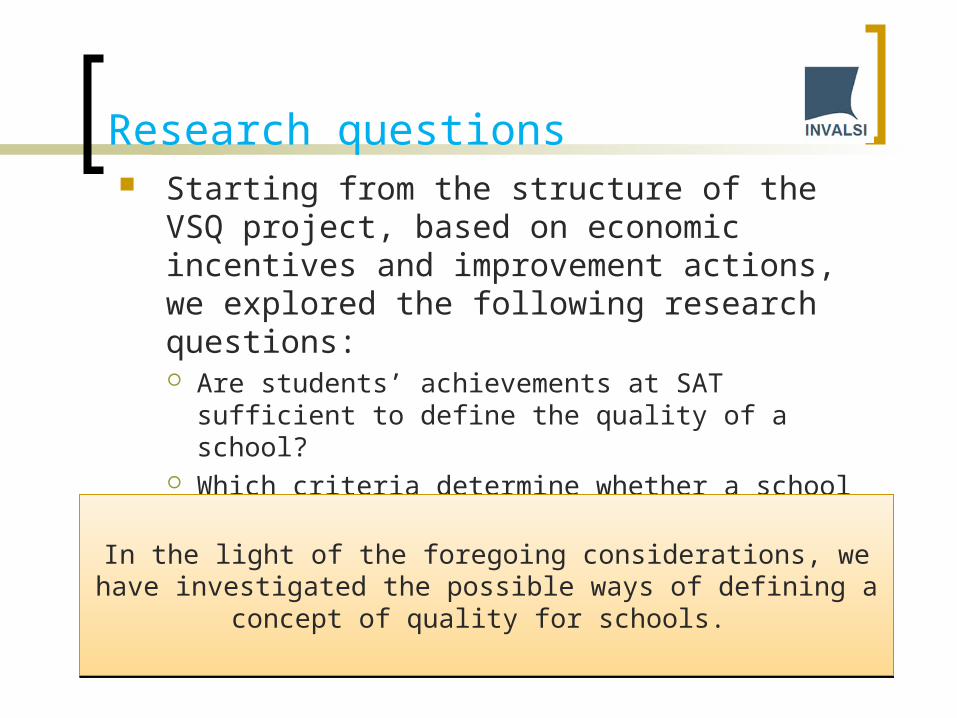
Research questions Starting from the structure of the VSQ project,
based on economic incentives and improvement actions, we explored the following research questions: Are students’ achievements at SAT sufficient to define the
quality of a school? Which criteria determine whether a school deserve a
reward or not?
In the light of the foregoing considerations, we have investigated the possible ways of defining a concept of quality for schools.
In the light of the foregoing considerations, we have investigated the possible ways of defining a concept of quality for schools.

The operationalization of quality
A multi-criteria concept of quality

Measurement of students’ achievement
standardized instruments were used to assess students’ learning such as reading understanding, grammar and math tests administered by INVALSI
Results from the INVALSI tests were used to construct a measure of Value-added (developed by Ricci & Falzetti from INVALSI) .
Value-added models allows to compare schools from the same starting point, that is not considering the differences in students’ achievement due to individual, structural and contextual variables. In Value-added models the variables which are not under the direct
control of schools are not considered.
The Value-added represents the “measure of quality in terms of the extent to which the educational experience enhances the knowledge, abilities and
skills of students” (Harvey and Green, 1993).
The Value-added represents the “measure of quality in terms of the extent to which the educational experience enhances the knowledge, abilities and
skills of students” (Harvey and Green, 1993).

Evaluation of positive actions
Evaluation Teams visited each school and assessed the quality level in several areas
InclusionInclusionEnrichment & Remediation programmes
Enrichment & Remediation programmes
School choice guidance
School choice guidance EvaluationEvaluation

Scoring Rubrics The instrument used to evaluate schools’ positive
actions is the Scoring rubric A rubric contains evaluation criteria and a
description of the good and less good performances related to different levels of quality (inadequate, acceptable, good, excellent).
Each quality criteria is articulated through a “multi-focus” perspective: that is the same quality criteria is assessed considering several dimensions
For each Scoring rubric it was provided a checklist that contains a list of indicators that were considered relevant and that needed to be observed for reaching a good level of quality

Multi-focus perspective In the Rubric assessing Remediation programmes
four dimensions are identified: needs analysis: in this dimension are considered how
schools collect information about, or monitor educational and training needs of students, in order to implement specific actions;
organizational structure: this dimension is related to organizational aspects of the intervention (e.g. Is there a teacher leader for remediation programmes? How students access remediation classes?);
teaching: refers to the specific teaching strategies and actions activated (e.g. grouping strategies, etc.)
satisfaction / effectiveness: considers students’ opinion about remediation classes and the impact of remediation classes attendance on students’ results.

Scoring Rubrics and Mean Rubric Score
Inclusion of students with disabilities
Inclusion of foreign students
Enrichment programmes
Remediation programmes
School choice guidance
Internal evaluation / Self-evaluation
Teachers’ educational planning and evaluation of students
Mean RubricScore
Mean RubricScore
Inclusion
Enrichment & Remediation
Evaluation
School choice guidance
Rubric Score
Rubric Score
Rubric Score
Rubric Score
Rubric Score
Rubric Score
Rubric Score
Rubric Score
Rubric Score
Rubric Score
Rubric Score
Rubric Score
Rubric Score
Rubric Score

The Final Score
The weight of the Mean rubric score is 40%
The weight of the Value-added score is 60%:
- 35% for Italian - 25% for Math
The final score – that defined each school’s position in the final ranking – was made up from the Value-added score and the Mean rubric score
The higher weight given to Value-added in Italian arises
from the relation between competences in Italian and
competences in other subjects (e.g. the link between scientific processes comprehension and
Italian literacy)

Results: quantitative and qualitative tools explore different aspects
77 primary/middle schools from 4 different provinces (Pavia, Mantova, Arezzo, and Siracusa) in Italy have participated to this study.
Correlation between Rubric scores and Value-added in Italian and Maths confirm that both quantitative and qualitative instruments contributed to the evaluation of the educational process through the exploration of different aspects.
Pearson correlation between Value-added, Mean rubric score and Final score
MEAN rubric score
Value-added
ITALIAN
Value-added
MATH
Final score
MEAN rubrics score 1
Value-added ITALIAN
,10 1
Value-added MATH ,16 ,61** 1
Final score ,51** ,85** ,81** 1
**. Correlation is significant at the 0,01 level (2-tailed)

Scoring Rubrics’ validity
In Scoring Rubrics there is a high correlation between the number of checks filled by evaluation Teams (that is the number of indicators observed by the Team) and the total quality reached by the school in a specific area.
The higher the number of indicators included in the checklist, the higher the level of quality reached by a school in a specific area.
Pearson correlation between Rubric score and percentage of checklist filling out
Rubric score
Inclusion students with disabilities ,796**
Inclusion foreign students ,770**
Internal evaluation/self-evaluation ,734**
Planning and student evaluation ,752**
Enrichment programmes ,775**
Remediation programmes ,753**
School choice guidance ,802**

Distribution of schools by Value-added levels
• Almost 50% of schools have an intermediate level of Value-added both in Italian and Maths. This is consistent with the results of other research using Value-added in Italy
• The number of schools with lower levels of Value-added is higher than schools with higher ones.
Distribution of schools by value added levels
Added value levels Added value
ITALIAN %
Added value
MATH %
Low 19 24,66 23 29,87 Medium-low 2 2,60 3 3,90 Medium 38 49,35 35 45,45 Medium-high 4 5,19 3 3,90 High 14 18,18 13 16,88 Total schools 77 100 77 100

Good and less good school performances (Rubric Score)
Overall Mean rubric score is 2.63 with a standard deviation of 0.60, this confirm that most schools have received acceptable and good scores.
The lowest performance was on the Rubric “Internal evaluation / self evaluation”: 30% of schools were assessed as inadequate, less than 10% obtained an excellent score.
The best performance was on the Rubric “Inclusion of students with disabilities”: only 1% of schools received an inadequate score.
0
5
10
15
20
25
30
35
40
45
Inadequate Acceptable Good Excellent
rubric score
per
cen
tag
e o
f sc
ho
ols
Inclusion students with disabilities Inclusion foreign students
Internal evaluation / self evaluation Planning and students' evaluation
Enrichment actions Remediation actions
Orientation

Correlation between Rubric scores and Value-added scores
Correlations show a significant positive association between students’ evaluation practices and the value added of Italian and Math.
There is a positive significant relation between Value-added scores in Math and effective Enrichment programmes
There is a significant association between student evaluation practices and enrichment and remediation programmes. These results show the importance of a good student evaluation system in order to plan effective individualisation interventions (enrichment or remediation programmes).
**. Correlation is significant at the 0,01 level (2-tailed).*. Correlation is significant at the 0,05 level (2-tailed).

VSQ: next steps
Regional ranking have been produced and 25% of schools placed in the top distribution of the ranking have received a money token
All participating schools have received an individual Evaluation report that highlights strengths and difficulties in the areas under investigation and give suggestion for improvement
Schools also have received financial support for implementing improvement plans: the amount of such support is higher for schools that were in the bottom distribution of the ranking
In 2013, participating schools will be evaluated again, using the same instruments, in order to assess the effect of the competitive mechanism and of the improvement plan on school performance, and to distribute the final part of the money incentive.