A Perceptive Evaluation of Volume Rendering Techniques
9
HAL Id: inria-00176181 https://hal.inria.fr/inria-00176181 Submitted on 20 May 2011 HAL is a multi-disciplinary open access archive for the deposit and dissemination of sci- entific research documents, whether they are pub- lished or not. The documents may come from teaching and research institutions in France or abroad, or from public or private research centers. L’archive ouverte pluridisciplinaire HAL, est destinée au dépôt et à la diffusion de documents scientifiques de niveau recherche, publiés ou non, émanant des établissements d’enseignement et de recherche français ou étrangers, des laboratoires publics ou privés. A Perceptive Evaluation of Volume Rendering Techniques Christian Boucheny, Georges-Pierre Bonneau, Jacques Droulez, Guillaume Thibault, Stéphane Ploix To cite this version: Christian Boucheny, Georges-Pierre Bonneau, Jacques Droulez, Guillaume Thibault, Stéphane Ploix. A Perceptive Evaluation of Volume Rendering Techniques. APGV ’07 - 4th symposium on Applied Perception in Graphics and Visualization, Jul 2007, Tübingen, Germany. pp.83-90, 10.1145/1272582.1272600. inria-00176181
Transcript of A Perceptive Evaluation of Volume Rendering Techniques

HAL Id: inria-00176181https://hal.inria.fr/inria-00176181
Submitted on 20 May 2011
HAL is a multi-disciplinary open accessarchive for the deposit and dissemination of sci-entific research documents, whether they are pub-lished or not. The documents may come fromteaching and research institutions in France orabroad, or from public or private research centers.
L’archive ouverte pluridisciplinaire HAL, estdestinée au dépôt et à la diffusion de documentsscientifiques de niveau recherche, publiés ou non,émanant des établissements d’enseignement et derecherche français ou étrangers, des laboratoirespublics ou privés.
A Perceptive Evaluation of Volume RenderingTechniques
Christian Boucheny, Georges-Pierre Bonneau, Jacques Droulez, GuillaumeThibault, Stéphane Ploix
To cite this version:Christian Boucheny, Georges-Pierre Bonneau, Jacques Droulez, Guillaume Thibault, StéphanePloix. A Perceptive Evaluation of Volume Rendering Techniques. APGV ’07 - 4th symposiumon Applied Perception in Graphics and Visualization, Jul 2007, Tübingen, Germany. pp.83-90,�10.1145/1272582.1272600�. �inria-00176181�
To appear in the ACM APGV 2007 symposium proceedings
A Perceptive Evaluation of Volume Rendering Techniques
Christian Boucheny∗ Georges-Pierre Bonneau∗
LJK - Grenoble University - INRIAJacques Droulez †
LPPA - CNRS - College de FranceGuillaume Thibault‡ Stephane Ploix‡
eDF
Abstract
The display of space filling data is still a challenge for the commu-nity of visualization. Direct Volume Rendering (DVR) is one of themost important techniques developed to achieve direct perceptionof such volumetric data. It is based on semi-transparent representa-tions, where the data are accumulated in a depth-dependent order.However, it produces images that may be difficult to understand,and thus several techniques have been proposed so as to improveits effectiveness, using for instance lighting models or simpler rep-resentations (e.g. Maximum Intensity Projection). In this paperwe present two perceptual studies that question how DVR meets itsgoals, in either static or dynamic context. We show that a static rep-resentation is highly ambiguous, even in simple cases, but this canbe counterbalanced by use of dynamic cues, i.e. motion parallax,provided that the rendering parameters are correctly tuned.
CR Categories: I.3.3 [Computer Graphics]: Picture/ImageGeneration—Display Algorithms; I.3.8 [Computer Graphics]: Ap-plications; J.2 [Physical Sciences and Engineering]
Keywords: Direct Volume Rendering, perception of transparency,static and dynamic cues
1 Introduction
Dense three-dimensional datasets represent a challenge for the vi-sualization community. Ideally, one would like to see at a glanceall the data that fill the space, and have a clear picture in mind ofthe spatial layout, of the organization within the volume of the dis-played physical fields. However, such representations are not nat-ural, as the human visual system mainly experiences surfaces thathide one another through occlusion. Thus, early representations ofscalar fields were based on the extraction of characteristic surfacesthat could be displayed, for instance surfaces of isovalues. But thesemethods require the viewer to mentally reconstruct a volume froma sequence of pictures, which is a very complex cognitive task.
To overcome this limitation, it has been suggested to consider densescalar data fields as volumes of particles with emissive and absorp-tive properties, like drops of water that modify the light rays travers-ing a cloud. This led to the development of Direct Volume Render-ing methods that highly rely on transparencies. These techniqueshave been throughly developed and improved since their birth inthe late 80’s. However, it is surprising to notice that they do not
∗e-mail: {christian.boucheny, georges-pierre.bonneau}@inrialpes.fr†e-mail: [email protected]‡e-mail: {guillaume.thibault, stephane.ploix}@edf.fr
seem to be intensively used by final users outside the medical com-munity, as we could observe, despite their implementation in mostvisualization softwares. As was argued by [Hibbard 2000], ”all3D graphics suffer from ambiguity, with many 3D points projectedonto each point of the 2D screen (or of the user’s 2D retina). Thisambiguity is strongest in volume rendering, where the color of eachscreen pixel is determined by a (theoretical) continuum of semi-transparent 3D points”, which could be one of the main reason whyscientists do not find volume rendering to be as accurate as othertechniques. Produced images may look nice, but if no recognizablestructure is present in the data it can be really hard to extract spatialrelationships. Another reason for the lack of interest of scientistsin volume rendering consists in the difficulty to tune the TransferFunction (TF), which is the determinant of the final rendering butoften proves complex to adjust even for expert users. But strik-ingly, when [Kaufman and Mueller 2005] give a thorough reviewof research in volume rendering, none of the near 300 referencesare devoted to evaluation and validation based on user studies.
In this paper, we address from the human visual system point ofview the question of the perceived depth order of semi-transparentobjects rendered by means of DVR. The focus is on depth percep-tion, as it is a very important aspect of volume rendering that canbe quantified; we do not deal with other perceptive issues such aspattern recognition or matching. To the best of our knowledge,this paper represents the first insight on the perceptive problemsof DVR. We do not intend to formulate definitive conclusions, butrather wish to orient future works on volume rendering. Computa-tional costs related to volume rendering of large datasets often leadto quasi-static representations, whereas motion is a strong cue todepth perception. We thus carried out two experiments, in static anddynamic contexts. Transparent renderings seem to generate depthorder ambiguities, also found in point-based rendering. Our mainhypothesis is that if we are able to perceive transparency per se,such as in clouds or water, understanding the spatial layout of datain a translucent material cannot be done in static monocular presen-tations, but requires dynamic depth cues such as motion parallax.In this paper, monocular will relate to representations without anybinocular disparity, like when one looks at a basic computer screen.
The paper is organized as follows: first, we propose an overallreview of Direct Volume Rendering in computer graphics, andpresent some well-known results about the perception of trans-parency. Then, in a first experiment, we examine how human sub-jects are able to discriminate in depth two static objects displayedwith DVR technique, when color transparencies and accumulationsare the only sources of information. To avoid perspective biases, weuse orthographic projections. Then, a second experiment focuseson the perception of depth in rotating semi-transparent volumes.
2 Volume rendering in computer graphics
A complete overview of volume rendering is out of scope for thispaper. The reader can refer to [Kaufman and Mueller 2005] for athorough review. In this section we give the main ideas and mile-stones, and cite the few papers concerned with perception, valida-tion or user studies.
1

To appear in the ACM APGV 2007 symposium proceedings
The idea to use transparencies to represent volumetric data hascome from initial works on clouds rendering in computer graph-ics ([Kajiya and Herzen 1984], [Max 1995]). It has been proposedto use the same raytracing techniques to produce images of a vol-umetric scalar field, considering the field as a density emitter withsingle level of scattering ([Sabella 1988]). Such representations aimat considering all the data for the display, contrary to what is donein surfacic methods such as isosurface (data thresholding) or cross-section (using cutting planes) renderings that require the viewer tomentally reconstruct the spatial structure of the field seen across asequence of images.
The basic idea in DVR techniques, whatever their technical imple-mentation might be, consists in an evaluation of the volume render-ing integral. The luminance corresponding to a ray ω cast from animage pixel and crossing the volume along a segment of length D(with parametrization x(λ) along the ray, λ is the distance to theviewpoint and belongs to [0:D]), is given by:
I =
∫ D
0
C(x(λ)).e−
∫ λ
0τ(x(λ′)dλ′)
dλ (1)
where C(x) represents the voxel color at x, and τ(x) its extinctioncoefficient. This equation is often evaluated in back-to-front orderbased on the following simplification:
I ≈n∑
i=0
Ci.
i−1∏j=0
(1− αj) (2)
where αi and Ci stand for the opacity and the color of the ith voxelin the ray. DVR requires the definition of a Transfer Function (TF)φ that maps the scalar s(x) associated to voxel x onto luminance land opacity α values:
φ : s→ (l, α) (3)
The Transfer Function critically determines how the data will beperceived in the final rendering. Its choice may be a very delicateproblem, and some efforts have been carried out to automatize thisprocess (for reference, see [Pfister et al. 2000]). Most often, piece-wise linear functions are chosen.
Maximum Intensity Projection (MIP) and X-Ray constitute alter-natives to optically-based DVR. In the former, only the maximumvoxel on each ray is projected on the screen, whereas the later cor-responds to an unordered sum of all voxel values along the ray. MIPis very useful for datasets with well-segmented volumes, as is thecase with CT or MR medical data (e.g., angiography). MIP and X-Ray tend to generate more contrasted images than DVR, improvingthe visibility of substructures; but, as they are order-independent,they provide no depth cues to the viewer. Contrary to DVR, imagescreated with X-Ray and MIP have fronto-planar symmetry, whichmeans that volumes viewed from front and back result in the sameimages.
In computer graphics, a lot of work has been devoted to de-velop existing techniques, either to reduce the computational costs([Lacroute and Levoy 1994]) or to better approximate the volumerendering integral and reduce image artifacts ([Engel et al. 2001]).Some works have focused on the improvement of depth perceptionin volume renderings. [Levoy 1988] implemented a volume render-ing pipeline including lighting calculations to strengthen the per-ception of surfaces within the volume. [Ebert and Rheingans 2000],in their volume illustration framework, introduced NPR techniquessuch as silhouette enhancement and tone shading in physics-basedvolume rendering; [Mora and Ebert 2004] suggest to improve MIP
and X-Ray using gradient signals inside the volume and stereo-images. Generally, improvements are measured on the basis ofthe quality of produced images, compared with traditional tech-niques. Amongst the few user studies led to validate specific vol-ume renderings, we can mention [Kersten et al. 2006], who useatmospheric perspective and stereo to improve X-Ray-like render-ing, and [Ropinski et al. 2006] with NPR-enhancement of MIP im-ages in angiography. Earlier, [Interrante et al. 1997] studied howtextured-transparent surfaces could convey depth information, butthis approach is limited to two wrapped surfaces.
3 The perception of transparency
Seeing dense and complex transparent media does not correspondto natural situations. We can sometimes look at solid surfacesthrough translucent media, such as a window or a water surface,or observe complex translucent objects such as clouds or crystals,but in this last case the layout of matter densities inside the volumedoes not seem obvious.
The perceptual aspects of transparency have been studied for a longtime, with particular focus on the required image conditions forproducing the illusion of transparent layers. [Metelli 1974] de-veloped a first model postulating that, for a disk overlapping twovertical strips with different reflectance a and b and producing in-tersecting areas of reflectance p and q, the level of transparency isgiven by α = p−q
a−b, with values close to 1 leading to full trans-
parency. Interestingly, Metelli’s model is firstly experimental andgenerative, as it corresponds to a disk (the episcotister) with a re-flectance t and an open fraction of α that would rotate quickly overthe two background strips (leading to p = αa + (1 − α)t andq = αb + (1 − α)t). It can be noted that Metelli’s model of per-ceived transparency corresponds to the widely used alpha-blendingequation encountered in computer graphics. Metelli’s model wasfurther developed in terms of luminance rather than reflectance by[Gerbino et al. 1990]. More recently, Singh and Anderson [2002;2004] developed an alternative achromatic model of transparencythat relies on Michelson contrasts of adjoining areas. Such variantsare required to account for the two aspects of a transparent layer: itsluminance and its transmittance, whereas Metelli’s model focusesonly on the second aspect. The conditions and ranges of achromatictransparencies have been assessed in many studies (for instance in[Kasrai and Kingdom 2001]), but to the best of our knowledge fewworks focused on the perceived layout of superimposed transparentmedia.
A fundamental condition for phenomenal transparency - namely theperception of the transparency of a surface - to occur consists in thepresence of contour junctions that correspond to luminance stepsbetween adjoining regions. The shape of these junctions (X-, T- orI-junctions) and the layout of luminances around determine if oneis likely to perceive transparency, the objects perceived as transpar-ent and thus the spatial layout of the objects ([Anderson 1997]).X-junctions, in which the borders of two objects cross in an ’X’fashion, are considered as the most informative regarding the per-ception of transparency, as they provide more information aboutcontrast variations between superimposed layers, but T-junctionscan also elicit a distinct illusion of transparency ([Masin 2006]).The aforementioned perceptual studies focus on achromatic trans-parency, i.e. regard objects with a luminance and a transmittancecomponents, but color components can be added in the equations,and conditions for chromatic and achromatic transparencies can bejointly studied, like in [Fulvio et al. 2006].
2

To appear in the ACM APGV 2007 symposium proceedings
(a) (b)
Figure 1: The two-cylinder stimulus of experiment 1. Figure (a) shows a 3/4 perspective view of the two filled cylinders at different depths,with the large one being empty at its central end. The six main stimuli subjects see during the experiment are illustrated on Figure (b), withthe large cylinder being either bright (top) or dark (bottom); for each brightness condition, the large cylinder stands in front (left column) orin the back (right column) of the small one, or the two cylinders are positioned at the same depth (central column).
4 Experiment 1: static perception in DVR
4.1 Experimental setup
In this first experiment, we question our ability to perceive the spa-tial layout of volumetric objects rendered through texture-basedDVR techniques. We conduct a three-alternative forced-choiceexperiment in which participants are asked to decide how semi-transparent cylinders are organized in depth. The stimulus we useis intentionally simple, in order to promote transparencies as theunique cue to depth.
4.1.1 Stimulus description
The scene stimulus (Figure 1) is composed of two cylinders withdifferent radii and same length, the larger one (LC) being twiceas thick as the smaller one (SC). In frontal view, the two cylin-ders lie horizontally, vertically centered; one stands on the leftside of the display, the other on the right side. They overlap inimage space in a small region that looks like a square-shape in-tersection area in the middle of the screen. Three dispositionsin depth are possible: large cylinder in front of the small cylin-der (depth condition Depthlarge), small cylinder in front of thelarge cylinder (Depthsmall), and the two cylinders at same depth(Depthintersect). In this last case, the small cylinder partially ex-tends within the large one.
The two cylinders are filled with a constant scalar value s, makingthem appear either bright (s = 1) or dark (s = 0.2). All voxels out-side the cylinders are set to s = 0, and the part of the LC intersectedby SC in frontal view is extruded in all cases, with s = 0, so thatthe intersection image always correspond to the same amount ofmatter accumulated in depth, whatever the geometric organizationof the cylinders might be. Preliminary tests pointed out the need toreinforce the volume appearance of the cylinders when filled withscalar value s = 0.2. To achieve this, we simulated pseudo-lightingin the volumes: the scalar value s(x) of a voxel x in a cylinder isgiven by: s(x) = s0+aR(x).L, where R(x) is the normalized di-rection of x from cylinder axis and L the direction of a pseudo-light(s0 = 0.2 or s0 = 1, a = 0.1, light coming from above). Valuesof s(x) are clamped to [0; 1].
There are thus six predefined position conditions for the cylinders:two for laterality (large on the left or on the right) and three for
ordering in depth, and two conditions of luminance: LC bright andSC dark, and the converse. Volume data were precomputed on aregular grid, and the required configuration was loaded on a 3Dtexture before each trial, and displayed in real-time using OpenGLshaders. For rendering, 100 planes regularly spaced out in the scenecube were blended in back to front order. The Transfer Function weuse is linear in luminance and constant in alpha: φ(s) → (s, 0.25)(see Section 2).
As mentioned in introduction, we choose to use orthographic pro-jection; this is important, as otherwise the cylinders would varyin apparent size in the different depth configurations, due to linearperspective. Besides, that permits to limit important contour infor-mation to a few junctions, which constitute fundamental conditionsfor phenomenal transparency (see Section 3), and to remove poten-tial 3D mental reconstructions interpolated from apparent sizes andintersections configurations. In our images, only X-junctions andluminance information of the intersection area provide relevant in-formation for decision. Also, in an attempt to limit the influenceof the contribution of the background color, we place a white-noiseimage at the rear; the noise is centered at a value corresponding tothe average of screen intensities within dark and bright cylinders(white-noise defined in range [0.2 : 1]).
4.1.2 Experimental procedure
Subjects are asked for each stimulus to decide how the cylinders areorganized in depth. Proposed answers are: ”Left cylinder in front”,”Two cylinders intersecting”, ”Right cylinder in front”.
During the experiment, subjects’ gaze fixations are monitored withan EyeLink R©II eyetracking system, that also ensures they are cor-rectly looking at the screen. They sit 0.8 m from a 19-inch LCDscreen (resolution 1280x1024), head reposing on a chin-rest. Stim-ulus image subtends approximately 17◦ of visual angle, and theintersection of the cylinders 2◦. For each participant, a calibrationof the eyetracker is performed, then the experiment can start.
An experimental session consists of 5 presentations of each of the12 possible configurations, the full sequence being randomized. Ineach of the 60 trials, a red cross first appears in the center of a blankscreen, during 1 to 3 seconds (random time). The subject is askedto fixate the cross, then the stimulus is presented for two seconds,followed by the answer screen; gaze positions on the screen aremonitored during stimulus display. The subject makes his choice
3

To appear in the ACM APGV 2007 symposium proceedings
by mouse-clicking on one of the three answers that are displayed onthe screen. Then, the next trial starts. At the end of the experiment,subject’s reactions and impressions about the task are recorded.
Finally, a small test is carried out, to determine if the difficulty toperform the task can be related to a non-discriminable difference ofcontrasts between the intersection areas in the different trial config-urations. For each of the two luminance conditions (LC dark or LCbright), the three images corresponding to the square intersectionarea in the separate depth conditions are extracted, and the sub-ject is asked to order these images from brighter- to darker-looking.As these images correspond only to the cylinders intersection area,and thus do not contain any transparency cues, subjects are not dis-turbed by the depth judgments they have made previously. All sub-jects answered immediately and correctly.
Stimulus presentations last 2 seconds each. A pilot study showedthat longer times (we tested 5 seconds duration) bias answers.From our observations, subjects elaborate more complex per- andbetween-image cognitive strategies. We thus reduced presentationtimes to 2 seconds, in an attempt to reinforce the part of percep-tion against conceptual reasoning in subjects’ decisions, as we fo-cus on the ability of the human visual system to perceive depth-organization of semi-transparent objects.
4.1.3 Participants
Ten subjects, ranging in age from 22 to 39, participated in the exper-iment. They were all naive as to the goals of the study, and only twoof them had experience with volume rendering. All had normal orcorrected-to-normal vision. Before they went through the true trialsequence, they read the experimental protocol, practiced on a fewtrials without head-tracking (trials order differed from the real ex-perience) and then were shown again top-front three-quarter viewsof some of the stimuli (Figure 1, (a)). This ensured they correctlyunderstood the task, and would keep in mind all the geometric andvolumetric properties of the stimuli.
4.2 Results
Overall and per-condition mean performances are computed foreach participant. Four of the 10 subjects passed a second exper-imental session with a different trials order after a few minutesbreak. In this case, we compute the average scores for the twosessions considered as one; we thus end with 10 result sheets.
Averages are illustrated in Figure 2. In this depth-ordering task,subject performances are low, with only 48,1% average correct an-swers, but clearly above chance level (p < 0.01). If we analyzethe results with respect to depth configuration, we notice levels of71% for case Depthlarge, 29.3% for Depthsmall and 44% forDepthintersect. These results are above chance-level when thelarge cylinder is presented in front of the small (p < 0.01) or whenthe two intersect, but not when the small lies in front of the scene.
A first explanation of these global results can be found in the meanreported answers (Figure 3). In the experiment, participants are bi-ased toward seeing the large cylinder in front of the display (48.4%of all answers) or the two cylinders intersecting (40.4%), and re-luctant to imagine the small cylinder lying closer to the eye (only11.2% of answers). We also investigated if the respective luminos-ity of the two cylinders have any influence on subjects’ choices, butperformances when the large cylinder appears dark or bright lookvery similar (Figure 4).
It could be argued at first sight that the globally low level of an-swers giving the small cylinder closer to the eye can be explainedby the fact that the large cylinder, occupying more screen space
Figure 2: Mean correct answers averaged over all participantsand detailed for the three depth configuration in experiment 1. Er-ror bars represent 95% confidence intervals. Participants overallperformances were low, only slightly above chance level. Morecorrect answers are recorded when the large cylinder lies in front,whereas guesses for the small cylinder in front do not differentiatefrom chance. Intersecting cylinders were detected with little morethan chance level.
Figure 3: Participants mean answers for the three depth configu-rations in experiment 1. Error bars represent 95% confidence in-terval. An important bias towards seeing the large cylinder in frontcan be noticed, whereas subjects are less keen on placing the smallcylinder closer to the eye.
Figure 4: In experiment 1, mean correct answers are coherentacross the two brightness conditions (large cylinder bright or dark).
4

To appear in the ACM APGV 2007 symposium proceedings
(twice as much as the small does), is likelier to attract viewer’sattention, which could force ”large in front” answers. However,a visual analysis of participants’ gaze trajectories during the trialsreveals that in average more saccades fall into the small cylinderthan into the large. Four types of ocular trajectories are mainly ob-served: fixations limited to the intersection area (EMin), center-to-small cylinder exploration (EMsmall), center-to-large cylinder ex-ploration (EMlarge) and between-cylinders exploration (EMboth).Examples of each category are illustrated on Figure 5. For all sub-jects but one, EMsmall dominate over EMlarge, with an approx-imate 3:1 average ratio (EMsmall = 15.1 and EM large = 5.2,with 60 trials per experiment). EMlarge and EMboth are glob-ally equal in size, but with noticeable between-subjects disparities.Gaze fixations limited to the central intersection area represent ap-proximately half of the trials; they generally correspond to a fixa-tion of either the lateral borders of the cylinder, either one of thetwo X-junctions present in the stimulus.
(a)
(b)
(c)
(d)
Figure 5: Examples of the main gaze profiles recorded across trialsin experiment 1. Subjects would focus on the intersection area (a),or visit the small (b) or the large (c) cylinder exclusively, or jumpfrom one to another (d).
4.3 Discussion
In this experiment, we try to evaluate our visual ability to perceivethe correct organization in depth of semi-transparent objects pre-sented statically and rendered through DVR. Such static presenta-tions are likely to occur for large datasets in scientific visualization,due to the computational costs associated with DVR. The stimuluswe use is very simple and results in images that clearly differentiatein regard to contrast, but overall performances prove to be rela-tively poor, although above chance-level. Results collected in thisexperiment show that our perception of the organization in depthof overlapping semi-transparent objects is weak, and influenced byfactors other than the sole combination of luminances.
Useful visual information is limited to contrast levels at objects bor-ders and intersections, mainly at the central ends of both cylin-ders. Orthographic projection eliminates all potential geometriccues. The stimulus was chosen as simple as possible to reduce theinfluence of complex cognitive strategies on the results. Scenesbuilt from more complex objects may reveal more borders, but therelative spatial continuity of the data often leads to a blurring ofthese information that weakens even more depth perception.
Thus, traditional static transparent renderings may not appear as
effective candidates to provide a clear understanding of the spa-tial structure of a volumetric dataset, even if the rendering equationtakes into account the depth ordering of the data, as DVR does.
Some factors might explain at least part of our results. Firstly, thestimulus we use is highly asymmetric, due to the difference in sizeof the two cylinders. We tried to compensate for this point by alter-natively presenting the large cylinder on the left and on the right ofthe display. On the other hand, this asymmetry is a desired artifact,as it provides viewers with two X-junctions, a very important cueto transparency (see Section 3). These X-junctions correspond inour case to the intersections between the vertical end of the largecylinder and the horizontal limit of the small cylinder. Subjectsmay be biased toward seeing the X-junctions as the unique trans-parency border, whereas the central end of the small cylinder isalso a transparency border itself. An overview of gaze trajectorieslimited to the intersection area make us think this is not the case,but we cannot be totally confident on this point. If subjects findit easier – consciously or not – to interpret the image as contain-ing only one transparent cylinder, the fact that at the X-junction thehorizontal border of the small cylinder is larger than the verticalborder of the large cylinder might facilitate the perception of LC asmore transparent than SC. Also, the large cylinder offers a widersurface through which more background details can be seen, whichmight strengthen this effect. And if only one cylinder is perceivedas transparent, then it will definitely appear in front of the other.
By reducing stimulus presentation time to only two seconds, wewished to limit as much as possible the influence of more cognitiveapproaches in the decision process. However, these cannot be to-tally rejected, as post-experiment introspective questions showed.For instance, many participants reported that one stimulus ofteninfluenced the decision they made for the following, which waspossible when consecutive stimuli were close enough (only depthcondition modified). On the other hand, all but two participantsalso stated that they were highly uncertain about the answers theygave, and that consecutive stimuli could as well disturb them aboutprevious answers they gave. The limited presentation time also re-stricts the possibility to build firmly anchored strategy based on pro-gressive classification of the luminance configurations. We cannotreject the assumption that short-term memory plays a role in thepresent experiment, but its effect is not expected to modify consis-tently the recorded performances.
Answer times were monitored during the experiment, but not takeninto account for the analysis. Subjects were however instructed toanswer as fast as possible, which was generally the case (averageanswer time: 1.9 seconds), but no mechanism was introduced toforce quick answers. However, mean reaction times show no linearcorrelation with overall performances (R2 = 10−4). We observeda limited bias during experimental sessions, with participants some-times positioning the mouse on the answer corresponding to ”smallin front”, and then switching to another choice.
5 Experiment 2: importance of dynamic in-formation in different DVR techniques
Experiment 1 focuses on the perception of depth order of semi-transparent objects displayed statically. In this second experiment,we look at how volume rendering techniques can convey informa-tion about the spatial layout of the supported data in a dynamiccontext. More precisely, we tested the influence of the TransferFunction that associates an opacity and a luminance to every voxelscalar value in order-dependent DVR (see Section 2), and com-pared performances to order-independent methods, namely X-Rayand MIP. We tried to measure the conditions for volume render-ing techniques to provide non-ambiguous depth cues in a dynamic
5
To appear in the ACM APGV 2007 symposium proceedings
(a) (b)
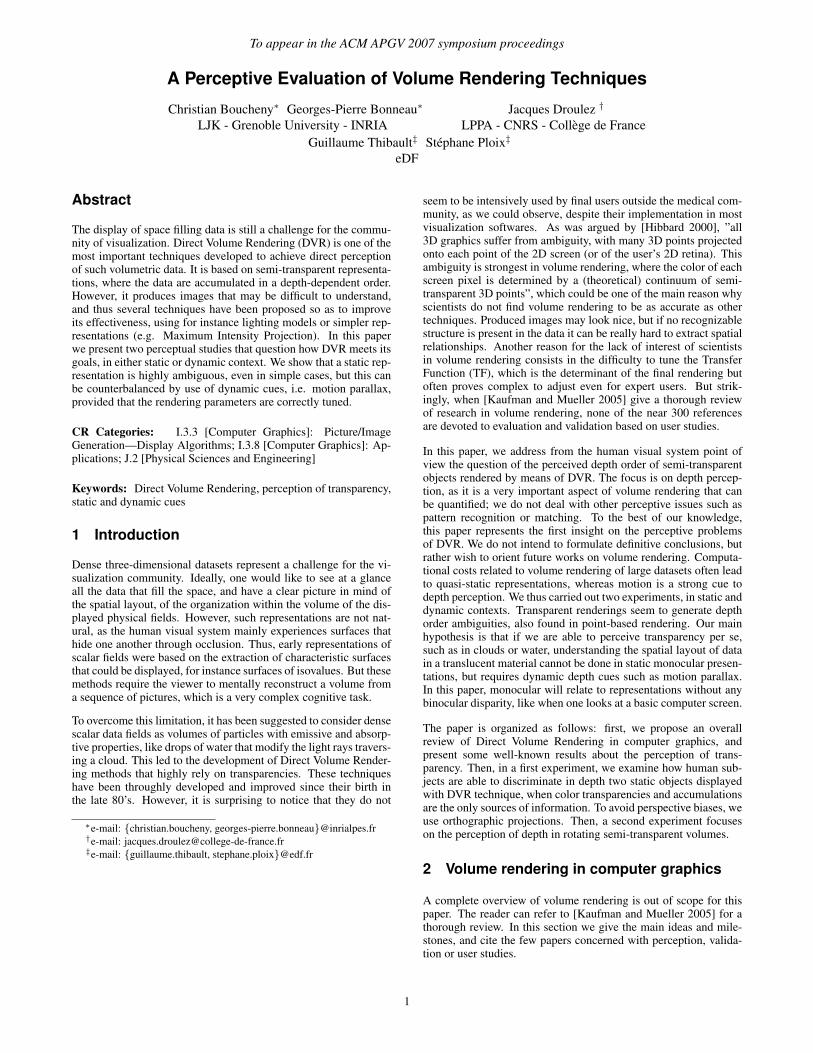
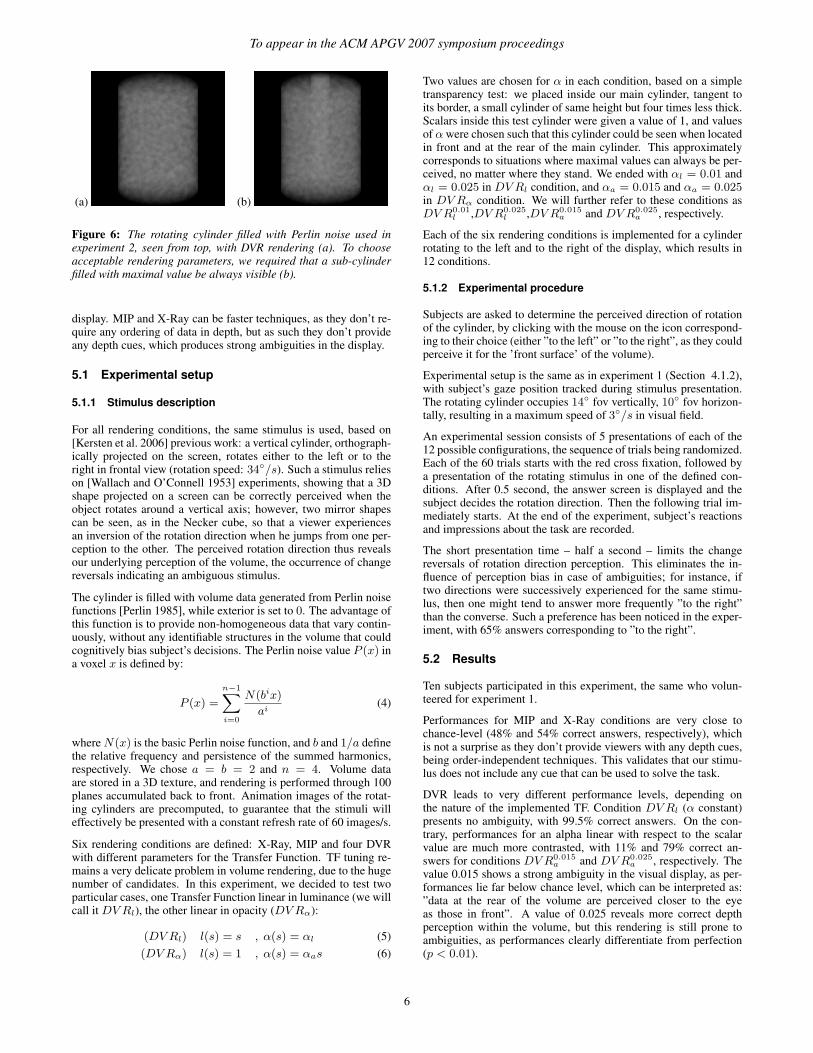
Figure 6: The rotating cylinder filled with Perlin noise used inexperiment 2, seen from top, with DVR rendering (a). To chooseacceptable rendering parameters, we required that a sub-cylinderfilled with maximal value be always visible (b).
display. MIP and X-Ray can be faster techniques, as they don’t re-quire any ordering of data in depth, but as such they don’t provideany depth cues, which produces strong ambiguities in the display.
5.1 Experimental setup
5.1.1 Stimulus description
For all rendering conditions, the same stimulus is used, based on[Kersten et al. 2006] previous work: a vertical cylinder, orthograph-ically projected on the screen, rotates either to the left or to theright in frontal view (rotation speed: 34◦/s). Such a stimulus relieson [Wallach and O’Connell 1953] experiments, showing that a 3Dshape projected on a screen can be correctly perceived when theobject rotates around a vertical axis; however, two mirror shapescan be seen, as in the Necker cube, so that a viewer experiencesan inversion of the rotation direction when he jumps from one per-ception to the other. The perceived rotation direction thus revealsour underlying perception of the volume, the occurrence of changereversals indicating an ambiguous stimulus.
The cylinder is filled with volume data generated from Perlin noisefunctions [Perlin 1985], while exterior is set to 0. The advantage ofthis function is to provide non-homogeneous data that vary contin-uously, without any identifiable structures in the volume that couldcognitively bias subject’s decisions. The Perlin noise value P (x) ina voxel x is defined by:
P (x) =
n−1∑i=0
N(bix)
ai(4)
where N(x) is the basic Perlin noise function, and b and 1/a definethe relative frequency and persistence of the summed harmonics,respectively. We chose a = b = 2 and n = 4. Volume dataare stored in a 3D texture, and rendering is performed through 100planes accumulated back to front. Animation images of the rotat-ing cylinders are precomputed, to guarantee that the stimuli willeffectively be presented with a constant refresh rate of 60 images/s.
Six rendering conditions are defined: X-Ray, MIP and four DVRwith different parameters for the Transfer Function. TF tuning re-mains a very delicate problem in volume rendering, due to the hugenumber of candidates. In this experiment, we decided to test twoparticular cases, one Transfer Function linear in luminance (we willcall it DV Rl), the other linear in opacity (DV Rα):
(DV Rl) l(s) = s , α(s) = αl (5)(DV Rα) l(s) = 1 , α(s) = αas (6)
Two values are chosen for α in each condition, based on a simpletransparency test: we placed inside our main cylinder, tangent toits border, a small cylinder of same height but four times less thick.Scalars inside this test cylinder were given a value of 1, and valuesof α were chosen such that this cylinder could be seen when locatedin front and at the rear of the main cylinder. This approximatelycorresponds to situations where maximal values can always be per-ceived, no matter where they stand. We ended with αl = 0.01 andαl = 0.025 in DV Rl condition, and αa = 0.015 and αa = 0.025in DV Rα condition. We will further refer to these conditions asDV R0.01
l ,DV R0.025l ,DV R0.015
a and DV R0.025a , respectively.
Each of the six rendering conditions is implemented for a cylinderrotating to the left and to the right of the display, which results in12 conditions.
5.1.2 Experimental procedure
Subjects are asked to determine the perceived direction of rotationof the cylinder, by clicking with the mouse on the icon correspond-ing to their choice (either ”to the left” or ”to the right”, as they couldperceive it for the ’front surface’ of the volume).
Experimental setup is the same as in experiment 1 (Section 4.1.2),with subject’s gaze position tracked during stimulus presentation.The rotating cylinder occupies 14◦ fov vertically, 10◦ fov horizon-tally, resulting in a maximum speed of 3◦/s in visual field.
An experimental session consists of 5 presentations of each of the12 possible configurations, the sequence of trials being randomized.Each of the 60 trials starts with the red cross fixation, followed bya presentation of the rotating stimulus in one of the defined con-ditions. After 0.5 second, the answer screen is displayed and thesubject decides the rotation direction. Then the following trial im-mediately starts. At the end of the experiment, subject’s reactionsand impressions about the task are recorded.
The short presentation time – half a second – limits the changereversals of rotation direction perception. This eliminates the in-fluence of perception bias in case of ambiguities; for instance, iftwo directions were successively experienced for the same stimu-lus, then one might tend to answer more frequently ”to the right”than the converse. Such a preference has been noticed in the exper-iment, with 65% answers corresponding to ”to the right”.
5.2 Results
Ten subjects participated in this experiment, the same who volun-teered for experiment 1.
Performances for MIP and X-Ray conditions are very close tochance-level (48% and 54% correct answers, respectively), whichis not a surprise as they don’t provide viewers with any depth cues,being order-independent techniques. This validates that our stimu-lus does not include any cue that can be used to solve the task.
DVR leads to very different performance levels, depending onthe nature of the implemented TF. Condition DV Rl (α constant)presents no ambiguity, with 99.5% correct answers. On the con-trary, performances for an alpha linear with respect to the scalarvalue are much more contrasted, with 11% and 79% correct an-swers for conditions DV R0.015
a and DV R0.025a , respectively. The
value 0.015 shows a strong ambiguity in the visual display, as per-formances lie far below chance level, which can be interpreted as:”data at the rear of the volume are perceived closer to the eyeas those in front”. A value of 0.025 reveals more correct depthperception within the volume, but this rendering is still prone toambiguities, as performances clearly differentiate from perfection(p < 0.01).
6

To appear in the ACM APGV 2007 symposium proceedings
(a) (b) (c) (d) (e) (f)
Figure 7: The 6 cylinder renderings implemented in experiment 2, in frontal view. (a) and (b) correspond to DVR with Transfer Functionlinear in luminance (conditions DV R0.01
l and DV R0.025l ), (c) and (d) to DVR with Transfer Function linear in opacity (conditions DV R0.015
a
and DV R0.025a ), (e) is MIP rendering and (f) X-Ray
Figure 8: Correct answers in experiment 2 for the different render-ing conditions, with pooling over both levels for DV RL. Only DVRwith luminance-based Transfer Function provide non-ambiguousdepth perception within the cylinder, whereas linear-alpha TF canbe highly unreliable.
5.3 Discussion
Results obtained in this experiment prove that in a dynamic contextDVR can lead to a strong perception of the organization in depth ofvolumetric data, but that this can be achieved only through a care-ful tuning of the Transfer Function (TF). Given the size of potentialTF space (for integer scalar values in range [0:255] mapped to 1-byte luminance and 1-byte alpha, there are already (256 ∗ 256)256
possibilities !), we restricted our analysis to as few as two TF sub-classes, those linear in luminance and constant in opacity, and theconverse. We have shown that the former produce reliable render-ings, whereas the latter are more prone to elicit ambiguous percep-tion of the spatial layout of the data. In general cases, the tuning ofthe TF is a very complex problem that is solved empirically, even ifsome attempts to propose automatic methods have been proposed(for reference, see [Pfister et al. 2000]). Today TF are getting moreand more complex; non-linearities are often introduced, as wellas multiple dimensions. Our results, obtained on the very simplecase of linear unidimensional functions, cannot be easily general-ized to all potential TF. However, we explicitly show that, even fororder-dependent volume rendering, a Transfer Function resulting ina correct discrimination of objects within a volume can disturb ourperception of the spatial layout of these objects.
The different techniques and sets of parameters produce renderingswith different contrast ratios, that were not equalized over the con-ditions (see Table 1). This could be a factor modifying the percep-tion of the cylinder motion. For instance, a moving target with verylow contrast is likely to embed areas seen as flat in luminance, and
fixations to such patterns would lead to a percept close to immobil-ity. In the present experiment, however, participants reported thatthey always perceived motion, and only few of them felt that speedmight have varied across trials, with slower rotations in conditionDV R0.015
a , which of course was not the case.
6 General discussion and conclusion
The display of space filling data remains a challenge, as it re-quires on the one hand to find renderings that does not hide muchof the data to the viewer, which is the main drawback of surfacictechniques, while revealing without ambiguities the organization indepth of these data. Various methods have been proposed, the majorclass being based on physical (optical) models. However complexand informative they might appear, these renderings implicitly as-sume that the human visual system produces accurate perceptionsof transparent volumes, whereas we seldom face such visual imagesin our daily life. Interestingly, we find the same physical roots inearly psychological works on the perception of transparency, thatwere based on the experimental framework of the episcotister. But,as mentioned by [Singh and Anderson 2002], the relationship be-tween perceptual theory and generative models is often left rathervague, and their experimental work emphasizes the deviation be-tween perceptual transparency and Metelli’s episcotister model. Ina similar way, we showed that using models of light propagation indense matter does not necessarily elicit a correct perception of thespatial layout of even simple structures through static presentations.Indeed, it appeared that the human visual system is not tuned to in-terpret correctly such representations, and may be strongly biased.
However, these order-dependent methods operate reasonably wellin a dynamic context, provided that Transfer Functions are care-fully chosen. This result underlies the need to focus on methodsthat generate fast renderings, with at least 15 frames per secondto preserve short range motion perception, thus providing view-ers with strong dynamic cues to depth. As the underlying algo-rithms are very costly, requiring intensive per-pixel computations,two approaches can be considered. At first, the development ofprogrammable graphic hardwares (generalized shaders) opens newprospects on the speed of computations. Several works have alreadybeen performed in this direction (e.g., [Roettger et al. 2003]). Onthe other hand, it is possible to reduce the amount of data displayedper image, considering that our attention has limited capacity. Forinstance, psychological experiments have shown that we are unableto track more than four objects at once, due to the limitation of ourattentional system ([Sears and Pylyshyn 2000]). The definition ofobjects in a volumetric data field can be quite difficult, and it shouldalso not reduce to classical isosurface computations. New methodshave to be found to facilitate the analysis of space filling data, andthis will be all the more crucial as scientific visualization will facelarger and larger amounts of data, due to reduced computationalcosts: perceptually enhanced visualizations will become one of themajor challenges of tomorrow’s engineering systems.
7

To appear in the ACM APGV 2007 symposium proceedings
Rendering MIP X-Ray DV R0.01l DV R0.025
l DV R0.015a DV R0.025
a
Mean pixel intensity (in [0:255]) 170 145 73 114 128 176Michelson contrast 0.174 0.235 0.219 0.155 0.1245 0.113
Table 1: Michelson contrasts for the different renderings implemented in experiment 2.
Future works will include further analysis of our perception ofdepth in transparent media. In particular, it would be interestingto understand more thoroughly the bias toward seeing large objectsin front of smaller ones that was observed in experiment 1. Also, wewill clarify the results of experiment 2, and analyze the reasons ofthe reversal or attenuation of depth perception for dynamic displayswith alpha-linear TF. As regards depth cues, it would be interest-ing to study more deeply the influence of perspective projection involume rendering, as we limited our work to the orthographic case.Finally, it is also worth mentioning the development of easier-to-use stereoscopic displays; further experiments exploring the powerof stereoscopy in DVR have to be carried out.
Acknowledgments
This work was funded by eDF and a CIFRE grant from ANRT. Theauthors thank the persons who kindly gave time to participate in theexperiments, and reviewers for useful comments.
References
ANDERSON, B. L. 1997. A theory of illusory lightness and trans-parency in monocular and binocular images: the role of contourjunctions. Perception 26, 4, 419–453.
EBERT, D., AND RHEINGANS, P. 2000. Volume illustration: Non-photorealistic rendering of volume models. In Proceedings Visu-alization 2000, T. Ertl, B. Hamann, and A. Varshney, Eds., IEEEComputer Society Technical Committee on Computer Graphics,195–202.
ENGEL, K., KRAUS, M., AND ERTL, T. 2001. High-quality pre-integrated volume rendering using hardware-accelerated pixelshading. In HWWS ’01: Proceedings of the ACM SIG-GRAPH/EUROGRAPHICS workshop on Graphics hardware,ACM Press, New York, NY, USA, 9–16.
FULVIO, J. M., SINGH, M., AND MALONEY, L. T. 2006. Com-bining achromatic and chromatic cues to transparency. J Vis 6,8, 760–776.
GERBINO, W., STULTIENS, C. I., TROOST, J. M., ANDDE WEERT, C. M. 1990. Transparent layer constancy. J ExpPsychol Hum Percept Perform 16, 1 (Feb), 3–20.
HIBBARD, B. 2000. Confessions of a visualization skeptic. Com-puter Graphics 34, 3 (Aug.), 11–13.
INTERRANTE, V., FUCHS, H., AND PIZER, S. M. 1997. Convey-ing the 3D shape of smoothly curving transparent surfaces viatexture. IEEE Trans. Vis. Comput. Graph 3, 2, 98–117.
KAJIYA, J. T., AND HERZEN, B. P. V. 1984. Ray tracing volumedensities. In SIGGRAPH ’84: Proceedings of the 11th annualconference on Computer graphics and interactive techniques,ACM Press, New York, NY, USA, 165–174.
KASRAI, R., AND KINGDOM, F. A. 2001. Precision, accuracy,and range of perceived achromatic transparency. J Opt Soc AmA Opt Image Sci Vis 18, 1 (Jan), 1–11.
KAUFMAN, A., AND MUELLER, K. 2005. The VisualizationHandbook. ch. 7, 127–174.
KERSTEN, M., STEWART, J., TROJE, N. F., AND ELLIS, R. E.2006. Enhancing depth perception in translucent volumes. IEEETrans. Vis. Comput. Graph 12, 5, 1117–1124.
LACROUTE, P., AND LEVOY, M. 1994. Fast volume renderingusing a shear-warp factorization of the viewing transformation.In SIGGRAPH, ACM, 451–458.
LEVOY, M. 1988. Display of surfaces from volume data. IEEEComputer Graphics and Applications 8, 3, 29–37.
MASIN, S. C. 2006. Test of models of achromatic transparency.Perception 35, 12, 1611–1624.
MAX, N. 1995. Optical models for direct volume rendering. IEEETransactions on Visualization and Computer Graphics 1, 2, 99–108.
METELLI, F. 1974. The perception of transparency. Sci Am 230, 4(Apr), 90–98.
MORA, B., AND EBERT, D. S. 2004. Instant volumetric un-derstanding with order-independent volume rendering. Comput.Graph. Forum 23, 3, 489–498.
PERLIN, K. 1985. An image synthesizer. Computer Graphics 19,3 (July), 287–296.
PFISTER, H., LORENSEN, B., SCHROEDER, W., BAJAJ, C., ANDKINDLMANN, G. 2000. The transfer function bake-off (panelsession). In VIS ’00: Proceedings of the conference on Visual-ization ’00, IEEE Computer Society Press, Los Alamitos, CA,USA, 523–526.
ROETTGER, S., GUTHE, S., WEISKOPF, D., ERTL, T., ANDSTRASSER, W., 2003. Smart hardware-accelerated volume ren-dering.
ROPINSKI, T., STEINICKE, F., AND HINRICHS, K. H. 2006.Visually supporting depth perception in angiography imaging.In Proceedings of the 6th International Symposium on SmartGraphics (SG06), Springer, Vancouver, 93–104.
SABELLA, P. 1988. A rendering algorithm for visualizing 3d scalarfields. In SIGGRAPH ’88: Proceedings of the 15th annual con-ference on Computer graphics and interactive techniques, ACMPress, New York, NY, USA, 51–58.
SEARS, C. R., AND PYLYSHYN, Z. W. 2000. Multiple objecttracking and attentional processing. Can J Exp Psychol 54, 1(Mar), 1–14.
SINGH, M., AND ANDERSON, B. L. 2002. Toward a perceptualtheory of transparency. Psychol Rev 109, 3 (Jul), 492–519.
SINGH, M. 2004. Lightness constancy through transparency: in-ternal consistency in layered surface representations. Vision Res44, 15, 1827–1842.
WALLACH, H., AND O’CONNELL, D. N. 1953. The kinetic deptheffect. J Exp Psychol 45, 4 (Apr), 205–217.
8