A Pavement Management Primer - Institute for … Pavement Management Primer Presented To: Graduate...
54
A Pavement Management Primer Presented To: Graduate Transportation Seminar (TRANS 691) Presented By: Katie Zimmerman, P.E., Applied Pavement Technology, Inc. (APTech) [email protected]
Transcript of A Pavement Management Primer - Institute for … Pavement Management Primer Presented To: Graduate...
A Pavement Management Primer
Presented To: Graduate Transportation Seminar (TRANS 691)Presented By: Katie Zimmerman, P.E., Applied Pavement Technology, Inc. (APTech)[email protected]

Learning Objectives
Describe the components of a pavement management systemDescribe the types of models that are used in a pavement management systemDescribe the use of pavement management techniques in a transportation agency
Approach
Introduce Pavement Management ConceptuallyIntroduce the Components of a Pavement Management SystemDiscuss Each Component in More DetailIllustrate the Ways Pavement Management Results Can Be Used

A Conceptual Approach to Pavement Management

Pavement Management Is…
…a management approach used by personnel to make cost-effective decisions about a road network.
AASHTO Pavement Management Guide (2001)

A Pavement Management System Is…
…a set of tools or methods that assist decision-makers in finding optimum strategies for providing, evaluating, and maintaining pavements in a serviceable condition over a period of time.
AASHTO Guide for Design of Pavement Structures (1993)

Use of Pavement Management
Identify and prioritize maintenance and rehabilitation needs
Select projects and treatments on an objective, rational basis
Assist agencies in determining cost-effective treatment strategies
Allocate funds so an agency can get the most “bang for the buck”Demonstrate impacts of alternate strategies

Managing Pavement Deterioration
PCI
AGE
Cost-effective time for minor rehabilitation
Costly treatments needed
Cost-effective time for preventive maintenance
Critical Condition

Pavement Management Components
Network Inventory Network Definition Condition Assessment
Database
Analysis Tools
System CustomizationModelsCostsTreatment Rules
Reports
Pavement Management System

Network InventoryType of Data to be Collected
Physical characteristicsConstruction and maintenance historyTraffic levelsClimate informationSoils information
Minimal Amount of Information Required
Surface typeLast construction datePhysical dimensions

Network Definition
Used to link network inventory information to a physical location in the fieldDetermine section boundaries by evaluating the road characteristics. Sections should be similar in terms of surface type, structure, and trafficIdentify beginning and end points and width

Network Definition – Local Agencies

Dynamic Segmentation and Concurrent Transformation
Traffic
50 100 400 200
Composite PCC
Structure
Composite PCC Composite
DS50
Composite
100
PCC
100
Composite
400
PCC
400
Composite
200
Composite
100
Composite400
Composite
CT
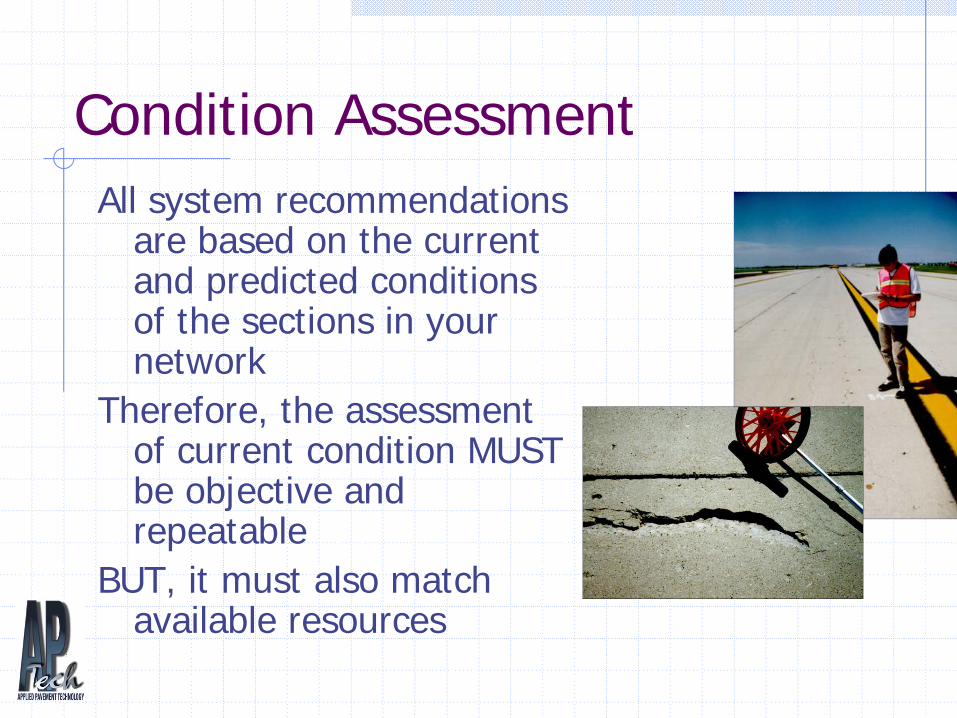
Condition AssessmentAll system recommendations
are based on the current and predicted conditions of the sections in your network
Therefore, the assessment of current condition MUST be objective and repeatable
BUT, it must also match available resources

Types of Pavement Condition Data Collected
Surface distress (cracking, surface deformRoughness (ride)FaultingRuttingSkid resistanceStructure (pavement strength and deflection)

Approaches to Collecting Pavement Condition Data
ManualSemi-automatedAutomated

Condition Indices
Individual IndicesRide IndexStructural IndexCracking Index
Composite Index40% Ride + 40% Structural + 20% CrackingΣ (Deduct points associated with a distress type, severity, and extent combinations)

Time (years)
Current Condition
Serviceable
Unserviceable
ThresholdValue
Now
Performance Curve
Remaining Service Life
Con
ditio
n In
dex
RSL Calculation

Cat
egor
y I:
O y
ears
Cat
egor
y II:
1-5
yea
rs
Cat
egor
y III
: 6-1
O y
ears
Cat
egor
y IV
: 11-
15ye
ars
Cat
egor
y V:
15+
year
s
% L
engt
h of
Net
wor
k
RSL Category
RSL Distribution
Database
Inventory DataCondition DataRecord Retrieval and Reporting

Capabilities Once The Database Is Established
Inventory reportsCondition ratings
By functional classificationBy surface type
Pavement distress data analysisOverall conditionRate of deteriorationCause of deterioration
Ranked lists of road needsWorst first or weighted rankings

Condition Summary on a Network Basis
Exsting Condition of Roadway System
0
10
20
30
40
50
60
70
80
Arterials Collectors Residential/LocalAccess
Road System
Perc
ent o
f Roa
d Sy
stem
Excellent Good Fair Poor

PCR Values for State Route 286 Eastbound
0
20
40
60
80
100
0 25 50 75 100 125 150 175
Reference Marker
PCR Trigger Value
Condition Summary - By Route
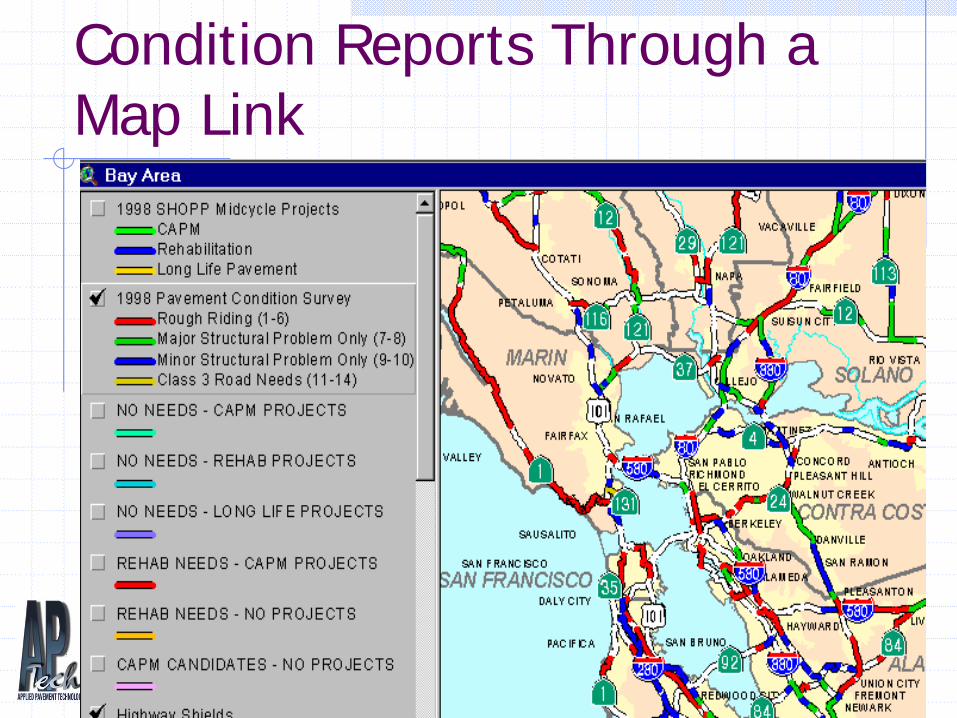
Condition Reports Through a Map Link
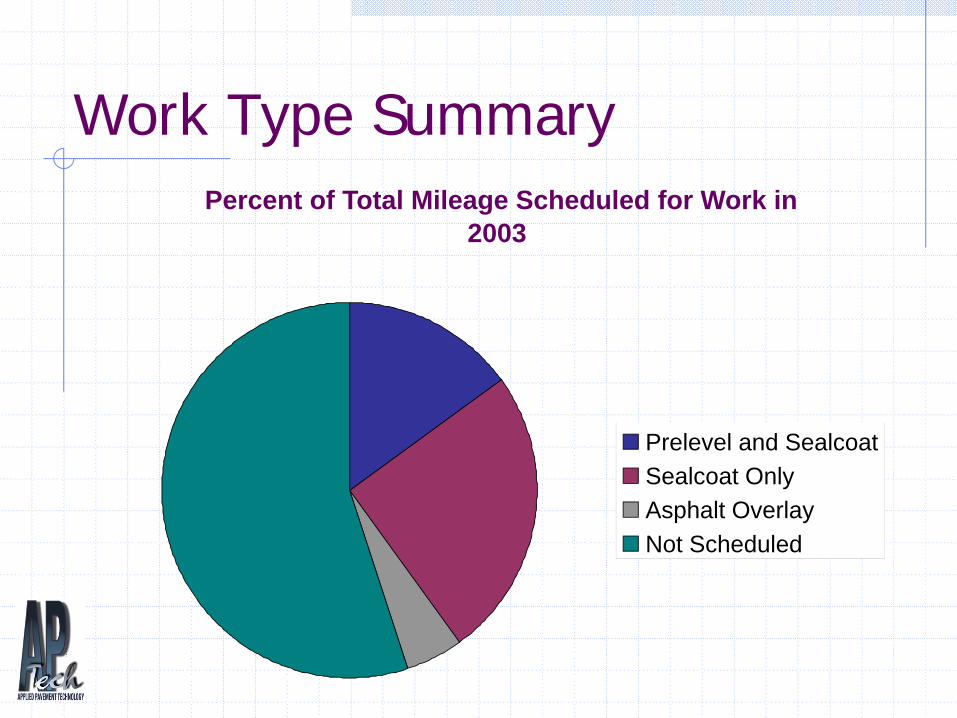
Work Type SummaryPercent of Total Mileage Scheduled for Work in
2003
Prelevel and SealcoatSealcoat OnlyAsphalt OverlayNot Scheduled

Building From a Database System
To develop multi-year programs,To compare different options,To predict future conditions,
You need a pavement management system that includes analysis models and multi-year programming capabilities
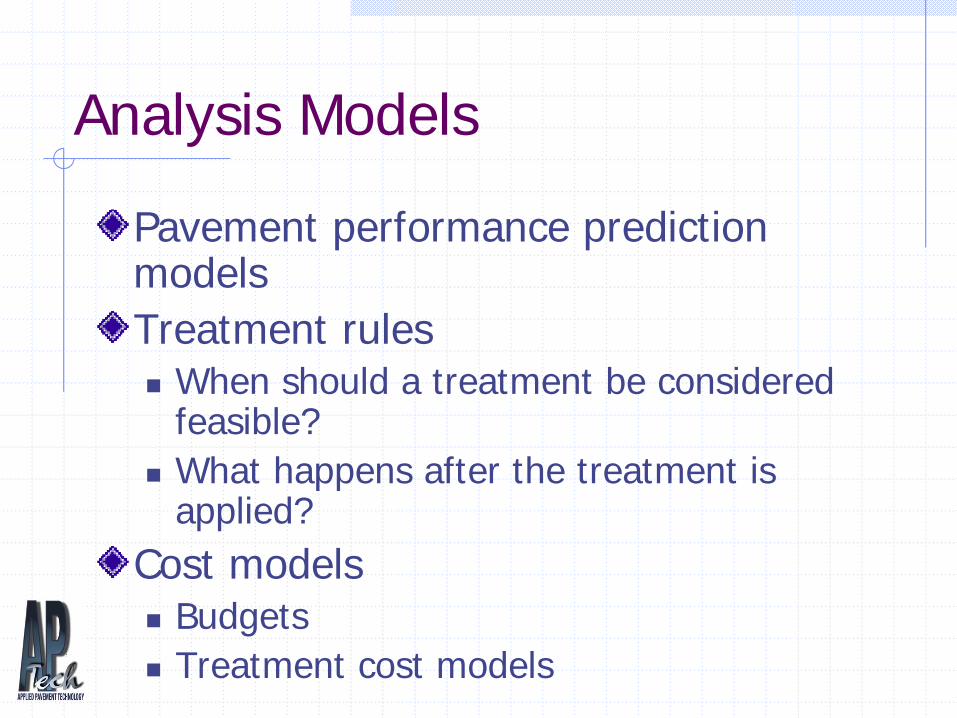
Analysis Models
Pavement performance prediction modelsTreatment rules
When should a treatment be considered feasible?What happens after the treatment is applied?
Cost modelsBudgetsTreatment cost models
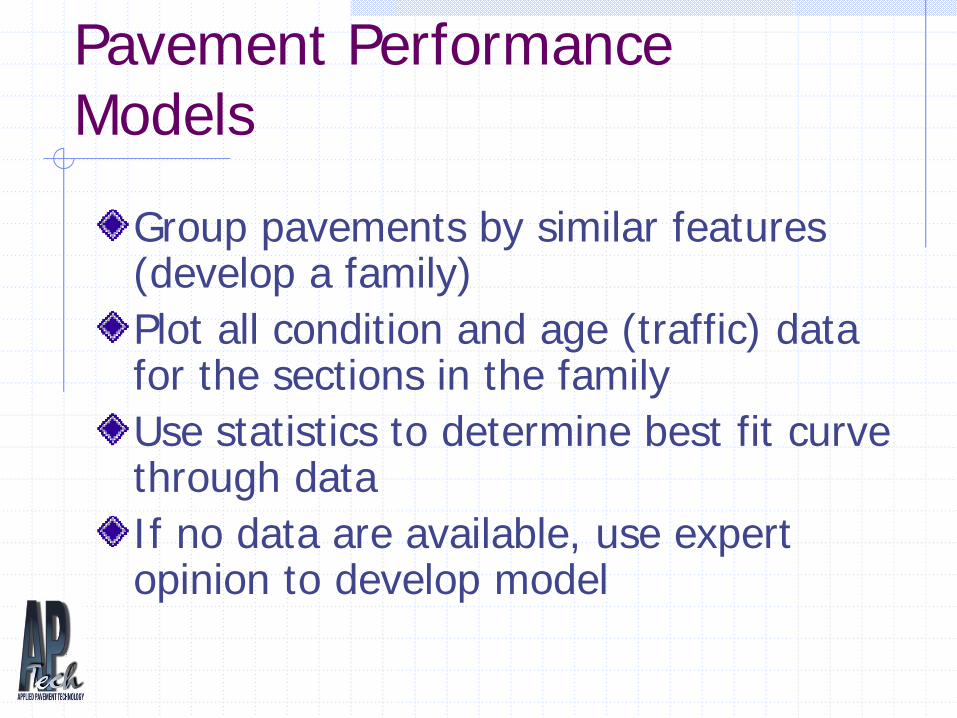
Pavement Performance Models
Group pavements by similar features (develop a family)Plot all condition and age (traffic) data for the sections in the familyUse statistics to determine best fit curve through dataIf no data are available, use expert opinion to develop model
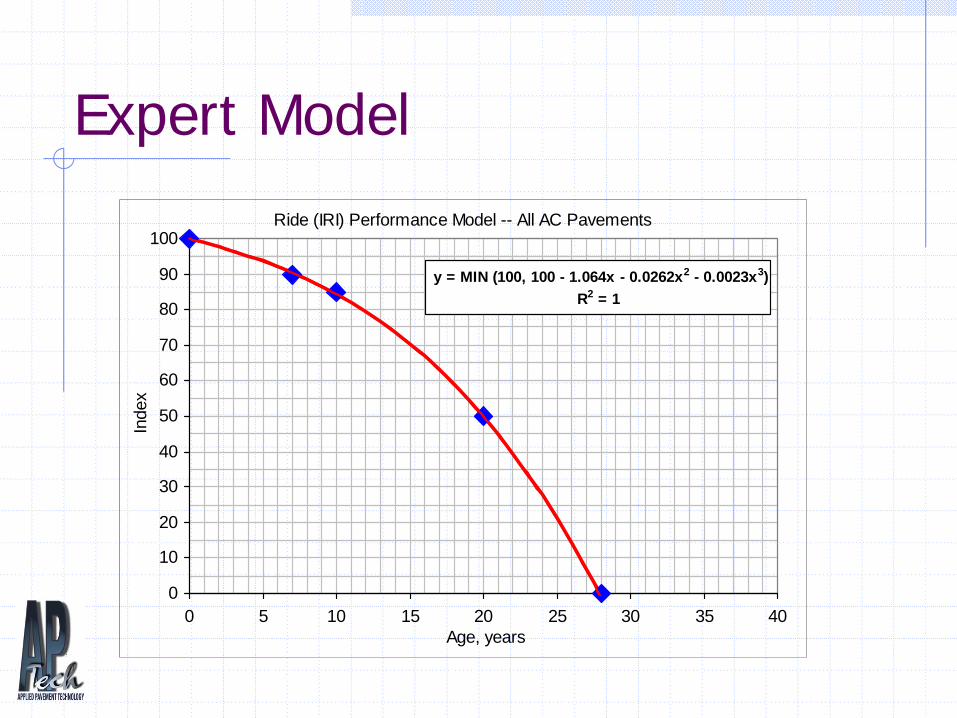
Expert Model
Ride (IRI) Performance Model -- All AC Pavements
y = MIN (100, 100 - 1.064x - 0.0262x2 - 0.0023x3)R2 = 1
0
10
20
30
40
50
60
70
80
90
100
0 5 10 15 20 25 30 35 40Age, years
Inde
x

Performance Model Using Actual Data
+++++
+
+
++
+
+
+
++++++++++++++++++++
++
+
+
+
++
++
+
+++++++++++++++++
+
++
+
+
+
+++++++++++
+++
+
+
+
+
+
++
+++++++++++++++++++++++++
+
+
++
+
+
+
++++++
++
++
+
+++
+++++++++++++++++++++++
+
+++
+++++++
++
++++
+
+++++++
+
+
+
++
++
++
++++++++++++++++
+
+
+
+
+
+++
++++++++++++
++
+
+
++
+
+++
+
+
++++++++++++++++++++
++
+++++
+++
+
+
++++++++
+
+
+
++
+
++
+
+
+++++++++
+
++
+
++++++++++++
+
+
+
++
+
++++++++++++++++
+++
+
++++
++++
+
+
+
+
++
+
+
+
+
+
++
++
+++
+
+
+
+
+
RIDE QUADRATIC
Jittered, Asp, Hi Vol, Flex, n= 384Age (Years)
Sco
re
0 5 10 15 20 25
020
4060
8010
0
Date of Analysis: Fri Sep 6 09:34:35 2002Family: Asp, Hi Vol, FlexIndex: RIDEYear(s): 2001Model Type: QUADRATICAnalysis Method: GQForced Endpoint: 25-------------------------------25TH PERCENTILECoefficient Estimates: Value Std. Error t value Pr(>|t|) age -2.64123 0.71100 -3.71483 0.00114I(age^2) -0.05435 0.02844 NA NAR-Squared = 0.059-------------------------------50TH PERCENTILECoefficient Estimates: Value Std. Error t value Pr(>|t|) age -1.10583 0.60599 -1.82484 0.08104I(age^2) -0.11577 0.02424 NA NAR-Squared = 0.238-------------------------------75TH PERCENTILECoefficient Estimates: Value Std. Error t value Pr(>|t|) age -0.08989 0.57306 -0.15686 0.87673I(age^2) -0.15640 0.02292 NA NAR-Squared = 0.35R-square of NaN may occur when too many data points are at themaximum value-------------------------------Goodness-of-fit for the EXPERT CURVE relative to the 50th percentile = 0.302 If less than 1, the 50th percentle fit is better

Treatment Rules: Type, Timing, Cost
Joint and crack sealing, surface seals
Excellent
FailedAge
Patching, thinner overlays
Reconstruction
Thicker overlays
Treatment Impact Rules
What happens to the condition of a section after the treatment has been applied?
Do conditions return to a perfect score? (Is the distress eliminated?)Does the severity of the distress change?Does it deteriorate the same way it did before the treatment was applied?

Modeling Treatment Impacts
Ride
Cracking
Before chip Chip Applied 2 Years Later
Example: A chip seal is applied to a pavement section
Cost Models
Treatment CostsBased on recent bid documentsMay vary based on certain factors (location, street network, and so on)
BudgetsFunds available for each analysis yearSome agencies have separate budgets for maintenance and rehabilitation activities

Analysis Approaches
Once needs are identified, there must be a way of prioritizing the list and determining which projects should be fundedThree approaches
RankingMulti-Year PrioritizationOptimization

Ranking
Most simplistic of the approachesTraditionally used in worst-first scenariosOften doesn’t use predictions of conditionIn most cases, alternate programs are not considered

Ranking Example
SectionCondition
Level Treatment Cost(mil)
67A 67 Minor 167B 82 PM 0.567C 52 Major 314A 71 Minor 214B 74 Minor 1.5
Univ1 85 PM 0.5

Results for $4 Million Budget
Section ID Ranking ConditionLevel
Treatment Cost($millions)
67C 1 52 Major 3
67A 2 67 Minor 1
14A 3 71 Minor 2
14B 4 74 Minor 1.5
67B 5 82 Prev. Maint. 0.5
Univ1 6 85 Prev. Maint. 0.5

Multi-Year Prioritization
Moderate level of sophisticationAllows multiple alternatives to be considered during a multi-year programFairly easy to explain and justify recommendationsResults in “near optimal” solutions

Treatment Options in MYP
Trigger Point for Treatment 1
Age or Traffic Loads
Pave
men
t C
ondi
tion
Inde
x
Trigger Point for Treatment 2
Treatment 2 in Year Y at $S Cost
Existing Performance Treatment 1 in Years Xand Z at $ Cost

Benefit/Effectiveness Calculation
Trigger Limit
Pave
men
t Con
ditio
n In
dex
Age or Traffic Loads
Existing Pavement Performance
Benefit
Predicted Pavement Performance

Optimization
Most sophisticated approachOnly used by a few statesTwo step process
First, set optimal program strategy recommendationsSecond, select projects to fit strategy

Markov Transition Probability Matrix
1 2 3 41 0.2 0.4 0.3 0.12 0.2 0.6 0.23 0.1 0.3 0.64 0.1 0.9
Future StateCurrent State

Example Network Performance
Projected Performance
00.10.20.30.40.50.60.70.80.9
0 2 4 6 8 10
Years
Prop
ortio
n of
Roa
ds
Undesirable Condition Desirable Condition
Steady State Begins

Linear Programming
Objective Functions
Constraints
FeasibleSolutions
Variable Number 2
Variable Number 1

Dynamic Programming
63
A
B
C2
Decision Flow
Solution Flow
End
4
55
3
2
6
Begin
(Costs)

The Use of Pavement Management Tools
Identify and prioritize maintenance and rehabilitation needsEvaluate the impact of various programs through a comparison of conditions, backlog, or another measureEstablishing pavement condition targetsSetting budget needs

NETW ORK LEVEL PERFORMANCE BASED ON 4 FUNDING SCENARIOSW ILLMAR DISTRICT PAVEMENT MANAGEMENT ALL SCENARIOS BASED ON USING PROGRAMMED PROJECTS OCTOBER, 1995
YEAR1996 1997 1998 1999 2000 2001 2002 2003 2004 2005
NO-REHAB 3.0 2.9 2.9 2.8 2.7 2.7 2.6 2.5 2.5 2.4AVERAGE $15 MILLION 3.0 3.0 3.0 3.0 3.1 3.1 3.1 3.1 3.1 3.1 PQI $18 MILLION 3.0 3.0 3.0 3.0 3.1 3.1 3.1 3.1 3.1 3.1
$21 MILLION 3.0 3.0 3.0 3.0 3.1 3.2 3.1 3.1 3.1 3.2 NO-REHAB 32 36 42 51 56 61 64 71 77 79% PQI < $15 MILLION 29 33 35 39 37 38 34 35 35 32 TRIGGER $18 MILLION 29 33 35 38 34 33 31 31 32 28
$21 MILLION 29 33 35 36 32 30 28 28 29 25
AVERAGE PQI
2.4
2.5
2.6
2.7
2.8
2.9
3.0
3.1
3.2
96 97 98 99 00 01 02 03 04 05YEAR
PQI
NO-REHAB$15 M$18 M$21 M
% BELOW TRIGGER VALUE
0
20
40
60
80
96 97 98 99 00 01 02 03 04 05YEAR
PER
CEN
T
NO-REHAB$15M$18M$21M
Impact Analysis

Goal Setting and Measuring
Percent of Network in 'Very Good' and 'Good Condition'
50%
60%
70%
80%
90%
100%
2002 2003 2004 2005 2006 2007 2008
Year
Perc
ent o
f Tot
al
Sect
ions
>70
Various Yearly Budgets Target of 93% > 70

Backlogged Needs
Total Backlog ($) vs. Time
0
10
20
30
40
50
60
70
2002 2003 2004 2005 2006 2007 2008
Year
Tota
l Bac
klog
, $ (m
illio
ns)
Various Yearly Budgets

Communicating Budget Needs

Establishing a Feedback Loop
A pavement management system must continue to reflect observed trends and agency practices
Update models over timeKeep database current
Tie in pavement management information to others in the agency
DesignMaintenance

Link to Asset Management
Expanding the management approach to include other physical assets
Trade-off decisionsAssist in calculating asset value
Benefits of Pavement Management
More efficient use of available resourcesAbility to justify funding needsMore accurate and accessible information on the pavement networkAbility to track pavement performanceAbility to show impacts on conditionImproved communication
AASHTO Pavement Management Guide (2001)