A Passive Temperature-Sensing Antenna Based on a …€¦ · · 2017-05-17integrated with Radio...
12
sensors Article A Passive Temperature-Sensing Antenna Based on a Bimetal Strip Coil Xianwei Shi, Fan Yang *, Shenheng Xu and Maokun Li State Key Laboratory on Microwave and Digital Communications, Tsinghua National Laboratory for Information Science and Technology, Department of Electronic Engineering, Tsinghua University, Beijing 100084, China; [email protected] (X.S.); [email protected] (S.X.); [email protected] (M.L.) * Correspondence: [email protected]; Tel.: +86-187-0147-2848 Academic Editor: Vittorio M. N. Passaro Received: 16 December 2016; Accepted: 20 March 2017; Published: 23 March 2017 Abstract: A passive temperature-sensing antenna is presented in this paper, which consists of a meandering dipole, a bimetal strip and a back cavity. The meandering dipole is divided into two parts: the lower feeding part and the upper radiating part, which maintain electric contact during operation. As a sensing component, a bimetal strip coil offers a twisting force to rotate the lower feeding part of the antenna when the temperature varies. As a result, the effective length of the dipole antenna changes, leading to a shift of the resonant frequency. Furthermore, a metal back cavity is added to increase the antenna’s quality factor Q, which results in a high-sensitivity design. An antenna prototype is designed, fabricated, and measured, which achieves a sensitivity larger than 4.00 MHz/ ◦ C in a temperature range from 30 ◦ C to 50 ◦ C and a read range longer than 4 m. Good agreement between the simulation and measurement results is obtained. Keywords: reconfigurable sensing antenna; temperature sensing; high sensitivity; bimetal strip 1. Introduction With the rapid development of Internet of Things (IoT), the concept of reconfigurable sensing antenna (RSA) has emerged in the last decade [1]. The RSAs are the devices that not only can receive and transmit electromagnetic wave just as general antennas do, but also can measure the surrounding environmental parameters like temperature, humidity and gas concentration. Moreover, different from many traditional sensors, the most significant feature of RSAs is passive, or no local power supply, which makes the large-scale deployment of the sensors much more energy-saving. In addition, integrated with Radio Frequency Identification (RFID) technology, the RSAs have the capability of wireless identification. RSAs can be used in many fields such as environmental monitoring, medical treatment, public health, animal husbandry, metal detection and logistics monitoring. Generally, there are two types of RSAs, with chip and without chip (chipless). In [2], various smart materials for chipless Radio Frequency (RF) sensing applications and their characteristics in the influence of various physical parameters have been analyzed. The operating principle of chipless RFID sensors along with various designs, experimental results, and potential applications is presented. In [3], a chipless sensor for water level detection is introduced. Meanwhile, the RSA integrated with RFID chip attracts more interest since the sensing information is connected with a 64-bit ID number. In [4,5], moisture RFID sensors are designed with carbon nanotube and sand/soil as the sensing components, respectively, meanwhile Received Signal Strength Indicator (RSSI) and Radar Cross-Section (RCS) are used as the measuring parameters accordingly. Papers [6–8] present designs of passive strain sensors, which take the read range and received power as the measuring variables to collect the information of strain force. Besides, there are passive sensors for displacement sensing [9], metal detection [10], capacitive sensing [11], discharge detection [12], Sensors 2017, 17, 665; doi:10.3390/s17040665 www.mdpi.com/journal/sensors
-
Upload
truongtuong -
Category
Documents
-
view
216 -
download
1
Transcript of A Passive Temperature-Sensing Antenna Based on a …€¦ · · 2017-05-17integrated with Radio...

sensors
Article
A Passive Temperature-Sensing Antenna Based ona Bimetal Strip Coil
Xianwei Shi, Fan Yang *, Shenheng Xu and Maokun Li
State Key Laboratory on Microwave and Digital Communications, Tsinghua National Laboratory forInformation Science and Technology, Department of Electronic Engineering, Tsinghua University, Beijing 100084,China; [email protected] (X.S.); [email protected] (S.X.); [email protected] (M.L.)* Correspondence: [email protected]; Tel.: +86-187-0147-2848
Academic Editor: Vittorio M. N. PassaroReceived: 16 December 2016; Accepted: 20 March 2017; Published: 23 March 2017
Abstract: A passive temperature-sensing antenna is presented in this paper, which consists ofa meandering dipole, a bimetal strip and a back cavity. The meandering dipole is divided intotwo parts: the lower feeding part and the upper radiating part, which maintain electric contactduring operation. As a sensing component, a bimetal strip coil offers a twisting force to rotate thelower feeding part of the antenna when the temperature varies. As a result, the effective length ofthe dipole antenna changes, leading to a shift of the resonant frequency. Furthermore, a metal backcavity is added to increase the antenna’s quality factor Q, which results in a high-sensitivity design.An antenna prototype is designed, fabricated, and measured, which achieves a sensitivity larger than4.00 MHz/◦C in a temperature range from 30 ◦C to 50 ◦C and a read range longer than 4 m. Goodagreement between the simulation and measurement results is obtained.
Keywords: reconfigurable sensing antenna; temperature sensing; high sensitivity; bimetal strip
1. Introduction
With the rapid development of Internet of Things (IoT), the concept of reconfigurable sensingantenna (RSA) has emerged in the last decade [1]. The RSAs are the devices that not only can receiveand transmit electromagnetic wave just as general antennas do, but also can measure the surroundingenvironmental parameters like temperature, humidity and gas concentration. Moreover, differentfrom many traditional sensors, the most significant feature of RSAs is passive, or no local powersupply, which makes the large-scale deployment of the sensors much more energy-saving. In addition,integrated with Radio Frequency Identification (RFID) technology, the RSAs have the capability ofwireless identification. RSAs can be used in many fields such as environmental monitoring, medicaltreatment, public health, animal husbandry, metal detection and logistics monitoring.
Generally, there are two types of RSAs, with chip and without chip (chipless). In [2], varioussmart materials for chipless Radio Frequency (RF) sensing applications and their characteristics inthe influence of various physical parameters have been analyzed. The operating principle of chiplessRFID sensors along with various designs, experimental results, and potential applications is presented.In [3], a chipless sensor for water level detection is introduced.
Meanwhile, the RSA integrated with RFID chip attracts more interest since the sensing informationis connected with a 64-bit ID number. In [4,5], moisture RFID sensors are designed with carbonnanotube and sand/soil as the sensing components, respectively, meanwhile Received Signal StrengthIndicator (RSSI) and Radar Cross-Section (RCS) are used as the measuring parameters accordingly.Papers [6–8] present designs of passive strain sensors, which take the read range and received poweras the measuring variables to collect the information of strain force. Besides, there are passive sensorsfor displacement sensing [9], metal detection [10], capacitive sensing [11], discharge detection [12],
Sensors 2017, 17, 665; doi:10.3390/s17040665 www.mdpi.com/journal/sensors

Sensors 2017, 17, 665 2 of 12
tilt sensing [13] and so on. It is worth mentioning that when designing RSAs, the frequencyreconfigurable antennas are preferred because compared to RSSI, read range, received power and RCS,the resonant frequency is independent of the location and the orientation of the transponder. In otherwords, the resonant frequency is more reliable than the other parameters.
In recent years, the frequency reconfigurable temperature-sensing antenna has gained growingattraction. In [14], authors present reconfigurable antennas integrated with thermal switches forwireless temperature monitoring. When the T-matched dipole is integrated with one thermal switch,the sensor can monitor whether the temperature is higher or lower than 40 ◦C; while integrated withtwo thermal switches, the sensor can monitor three statuses, i.e., below 40 ◦C, between 40 ◦C and50 ◦C or above 50 ◦C. However, the bandwidth of the dipole is relatively broad, which limits theaccuracy and results in difficulty for the reader to distinguish two adjacent temperature statuses.Another shortcoming is that the gain of the dipole is small and so the read range of the sensor cannotbe far enough. To narrow the bandwidth and improve the gain, papers [15,16] present the designand analysis of the patch-type reconfigurable sensing antennas with one and two thermal switchesrespectively for temperature monitoring. In particular, a dual-frequency antenna with two thermalswitches [16] offers the capability of self-reference.
The aforementioned sensors are for monitoring discrete or threshold temperature. In somescenarios, the continuous temperature sensors are needed. In the design of [17], the temperaturesensor can operate in temperature ranges between 20 ◦C and 370 ◦C with an average sensitivityof 307 KHz/◦C. In [18], authors present a dual-port temperature sensor tag for passive Ultra HighFrequency (UHF) RFID systems and give the detailed relationship between the frequency differenceand the ambient temperature from 20 ◦C to 60 ◦C. The thesis [19] gives detailed introduction of thedesign and analysis of reconfigurable sensing antennas for wireless sensing applications and makessome concluding suggestions that to obtain a high sensitivity, the sensing antennas should have highgain, large frequency shift and narrow bandwidth. In [20], a sensor which can monitor temperatureand pH is presented, but the read range of the High Frequency (HF) sensor is only 4 cm.
In order to improve the sensitivity of passive temperature-sensing antennas, this paper proposesthe RSA based on a bimetal strip coil. A rotatable dipole integrated with a RFID chip, a back cavityand a thermal bimetal strip coil are the main parts of the sensor. The initial prototype achieves thehighest sensitivity more than 4.00 MHz/◦C and a read range more than 4 m.
2. Design Methods
2.1. A Bimetal Strip Coil for Temperature Sensing
A bimetal strip is made of two different alloying strips attaching together. Since different alloyshave different thermal expansion coefficients, when the temperature varies, the bimetal strip bends.In this work, a P675R bimetal strip which consists of Mn72Cu18Ni10 on one side and Ni36Fe on theother side was used. After processed into a coil and fixed on one end as Figure 1 shows, the bimetalstrip coil rotates when the temperature changes. In this design, the bimetal strip coil can achieve arotation of 100◦ when the temperature changes from 20 ◦C to 50 ◦C without any friction, which isprovided by the manufacturer. The bimetal coil will be integrated with an antenna for wireless sensing.
Sensors 2017, 17, 665 2 of 12
received power as the measuring variables to collect the information of strain force. Besides, there are passive sensors for displacement sensing [9], metal detection [10], capacitive sensing [11], discharge detection [12], tilt sensing [13] and so on. It is worth mentioning that when designing RSAs, the frequency reconfigurable antennas are preferred because compared to RSSI, read range, received power and RCS, the resonant frequency is independent of the location and the orientation of the transponder. In other words, the resonant frequency is more reliable than the other parameters.
In recent years, the frequency reconfigurable temperature-sensing antenna has gained growing attraction. In [14], authors present reconfigurable antennas integrated with thermal switches for wireless temperature monitoring. When the T-matched dipole is integrated with one thermal switch, the sensor can monitor whether the temperature is higher or lower than 40 °C; while integrated with two thermal switches, the sensor can monitor three statuses, i.e., below 40 °C, between 40 °C and 50 °C or above 50 °C. However, the bandwidth of the dipole is relatively broad, which limits the accuracy and results in difficulty for the reader to distinguish two adjacent temperature statuses. Another shortcoming is that the gain of the dipole is small and so the read range of the sensor cannot be far enough. To narrow the bandwidth and improve the gain, papers [15,16] present the design and analysis of the patch-type reconfigurable sensing antennas with one and two thermal switches respectively for temperature monitoring. In particular, a dual-frequency antenna with two thermal switches [16] offers the capability of self-reference.
The aforementioned sensors are for monitoring discrete or threshold temperature. In some scenarios, the continuous temperature sensors are needed. In the design of [17], the temperature sensor can operate in temperature ranges between 20 °C and 370 °C with an average sensitivity of 307 KHz/°C. In [18], authors present a dual-port temperature sensor tag for passive Ultra High Frequency (UHF) RFID systems and give the detailed relationship between the frequency difference and the ambient temperature from 20 °C to 60 °C. The thesis [19] gives detailed introduction of the design and analysis of reconfigurable sensing antennas for wireless sensing applications and makes some concluding suggestions that to obtain a high sensitivity, the sensing antennas should have high gain, large frequency shift and narrow bandwidth. In [20], a sensor which can monitor temperature and pH is presented, but the read range of the High Frequency (HF) sensor is only 4 cm.
In order to improve the sensitivity of passive temperature-sensing antennas, this paper proposes the RSA based on a bimetal strip coil. A rotatable dipole integrated with a RFID chip, a back cavity and a thermal bimetal strip coil are the main parts of the sensor. The initial prototype achieves the highest sensitivity more than 4.00 MHz/°C and a read range more than 4 m.
2. Design Methods
2.1. A Bimetal Strip Coil for Temperature Sensing
A bimetal strip is made of two different alloying strips attaching together. Since different alloys have different thermal expansion coefficients, when the temperature varies, the bimetal strip bends. In this work, a P675R bimetal strip which consists of Mn72Cu18Ni10 on one side and Ni36Fe on the other side was used. After processed into a coil and fixed on one end as Figure 1 shows, the bimetal strip coil rotates when the temperature changes. In this design, the bimetal strip coil can achieve a rotation of 100° when the temperature changes from 20 °C to 50 °C without any friction, which is provided by the manufacturer. The bimetal coil will be integrated with an antenna for wireless sensing.
Figure 1. A prototype of a bimetal strip coil. Figure 1. A prototype of a bimetal strip coil.

Sensors 2017, 17, 665 3 of 12
2.2. A Dipole Antenna for Wireless Identification and Sensing
A dipole antenna includes two parts, the lower feeding part (Figure 2a) and the upper radiatingpart (Figure 2b). Both parts are designed on a RF-60A-0500 substrate with a dielectric constant (εr)of 6.15, a loss tangent of 0.0038, and a thickness of 1.27 mm. The lower part is a feeding loop with aRFID chip. The upper part consists of two curving U-shape arms which are symmetrical relative to thecenter point of the circular substrate. The curving U-shape arms could reduce the size of the dipoleand guarantee the electrical connection between the lower feeding part and the upper radiating partwhen relative rotation occurs between these two parts. Figure 2c depicts how these two parts worktogether. When assembling, the center of the lower part aligns with that of the upper part. In Figure 2the red is a Higgs-3 chip from Alien Technology, the orange is the metal layer, the grey is the substrate,and the tiny circular holes with diameters of D0 or D2 are used for fixation. The detailed dimensions ofthe dipole antenna are shown in Table 1.
Sensors 2017, 17, 665 3 of 12
2.2. A Dipole Antenna for Wireless Identification and Sensing
A dipole antenna includes two parts, the lower feeding part (Figure 2a) and the upper radiating part (Figure 2b). Both parts are designed on a RF-60A-0500 substrate with a dielectric constant (εr) of 6.15, a loss tangent of 0.0038, and a thickness of 1.27 mm. The lower part is a feeding loop with a RFID chip. The upper part consists of two curving U-shape arms which are symmetrical relative to the center point of the circular substrate. The curving U-shape arms could reduce the size of the dipole and guarantee the electrical connection between the lower feeding part and the upper radiating part when relative rotation occurs between these two parts. Figure 2c depicts how these two parts work together. When assembling, the center of the lower part aligns with that of the upper part. In Figure 2 the red is a Higgs-3 chip from Alien Technology, the orange is the metal layer, the grey is the substrate, and the tiny circular holes with diameters of D0 or D2 are used for fixation. The detailed dimensions of the dipole antenna are shown in Table 1.
(a) (b) (c)
Figure 2. Configuration of the dipole antenna: (a) Geometry of the lower feeding part; (b) Geometry of the upper radiating part; (c) Assembling configuration of the dipole consisting of two parts. The parameter θ2 is the rotating angle of the lower part relative to the initial position.
Table 1. Dimensions of the dipole antenna.
Parameter Value Parameter ValueL0 12.00 mm L9 3.00 mm L1 6.55 mm L10 3.00 mm L2 3.00 mm L11 4.00 mm L3 9.00 mm D0 2.00 mm L4 3.00 mm D1 20.50 mm L5 3.00 mm D2 3.00 mm L6 2.50 mm θ0 88.1° L7 63.00 mm θ1 135.0° L8 10.00 mm θ2 Variable
2.3. A Back Cavity for the Antenna Assembly
In order to load a bimetal strip coil into the dipole antenna, an aluminum back cavity is added between them as a supporting structure. The image theory [21] tells that if a horizontal dipole is located too close to a Perfect Electric Conductor (PEC) plane, the radiation will be cancelled by the opposite image of the dipole, so the distance between the bottom of the metal cavity and the dipole should not be too short. In this design, the distance is chosen to be 23 mm. Figure 3a,b gives the geometry of the back cavity and some important dimensions (in millimeters). The spindle can rotate relative to the cavity, the legs with screw are connected to the back test structure, and the fixation is used to fix the bimetal coil.
Figure 2. Configuration of the dipole antenna: (a) Geometry of the lower feeding part; (b) Geometryof the upper radiating part; (c) Assembling configuration of the dipole consisting of two parts.The parameter θ2 is the rotating angle of the lower part relative to the initial position.
Table 1. Dimensions of the dipole antenna.
Parameter Value Parameter Value
L0 12.00 mm L9 3.00 mmL1 6.55 mm L10 3.00 mmL2 3.00 mm L11 4.00 mmL3 9.00 mm D0 2.00 mmL4 3.00 mm D1 20.50 mmL5 3.00 mm D2 3.00 mmL6 2.50 mm θ0 88.1◦
L7 63.00 mm θ1 135.0◦
L8 10.00 mm θ2 Variable
2.3. A Back Cavity for the Antenna Assembly
In order to load a bimetal strip coil into the dipole antenna, an aluminum back cavity is addedbetween them as a supporting structure. The image theory [21] tells that if a horizontal dipole islocated too close to a Perfect Electric Conductor (PEC) plane, the radiation will be cancelled by theopposite image of the dipole, so the distance between the bottom of the metal cavity and the dipoleshould not be too short. In this design, the distance is chosen to be 23 mm. Figure 3a,b gives thegeometry of the back cavity and some important dimensions (in millimeters). The spindle can rotaterelative to the cavity, the legs with screw are connected to the back test structure, and the fixation isused to fix the bimetal coil.

Sensors 2017, 17, 665 4 of 12
Sensors 2017, 17, 665 4 of 12
(a) (b)
(c)
Figure 3. Geometry of the back cavity. (a) The 3-D view of the cavity; (b) The back view of the cavity; (c) The assembly schematic diagram of the proposed antenna. All dimensions are in millimeters.
Figure 3c describes the assembly procedure of the bimetal strip coil, the back cavity and the dipole antenna. One end of the bimetal strip coil is soldered to the fixation and the other is fixed to the spindle. The lower feeding part of the dipole is connected to the other end of the spindle with a screw, and the upper radiating part is fixed to the side wall of the cavity with screws. After assembly, the bimetal strip coil can rotate the lower part of the dipole with the support of the spindle when temperature varies.
3. Antenna Simulation Results
3.1. Radiation Performance of the Antenna
The antenna is simulated using ANSYS HFSS which is a commercial finite element method (FEM) solver for electromagnetic structure from ANSYS, Inc. (Canonsburg, PA, USA). Without loss of generality, the rotation angle is set to be 40°, and the other rotation angles will be discussed in following sections. The performance comparison between the dipole antenna alone and the dipole antenna with back cavity is given in Figure 4, the power reflection coefficient is defined as:
*
chip ant
chip ant
10
Z -ZPRC=20*log
Z +Z( ), (1)
Zchip is the input impedance of the Higgs-3 chip and Zant is the input impedance of the antenna. Figure 4b shows the impedance characteristics of the two antennas. The read range DRSA can be calculated according to the definition in [19]:
RSA
IC RSA
λ EIRPD =
4π P /G, (2)
λ is the operating wavelength. EIRP is the equivalent isotropic radiated power and its value is 3.28 W according to the regulation of European radio standards (EN radio standards). PIC, which is the minimum RF communication power of the Higgs-3 chip, equals to −14 dBm according to [22]. GRSA is the realized gain of the RSA antenna.
Figure 3. Geometry of the back cavity. (a) The 3-D view of the cavity; (b) The back view of the cavity;(c) The assembly schematic diagram of the proposed antenna. All dimensions are in millimeters.
Figure 3c describes the assembly procedure of the bimetal strip coil, the back cavity and the dipoleantenna. One end of the bimetal strip coil is soldered to the fixation and the other is fixed to the spindle.The lower feeding part of the dipole is connected to the other end of the spindle with a screw, and theupper radiating part is fixed to the side wall of the cavity with screws. After assembly, the bimetal stripcoil can rotate the lower part of the dipole with the support of the spindle when temperature varies.
3. Antenna Simulation Results
3.1. Radiation Performance of the Antenna
The antenna is simulated using ANSYS HFSS which is a commercial finite element method(FEM) solver for electromagnetic structure from ANSYS, Inc. (Canonsburg, PA, USA). Without lossof generality, the rotation angle is set to be 40◦, and the other rotation angles will be discussed infollowing sections. The performance comparison between the dipole antenna alone and the dipoleantenna with back cavity is given in Figure 4, the power reflection coefficient is defined as:
PRC = 20∗ log10(Zchip−Z∗ant
Zchip+Zant), (1)
Zchip is the input impedance of the Higgs-3 chip and Zant is the input impedance of the antenna.Figure 4b shows the impedance characteristics of the two antennas. The read range DRSA can becalculated according to the definition in [19]:
DRSA =λ
4π
√EIRP
PIC/GRSA, (2)
λ is the operating wavelength. EIRP is the equivalent isotropic radiated power and its value is 3.28 Waccording to the regulation of European radio standards (EN radio standards). PIC, which is theminimum RF communication power of the Higgs-3 chip, equals to −14 dBm according to [22]. GRSA isthe realized gain of the RSA antenna.

Sensors 2017, 17, 665 5 of 12Sensors 2017, 17, 665 5 of 12
800 850 900 950 1000
-100
0
100
200
300
400
Impe
dan
ce/O
hm
freq/MHz
Re(Z) without cavity Im(Z) without cavity Re(Z) with cavity Im(Z) with cavity
(a) (b)
800 850 900 950 1000
-15
-10
-5
0
PR
C/d
B
freq/MHz
without cavity with cavity
800 850 900 950 1000
0
2
4
6
8
10
Rea
dRan
ge/m
freq/MHz
without cavity with cavity
(c) (d)
Figure 4. (a) The dipole antenna without cavity (left) and the dipole antenna with cavity (right); (b) The impedance of the antenna without and with cavity when θ2 = 40°; (c) The power refection coefficient of antenna without and with cavity when θ2 = 40°; (d) The read range of the antenna without and with cavity when θ2 = 40°.
From Figure 4c, it can be seen that at 886 MHz, PRCs of the two antennas are below −10 dB, which demonstrates the effectiveness of the feeding structure. The 3 dB bandwidth of the antenna with cavity is about 8 MHz, which is obviously narrower than 29 MHz of the antenna without cavity. So, with the cavity, the antenna could obtain a higher quality factor Q. The same results can be found in Figure 4d. Figure 4d also shows that the read range of the antenna with cavity is over 10 m, while that of the antenna without cavity is only about 7.4 m, which is because the cavity enhances the unidirectional radiation due to the existence of the metal plane behind the dipole.
3.2. Frequency Shift of the Antenna with the Rotation of the Bimetal Coil
When the temperature changes, the bimetal coil rotates. Meanwhile, the lower feeding part of the antenna rotates because of the twisting force the bimetal coil offers. Therefore, the resonant frequency of the antenna shifts. The sensitivity of the RSA ST can be obtained from:
T A C
ΔfS =S =
ΔT
Δf Δθ*S = *
Δθ ΔT, (3)
The unit is MHz/°C. SA is the rate of change of the antenna’s resonant frequency with the rotation angle, and SC is the change rate of the bimetal coil’s rotation angle with temperature. In this work, the SC of the bimetal coils is 3.33°/°C. Figure 5a,b depicts the simulated results about the frequency-shifting characteristics of the antenna. The read range of the proposed antenna reaches 10 m for all rotation angles. When θ2 varies from 0° to 75°, the resonant frequency shifts from 856 MHz to 950 MHz. SA is calculated to be 1.19 MHz/°, and a nearly linear relationship between the rotating angle θ2 and the resonant frequency is achieved (Figure 5c). The theoretical sensitivity ST of the proposed antenna is about 3.97 MHz/°C according to the Equation (3). The red line in Figure 5c is the linear fitting line of the raw data.
Figure 4. (a) The dipole antenna without cavity (left) and the dipole antenna with cavity (right);(b) The impedance of the antenna without and with cavity when θ2 = 40◦; (c) The power refectioncoefficient of antenna without and with cavity when θ2 = 40◦; (d) The read range of the antenna withoutand with cavity when θ2 = 40◦.
From Figure 4c, it can be seen that at 886 MHz, PRCs of the two antennas are below−10 dB, whichdemonstrates the effectiveness of the feeding structure. The 3 dB bandwidth of the antenna with cavityis about 8 MHz, which is obviously narrower than 29 MHz of the antenna without cavity. So, with thecavity, the antenna could obtain a higher quality factor Q. The same results can be found in Figure 4d.Figure 4d also shows that the read range of the antenna with cavity is over 10 m, while that of theantenna without cavity is only about 7.4 m, which is because the cavity enhances the unidirectionalradiation due to the existence of the metal plane behind the dipole.
3.2. Frequency Shift of the Antenna with the Rotation of the Bimetal Coil
When the temperature changes, the bimetal coil rotates. Meanwhile, the lower feeding part of theantenna rotates because of the twisting force the bimetal coil offers. Therefore, the resonant frequencyof the antenna shifts. The sensitivity of the RSA ST can be obtained from:
ST= SA ∗ SC =∆f∆θ∗ ∆θ
∆T=
∆f∆T
, (3)
The unit is MHz/◦C. SA is the rate of change of the antenna’s resonant frequency with therotation angle, and SC is the change rate of the bimetal coil’s rotation angle with temperature. In thiswork, the SC of the bimetal coils is 3.33◦/◦C. Figure 5a,b depicts the simulated results about thefrequency-shifting characteristics of the antenna. The read range of the proposed antenna reaches 10 mfor all rotation angles. When θ2 varies from 0◦ to 75◦, the resonant frequency shifts from 856 MHz to950 MHz. SA is calculated to be 1.19 MHz/◦, and a nearly linear relationship between the rotatingangle θ2 and the resonant frequency is achieved (Figure 5c). The theoretical sensitivity ST of theproposed antenna is about 3.97 MHz/◦C according to the Equation (3). The red line in Figure 5c is thelinear fitting line of the raw data.
Sensors 2017, 17, 665 6 of 12Sensors 2017, 17, 665 6 of 12
800 850 900 950 1000-30
-25
-20
-15
-10
-5
0
PR
C/d
B
freq/GHz
2=75o
2=60o
2=45o
2=30o
2=15o
2=0o
800 850 900 950 1000
0
2
4
6
8
10
12
Read
Range
/m
freq/MHz
o
o
o
o
o
o
(a) (b)
0 10 20 30 40 50 60 70 80
860
880
900
920
940
960
raw data linear fit
R.fr
eq/
MH
z
degs
f=1.19+856.95
(c)
Figure 5. (a) The power reflection coefficient at different rotating angles; (b) Read range at different rotating angles; (c) The relation between the resonant frequency and the rotating angle θ2.
4. Antenna Prototypes and Measurement
4.1. Prototypes of the Temperature-Sensing Antenna
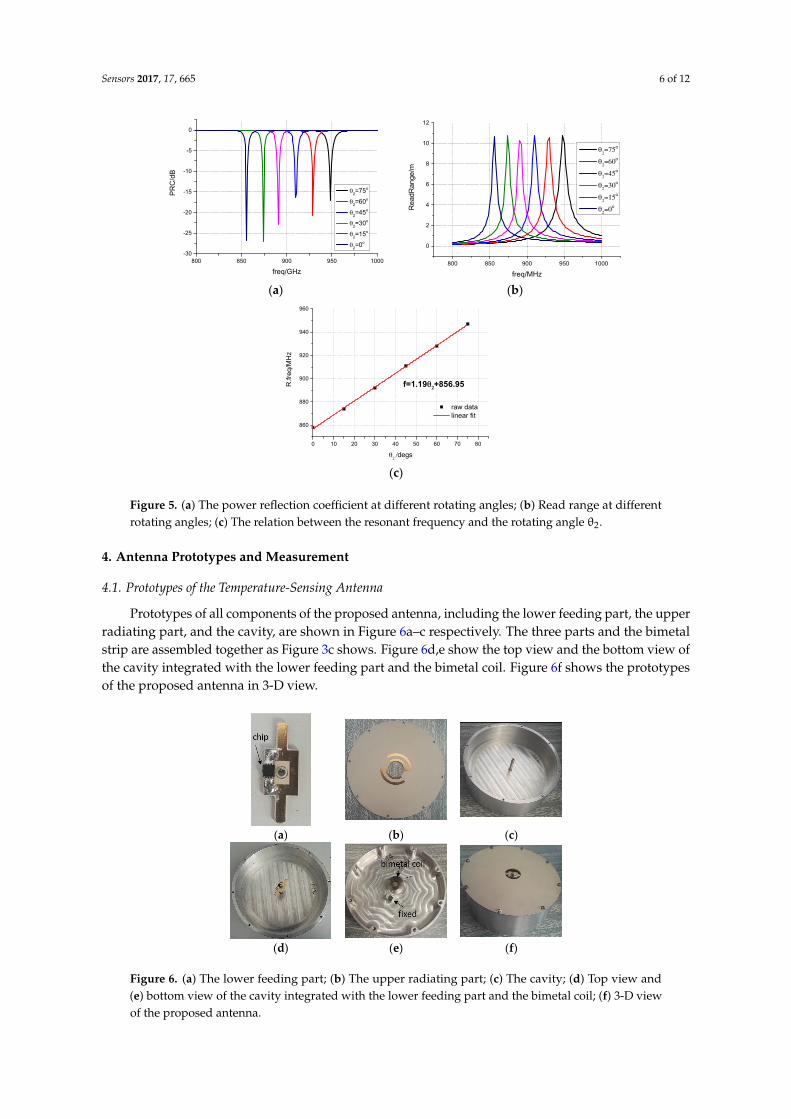
Prototypes of all components of the proposed antenna, including the lower feeding part, the upper radiating part, and the cavity, are shown in Figure 6a–c respectively. The three parts and the bimetal strip are assembled together as Figure 3c shows. Figure 6d,e show the top view and the bottom view of the cavity integrated with the lower feeding part and the bimetal coil. Figure 6f shows the prototypes of the proposed antenna in 3-D view.
(a) (b) (c)
(d) (e) (f)
Figure 6. (a) The lower feeding part; (b) The upper radiating part; (c) The cavity; (d) Top view and (e) bottom view of the cavity integrated with the lower feeding part and the bimetal coil; (f) 3-D view of the proposed antenna.
Figure 5. (a) The power reflection coefficient at different rotating angles; (b) Read range at differentrotating angles; (c) The relation between the resonant frequency and the rotating angle θ2.
4. Antenna Prototypes and Measurement
4.1. Prototypes of the Temperature-Sensing Antenna
Prototypes of all components of the proposed antenna, including the lower feeding part, the upperradiating part, and the cavity, are shown in Figure 6a–c respectively. The three parts and the bimetalstrip are assembled together as Figure 3c shows. Figure 6d,e show the top view and the bottom view ofthe cavity integrated with the lower feeding part and the bimetal coil. Figure 6f shows the prototypesof the proposed antenna in 3-D view.
Sensors 2017, 17, 665 6 of 12
800 850 900 950 1000-30
-25
-20
-15
-10
-5
0P
RC
/dB
freq/GHz
2=75o
2=60o
2=45o
2=30o
2=15o
2=0o
800 850 900 950 1000
0
2
4
6
8
10
12
Read
Range
/m
freq/MHz
o
o
o
o
o
o
(a) (b)
0 10 20 30 40 50 60 70 80
860
880
900
920
940
960
raw data linear fit
R.fr
eq/
MH
z
degs
f=1.19+856.95
(c)
Figure 5. (a) The power reflection coefficient at different rotating angles; (b) Read range at different rotating angles; (c) The relation between the resonant frequency and the rotating angle θ2.
4. Antenna Prototypes and Measurement
4.1. Prototypes of the Temperature-Sensing Antenna
Prototypes of all components of the proposed antenna, including the lower feeding part, the upper radiating part, and the cavity, are shown in Figure 6a–c respectively. The three parts and the bimetal strip are assembled together as Figure 3c shows. Figure 6d,e show the top view and the bottom view of the cavity integrated with the lower feeding part and the bimetal coil. Figure 6f shows the prototypes of the proposed antenna in 3-D view.
(a) (b) (c)
(d) (e) (f)
Figure 6. (a) The lower feeding part; (b) The upper radiating part; (c) The cavity; (d) Top view and (e) bottom view of the cavity integrated with the lower feeding part and the bimetal coil; (f) 3-D view of the proposed antenna.
Figure 6. (a) The lower feeding part; (b) The upper radiating part; (c) The cavity; (d) Top view and(e) bottom view of the cavity integrated with the lower feeding part and the bimetal coil; (f) 3-D viewof the proposed antenna.

Sensors 2017, 17, 665 7 of 12
4.2. Measurement of the Proposed Antenna
In order to measure the performance of the proposed antenna, a heating system is designedand fabricated. This heating system can achieve a heating range from 20 ◦C to 70 ◦C anda temperature resolution of 2 ◦C. The prototype of the heating system is shown in Figure 7.The temperature-controlling circuit is shown in Figure 7a. In Figure 7b, three resistors are usedfor heating and a PT100 temperature sensor is used for monitoring the temperature inside the cavity.The heating system connects to a touch screen so that the processes of heating and cooling couldbe displayed. In Figure 7c, the heating system is connected to the back of the cavity to provide acontrollable temperature environment for testing the sensing antenna.
Sensors 2017, 17, 665 7 of 12
4.2. Measurement of the Proposed Antenna
In order to measure the performance of the proposed antenna, a heating system is designed and fabricated. This heating system can achieve a heating range from 20 °C to 70 °C and a temperature resolution of 2 °C. The prototype of the heating system is shown in Figure 7. The temperature-controlling circuit is shown in Figure 7a. In Figure 7b, three resistors are used for heating and a PT100 temperature sensor is used for monitoring the temperature inside the cavity. The heating system connects to a touch screen so that the processes of heating and cooling could be displayed. In Figure 7c, the heating system is connected to the back of the cavity to provide a controllable temperature environment for testing the sensing antenna.
(a) (b) (c)
Figure 7. (a) Bottom view of the heating system; (b) Top view of the heating system; (c) Back view of the proposed antenna integrated with the heating system.
The reader used for the measurement of the proposed sensing antenna has to meet the following two functions: sweeping frequency with a certain range of transmitted power and obtaining the receiving signal strength. A Voyantic Tagformance lite UHF RFID measurement system, which has the above two functions, is used to measure the radiation performance of the proposed antenna. Figure 8a shows the photo of the Voyantic Tagformance lite. In an anechoic chamber (Figure 8b), the distance between the antenna under test and the reader is 0.5 m. Inside the reader there is an antenna with linear polarization for transmitting electromagnetic wave to, and receiving electromagnetic wave from, the sensing antenna. The heating process is controlled by the heating system, which is connected to a power source outside the chamber by an electric wire. In the test, the heating system is used to provide a specified temperature inside the antenna cavity. The UHF RFID measurement system is used to obtain the read range of the antenna [22].
The measurement process and the results are shown in Figure 9. First, the temperature step is set to be 5 °C and the temperature varies from 30 °C to 55 °C. In the heating process (Figure 9a) and the cooling process (Figure 9b), the measurement is carried on respectively. Next, the temperature step is set to be 3 °C and the measurement is repeated in the heating (Figure 9c) and cooling (Figure 9d) processes.
(a) (b)
Figure 8. (a) The Voyantic Tagformance lite UHF RFID measurement system; (b) Measurement setup in an anechoic chamber.
Figure 7. (a) Bottom view of the heating system; (b) Top view of the heating system; (c) Back view ofthe proposed antenna integrated with the heating system.
The reader used for the measurement of the proposed sensing antenna has to meet the followingtwo functions: sweeping frequency with a certain range of transmitted power and obtaining thereceiving signal strength. A Voyantic Tagformance lite UHF RFID measurement system, which has theabove two functions, is used to measure the radiation performance of the proposed antenna. Figure 8ashows the photo of the Voyantic Tagformance lite. In an anechoic chamber (Figure 8b), the distancebetween the antenna under test and the reader is 0.5 m. Inside the reader there is an antenna withlinear polarization for transmitting electromagnetic wave to, and receiving electromagnetic wave from,the sensing antenna. The heating process is controlled by the heating system, which is connected to apower source outside the chamber by an electric wire. In the test, the heating system is used to providea specified temperature inside the antenna cavity. The UHF RFID measurement system is used toobtain the read range of the antenna [22].
The measurement process and the results are shown in Figure 9. First, the temperature step is setto be 5 ◦C and the temperature varies from 30 ◦C to 55 ◦C. In the heating process (Figure 9a) and thecooling process (Figure 9b), the measurement is carried on respectively. Next, the temperature step is setto be 3 ◦C and the measurement is repeated in the heating (Figure 9c) and cooling (Figure 9d) processes.
Sensors 2017, 17, 665 7 of 12
4.2. Measurement of the Proposed Antenna
In order to measure the performance of the proposed antenna, a heating system is designed and fabricated. This heating system can achieve a heating range from 20 °C to 70 °C and a temperature resolution of 2 °C. The prototype of the heating system is shown in Figure 7. The temperature-controlling circuit is shown in Figure 7a. In Figure 7b, three resistors are used for heating and a PT100 temperature sensor is used for monitoring the temperature inside the cavity. The heating system connects to a touch screen so that the processes of heating and cooling could be displayed. In Figure 7c, the heating system is connected to the back of the cavity to provide a controllable temperature environment for testing the sensing antenna.
(a) (b) (c)
Figure 7. (a) Bottom view of the heating system; (b) Top view of the heating system; (c) Back view of the proposed antenna integrated with the heating system.
The reader used for the measurement of the proposed sensing antenna has to meet the following two functions: sweeping frequency with a certain range of transmitted power and obtaining the receiving signal strength. A Voyantic Tagformance lite UHF RFID measurement system, which has the above two functions, is used to measure the radiation performance of the proposed antenna. Figure 8a shows the photo of the Voyantic Tagformance lite. In an anechoic chamber (Figure 8b), the distance between the antenna under test and the reader is 0.5 m. Inside the reader there is an antenna with linear polarization for transmitting electromagnetic wave to, and receiving electromagnetic wave from, the sensing antenna. The heating process is controlled by the heating system, which is connected to a power source outside the chamber by an electric wire. In the test, the heating system is used to provide a specified temperature inside the antenna cavity. The UHF RFID measurement system is used to obtain the read range of the antenna [22].
The measurement process and the results are shown in Figure 9. First, the temperature step is set to be 5 °C and the temperature varies from 30 °C to 55 °C. In the heating process (Figure 9a) and the cooling process (Figure 9b), the measurement is carried on respectively. Next, the temperature step is set to be 3 °C and the measurement is repeated in the heating (Figure 9c) and cooling (Figure 9d) processes.
(a) (b)
Figure 8. (a) The Voyantic Tagformance lite UHF RFID measurement system; (b) Measurement setup in an anechoic chamber. Figure 8. (a) The Voyantic Tagformance lite UHF RFID measurement system; (b) Measurement setupin an anechoic chamber.

Sensors 2017, 17, 665 8 of 12Sensors 2017, 17, 665 8 of 12
800 850 900 950 10000
1
2
3
4
5
6R
ead
Ran
ge/
m
freq/MHz
30 ºC 35 ºC 40 ºC 45 ºC 50 ºC 55 ºC
800 850 900 950 1000
0
1
2
3
4
5
6
7
Rea
dR
ange
/m
freq/MHz
55 ºC 50 ºC 45 ºC 40 ºC 35 ºC 30 ºC
(a) (b)
800 850 900 950 10000
1
2
3
4
5
6
7
Rea
dR
ange
/m
freq/MHz
27 ºC 31 ºC 35 ºC 39 ºC 42 ºC 45 ºC 48 ºC 52 ºC 55 ºC
800 850 900 950 1000
0
1
2
3
4
5
6
7
Re
adR
ang
e/m
freq/MHz
55 ºC 52 ºC 48 ºC 45 ºC 42 ºC 39 ºC 36 ºC 32 ºC 29 ºC
(c) (d)
Figure 9. Measured read ranges in (a) heating process with temperature step 5 °C; (b) cooling process with temperature step 5 °C; (c) heating process with temperature step 3 °C; (d) cooling process with temperature step 3 °C.
It can be seen that when the temperature step is 5 °C, an average of 23 MHz frequency shift between two adjacent resonant frequencies is obtained in both the heating process and the cooling process. When the temperature step is 3 °C, the average frequency shift between two adjacent resonant frequencies decreases to 13 MHz, but it is still enough to distinguish the adjacent resonant frequencies. In both temperature steps, the read range is more than 4.5 m.
However, when the temperature step is 3 °C, in the heating process, 27 °C curve overlaps 31 °C curve, and in the cooling process, 55 °C curve overlaps 52 °C curve. The reason is that when the temperature varies 3 °C, the twisting force resulting from the deformation of the bimetal coil is not enough to prevail over the starting friction. However, once the friction is overcome in the same process, the frequency shift is sufficient to make the resonant frequencies distinguishable.
Figure 10a,c shows the mean values of the measured resonant frequency at different temperatures. When the temperature step is 5 °C, the average sensitivity ST5 is about 4.13 MHz/°C and when the temperature step is 2 °C, the average sensitivity ST2 equals to 4.31 MHz/°C. ST5 and ST2 are close to the theoretical sensitivity ST 3.97 MHz/°C. It is noted that when the temperature is over 50 °C, which is beyond the operation temperature range of the bimetal coil, the measured resonant frequencies increase at a faster rate. Figure 10a,b also shows the linear fitting curves of the measured data. It can be seen that the temperature and the resonant frequency achieve appropriately linear relation. In Figure 10c, the hysteresis behavior of the proposed sensing antenna in heating and cooling processes are presented. The hysteresis Ht at temperature t is calculated by:
t
T2
| |=
c htt
f fHS
, (4)
Figure 9. Measured read ranges in (a) heating process with temperature step 5 ◦C; (b) cooling processwith temperature step 5 ◦C; (c) heating process with temperature step 3 ◦C; (d) cooling process withtemperature step 3 ◦C.
It can be seen that when the temperature step is 5 ◦C, an average of 23 MHz frequency shiftbetween two adjacent resonant frequencies is obtained in both the heating process and the coolingprocess. When the temperature step is 3 ◦C, the average frequency shift between two adjacent resonantfrequencies decreases to 13 MHz, but it is still enough to distinguish the adjacent resonant frequencies.In both temperature steps, the read range is more than 4.5 m.
However, when the temperature step is 3 ◦C, in the heating process, 27 ◦C curve overlaps 31 ◦Ccurve, and in the cooling process, 55 ◦C curve overlaps 52 ◦C curve. The reason is that when thetemperature varies 3 ◦C, the twisting force resulting from the deformation of the bimetal coil is notenough to prevail over the starting friction. However, once the friction is overcome in the same process,the frequency shift is sufficient to make the resonant frequencies distinguishable.
Figure 10a,c shows the mean values of the measured resonant frequency at different temperatures.When the temperature step is 5 ◦C, the average sensitivity ST5 is about 4.13 MHz/◦C and when thetemperature step is 2 ◦C, the average sensitivity ST2 equals to 4.31 MHz/◦C. ST5 and ST2 are close to thetheoretical sensitivity ST 3.97 MHz/◦C. It is noted that when the temperature is over 50 ◦C, which isbeyond the operation temperature range of the bimetal coil, the measured resonant frequencies increaseat a faster rate. Figure 10a,b also shows the linear fitting curves of the measured data. It can be seenthat the temperature and the resonant frequency achieve appropriately linear relation. In Figure 10c,the hysteresis behavior of the proposed sensing antenna in heating and cooling processes are presented.The hysteresis Ht at temperature t is calculated by:
Ht =| fct − fht|
ST2(4)

Sensors 2017, 17, 665 9 of 12
where fct and fht are the resonant frequencies of the sensing antenna in cooling and heating processes,respectively, when the temperature is t. The hysteresis of the sensing antenna is evaluated in theanechoic chamber, where the temperature is increased from 29 ◦C to 55 ◦C, and then decreased to29 ◦C. The sensing antenna exhibits an average hysteresis of 3 ◦C with a maximum hysteresis of 5 ◦C at43 ◦C. The hysteresis mainly results from the friction between the lower matching part and the upperradiating part. This can be improved by using a bimetal coil with a stronger torque or designing anon-contact coupling structure between the matching part and the radiating part.
Sensors 2017, 17, 665 9 of 12
where fct and fht are the resonant frequencies of the sensing antenna in cooling and heating processes, respectively, when the temperature is t. The hysteresis of the sensing antenna is evaluated in the anechoic chamber, where the temperature is increased from 29 °C to 55 °C, and then decreased to 29 °C. The sensing antenna exhibits an average hysteresis of 3 °C with a maximum hysteresis of 5 °C at 43 °C. The hysteresis mainly results from the friction between the lower matching part and the upper radiating part. This can be improved by using a bimetal coil with a stronger torque or designing a non-contact coupling structure between the matching part and the radiating part.
30 35 40 45 50 55
850
900
950
1000
R.fr
eq/M
Hz
Temp/oC
Mean values of raw data in both process
Linear fitting line
f=4.13T+722.98
(a)
25 30 35 40 45 50 55
850
900
950
1000
R.fr
eq/
MH
z
Temp/oC
Mean values of raw data in both process
Linear fitting line
f=4.31T+715.89
(b)
25 30 35 40 45 50800
820
840
860
880
900
920
940
960
R.fr
eq/M
Hz
Temp/oC
Warming Process Cooling Process
0
2
4
6
8
10
Hysteresis
Hys
tere
sis/
oC
(c)
Figure 10. The frequency shift curves and the linear fitting curves when (a) the temperature step is 5 °C; (b) the temperature step is 2 °C; (c) Hysteresis characteristics of the sensing antenna.
Figure 10. The frequency shift curves and the linear fitting curves when (a) the temperature step is5 ◦C; (b) the temperature step is 2 ◦C; (c) Hysteresis characteristics of the sensing antenna.

Sensors 2017, 17, 665 10 of 12
4.3. Comparison between Simulation Results and Measurement Results
Using a standard protractor with accuracy of 1◦, the rotating angles at different temperaturescan be measured. The relationship between them is shown in Table 2. With the correspondence,the simulated results at the corresponding temperature are obtained. The comparison between thesimulated results and the measured results when the temperature step is 5 ◦C is shown in Figure 11.It can be seen from Figure 11a,b that in both the simulation and the measurement results, whenthe temperature rises, the resonant frequency of the sensing antenna shifts upward and vice versa.Moreover, the temperature and the resonant frequency show an approximately linear relationshipwith the temperature from 30 ◦C to 50 ◦C in the simulation results and the measurement results.
Table 2. The rotating angle θ2 at different temperatures.
Temperature (◦C) θ2 (◦)
30 035 1140 2845 4550 66
Sensors 2017, 17, 665 10 of 12
4.3. Comparison between Simulation Results and Measurement Results
Using a standard protractor with accuracy of 1°, the rotating angles at different temperatures can be measured. The relationship between them is shown in Table 2. With the correspondence, the simulated results at the corresponding temperature are obtained. The comparison between the simulated results and the measured results when the temperature step is 5 °C is shown in Figure 11. It can be seen from Figure 11a,b that in both the simulation and the measurement results, when the temperature rises, the resonant frequency of the sensing antenna shifts upward and vice versa. Moreover, the temperature and the resonant frequency show an approximately linear relationship with the temperature from 30 °C to 50 °C in the simulation results and the measurement results.
Table 2. The rotating angle θ2 at different temperatures.
Temperature (°C) θ2 (°)30 0 35 11 40 28 45 45 50 66
There are two major discrepancies between the simulation and the measurement results, namely, the resonant frequency shift and the difference of read range. The measurement resonant frequency slightly shifts downward (0.9%) compared with the simulation results, which results from the fabrication error.
The measured read range at each temperature is about 6 m shorter than the simulated ones, which is due to the imperfect metal contact between the two layers. The loss due to the imperfect metal contact can be modeled by a pair of cascaded resistors between the two layers. Figure 11c shows the read range when the cascaded resistor varies from 0 ohm to 1.2 ohm at 45 °C. When the resistor value is set to 0.8 ohm, the read range at 910 MHz is approximately equal to the measured one. Figure 11d gives the simulated read range when a pair of 0.8 ohm resistors are in series connection with the two metal layers. The measured read range agrees well with the simulated read range.
800 850 900 950 1000
0
2
4
6
8
10
12
Re
adR
ang
e/m
freq/MHz
Mea.30 ºC Mea.35 ºC Mea.40 ºC Mea.45 ºC Mea.50 ºC Sim.30 ºC Sim.35 ºC Sim.40 ºC Sim.45 ºC Sim.50 ºC
30 35 40 45 50840
860
880
900
920
940
fs=4.24T+718.80
Measurement Simulation Linear fit of the measurement data Linear fit of the simulation data
R.f
requ
ency
/MH
z
Temp/oC
fm=4.13T+722.98
(a) (b)Sensors 2017, 17, 665 11 of 12
870 880 890 900 910 920 930 940 950 9600
2
4
6
8
10
12
Rea
dR
ange
/m
freq/MHz
Measued 0ohm 0.4ohm 0.8ohm 1.2ohm
800 850 900 950 1000
0
1
2
3
4
5
6
7
Rea
dRa
nge/
m
freq/MHz
Mea.50C Mea.45C Mea.40C Mea.35C Mea.30C Sim.50C Sim.45C Sim.40C Sim.35C Sim.30C
(c) (d)
Figure 11. (a) Simulated and measured read range; (b) Simulated resonant frequency and measured resonant frequency at different temperatures; (c) Read range at 45 °C when the cascaded resistor varies; (d) Simulated and measured read range with cascaded 0.8 ohm resistors.
5. Conclusions
In this paper, a high-sensitivity passive sensing antenna with a bimetal strip coil is presented for wireless temperature monitoring. The design utilizes the temperature-dependent deformation characteristic of the bimetal strip to drive the lower feeding part of the dipole rotate, thus changing the resonant frequency. A prototype is designed, fabricated and measured, and the measurement results show that the sensitivity of the proposed antenna is more than 4.00 MHz/°C, which is the highest among the passive temperature-sensing antennas. An approximately linear relationship between the temperature and the resonant frequency is achieved, and the read range is more than 4 m. The proposed sensor is a good candidate for large-scale wireless temperature-sensing networks such as temperature monitoring in greenhouses and livestock farms. Besides, it is noteworthy that the sensing temperature range of the antenna can be enhanced by adopting an appropriate bimetal strip coil and optimizing the dipole antenna parameters.
The imperfect metal contact between the two layers results in a large amount of power loss, which limits the read range and broadens the realized gain bandwidth. If the two parts of the antenna can operate without the requirement of mutual contact, the performance of the sensing antenna would be further improved.
Acknowledgments: This work is funded by the Tsinghua National Laboratory for Information Science and Technology (TNList), and the Natural Science Foundation of China (Grant No. 61371013).
Author Contributions: Xianwei Shi conceived, designed and performed the experiments under the supervision of Fan Yang, Shenheng Xu and Maokun Li. Xianwei Shi analyzed the data. Xianwei Shi wrote the manuscript with help of Fan Yang. All authors contribute reviewing and revision of the manuscript.
Conflicts of Interest: The authors declare no conflict of interest.
References
1. Yang, F.; Qiao, Q.; Virtanen, J.; Elsherbeni, A.Z.; Ukkonen, L.; Sydanheimo, L. Reconfigurable sensing antenna: A slotted patch design with temperature sensation. IEEE Antennas Wirel. Propag. Lett. 2012, 11, 632–635.
2. Amin, E.M.; Saha, J.K.; Karmakar, N.C. Smart sensing materials for low-cost chipless rfid sensor. IEEE Sens. J. 2014, 14, 2198–2207.
3. Guillet, A.; Vena, A.; Perret, E.; Tedjini, S. Design of a chipless RFID sensor for water level detection. In Proceedings of the 2012 15th International Symposium on Antenna Technology and Applied Electromagnetics (ANTEM), Toulouse, France, 25–28 June 2012; pp. 1–4.
Figure 11. (a) Simulated and measured read range; (b) Simulated resonant frequency and measuredresonant frequency at different temperatures; (c) Read range at 45 ◦C when the cascaded resistor varies;(d) Simulated and measured read range with cascaded 0.8 ohm resistors.
There are two major discrepancies between the simulation and the measurement results, namely,the resonant frequency shift and the difference of read range. The measurement resonant frequencyslightly shifts downward (0.9%) compared with the simulation results, which results from thefabrication error.

Sensors 2017, 17, 665 11 of 12
The measured read range at each temperature is about 6 m shorter than the simulated ones, whichis due to the imperfect metal contact between the two layers. The loss due to the imperfect metalcontact can be modeled by a pair of cascaded resistors between the two layers. Figure 11c shows theread range when the cascaded resistor varies from 0 ohm to 1.2 ohm at 45 ◦C. When the resistor valueis set to 0.8 ohm, the read range at 910 MHz is approximately equal to the measured one. Figure 11dgives the simulated read range when a pair of 0.8 ohm resistors are in series connection with thetwo metal layers. The measured read range agrees well with the simulated read range.
5. Conclusions
In this paper, a high-sensitivity passive sensing antenna with a bimetal strip coil is presentedfor wireless temperature monitoring. The design utilizes the temperature-dependent deformationcharacteristic of the bimetal strip to drive the lower feeding part of the dipole rotate, thus changingthe resonant frequency. A prototype is designed, fabricated and measured, and the measurementresults show that the sensitivity of the proposed antenna is more than 4.00 MHz/◦C, which is thehighest among the passive temperature-sensing antennas. An approximately linear relationshipbetween the temperature and the resonant frequency is achieved, and the read range is more than4 m. The proposed sensor is a good candidate for large-scale wireless temperature-sensing networkssuch as temperature monitoring in greenhouses and livestock farms. Besides, it is noteworthy that thesensing temperature range of the antenna can be enhanced by adopting an appropriate bimetal stripcoil and optimizing the dipole antenna parameters.
The imperfect metal contact between the two layers results in a large amount of power loss, whichlimits the read range and broadens the realized gain bandwidth. If the two parts of the antenna canoperate without the requirement of mutual contact, the performance of the sensing antenna would befurther improved.
Acknowledgments: This work is funded by the Tsinghua National Laboratory for Information Science andTechnology (TNList), and the Natural Science Foundation of China (Grant No. 61371013).
Author Contributions: Xianwei Shi conceived, designed and performed the experiments under the supervisionof Fan Yang, Shenheng Xu and Maokun Li. Xianwei Shi analyzed the data. Xianwei Shi wrote the manuscriptwith help of Fan Yang. All authors contribute reviewing and revision of the manuscript.
Conflicts of Interest: The authors declare no conflict of interest.
References
1. Yang, F.; Qiao, Q.; Virtanen, J.; Elsherbeni, A.Z.; Ukkonen, L.; Sydanheimo, L. Reconfigurable sensingantenna: A slotted patch design with temperature sensation. IEEE Antennas Wirel. Propag. Lett. 2012, 11,632–635. [CrossRef]
2. Amin, E.M.; Saha, J.K.; Karmakar, N.C. Smart sensing materials for low-cost chipless rfid sensor. IEEE Sens. J.2014, 14, 2198–2207. [CrossRef]
3. Guillet, A.; Vena, A.; Perret, E.; Tedjini, S. Design of a chipless RFID sensor for water level detection.In Proceedings of the 2012 15th International Symposium on Antenna Technology and AppliedElectromagnetics (ANTEM), Toulouse, France, 25–28 June 2012; pp. 1–4.
4. Vena, A.; Babar, A.A.; Syd, L.; Ukkonen, L.; Tentzeris, M.M. A novel wireless inkjet-printed chipless sensorfor moisture detection utilizing carbon nanotube. In Proceedings of the 2013 IEEE Antennas and PropagationSociety International Symposium (APSURSI), Orlando, FL, USA, 7–13 July 2013; pp. 2303–2304.
5. Hasan, A.; Bhattacharyya, R.; Sarma, S. A monopole-coupled RFID sensor for pervasive soil moisturemonitoring. In Proceedings of the 2013 IEEE Antennas and Propagation Society International Symposium(APSURSI), Orlando, FL, USA, 7–13 July 2013; pp. 2309–2310.
6. Hasani, M.; Vena, A.; Sydss, L.; Ukkonen, L.; Tentzeris, M.M. Implementation of a dual-interrogation-modeembroidered rfid-enabled strain sensor. IEEE Antennas Wirel. Propag. Lett. 2013, 12, 1272–1275. [CrossRef]
7. Occhiuzzi, C.; Paggi, C.; Marrocco, G. Passive rfid strain-sensor based on meander-line antennas. IEEE Trans.Antennas Propag. 2011, 59, 4836–4840. [CrossRef]

Sensors 2017, 17, 665 12 of 12
8. Yi, X.; Cho, C.; Fang, C.H.; Cooper, J.; Lakafosis, V.; Vyas, R.; Wang, Y.; Leon, R.T.; Tentzeris, M.M. Wirelessstrain and crack sensing using a folded patch antenna. In Proceedings of the 2012 6th European Conferenceon Antennas and Propagation (EUCAP), Prague, Czech Republic, 26–30 March 2012; pp. 1678–1681.
9. Paggi, C.; Occhiuzzi, C.; Marrocco, G. Sub-millimeter displacement sensing by passive uhf rfid antennas.IEEE Trans. Antennas Propag. 2014, 62, 905–912. [CrossRef]
10. Suwalak, R.; Phongcharoenpanich, C.; Torrungrueng, D. Detection of reinforced metal in light weightconcrete structures using an RFID sensor system. In Proceedings of the 2014 IEEE Conference on AntennaMeasurements & Applications (CAMA), Antibes, France, 16–19 November 2014; pp. 1–2.
11. Kim, S.; Kawahara, Y.; Georgiadis, A.; Collado, A.; Tentzeris, M.M. Low-cost inkjet-printed fully passive rfidtags using metamaterial-inspired antennas for capacitive sensing applications. In Proceedings of the 2013IEEE MTT-S International Microwave Symposium Digest (IMS), Seattle, WA, USA, 2–7 June 2013; pp. 1–4.
12. Karmakar, N.; Amin, E.M. Passive RFID sensor for remote detection of partial discharge. In Proceedings ofthe 2011 IEEE Sensors, Limerick, Ireland, 28–31 October 2011; pp. 550–553.
13. Ziai, M.A.; Batchelor, J.C. Passive UHF RFID tilt sensor. In Proceedings of the 2015 International Conferenceon Electromagnetics in Advanced Applications (ICEAA), Turin, Italy, 7–11 September 2015; pp. 137–140.
14. Jiang, Z.; Yang, F. Reconfigurable sensing antennas integrated with thermal switches for wireless temperaturemonitoring. IEEE Antennas Wirel. Propag. Lett. 2013, 12, 914–917. [CrossRef]
15. Fu, Z.; Yang, F. A slotted patch antenna integrated with thermal switch for high-sensitivity temperaturemonitoring. IEEE Antennas Wirel. Propag. Lett. 2015, 14, 998–1001. [CrossRef]
16. Kaiming, D.; Yang, F.; Shenheng, X.; Maokun, L. Dual-frequency reconfigurable patch antenna with thermalswitches for temperature monitoring. In Proceedings of the 2016 URSI International Symposium onElectromagnetic Theory (EMTS), Espoo, Finland, 14–18 August 2016; pp. 118–120.
17. Kubina, B.; Sch, M.; Mandel, C.; Mehmood, A.; Jakoby, R. Wireless high-temperature sensing with a chiplesstag based on a dielectric resonator antenna. In Proceedings of the 2013 IEEE SENSORS, Baltimore, MD, USA,3–6 November 2013; pp. 1–4.
18. Virtanen, J.; Yang, F.; Ukkonen, L.; Elsherbeni, A.Z.; Babar, A.A.; Sydänheimo, L. Dual port temperaturesensor tag for passive UHF RFID systems. Sens. Rev. 2014, 34, 154–169. [CrossRef]
19. Qiao, Q. Design and Analysis of Reconfigurable Sensing Antennas for Wireless Sensing Applications; The Universityof Mississippi: Oxford, MS, USA, 2014.
20. Bhadra, S.; Tan, D.S.Y.; Thomson, D.J.; Freund, M.S.; Bridges, G.E. A wireless passive sensor for temperaturecompensated remote pH monitoring. IEEE Sens. J. 2013, 13, 2428–2436. [CrossRef]
21. Balanis, C.A. Image theory. In Advanced Engineering Electromagnetics, 2nd ed.; Kulesa, T., Ashenberg, W.,Ang-Bok, A., Eds.; John Wiley & Sons: Hoboken, NJ, USA, 2012; pp. 314–321.
22. Fu, Z. Theoretical Design and Application of High-Sensitivity Reconfigurable Sensing Antenna; Tsinghua University:Beijing, China, 2014.
© 2017 by the authors. Licensee MDPI, Basel, Switzerland. This article is an open accessarticle distributed under the terms and conditions of the Creative Commons Attribution(CC BY) license (http://creativecommons.org/licenses/by/4.0/).