
A Panel Study on Epigenetics, Markers of Oxidative Stress ... fileA Panel Study on Epigenetics,...
32
A Panel Study on Epigenetics, Markers of Oxidative Stress, and Lung Function among Children with Respiratory Disease Exposed to Industrial Air Pollution Annibale Biggeri , Dolores Catelan, Valentina Bollati, Riccardo Pistelli, Franca Rusconi, Fabio Barbone, Pier Alberto Bertazzi, Andrea Baccarelli Department of Statistics “G. Parenti” University of Florence IT ISPO Cancer Prevention and Research Institute, Florence University of Milan, IRCCS OM Foundation Sacro Cuore University Rome, Anna Meyer Pediatric Hospital FI, University of Udine
Transcript of A Panel Study on Epigenetics, Markers of Oxidative Stress ... fileA Panel Study on Epigenetics,...
A Panel Study on Epigenetics, Markers of Oxidative Stress, and Lung Function among Children with
Respiratory Disease Exposed to Industrial Air Pollution
Annibale Biggeri, Dolores Catelan, Valentina Bollati, Riccardo Pistelli, Franca Rusconi, Fabio Barbone,
Pier Alberto Bertazzi, Andrea Baccarelli
Department of Statistics “G. Parenti” University of Florence ITISPO Cancer Prevention and Research Institute, Florence
University of Milan, IRCCS OM Foundation Sacro Cuore University Rome, Anna Meyer Pediatric Hospital FI, University of Udine

preface
Epidemiological and not StatisticalApplied and not Theoretical
• Study description [aim, design]• Simple data analysis [standard approach]• Graphical chain model• Direct and indirect effect
Study description: objective
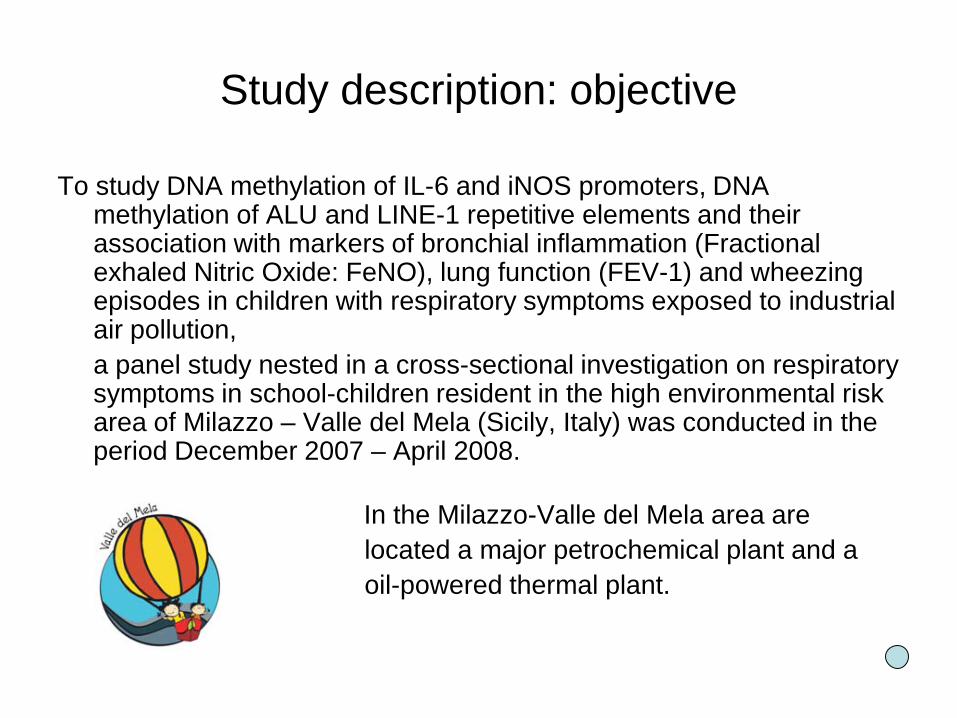
To study DNA methylation of IL-6 and iNOS promoters, DNA methylation of ALU and LINE-1 repetitive elements and their association with markers of bronchial inflammation (Fractional exhaled Nitric Oxide: FeNO), lung function (FEV-1) and wheezing episodes in children with respiratory symptoms exposed to industrial air pollution,a panel study nested in a cross-sectional investigation on respiratory symptoms in school-children resident in the high environmental risk area of Milazzo – Valle del Mela (Sicily, Italy) was conducted in the period December 2007 – April 2008.
In the Milazzo-Valle del Mela area are located a major petrochemical plant and a oil-powered thermal plant.
Study description: design - 1
• The cross-sectional phase was conducted during April-May 2007 on all 2506 resident children attending the local primary schools. Respiratory health was recorded by the ISAAC questionnaire administered to the parents for a total of 2244 children (89.5% completeness). Using the answer at the items on diagnosis of asthma, wheezing symptoms in the last 12 months (three items), chest tightness in the last 12 months, nocturnal dry cough in the last 12 months and use of bronchodilators in the last 12 months,50 children were selected, whose had asthma diagnosis, wheezing symptoms and positives to minor symptoms or use of medications. Parents of 39 children (78%) gave assent to participate.
Study description: design - 2
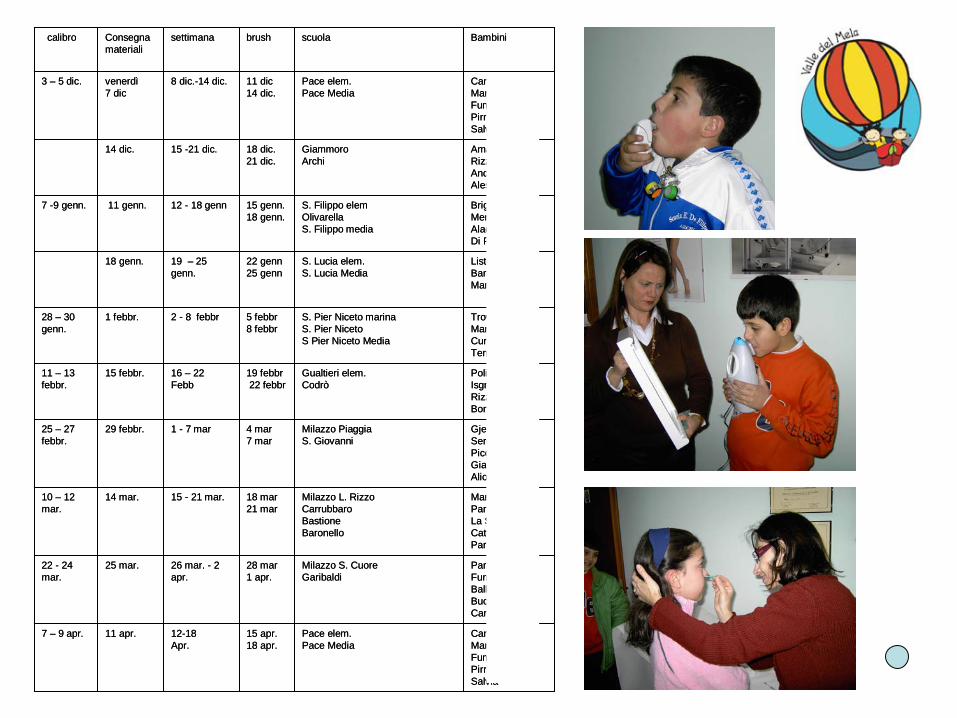
• The study sample was divided in ten small groupsEach group was followed-up for seven days, starting on Saturday and ending on Friday the week after. The study started on December 8th, 2007 and ended on April 18th, 2008.
• A weekly diary on respiratory symptoms and drugs (ATS derived) and a daily diary on hourly activities of the child and indoor sources of pollution were recorded by the parents. (WHO)
• Expiratory flow (FEV-1) was recorded on the morning and afternoon (between 4 – 6 o’ clock pm). We used PiKo®-1 FEV-1 Meter. The maneuver was supervised by the nurse on the afternoon.
• Fractional exhaled Nitric Oxide concentration FeNO (NIOX analyzer Aerocrine) (ATS/ERS) were measured by the nurse in the afternoon. Ambient NO concentrations were also taken.
• On day fourth and seventh of follow-up the child went to the out-patient clinic to execute nasal brushing by trainee personnel.
CampanellaMarchetta FumiaPirroneSalvia
Pace elem.Pace Media
15 apr.18 apr.
12-18 Apr.
11 apr.7 – 9 apr.
ParisiFurnariBallottaBuccaCaravello
Milazzo S. CuoreGaribaldi
28 mar1 apr.
26 mar. - 2 apr.
25 mar.22 - 24 mar.
MarzioPanassidiLa SpadaCattafiParisse
Milazzo L. RizzoCarrubbaroBastioneBaronello
18 mar21 mar
15 - 21 mar.14 mar.10 – 12 mar.
GjelajSergentePiccoloGiardinaAlioto
Milazzo PiaggiaS. Giovanni
4 mar7 mar
1 - 7 mar29 febbr.25 – 27 febbr.
PolitoIsgròRizzoBonanno
Gualtieri elem.Codrò
19 febbr22 febbr
16 – 22 Febb
15 febbr.11 – 13 febbr.
TrovatelloMarchettaCurròTerrizzi
S. Pier Niceto marinaS. Pier NicetoS Pier Niceto Media
5 febbr8 febbr
2 - 8 febbr1 febbr.28 – 30 genn.
ListoBartoliniMancuso
S. Lucia elem.S. Lucia Media
22 genn25 genn
19 – 25 genn.
18 genn.
BrigandìMerlino*AlacquaDi Paola
S. Filippo elemOlivarellaS. Filippo media
15 genn.18 genn.
12 - 18 genn11 genn.7 -9 genn.
AmalfaRizzoAndaloroAlessi*
GiammoroArchi
18 dic. 21 dic.
15 -21 dic.14 dic.
CampanellaMarchetta Fumia*PirroneSalvia
Pace elem.Pace Media
11 dic14 dic.
8 dic.-14 dic.venerdì7 dic
3 – 5 dic.
BambiniscuolabrushsettimanaConsegna materiali
calibro
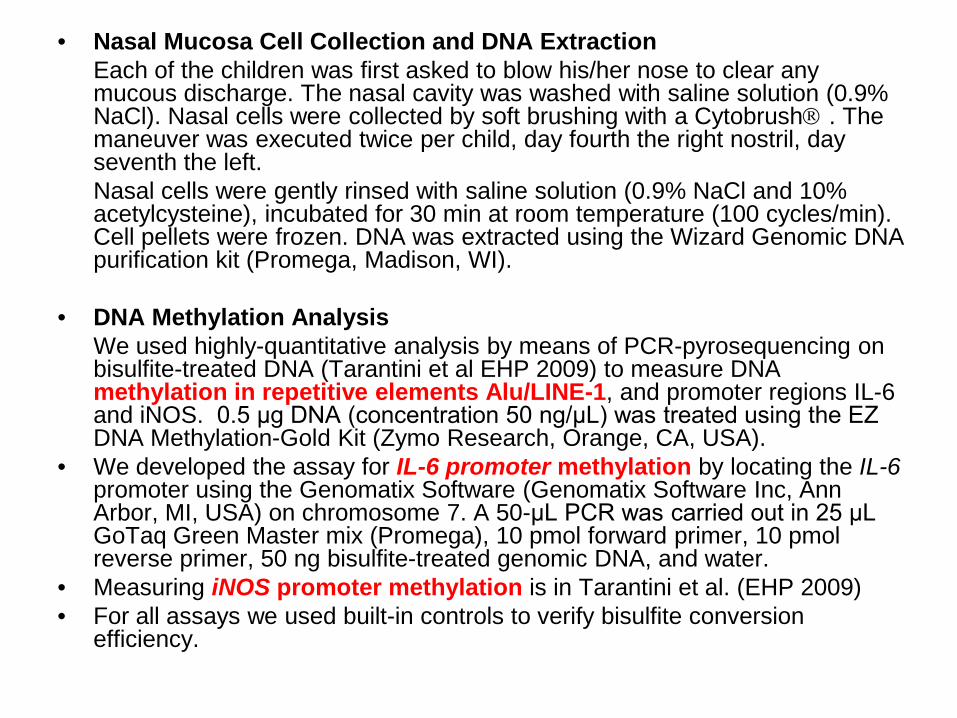
• Nasal Mucosa Cell Collection and DNA ExtractionEach of the children was first asked to blow his/her nose to clear any mucous discharge. The nasal cavity was washed with saline solution (0.9% NaCl). Nasal cells were collected by soft brushing with a Cytobrush . The maneuver was executed twice per child, day fourth the right nostril, day seventh the left.Nasal cells were gently rinsed with saline solution (0.9% NaCl and 10% acetylcysteine), incubated for 30 min at room temperature (100 cycles/min). Cell pellets were frozen. DNA was extracted using the Wizard Genomic DNA purification kit (Promega, Madison, WI).
• DNA Methylation AnalysisWe used highly-quantitative analysis by means of PCR-pyrosequencing on bisulfite-treated DNA (Tarantini et al EHP 2009) to measure DNA methylation in repetitive elements Alu/LINE-1, and promoter regions IL-6 and iNOS. 0.5 μg DNA (concentration 50 ng/μL) was treated using the EZ DNA Methylation-Gold Kit (Zymo Research, Orange, CA, USA).
• We developed the assay for IL-6 promoter methylation by locating the IL-6promoter using the Genomatix Software (Genomatix Software Inc, Ann Arbor, MI, USA) on chromosome 7. A 50-μL PCR was carried out in 25 μL GoTaq Green Master mix (Promega), 10 pmol forward primer, 10 pmol reverse primer, 50 ng bisulfite-treated genomic DNA, and water.
• Measuring iNOS promoter methylation is in Tarantini et al. (EHP 2009)• For all assays we used built-in controls to verify bisulfite conversion
efficiency.
• Compared with other common methods of DNA methylation analysis, pyrosequencing-based assays have the advantage of producing individual measures of methylation at more than one CpG dinucleotide, thus reflecting more accurately DNA methylation in the region.
• In the Alu or LINE-1 assays, we measured the percentage of 5mC (%5mC) at each of three CpG dinucleotide positions that are repeated over the human genome with the sequence of interest.
• In the iNOS promoter assay, we measured %5mC at each of two individual CpG dinucleotides within a CpG island located in the gene promoter;
• In the IL-6 promoter assay, we measured %5mC at two individual CpG dinucleotides within a CpG island located downstream in the proximity of the gene promoter.
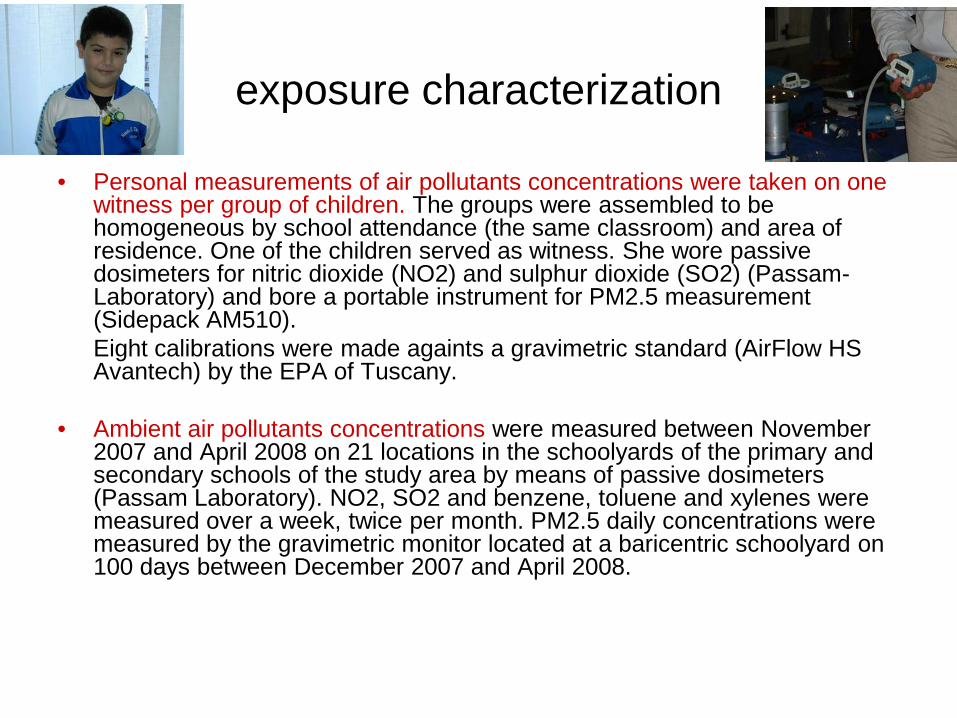
exposure characterization
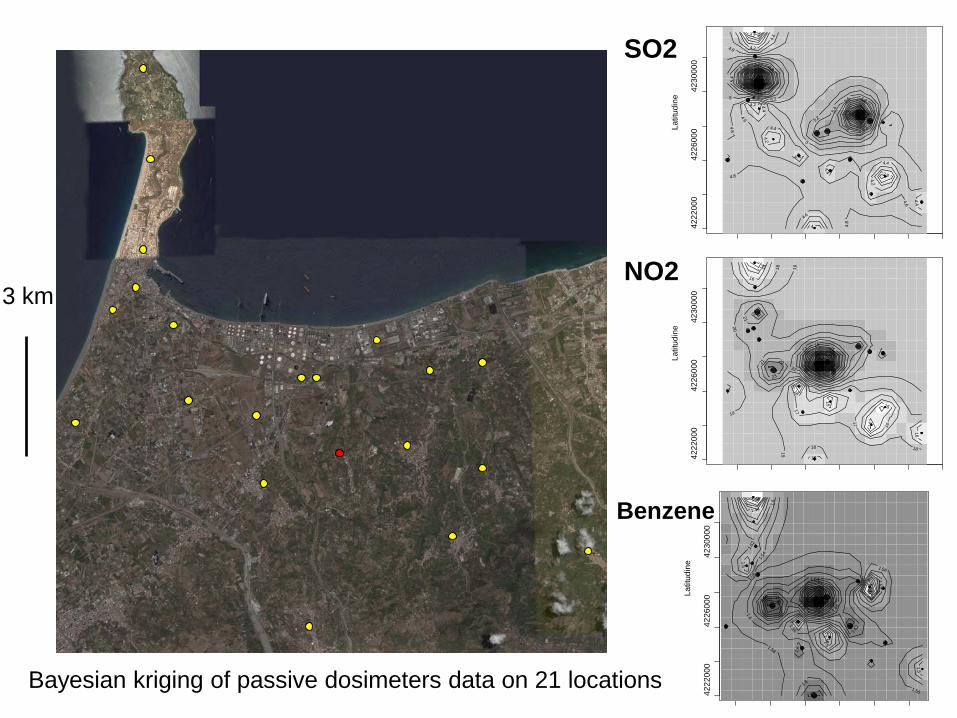
• Personal measurements of air pollutants concentrations were taken on one witness per group of children. The groups were assembled to be homogeneous by school attendance (the same classroom) and area of residence. One of the children served as witness. She wore passive dosimeters for nitric dioxide (NO2) and sulphur dioxide (SO2) (Passam-Laboratory) and bore a portable instrument for PM2.5 measurement (Sidepack AM510). Eight calibrations were made againts a gravimetric standard (AirFlow HS Avantech) by the EPA of Tuscany.
• Ambient air pollutants concentrations were measured between November 2007 and April 2008 on 21 locations in the schoolyards of the primary and secondary schools of the study area by means of passive dosimeters (Passam Laboratory). NO2, SO2 and benzene, toluene and xylenes were measured over a week, twice per month. PM2.5 daily concentrations were measured by the gravimetric monitor located at a baricentric schoolyard on 100 days between December 2007 and April 2008.
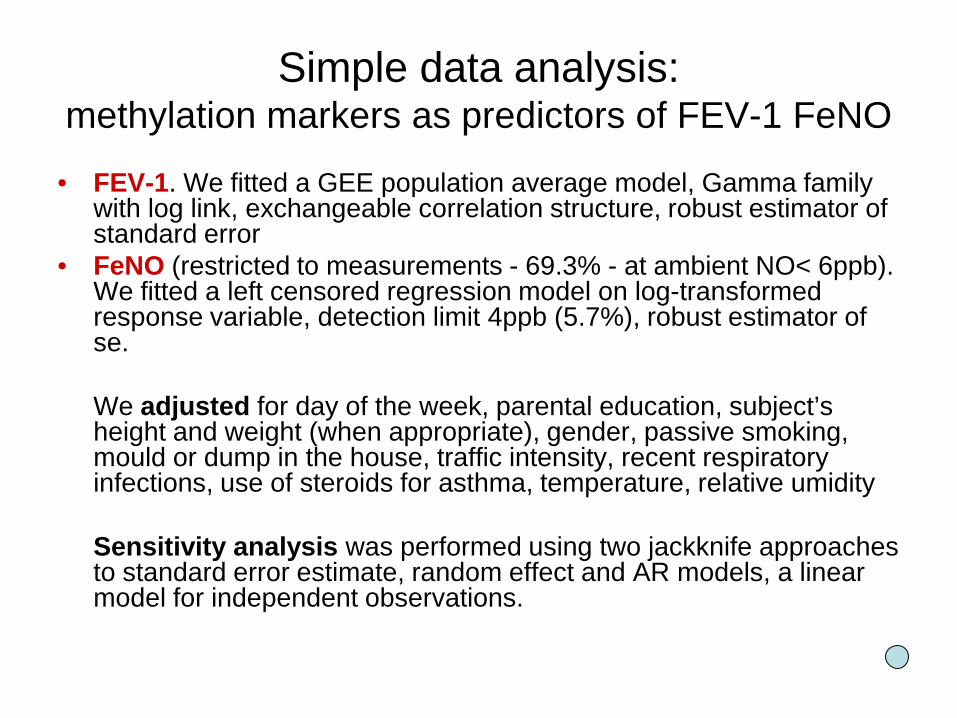
Simple data analysis: methylation markers as predictors of FEV-1 FeNO
• FEV-1. We fitted a GEE population average model, Gamma family with log link, exchangeable correlation structure, robust estimator of standard error
• FeNO (restricted to measurements - 69.3% - at ambient NO< 6ppb). We fitted a left censored regression model on log-transformed response variable, detection limit 4ppb (5.7%), robust estimator of se.
We adjusted for day of the week, parental education, subject’s height and weight (when appropriate), gender, passive smoking, mould or dump in the house, traffic intensity, recent respiratory infections, use of steroids for asthma, temperature, relative umidity
Sensitivity analysis was performed using two jackknife approaches to standard error estimate, random effect and AR models, a linear model for independent observations.
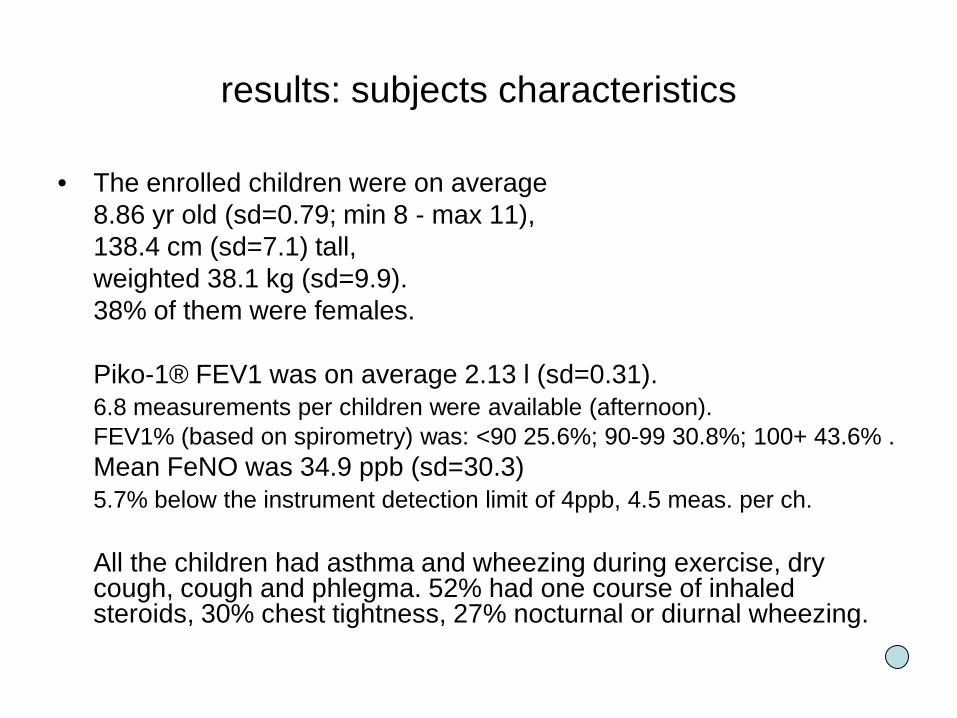
results: subjects characteristics
• The enrolled children were on average 8.86 yr old (sd=0.79; min 8 - max 11), 138.4 cm (sd=7.1) tall, weighted 38.1 kg (sd=9.9). 38% of them were females.
Piko-1® FEV1 was on average 2.13 l (sd=0.31). 6.8 measurements per children were available (afternoon). FEV1% (based on spirometry) was: <90 25.6%; 90-99 30.8%; 100+ 43.6% .Mean FeNO was 34.9 ppb (sd=30.3) 5.7% below the instrument detection limit of 4ppb, 4.5 meas. per ch.
All the children had asthma and wheezing during exercise, dry cough, cough and phlegma. 52% had one course of inhaled steroids, 30% chest tightness, 27% nocturnal or diurnal wheezing.

results: risk factors
74.4% at least one parent had 14+ yrs of education10.3% mould or dampness in child’s room during his/her 1st yr life23% of the mothers were current smokers64% were never smoker61% close to streets with high vehicular traffic
Ambient air pollutants concentrations of PM2.5 were 23.3 µg/m3
(median 21.3, 90° percentile 40.0 and max 77.3). NO2 was above 40 µg/m3 weekly averages only in one location.SO2 was above 20 µg/m3 weekly average in the proximity of the plants, consistently with prevalent north-south wind directions. Hourly excesses of SO2 above 100 µg/m3 were documented in three locations, by the Sicilian EPA, Department of Messina.
4222
000
4226
000
4230
000
Latit
udin
e
3.2
3.8
4
4.2
4.2
4.2
4.2
4.4
4.4
4.4
4.4
4.4
4.4
4.4
4.6 4.6
4.6
4.8
4.8
4.8
4.8
5
5
5.2
5.2
5.4
5.4
5.6
5.6
5.8
5.8
6
6
6.2
6.2
6.4
7
7.6
8
8.2
4222
000
4226
000
4230
000
Latit
udin
e
14
14
15
15 15
16
16
16
16
17
17
17
18
18 18
19
19
19
20
20
21
21
22
22 22
23
23 24 25
26
27 28
29
30
31 35
4222
000
4226
000
4230
000
Latit
udin
e
1.36
1.42
1.44
1.44
1.48
1.5
1.5
1.5
1.5
1.52
1.52
1.54
1.56
1.56
1.56
1.56
1.58
1.6
1.6
1.6
1.62
1.64
1.64
1.66
1.66
1.68 1.68 1.7
6
Bayesian kriging of passive dosimeters data on 21 locations
SO2
NO2
Benzene
3 km
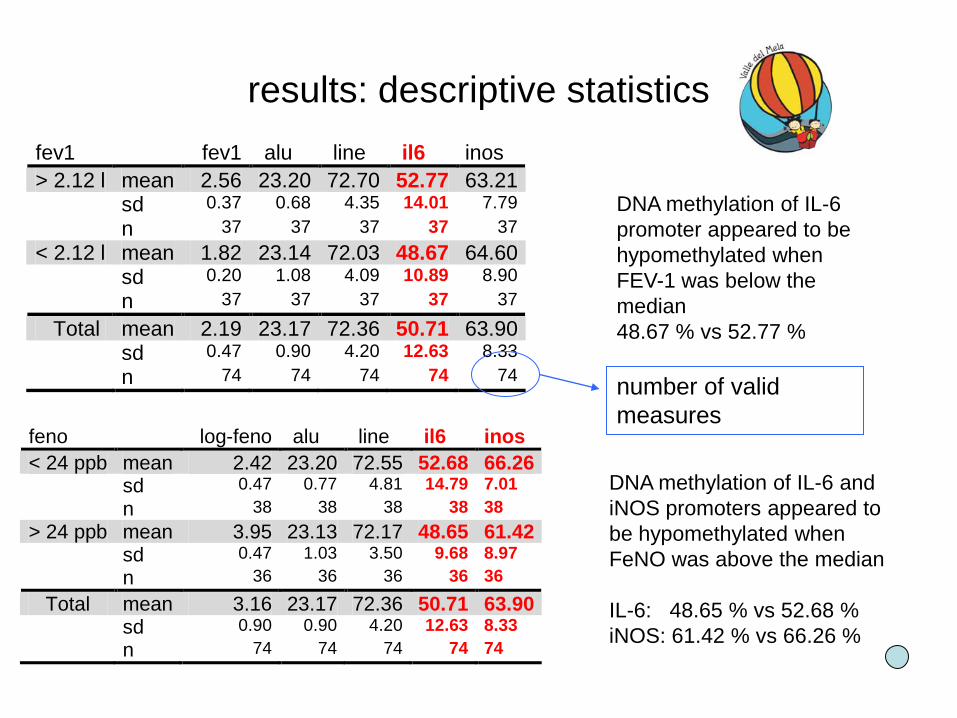
results: descriptive statisticsfev1 fev1 alu line il6 inos > 2.12 l mean 2.56 23.20 72.70 52.77 63.21 sd 0.37 0.68 4.35 14.01 7.79 n 37 37 37 37 37 < 2.12 l mean 1.82 23.14 72.03 48.67 64.60 sd 0.20 1.08 4.09 10.89 8.90 n 37 37 37 37 37
Total mean 2.19 23.17 72.36 50.71 63.90 sd 0.47 0.90 4.20 12.63 8.33 n 74 74 74 74 74
feno log-feno alu line il6 inos < 24 ppb mean 2.42 23.20 72.55 52.68 66.26 sd 0.47 0.77 4.81 14.79 7.01 n 38 38 38 38 38 > 24 ppb mean 3.95 23.13 72.17 48.65 61.42 sd 0.47 1.03 3.50 9.68 8.97 n 36 36 36 36 36 Total mean 3.16 23.17 72.36 50.71 63.90 sd 0.90 0.90 4.20 12.63 8.33 n 74 74 74 74 74
DNA methylation of IL-6 promoter appeared to be hypomethylated when FEV-1 was below the median 48.67 % vs 52.77 %
DNA methylation of IL-6 and iNOS promoters appeared to be hypomethylated when FeNO was above the median
IL-6: 48.65 % vs 52.68 % iNOS: 61.42 % vs 66.26 %
number of valid measures
12
34
log
FEV
1 (p
iko1
)
21 22 23 24 25percent global alu methylation
12
34
log
FEV
1 (p
iko1
)
55 60 65 70 75 80percent global line methylation
12
34
log
FEV
1 (p
iko1
)
12
34
log
FEV
1 (p
iko1
)
12
34
5lo
g Fe
NO
21 22 23 24 25percent global alu methylation
12
34
5lo
g Fe
NO
55 60 65 70 75 80percent global line methylation
12
34
5lo
g Fe
NO
20 40 60 80 100percent il6 methylation
23
45
6lo
g Fe
NO
30 40 50 60 70 80percent inos methylation
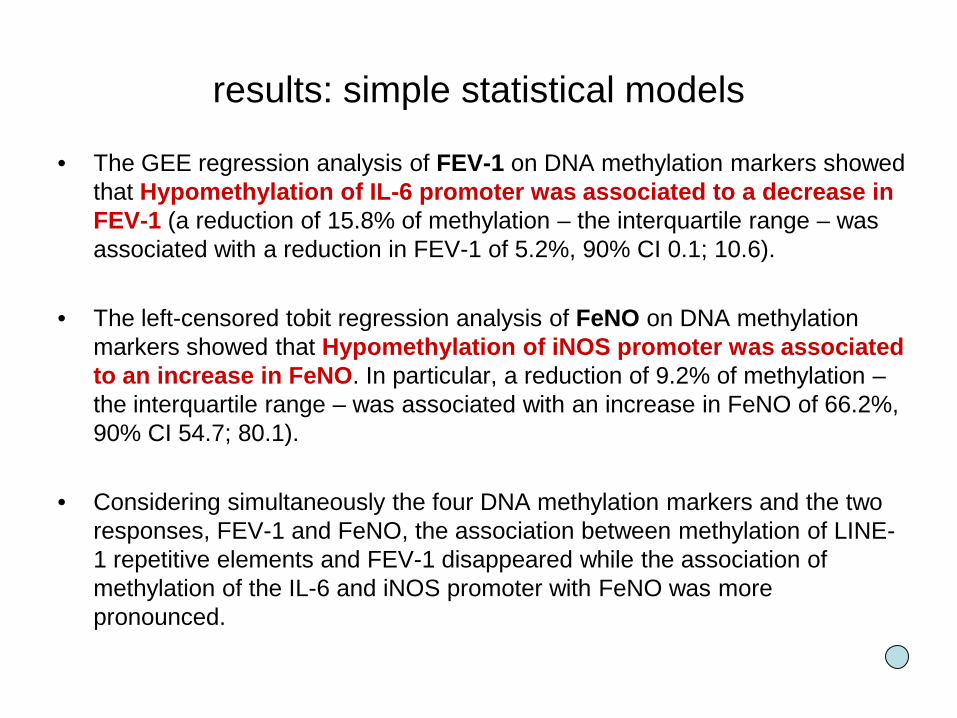
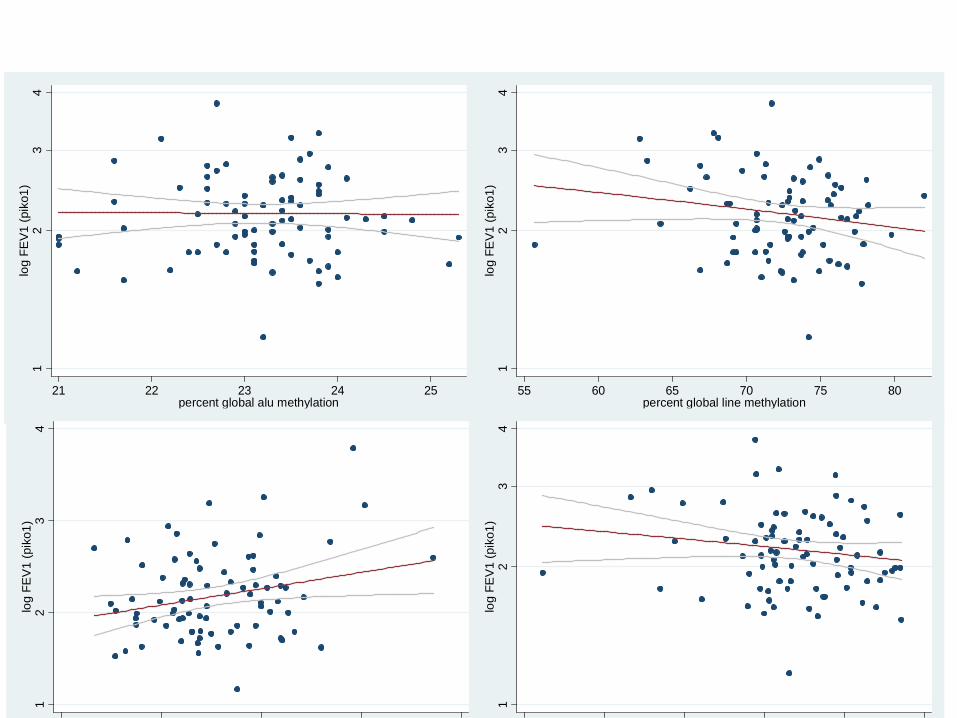
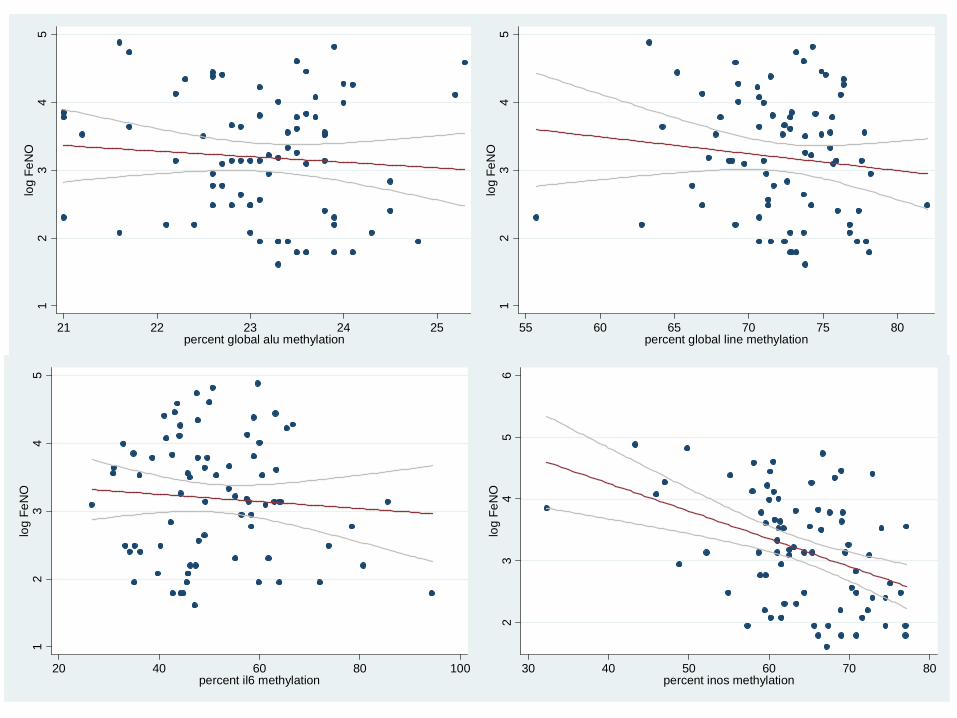
• The GEE regression analysis of FEV-1 on DNA methylation markers showed that Hypomethylation of IL-6 promoter was associated to a decrease in FEV-1 (a reduction of 15.8% of methylation – the interquartile range – was associated with a reduction in FEV-1 of 5.2%, 90% CI 0.1; 10.6).
• The left-censored tobit regression analysis of FeNO on DNA methylation markers showed that Hypomethylation of iNOS promoter was associated to an increase in FeNO. In particular, a reduction of 9.2% of methylation –the interquartile range – was associated with an increase in FeNO of 66.2%, 90% CI 54.7; 80.1).
• Considering simultaneously the four DNA methylation markers and the two responses, FEV-1 and FeNO, the association between methylation of LINE-1 repetitive elements and FEV-1 disappeared while the association of methylation of the IL-6 and iNOS promoter with FeNO was more pronounced.
results: simple statistical models
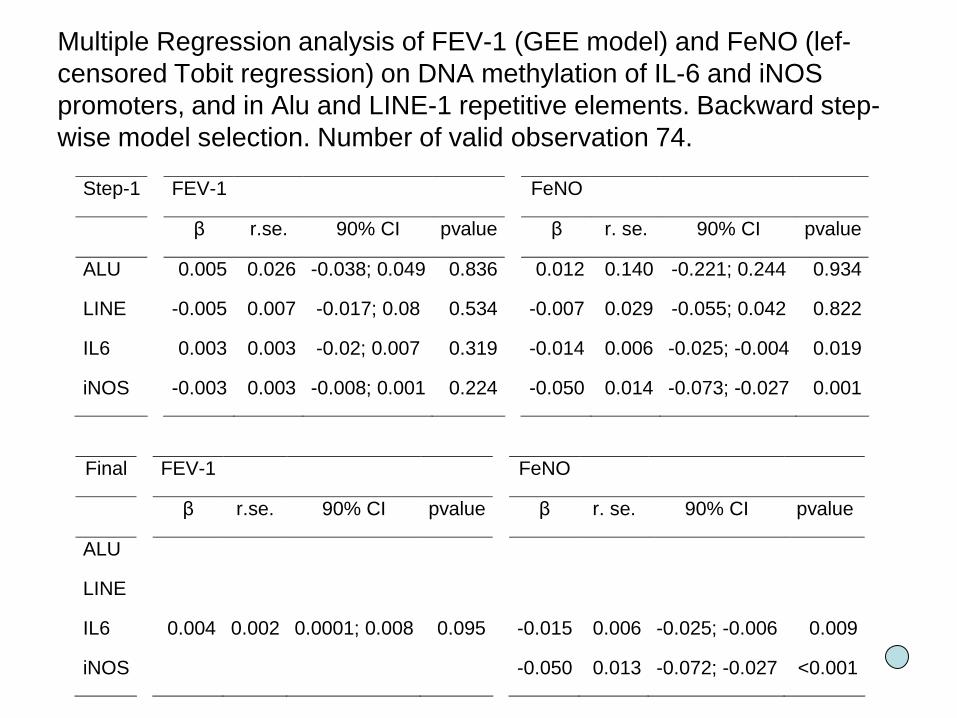
Multiple Regression analysis of FEV-1 (GEE model) and FeNO (lef-censored Tobit regression) on DNA methylation of IL-6 and iNOS promoters, and in Alu and LINE-1 repetitive elements. Backward step-wise model selection. Number of valid observation 74.
Step-1 FEV-1 FeNO
β r.se. 90% CI pvalue β r. se. 90% CI pvalue
ALU 0.005 0.026 -0.038; 0.049 0.836 0.012 0.140 -0.221; 0.244 0.934
LINE -0.005 0.007 -0.017; 0.08 0.534 -0.007 0.029 -0.055; 0.042 0.822
IL6 0.003 0.003 -0.02; 0.007 0.319 -0.014 0.006 -0.025; -0.004 0.019
iNOS -0.003 0.003 -0.008; 0.001 0.224 -0.050 0.014 -0.073; -0.027 0.001
Final FEV-1 FeNO
β r.se. 90% CI pvalue β r. se. 90% CI pvalue
ALU
LINE
IL6 0.004 0.002 0.0001; 0.008 0.095 -0.015 0.006 -0.025; -0.006 0.009
iNOS -0.050 0.013 -0.072; -0.027 <0.001
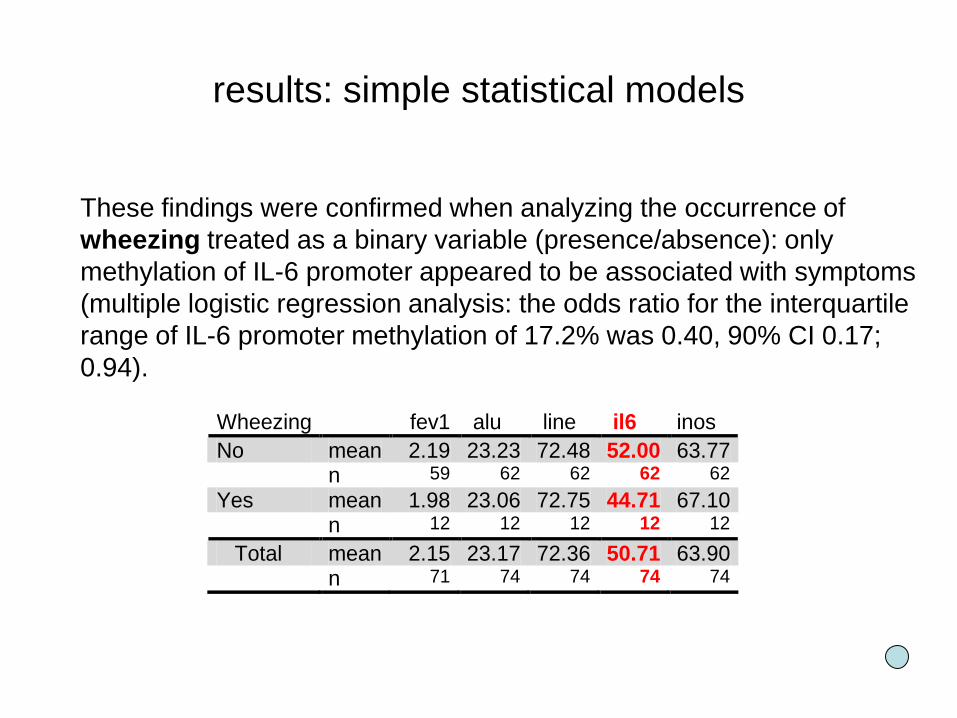
These findings were confirmed when analyzing the occurrence of wheezing treated as a binary variable (presence/absence): only methylation of IL-6 promoter appeared to be associated with symptoms (multiple logistic regression analysis: the odds ratio for the interquartile range of IL-6 promoter methylation of 17.2% was 0.40, 90% CI 0.17; 0.94).
Wheezing fev1 alu line il6 inos No mean 2.19 23.23 72.48 52.00 63.77 n 59 62 62 62 62 Yes mean 1.98 23.06 72.75 44.71 67.10 n 12 12 12 12 12
Total mean 2.15 23.17 72.36 50.71 63.90 n 71 74 74 74 74
results: simple statistical models
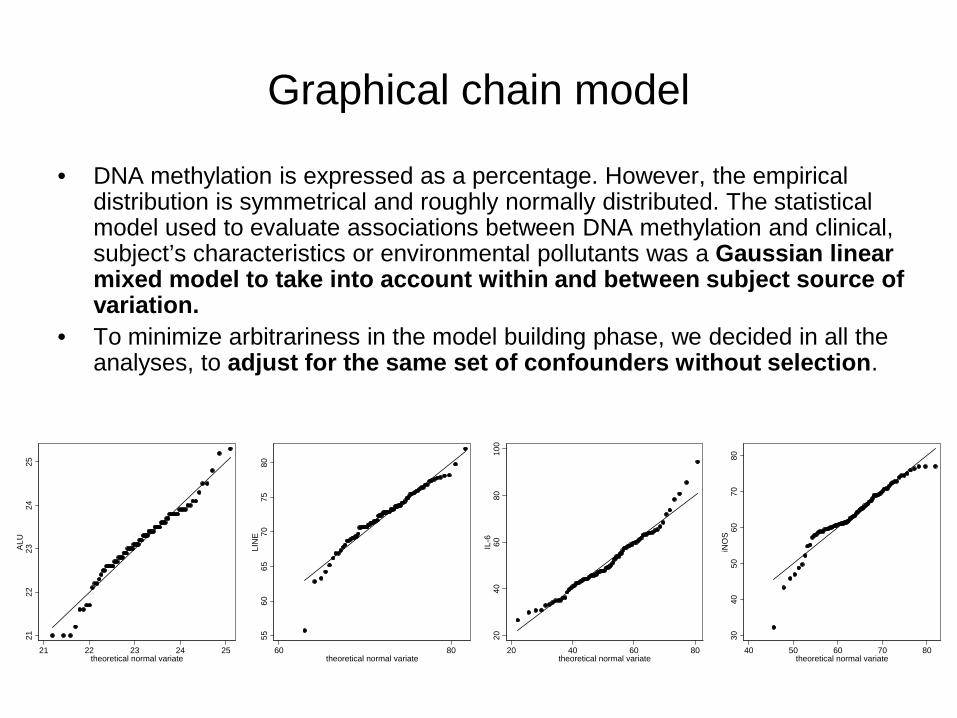
• DNA methylation is expressed as a percentage. However, the empirical distribution is symmetrical and roughly normally distributed. The statistical model used to evaluate associations between DNA methylation and clinical, subject’s characteristics or environmental pollutants was a Gaussian linear mixed model to take into account within and between subject source of variation.
• To minimize arbitrariness in the model building phase, we decided in all the analyses, to adjust for the same set of confounders without selection.
2122
2324
25A
LU
21 22 23 24 25theoretical normal variate
5560
6570
7580
LIN
E
60 80theoretical normal variate
2040
6080
100
IL-6
20 40 60 80theoretical normal variate
3040
5060
7080
iNO
S
40 50 60 70 80theoretical normal variate
Graphical chain model

• The analysis of multivariate dependencies can be solved by means of a series of separate regression analyses or can be described by modelling directly the concentration matrix. (Cox DR and Wermuth N. 1998)
• The idea is to represent the conditional relationships among variables. The results can be visualized as a graph whose vertexes represent variables and edges conditional relationships.
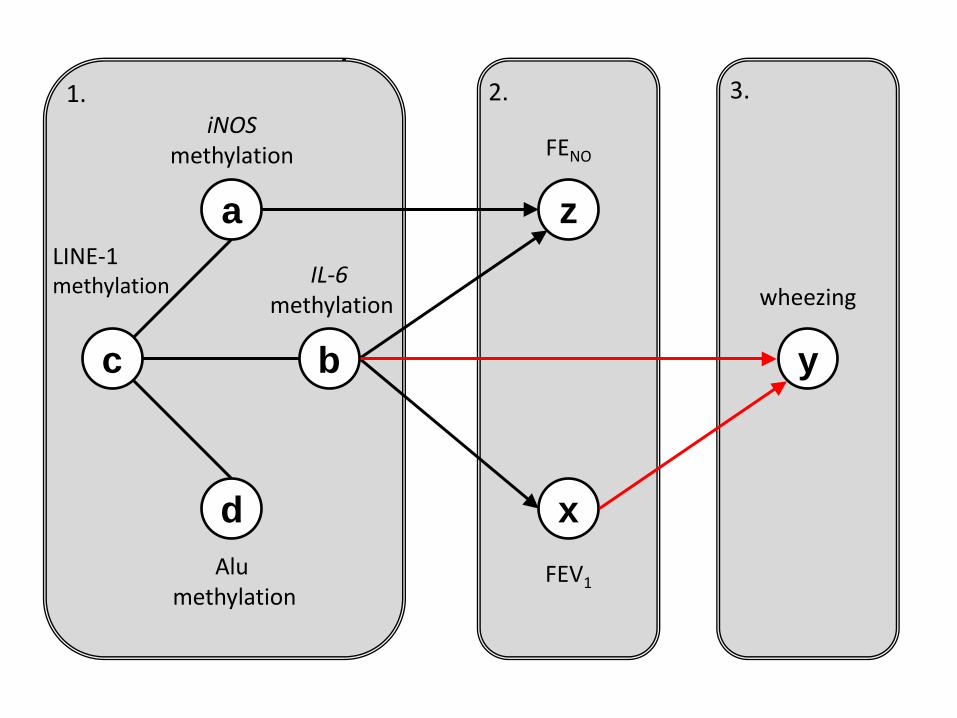
Chain graphs are used when we can a priori partition the variables in explanatory, intermediate and responses. Each block contains a type of variables, edges within block represent conditional associations, between blocks directed edges (arrows) represent dependencies.
Graphical chain model
• We analysed jointly the four DNA methylation positions and their relationships with clinical outcomes..
• In particular we modelled jointly ALU, LINE, IL-6,iNOS methylation positions as a set of explanatory variables, two markers (FEV-1 and FeNO) [as intermediate and presence of wheezing as outcome].
• Graphical chain models assume linearity and absence of second order interactions (effect modification) among continuous variables. This might be not realistic. Unobservable latent structures could also contribute to the observed association graph.
Graphical chain model
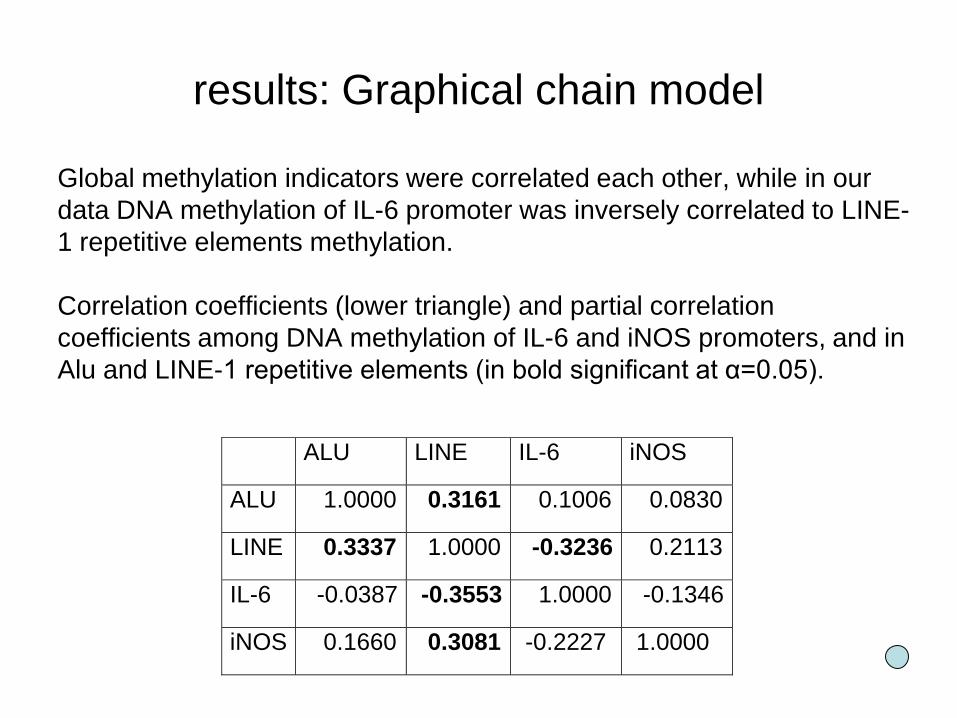
Global methylation indicators were correlated each other, while in our data DNA methylation of IL-6 promoter was inversely correlated to LINE-1 repetitive elements methylation.
Correlation coefficients (lower triangle) and partial correlation coefficients among DNA methylation of IL-6 and iNOS promoters, and in Alu and LINE-1 repetitive elements (in bold significant at α=0.05).
ALU LINE IL-6 iNOS
ALU 1.0000 0.3161 0.1006 0.0830
LINE 0.3337 1.0000 -0.3236 0.2113
IL-6 -0.0387 -0.3553 1.0000 -0.1346
iNOS 0.1660 0.3081 -0.2227 1.0000
results: Graphical chain model
a
c
d
b
z
x
y
1. 3.2.iNOS
methylation
LINE-1methylation
Alumethylation
FENO
IL-6methylation
FEV1
wheezing
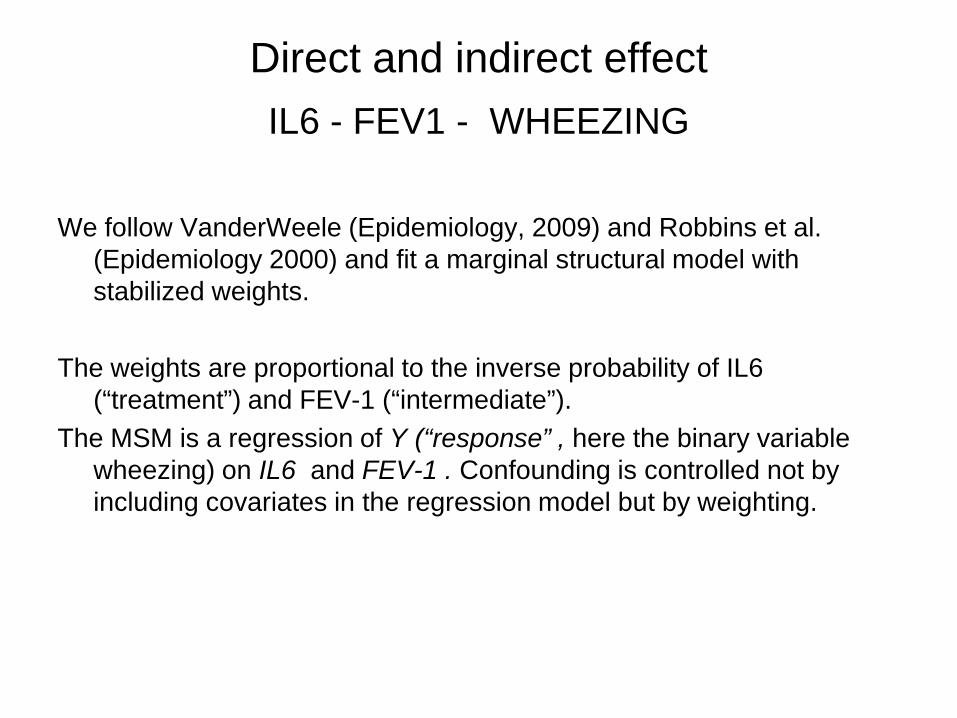
Direct and indirect effectIL6 - FEV1 - WHEEZING
We follow VanderWeele (Epidemiology, 2009) and Robbins et al. (Epidemiology 2000) and fit a marginal structural model with stabilized weights.
The weights are proportional to the inverse probability of IL6 (“treatment”) and FEV-1 (“intermediate”).
The MSM is a regression of Y (“response” , here the binary variable wheezing) on IL6 and FEV-1 . Confounding is controlled not by including covariates in the regression model but by weighting.
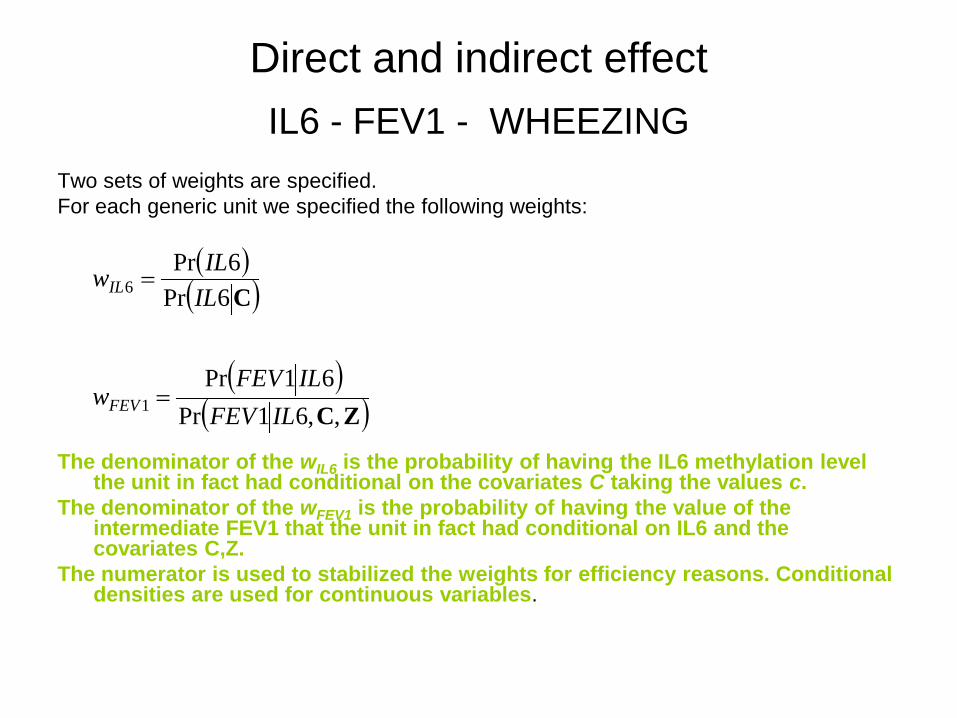
Direct and indirect effectIL6 - FEV1 - WHEEZING
Two sets of weights are specified. For each generic unit we specified the following weights:
The denominator of the wIL6 is the probability of having the IL6 methylation level the unit in fact had conditional on the covariates C taking the values c.
The denominator of the wFEV1 is the probability of having the value of the intermediate FEV1 that the unit in fact had conditional on IL6 and the covariates C,Z.
The numerator is used to stabilized the weights for efficiency reasons. Conditional densities are used for continuous variables.
( )( )
( )( )ZC
C
,,61Pr61Pr
6Pr6Pr
1
6
ILFEVILFEV
w
ILILw
FEV
IL
=
=
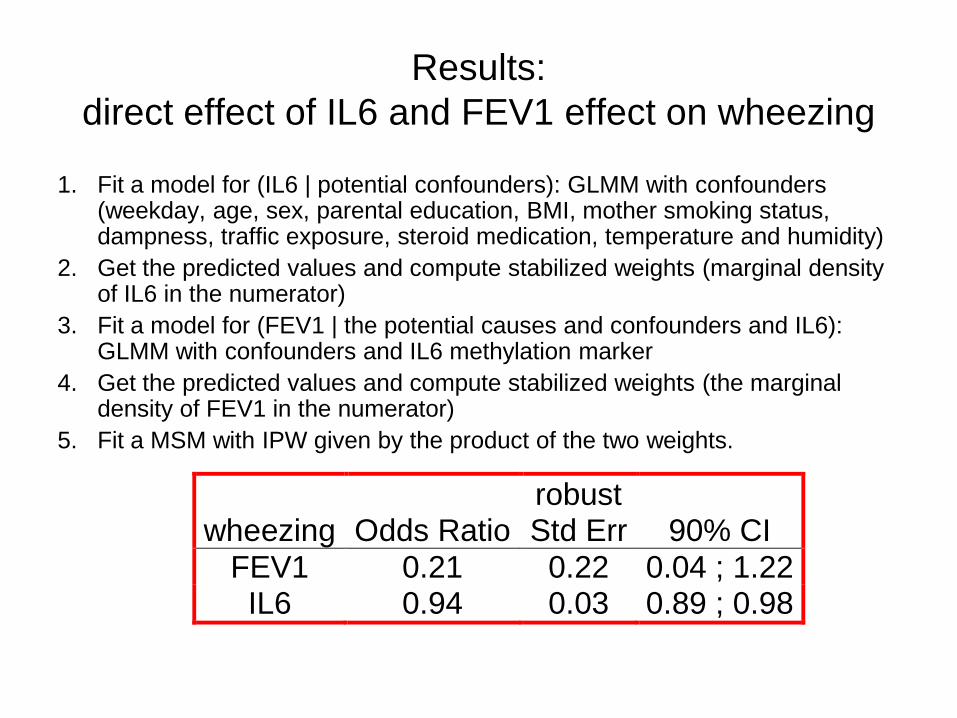
Results: direct effect of IL6 and FEV1 effect on wheezing
1. Fit a model for (IL6 | potential confounders): GLMM with confounders (weekday, age, sex, parental education, BMI, mother smoking status, dampness, traffic exposure, steroid medication, temperature and humidity)
2. Get the predicted values and compute stabilized weights (marginal density of IL6 in the numerator)
3. Fit a model for (FEV1 | the potential causes and confounders and IL6): GLMM with confounders and IL6 methylation marker
4. Get the predicted values and compute stabilized weights (the marginal density of FEV1 in the numerator)
5. Fit a MSM with IPW given by the product of the two weights.
robust wheezing Odds Ratio Std Err 90% CI
FEV1 0.21 0.22 0.04 ; 1.22 IL6 0.94 0.03 0.89 ; 0.98
discussion - 1
• Each child was assessed twice for DNA methylation markers, on the fourth and seventh day of follow-up. Associations between FEV-1 / FeNO and DNA methylation markers may be the results of subject’s stable methylation status with severity of the disease, or short-term variation of clinical and methylation status. Two days lag could be too short time span.We found moderately low intraclass correlation coefficients (ALU r=0.20; LINE-1 0.10; IL-6 0.08; iNOS 0.43). The FEV-1 showed intraclass correlation coefficient of 0.47, FeNO 0.84 presence/absence of wheezing a weighted kappa of 0.79.
• We provide some evidence to the existence of short-term changes in DNA methylation and their association with asthma course and severity.
discussion - 2
• Promoter hypomethylation is usually associated with enhanced transcription of the gene. In our data suggests demethylation of their promoter regions provides independent contributions to the control of FeNO levels. Therefore our data suggest that increases in IL-6 expression may either increase iNOSexpression, or cause post-transcriptional modifications.
• Moreover we showed that those changes in DNA methylation can be detected in nasal cell DNA.
• Lower methylation levels in the IL-6 promoter were moderately associated with airway obstruction (reflected by PIKO FEV1) as well as with wheezing. IL-6 expression has been consistently shown to be related to airway inflammation, and IL-6 increases have been previously shown to be tightly associated with decreases in FEV1.
discussion - 3
• Our study did not show independent association of DNA methylation in Alu / LINE-1 repetitive elements with FeNO, FEV-1 or wheezing. In our data, LINE-1 methylation was negatively associated with IL-6methylation and positively associated with iNOS promoter. This finding is consistent with previous reports. Our data indicate that the association of LINE-1 with health outcomes might just due to positive and/or negative association with gene promoters’ methylation levels.
• Our study was based on analysis of DNA methylation using pyrosequencing, which is highly reproducible and accurate at quantifying DNA methylation (Bollati Cancer Res 2007; Yang NAR 2004).
Conclusion
• In this panel study of asthma children in Milazzo, Italy, we found that DNA methylation of the iNOS and IL-6 genes in nasal cell DNA was associated with measures of airway inflammation and obstruction.
• In particular, in univariate regression models lower iNOS promoter methylation was associated with higher FeNO, whereas in multivariate regression lower methylation of both the iNOS and IL-6promoters were independently associated with higher FeNO. We also found that lower methylation of the IL-6 promoter was associated with airway obstruction, as reflected in higher FEV-1 and wheezing, though both associations were estimated with large imprecision.

Acknowledgments
Environment and Health in Sicily Project – WHO Europe, Health Impact Assessment, Methods and Strategies Office
Air pollution and health: multidisciplinary integrated program of environmental, epidemiological, biomolecular, and clinical-experimental investigations -PRIN20072S2HT8 Ministry of Education and Scientific Research, Italy


![Unique Oxidative Stress Markers · Oxidative Stress Markers Overview ... anti-Acrolein [ACR], mAb (5F6) ... antioxidants such as Vitamin E.](https://static.fdocuments.in/doc/165x107/5ad2ff3f7f8b9a05208d5d5f/unique-oxidative-stress-markers-oxidative-stress-markers-overview-anti-acrolein.jpg)