A ol 5 N 1 EEG Signal Analysis of Writing and Typing ... · A ol 5 N 1 - 62 - EEG Signal Analysis...
6
International Journal of Interactive Multimedia and Artificial Intelligence, Vol. 5, Nº 1 - 62 - EEG Signal Analysis of Writing and Typing between Adults with Dyslexia and Normal Controls Harshani Perera 1 , Mohd Fairuz Shiratuddin 1 , Kok Wai Wong 1 , Kelly Fullarton 2 * 1 School of Engineering and Information Technology, Murdoch University, Murdoch (Australia) 2 DSF Literacy and Clinical Services, (The Dyslexia-SPELD Foundation), South Perth (Australia) Received 12 November 2017 | Accepted 14 February 2018 | Published 20 Abril 2018 I. Introduction D yslexia is a hidden specific learning disability that affects a significant amount of the world population, it is neurological in origin and causes difficulties in reading and spelling despite average or above average intelligence and acceptable exposure to literacy instructions [1-3]. Dyslexia screening assessments are based on a review of biographical information, educational history, behavioural aspects and academic indicators such as reading, spelling, writing, working memory and processing abilities [4]. Common symptoms of dyslexia include failure to attain sufficient reading skills and poor writing skills compared to peers despite conventional teaching guidelines. Typing is a modern-day task that often replaces writing, but still, affects people with dyslexia in a similar manner when it comes to spelling. In addition to these behavioural symptoms seen externally, past studies have uncovered neurological differences in individuals with dyslexia. These include unique brain structures as well as distinctions in brain behaviours compared to normal controls [5]. Electroencephalography, commonly known as EEG, is a technique that helps to capture neurological behaviours. In our previous work we have covered past work carried out to identify unique brainwave activation patterns using EEG and identified gaps to be filled in the literature about these unique EEG signal patterns pertaining to dyslexia, in particular the EEG patterns while performing tasks that are more challenging for individuals with dyslexia [1, 6]. Hence, in this paper we have selected two of such tasks that are more challenging for individuals with dyslexia, namely writing and typing and aim to identify unique EEG signal patterns generated while performing these tasks. The purpose of the analysis is to identify whether the difficulties seen in individuals with dyslexia during writing and typing are reflected in the brainwave signal patterns. This paper covers the EEG signal acquisition, signal processing, classification using machine learning and future work. II. EEG Signal Acquisition The EEG headset used for this research was the Cognionics 32-channel dry EEG headset, and the EEG was recorded at a sampling rate of 300Hz. The EEG channel map is depicted in Fig. 1 where the channels used on this specific EEG headset are indicated in grey. This research was carried out with a total of 32 participants, where 17 participants were individuals with dyslexia (7 males and 10 females) and 15 participants were normal controls (8 males and 7 females). The number of participants was determined using the Altman’s Nomogram sample size calculation as shown in Fig. 2. Therefore, for a power of 0.80 (p-value significance of 0.05) and a standardised difference value between 0.8 and 1.0 (Cohen’s d effect size), the total amount of participants would range between 30-50. Hence, the number of participants per group would range between 15-25. The inclusion and exclusion criteria of participants was 18 years and above, right-handed, fluent in English, have a normal or corrected-to-normal vision and normal hearing. The participants in the group with dyslexia had to be diagnosed by a psychologist as having dyslexia and the control group had to be free from motor and neurological conditions such as dyslexia, ADHD and autism. The participants with dyslexia were recruited with the help of DSF Literacy and Clinical Services in Western Australia (The Dyslexia-SPELD Foundation). Keywords Dyslexia, Electroencephalography, Machine Learning, Classification, Support Vector Machines. Abstract EEG is one of the most useful techniques used to represent behaviours of the brain and helps explore valuable insights through the measurement of brain electrical activity. Hence, plays a vital role in detecting neurological conditions. In this paper, we identify some unique EEG patterns pertaining to dyslexia, which is a learning disability with a neurological origin. Although EEG signals hold important insights of brain behaviours, uncovering these insights are not always straightforward due to its complexity. We tackle this using machine learning and uncover unique EEG signals generated in adults with dyslexia during writing and typing as well as optimal EEG electrodes and brain regions for classification. This study revealed that the greater level of difficulties seen in individuals with dyslexia during writing and typing compared to normal controls are reflected in the brainwave signal patterns. * Corresponding author. E-mail addresses: [email protected] (H. Perera), [email protected] (M. F. Shiratuddin), k.wong@ murdoch.edu.au (K. W. Wong), [email protected] (K. Fullarton). DOI: 10.9781/ijimai.2018.04.005
Transcript of A ol 5 N 1 EEG Signal Analysis of Writing and Typing ... · A ol 5 N 1 - 62 - EEG Signal Analysis...

International Journal of Interactive Multimedia and Artificial Intelligence, Vol. 5, Nº 1
- 62 -
EEG Signal Analysis of Writing and Typing between Adults with Dyslexia and Normal ControlsHarshani Perera1, Mohd Fairuz Shiratuddin1, Kok Wai Wong1, Kelly Fullarton2 *
1 School of Engineering and Information Technology, Murdoch University, Murdoch (Australia) 2 DSF Literacy and Clinical Services, (The Dyslexia-SPELD Foundation), South Perth (Australia)
Received 12 November 2017 | Accepted 14 February 2018 | Published 20 Abril 2018
I. Introduction
Dyslexia is a hidden specific learning disability that affects a significant amount of the world population, it is neurological in
origin and causes difficulties in reading and spelling despite average or above average intelligence and acceptable exposure to literacy instructions [1-3]. Dyslexia screening assessments are based on a review of biographical information, educational history, behavioural aspects and academic indicators such as reading, spelling, writing, working memory and processing abilities [4]. Common symptoms of dyslexia include failure to attain sufficient reading skills and poor writing skills compared to peers despite conventional teaching guidelines. Typing is a modern-day task that often replaces writing, but still, affects people with dyslexia in a similar manner when it comes to spelling.
In addition to these behavioural symptoms seen externally, past studies have uncovered neurological differences in individuals with dyslexia. These include unique brain structures as well as distinctions in brain behaviours compared to normal controls [5]. Electroencephalography, commonly known as EEG, is a technique that helps to capture neurological behaviours. In our previous work we have covered past work carried out to identify unique brainwave activation patterns using EEG and identified gaps to be filled in the literature about these unique EEG signal patterns pertaining to dyslexia, in particular the EEG patterns while performing tasks that are more challenging for individuals with dyslexia [1, 6]. Hence, in this paper we have selected two of such tasks that are more challenging
for individuals with dyslexia, namely writing and typing and aim to identify unique EEG signal patterns generated while performing these tasks. The purpose of the analysis is to identify whether the difficulties seen in individuals with dyslexia during writing and typing are reflected in the brainwave signal patterns. This paper covers the EEG signal acquisition, signal processing, classification using machine learning and future work.
II. EEG Signal Acquisition
The EEG headset used for this research was the Cognionics 32-channel dry EEG headset, and the EEG was recorded at a sampling rate of 300Hz. The EEG channel map is depicted in Fig. 1 where the channels used on this specific EEG headset are indicated in grey. This research was carried out with a total of 32 participants, where 17 participants were individuals with dyslexia (7 males and 10 females) and 15 participants were normal controls (8 males and 7 females). The number of participants was determined using the Altman’s Nomogram sample size calculation as shown in Fig. 2. Therefore, for a power of 0.80 (p-value significance of 0.05) and a standardised difference value between 0.8 and 1.0 (Cohen’s d effect size), the total amount of participants would range between 30-50. Hence, the number of participants per group would range between 15-25. The inclusion and exclusion criteria of participants was 18 years and above, right-handed, fluent in English, have a normal or corrected-to-normal vision and normal hearing. The participants in the group with dyslexia had to be diagnosed by a psychologist as having dyslexia and the control group had to be free from motor and neurological conditions such as dyslexia, ADHD and autism. The participants with dyslexia were recruited with the help of DSF Literacy and Clinical Services in Western Australia (The Dyslexia-SPELD Foundation).
Keywords
Dyslexia, Electroencephalography, Machine Learning, Classification, Support Vector Machines.
Abstract
EEG is one of the most useful techniques used to represent behaviours of the brain and helps explore valuable insights through the measurement of brain electrical activity. Hence, plays a vital role in detecting neurological conditions. In this paper, we identify some unique EEG patterns pertaining to dyslexia, which is a learning disability with a neurological origin. Although EEG signals hold important insights of brain behaviours, uncovering these insights are not always straightforward due to its complexity. We tackle this using machine learning and uncover unique EEG signals generated in adults with dyslexia during writing and typing as well as optimal EEG electrodes and brain regions for classification. This study revealed that the greater level of difficulties seen in individuals with dyslexia during writing and typing compared to normal controls are reflected in the brainwave signal patterns.
* Corresponding author.E-mail addresses: [email protected] (H. Perera), [email protected] (M. F. Shiratuddin), [email protected] (K. W. Wong), [email protected] (K. Fullarton).
DOI: 10.9781/ijimai.2018.04.005

- 63 -
Regular Issue
Fig. 1. EEG channel map [7].
Fig. 2. Altman’s Nomogram calculation [8].
The participants were given a simple writing and typing task, which was designed similar to the standardised psychometric tests used in the dyslexia diagnosis process under the supervision of a psychologist specialised in dyslexia assessments. The EEG was acquired while the participants were performing the task with the EEG headset setup on his/her head. The EEG device was wirelessly paired to a computer which had the EEG data acquisition software installed. The EEG was also recorded in the relaxed state where the participants were instructed to stay seated and relaxed with their eyes closed, avoiding body movements including jaw clenches for 60 seconds at a stretch.• Writing Task - The participants were given a topic to write a simple
short paragraph. They were provided with paper and a pen, the topic given was ‘My family’.
• Typing Task - This task is similar to the writing task, where the participants were given a topic to type a simple short paragraph using a standard QWERTY keyboard. The topic given was ‘How I spent my weekend’.
III. EEG Signal Processing
The EEG signals collected from each participant were processed in multiple phases prior to the classification as depicted in Fig. 3; namely preprocessing, sub-band decomposition and feature extraction. Each phase includes sub-phases as shown in the pseudocode in Fig. 4, which will be explained in detail in the following sections.
Fig. 3. Signal processing overview.
foreach participant { foreach task { preprocess EEG signal using ASR remove electric power noise from EEG signal foreach EEGChannel { decompose signal into sub-bands (delta, theta, alpha, beta, gamma) using band-pass filters foreach sub-band { transform signal into the frequency domain using FFT calculate features: mean, median, mode, standard deviation, maximum, minimum, skewness and kurtosis } } }
Fig. 4. Signal processing pseudocode.
A. PreprocessingThe EEG signals were preprocessed in order to reduce unwanted
artefacts such as eye blinks, body movements and electric power noise. Eye blinks and body movements were filtered using Artefact Subspace Reconstruction (ASR) which ‘relies on a sliding-window Principal Component Analysis, which statistically interpolates any high-variance signal components exceeding a threshold relative to the covariance of the calibration dataset. Each affected time point of EEG is then linearly reconstructed from the retained signal subspace based on the correlation structure observed in the calibration data’ [1, 9]. This was performed using the EEGLAB ASR plugin where the inputs were the relaxed state EEG that was the calibration dataset and the actual experiment task EEG. Shown below in Fig. 5 is a raw experiment EEG with the unwanted artefacts and in Fig. 6 the ASR filtered EEG.
Next, the electric power noise of 50Hz as shown in Fig. 7 was filtered out using a band-stop IIR Butterworth digital filter by removing at least half the power of the frequency between 49Hz to 51Hz as shown in Fig. 8.
- 64 -
International Journal of Interactive Multimedia and Artificial Intelligence, Vol. 5, Nº 1
Fig. 5. Raw EEG.
Fig. 6. ASR filtered EEG.
Fig. 7. Electric power noise at 50Hz.
Fig. 8. Filtered EEG.
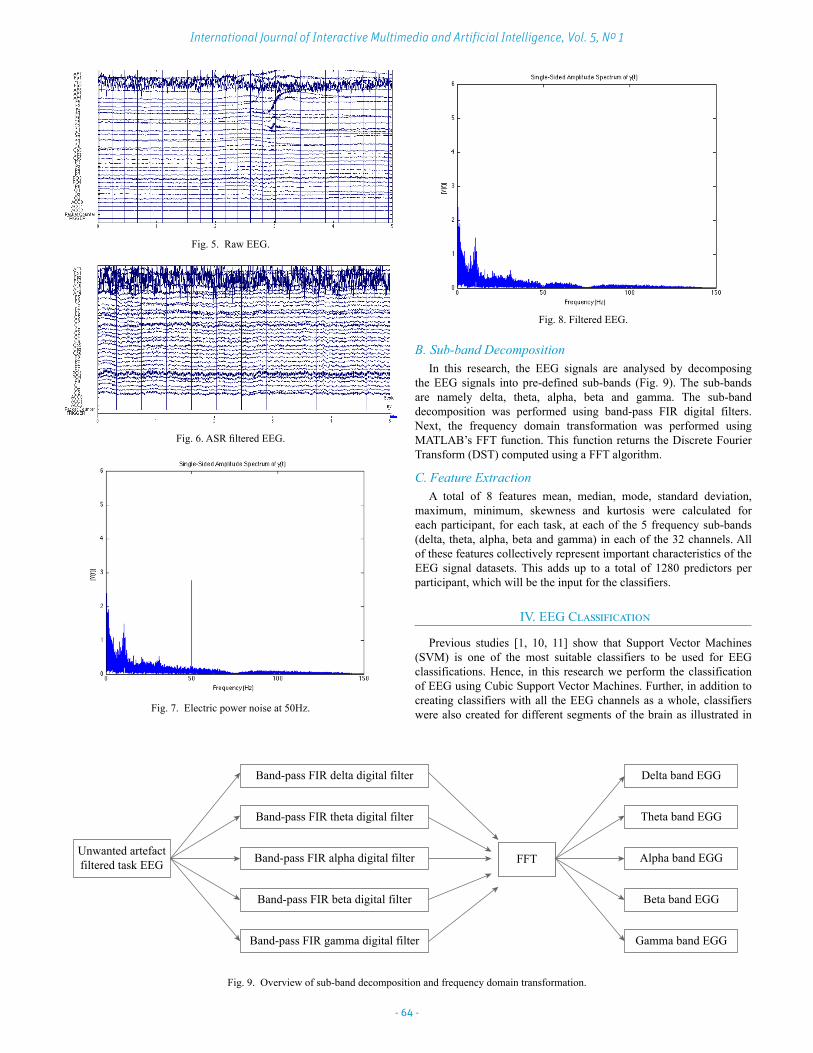
B. Sub-band DecompositionIn this research, the EEG signals are analysed by decomposing
the EEG signals into pre-defined sub-bands (Fig. 9). The sub-bands are namely delta, theta, alpha, beta and gamma. The sub-band decomposition was performed using band-pass FIR digital filters. Next, the frequency domain transformation was performed using MATLAB’s FFT function. This function returns the Discrete Fourier Transform (DST) computed using a FFT algorithm.
C. Feature ExtractionA total of 8 features mean, median, mode, standard deviation,
maximum, minimum, skewness and kurtosis were calculated for each participant, for each task, at each of the 5 frequency sub-bands (delta, theta, alpha, beta and gamma) in each of the 32 channels. All of these features collectively represent important characteristics of the EEG signal datasets. This adds up to a total of 1280 predictors per participant, which will be the input for the classifiers.
IV. EEG Classification
Previous studies [1, 10, 11] show that Support Vector Machines (SVM) is one of the most suitable classifiers to be used for EEG classifications. Hence, in this research we perform the classification of EEG using Cubic Support Vector Machines. Further, in addition to creating classifiers with all the EEG channels as a whole, classifiers were also created for different segments of the brain as illustrated in
Unwanted artefactfiltered task EEG
Delta band EGG
Theta band EGG
Alpha band EGG
Beta band EGG
Gamma band EGG
Band-pass FIR delta digital filter
Band-pass FIR gamma digital filter
Band-pass FIR theta digital filter
Band-pass FIR alpha digital filter
Band-pass FIR beta digital filter
FFT
Fig. 9. Overview of sub-band decomposition and frequency domain transformation.

- 65 -
Regular Issue
Table I. This helps to identify sections of the brain that have more prominent EEG activation patterns.
TABLE I. Feature Grouping
Area Channels
Brain Left Hemisphere Fp1, AF7, AF3, F5, F3, C5, C3, C1, Cp5, P3, P7, PO3, O1
Brain Right hemisphere Fp2, AF8, AF4, F4, F6, C2, C4, C6, Cp6, P4, P8, PO4, O2
Brain Centre Fpz, Fz, Cz, Cpz, Pz, Oz
Frontal Lobe
Frontal Pole Fp1, Fpz, Fp2
Anterior-Frontal AF7, AF3, AF4, AF8
Frontal F5, F3, FZ, F4, F6
Central LobeCentral C5, C3, C1, Cz, C2, C4, C6
Centro-Parietal Cp5, Cpz, Cp6
Parietal LobeParietal P3, Pz, P4, P7, P8
Parieto-Occipital PO3, PO4
Occipital Lobe O1, Oz, O3
The classifier outputs were measured based on the Validation Accuracy (VA), Sensitivity/True Positive Rate (TPR) and Specificity/True Negative Rate (TNR) that were calculated using the resulting confusion matrix as shown in Fig. 10 and (1), (2) and (3).
Fig. 10. Confusion matrix.
(1)
(2)
(3)
V. Results and Discussion
Poor writing skills are one of the commonly seen difficulties in individuals with dyslexia. The classifier results from the writing task, which is summarised in Table II, verify that adults with dyslexia produce unique brainwave signal patterns compared to normal controls. The peak VA of 71.88%, a sensitivity of 76.47% and specificity of 66.67% was produced from the anterior frontal classifier, which included the EEG electrodes AF7, AF3, AF4 and AF8. However, this outcome has not previously been reported in previous similar studies, and a possible explanation for this might be that because those studies had not used the EEG electrodes AF7, AF3, AF4 and AF8. The channels used in these similar studies were C3, C4, P3 and P4 [12-14]. Therefore, these results contribute towards to the pool of knowledge as a new finding. Fig. 11 depicts the positions of AF7, AF3, AF4 and AF8.
Table II. Writing Task Classifier Results
Brain Area VA % Sensitivity % Specificity %
All 59.38 64.71 53.33
Left Hemisphere 65.63 70.59 60.00
Right Hemisphere 50.00 64.71 33.33
Frontal Lobe 56.25 64.71 46.67
Central Lobe 59.38 64.71 53.33
Parietal Lobe 59.38 64.71 53.33
Occipital Lobe 62.50 64.71 60.00
Parieto-Occipital 46.88 58.82 33.33
Parieto-Occipital Left 46.88 52.94 40.00
Parieto-Occipital Right 59.38 58.82 60.00
Anterior Frontal 71.88 76.47 66.67
Table III. Typing Task Classifier Results
Brain Area VA % Sensitivity % Specificity %
All 78.13 88.24 66.67
Left Hemisphere 71.88 94.12 46.67
Right Hemisphere 62.50 76.47 46.67
Frontal Lobe 68.75 88.24 46.67
Central Lobe 68.75 82.35 53.33
Parietal Lobe 65.63 76.47 53.33
Occipital Lobe 56.25 82.35 26.67
Parieto-Occipital 62.50 70.59 53.33
Parieto-Occipital Left 68.75 76.47 60.00
Parieto-Occipital Right 68.75 76.47 60.00
Anterior Frontal 65.63 88.24 40.00
Central 68.75 76.47 60.00
Centro Parietal 59.38 76.47 40.00
Frontal Pole 68.75 94.12 40.00
Frontal 78.13 88.24 66.67
Frontal Left 68.75 82.35 53.33
Frontal Right 68.75 82.35 53.33

- 66 -
International Journal of Interactive Multimedia and Artificial Intelligence, Vol. 5, Nº 1
Fig. 11. Optimal channels for writing.
Fig. 12. Optimal channels for typing.
Typing can be considered as the modern-day replacement to writing and is yet another task found more challenging by individuals with dyslexia. Table III illustrates the behaviour of seventeen classifiers built to analyse the typing task. We examined the left hemisphere, right hemisphere, frontal lobe, central lobe, parietal lobe and the occipital lobe. Except for the parietal lobe, others showed a substantial difference between the sensitivity and specificity rates, which is not preferable. The classifiers from parietal and parieto-occipital performed fairly well. The frontal classifier showed the top VA of 78.13% with a fairly balanced specificity and sensitivity. Interestingly, this was close to the most significant region identified for writing, which was the anterior-frontal. The most significant EEG channels responsible for producing unique brainwave signals in individuals with dyslexia compared to normal controls were F5, F3, Fz, F4 and F6. Fig. 12 depicts the position of these four channels. All these findings show that EEG signals generated while typing produce unique brainwave signal patterns in adults with dyslexia compared to normal controls. Further, comparison of EEG signal patterns between persons with and without dyslexia during typing is a gap to be filled in the literature; therefore, we did not find any research results that could be directly compared against our results.
VI. Conclusions and Future Work
In this paper, we conducted research to identify whether adults with dyslexia produced unique brainwave signal patterns during writing and typing. The results show that adults with dyslexia show unique brainwave activation patterns during each task compared to normal controls. Although similar writing tasks had been investigated in past studies, the current research was conducted with additional EEG sensors and discovered a new optimal brain region anterior frontal, which has not been reported in past studies. On the other hand, the research results also uncovered novel findings for typing as this task that had not been analysed in past similar studies. This research contributes vital insights to the pool of knowledge about the unique brainwave patterns of adults with dyslexia, which could serve as a base for future studies, and could even one day, help complement the conventional dyslexia diagnosis process by giving a better view of the disability through the introduction of neurological aspects.
These preliminary findings can be further examined by making variations in parameters such as input features, channels, frequency sub-bands, kernels and more advanced classifiers such as Fuzzy SVM. This could perhaps lead towards the enhancement of result accuracies similar to how the current research obtained better results by making variations in the EEG sensors used for each classifier. The scope of this research was limited to right-handed adults. Further studies can be carried out in order to compare EEG signals of individuals below 18 years and left-handed. Comparisons of the EEG signals could also be made between the genders male and female. Further, this research can be expanded in order to identify unique brainwave signal patterns of other specific learning disabilities such as dysgraphia and dyscalculia. Lastly, the function of each brain region needs to be compared with the result outcomes in order to identify the neurological reason behind each discovery.
References
[1] H. Perera, M. F. Shiratuddin, and K. W. Wong, «A Review of Electroencephalogram-Based Analysis and Classification Frameworks for Dyslexia,» in International Conference on Neural Information Processing, 2016, pp. 626-635.
[2] J. M. Fletcher, G. R. Lyon, L. S. Fuchs, and M. A. Barnes, Learning disabilities: From identification to intervention: Guilford Press, 2006.
[3] M. F. C. A. Rani, R. Rohizan, and N. A. A. Rahman, «Web-based learning tool for primary school student with dyscalculia,» in Proceedings of the 6th International Conference on Information Technology and Multimedia, 2014, pp. 157-162.
[4] The Dyslexia-SPELD Foundation of WA. (n.d., 14 May). Consultations and Assessments. Available: http://dsf.net.au/consultations-assessments/
[5] S. Mohamad, W. Mansor, and K. Y. Lee, «Review of neurological techniques of diagnosing dyslexia in children,» in System Engineering and Technology (ICSET), 2013 IEEE 3rd International Conference on, 2013, pp. 389-393.
[6] H. Perera, M. F. Shiratuddin, and K. W. Wong, «Review of the Role of Modern Computational Technologies in the Detection of Dyslexia,» in Information Science and Applications (ICISA) 2016, K. J. Kim and N. Joukov, Eds., ed Singapore: Springer Singapore, 2016, pp. 1465-1475.
[7] Cognionics Inc. (n.d., 17 July). Channel Diagram. Available: http://cognionics.com/index.php/products/hd-eeg-systems/quick-20-dry-headset
[8] M. Bland, «Sample size for clinical trials,» ed: University of York, York, UK, 2011.
[9] T. Mullen, C. Kothe, Y. M. Chi, A. Ojeda, T. Kerth, S. Makeig, et al., «Real-time modeling and 3D visualization of source dynamics and connectivity using wearable EEG,» in Engineering in Medicine and Biology Society (EMBC), 2013 35th Annual International Conference of the IEEE, United States, 2013, pp. 2184-2187.
[10] D. Garrett, D. A. Peterson, C. W. Anderson, and M. H. Thaut, «Comparison of linear, nonlinear, and feature selection methods for EEG signal

- 67 -
Regular Issue
classification,» Neural Systems and Rehabilitation Engineering, IEEE Transactions on, vol. 11, pp. 141-144, 2003.
[11] F. Lotte, M. Congedo, A. Lécuyer, F. Lamarche, and B. Arnaldi, «A review of classification algorithms for EEG-based brain–computer interfaces,» Journal of neural engineering, vol. 4, 2007.
[12] N. Fuad, W. Mansor, and K. Y. Lee, «Wavelet packet analysis of EEG signals from children during writing,» in Computers & Informatics (ISCI), 2013 IEEE Symposium on, 2013, pp. 228-230.
[13] C. W. N. F. Che Wan Fadzal, W. Mansor, and L. Y. Khuan, «An analysis of EEG signal generated from grasping and writing,» in Computer Applications and Industrial Electronics (ICCAIE), 2011 IEEE International Conference on, 2011, pp. 535-537.
[14] A. Zabidi, W. Mansor, Y. K. Lee, and C. W. N. F. Che Wan Fadzal, «Short-time Fourier Transform analysis of EEG signal generated during imagined writing,» in System Engineering and Technology (ICSET), 2012 International Conference on, 2012, pp. 1-4.
Harshani Perera
Harshani Perera received her BSc (Hons) in Software Engineering from the University of Wales, United Kingdom and proceeded with her career in software engineering. With her passion for research, she then chose to pursue a PhD in developing a detection mechanism of learning disabilities using intelligent data analysis and classification of brainwave signals and received her PhD
in Information Technology from Murdoch University, Australia. Dr Perera's entrepreneurial passion also motivated her to co-found Inqbaytor Pty Ltd and currently continues to serve as the CEO.
Kok Wai Wong
Kok Wai Wong is currently working as an Associate Professor with the School of Engineering and Information Technology at Murdoch University in Western Australia. He is a Senior Member of IEEE, a member of ACS, and Certified Professional of ACS. He is the current Vice President (membership) for The Asia Pacific Neural Network Society (APNNS). He has also held executive
positions such as the section chair for IEEE Western Australia Section, and has also served as a member for the Emergent Technologies Technical Committee (ETTC) and Games Technical Committee (GTC) of the IEEE Computational Intelligence Society (CIS) in the past. His current research interests include Intelligent Data Mining and Data Science, Artificial Intelligence and Machine Learning, and Game and Virtual Reality Technology.
Mohd Fairuz Shiratuddin
Mohd Fairuz Shiratuddin is a Senior Lecturer in the School of Engineering and Information Technology. In his early careers, he was trained as an engineer mainly dealing with computers and its applications in the United Kingdom and Malaysia. Then he decided to pursue a career in academia. He graduated with a Bachelor of Engineering degree in Electrical & Electronics from Northumbria University at
Newcastle-upon-Tyne in the UK, a Master of Science degree in Information Technology (by research specialising in Virtual Reality) from Universiti Utara, Malaysia, a Master of Science degree in Architecture from Virginia Tech, USA, and a Doctor of Philosophy degree in Environmental Design & Planning also from Virginia Tech. Prior to working at Murdoch University, he was a Lecturer at Universiti Utara, Malaysia, and an Assistant Professor at the University of Southern Mississippi, USA. He always considers himself as a multi-disciplinary person with a lot of appreciation for arts and design, and technical development. His research interests include computer-based systems for children's teaching and learning, and stroke survivors’ rehabilitation, Virtual/Mixed/Augmented Reality, Natural User Interfaces, Games Design, Development and Technologies, and Artificial Intelligence; for practical, real-world uses. He is currently leading Project Neuromender:: A Low-Cost Home-Based Stroke Rehabilitation System. He is also working on a project to utilise augmented reality, image processing and facial recognition technologies for security purposes. He has numerous publications in national and international conference proceedings, journals, books, book chapters and reports.
Kelly Fullarton
Kelly Fullarton is a Senior Clinical Psychologist at DSF Literacy and Clinical Services (The Dyslexia-SPELD Foundation of Western Australia). Kelly has extensive experience in the field of educational psychology and learning disabilities and Kelly has been working at DSF for 12 years assessing children, teenagers and adults struggling with the acquisition of literacy and numeracy skills. Kelly
is an AHPRA approved supervisor and has been supporting Psychologists across Australia to develop their ability to diagnose specific learning disorders utilising best practice guidelines and developing a consistent approach to assessment, diagnosis and support.