A NUMERICAL METHOD FOR PREDICTING THE … NUMERICAL METHOD FOR PREDICTING THE MECHANICAL PROPERTIES...
12
21 st International Conference on Composite Materials Xi’an, 20-25 th August 2017 A NUMERICAL METHOD FOR PREDICTING THE MECHANICAL PROPERTIES OF TIGHTLY PACKED SYNTACTIC FOAMS Adam Mayall 1 , Declan Carolan 1,2 , Alexander Fergusson 1,2 , John P. Dear 2 1 FAC Technology, Canterbury Court, 1-3 Brixton Road, London, SW9 6DE, United Kingdom Email: [email protected], website www.factechnology.com 2 Department of Mechanical Engineering, Imperial College London, SW7 2AZ, United Kingdom Keywords: Syntactic foam, Finite Element Method, Micromechanics, Mechanical Properties ABSTRACT A fully automated numerical model has been created to investigate the microstructural mechanics of syntactic foam. The commercial finite element code Abaqus was used to virtually evaluate the mechanical properties of a syntactic foam in tension. A particle packing simulation was used to account for the randomness of the packing arrangements of the microspheres within the RVE. The lower volume fractions were created via a Random Sequential Adsorption procedure, while a packing algorithm based on a molecular dynamics approach was used to achieve high volume fraction microstructures. Representative elastic material parameters were selected for both the polymer matrix and the hollow microspheres. Failure of the composite was modelled using a brittle fracture approach. For the epoxy matrix and high strength hollow microsphere syntactic foam studied, it was found that the maximum specific strength occurred around 50% microsphere volume fraction, and there was a tendency for the strength variability to increase with increasing microsphere content. The numerical approach presented in this paper represents a powerful tool to greatly speed up the development of advanced lightweight structures by reducing the need for costly experimental tests to determine the optimal material composition for the specific stiffness and strength of the desired application. 1 INTRODUCTION Composite foams filled with hollow microspheres are an efficient method to reduce weight without compromising on mechanical properties. This makes them particularly suitable for aerospace, transport, renewable energy and marine applications, where lightweight, load-bearing performance is critical. The weight reduction achieved using these materials can result in fuel savings and increases in haulage capacity [1, 2]. Several authors have experimentally investigated the mechanical properties of syntactic foams including tensile [3,4] compressive [4, 5] and flexural [6] properties. These studies broadly concluded that the interaction between the microsphere and the matrix is critical in determining the overall bulk properties. Moreover, the failure mode of the syntactic foams was observed to be brittle in nature. However, the aforementioned studies provide little in the way of a fundamental understanding of the structure-property relationship of syntactic foams, and so the failure mechanism of these materials is still poorly understood. This is especially true of highly filled foams, where the packing factor of the hollow microspheres approaches the random close packing limit. A micrograph of a syntactic foam is given in Figure 1. The foam can be seen to consist of three phases: (1) the matrix, (2) the hollow glass spheres and (3) porosity. Although some porosity is visible in the micrograph, it is minimal, and therefore the effect of the voids is neglected in the present discussion. It can be observed in Figure 1 that the microstructure of syntactic foams is heterogeneous. Thus, the microstructure plays a fundamental role in determining the overall properties of the bulk composite. Many researchers have used numerical models with idealized unit cells to predict the mechanical behaviour of syntactic foams [7-10]. These models have overwhelmingly focused on the prediction of elastic properties and adopt unit cell approaches whereby all the microspheres are regularly
-
Upload
hoangkhuong -
Category
Documents
-
view
222 -
download
0
Transcript of A NUMERICAL METHOD FOR PREDICTING THE … NUMERICAL METHOD FOR PREDICTING THE MECHANICAL PROPERTIES...

21st International Conference on Composite Materials
Xi’an, 20-25th August 2017
A NUMERICAL METHOD FOR PREDICTING THE MECHANICAL PROPERTIES OF
TIGHTLY PACKED SYNTACTIC FOAMS
Adam Mayall1, Declan Carolan1,2, Alexander Fergusson1,2, John P. Dear2
1 FAC Technology, Canterbury Court, 1-3 Brixton Road, London, SW9 6DE, United Kingdom
Email: [email protected], website www.factechnology.com 2 Department of Mechanical Engineering, Imperial College London, SW7 2AZ, United Kingdom
Keywords: Syntactic foam, Finite Element Method, Micromechanics, Mechanical Properties
ABSTRACT
A fully automated numerical model has been created to investigate the microstructural mechanics of
syntactic foam. The commercial finite element code Abaqus was used to virtually evaluate the mechanical properties of a syntactic foam in tension. A particle packing simulation was used to account
for the randomness of the packing arrangements of the microspheres within the RVE. The lower volume
fractions were created via a Random Sequential Adsorption procedure, while a packing algorithm based
on a molecular dynamics approach was used to achieve high volume fraction microstructures. Representative elastic material parameters were selected for both the polymer matrix and the hollow
microspheres. Failure of the composite was modelled using a brittle fracture approach. For the epoxy
matrix and high strength hollow microsphere syntactic foam studied, it was found that the maximum specific strength occurred around 50% microsphere volume fraction, and there was a tendency for the
strength variability to increase with increasing microsphere content.
The numerical approach presented in this paper represents a powerful tool to greatly speed up the
development of advanced lightweight structures by reducing the need for costly experimental tests to determine the optimal material composition for the specific stiffness and strength of the desired
application.
1 INTRODUCTION
Composite foams filled with hollow microspheres are an efficient method to reduce weight without compromising on mechanical properties. This makes them particularly suitable for aerospace, transport,
renewable energy and marine applications, where lightweight, load-bearing performance is critical. The
weight reduction achieved using these materials can result in fuel savings and increases in haulage
capacity [1, 2]. Several authors have experimentally investigated the mechanical properties of syntactic foams including tensile [3,4] compressive [4, 5] and flexural [6] properties. These studies broadly
concluded that the interaction between the microsphere and the matrix is critical in determining the
overall bulk properties. Moreover, the failure mode of the syntactic foams was observed to be brittle in nature. However, the aforementioned studies provide little in the way of a fundamental understanding
of the structure-property relationship of syntactic foams, and so the failure mechanism of these materials
is still poorly understood. This is especially true of highly filled foams, where the packing factor of the hollow microspheres approaches the random close packing limit.
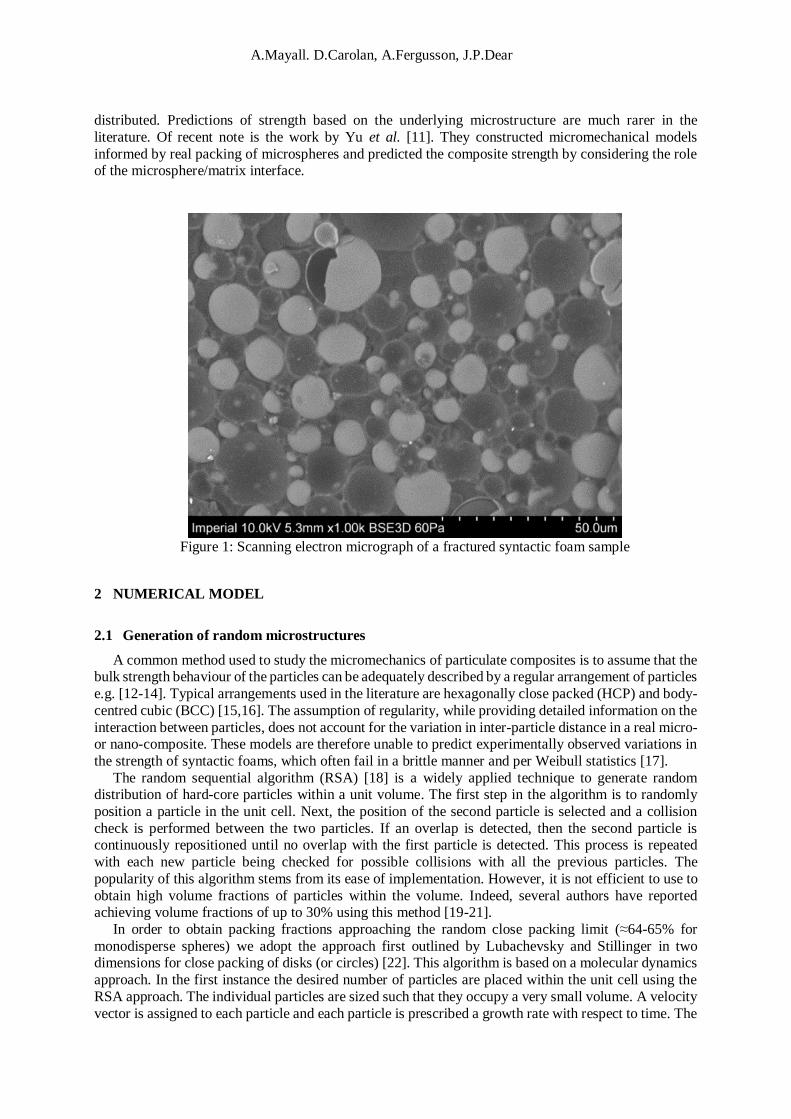
A micrograph of a syntactic foam is given in Figure 1. The foam can be seen to consist of three
phases: (1) the matrix, (2) the hollow glass spheres and (3) porosity. Although some porosity is visible
in the micrograph, it is minimal, and therefore the effect of the voids is neglected in the present discussion. It can be observed in Figure 1 that the microstructure of syntactic foams is heterogeneous.
Thus, the microstructure plays a fundamental role in determining the overall properties of the bulk
composite. Many researchers have used numerical models with idealized unit cells to predict the mechanical behaviour of syntactic foams [7-10]. These models have overwhelmingly focused on the
prediction of elastic properties and adopt unit cell approaches whereby all the microspheres are regularly
A.Mayall. D.Carolan, A.Fergusson, J.P.Dear
distributed. Predictions of strength based on the underlying microstructure are much rarer in the
literature. Of recent note is the work by Yu et al. [11]. They constructed micromechanical models
informed by real packing of microspheres and predicted the composite strength by considering the role of the microsphere/matrix interface.
Figure 1: Scanning electron micrograph of a fractured syntactic foam sample
2 NUMERICAL MODEL
2.1 Generation of random microstructures
A common method used to study the micromechanics of particulate composites is to assume that the bulk strength behaviour of the particles can be adequately described by a regular arrangement of particles
e.g. [12-14]. Typical arrangements used in the literature are hexagonally close packed (HCP) and body-
centred cubic (BCC) [15,16]. The assumption of regularity, while providing detailed information on the
interaction between particles, does not account for the variation in inter-particle distance in a real micro- or nano-composite. These models are therefore unable to predict experimentally observed variations in
the strength of syntactic foams, which often fail in a brittle manner and per Weibull statistics [17].
The random sequential algorithm (RSA) [18] is a widely applied technique to generate random distribution of hard-core particles within a unit volume. The first step in the algorithm is to randomly
position a particle in the unit cell. Next, the position of the second particle is selected and a collision
check is performed between the two particles. If an overlap is detected, then the second particle is continuously repositioned until no overlap with the first particle is detected. This process is repeated
with each new particle being checked for possible collisions with all the previous particles. The
popularity of this algorithm stems from its ease of implementation. However, it is not efficient to use to
obtain high volume fractions of particles within the volume. Indeed, several authors have reported achieving volume fractions of up to 30% using this method [19-21].
In order to obtain packing fractions approaching the random close packing limit (≈64-65% for
monodisperse spheres) we adopt the approach first outlined by Lubachevsky and Stillinger in two dimensions for close packing of disks (or circles) [22]. This algorithm is based on a molecular dynamics
approach. In the first instance the desired number of particles are placed within the unit cell using the
RSA approach. The individual particles are sized such that they occupy a very small volume. A velocity
vector is assigned to each particle and each particle is prescribed a growth rate with respect to time. The
21st International Conference on Composite Materials
Xi’an, 20-25th August 2017
first time-step, dt, is calculated to coincide with the time of the first particle-particle collision, i.e. event
driven simulation. Subsequent time-steps are calculated using the same approach. The radius of the
particles, ri, at each time-step, i, increase according to the following growth law:
ri=r0,i(1+kt) ( 1)
where k is a small positive value chosen to control the rate of growth. Collisions between particles are
treated elastically. After each time-step the energy in the system is renormalised to account for the
growth of the particles. This has the effect of increasing the ‘temperature’ of the system so that the particles do not slow down as they become increasingly massive. Periodic boundary conditions on the
faces of the unit cell are prescribed. This means that when a particle or part of a particle leaves the unit
cell through a face, it re-enters the volume at the opposing face. This greatly simplifies the calculation of particle volume fraction, which is updated after each collision event. Once the prescribed volume
fraction has been obtained, the simulation completes and a list of particle positions and radii is printed.
Each unit cell contains the equivalent of 18 complete microspheres.
2.2 Material Properties
The coordinates and radii of the randomly placed hollow spheres generated using the algorithms
described in Section 2.1 are then used to build a micromechanical model in Abaqus [23]. The microspheres chosen are IM30k from 3M [24], while an industry standard epoxy was chosen as the resin.
The failure mechanism of the epoxy resin is dominated by brittle fracture. Failure of both the resin and
microspheres was implemented through the brittle cracking constitutive model in Abaqus 6.12. The
material properties of both resin and glass microspheres are given in Table 1. The failure strength of the glass microspheres was estimated based on the reported crush strength of
the IM30k microspheres, 193 MPa, as per the data sheet. The reported crush strength is the pressure at
which 90% of the microspheres have survived a hydrostatic compression test. Treating the microspheres as a thin walled spherical vessel, it can be noted that the maximum stress in the microsphere wall can be
calculated by Pr/2t, where P is the applied pressure and r/t is the ratio of the particle radius to wall
thickness. In the simulations presented in the current work, we have assumed an r/t ratio of 10. Thus,
the estimated failure strength of the glass microspheres is calculated as approximately 5P = 5193 =
965 MPa. It is important to note that this value is a compressive strength being used as a tensile failure stress. This can be rationalised by considering the extremely small value of the wall thickness, i.e. sub-
micron, and noting the reduced potential for the existence of a critical flaw at this length scale. It is
therefore not unreasonable, in the absence of better information, to then assume that the tensile and compressive strengths of the glass are equal at this length scale.
Material Property Matrix Microsphere
Young’s Modulus, E [GPa] 3.37 70.0
Poisson Ratio, [-] 0.35 0.2
Failure Strength, σ [MPa] 105 965
Fracture toughness, GIc [kJm-2] 0.1 0.006
Density, ρ [gcm-3] 1.151 0.6
Table 1: Material properties of the matrix and microspheres
2.3 Finite Element Model
The simulations were run using Abaqus Explicit in order to capture the element failure in the brittle
cracking material model. A strain rate of 0.022%/s was applied in the positive x-direction for a total
simulated time of 100 s. Symmetric boundary conditions were applied on the three faces with a negative
normal, i.e negative x-, y- and z-direction, while the remaining two faces of the microstructural model were simulated as traction-free. The microsphere-resin interface is assumed to be a perfect bond and
modelled with tie constraints. Yu et al. [11] described the microsphere-resin interface using a traction-
A.Mayall. D.Carolan, A.Fergusson, J.P.Dear
separation curve. They noted that the parameters of the traction-separation law made a material
difference to the prediction of strength. In particular, the normal strength in the traction-separation
relation was found to be critical. Therefore, for our purposes, a tie constraint between the microsphere and the resin represents a very high-strength microsphere-resin bond. A average of 500,000 4-node
tetrahedral C3D4 elements were used to mesh each model.
The stochastic nature of the syntactic foam microstructure necessitates the investigation of several
instantiations at each volume fraction. A Python script was developed to automate the model building and execution procedures in Abaqus. The Abaqus Python scripting module was used for this purpose.
The scripting module is well suited for automated repetitive tasks, such as performing a parametric study.
Following the completion of each model the post-processing part of the script was implemented. This script interrogates each model, extracting the data of interest, e.g. a stress-strain curve and details on the
nature of the failure. A total of 30 simulations were completed for each volume fraction. Example
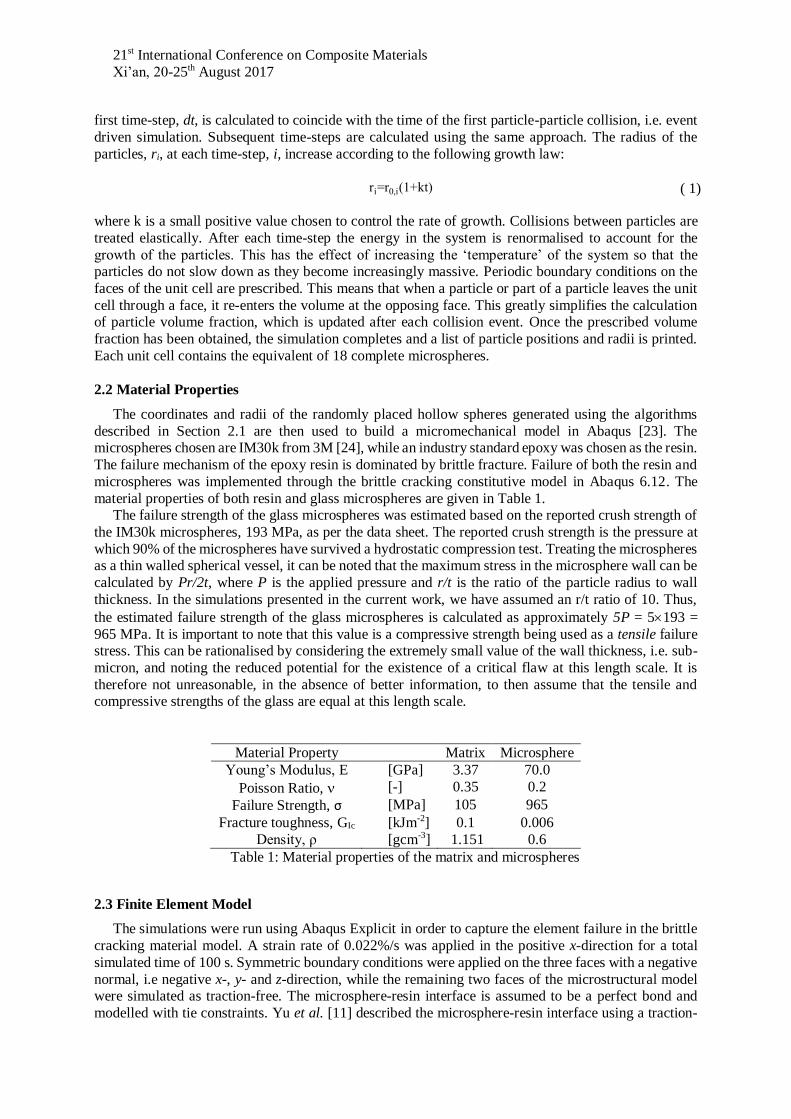
microstructures generated in the current work are given in Figure 2.
(a)
(b)
Figure 2: The FEA model of the syntactic foam for (a) vf = 5% and (b) vf = 60%. The matrix is coloured yellow whilst the microspheres are shown in grey
3 RESULTS
3.1 Comparison with analytical models
The tensile modulus predicted by the numerical model was compared with three analytical methods:
Halpin-Tsai [25], Nielsen [26], and the bounds of Hashin and Shtrikman [27]. Halpin-Tsai is a semi empirical method based on the micromechanical model developed by Hill [28] which assumes the
composite is a single fiber surrounded by a cylinder, and thus representative of the composite at a macro
level. A shape function, ξ, is used to modify the equation for different reinforcement geometries that can
be used. The composite modulus, Ec is then given by:
Ec = 1+ ξηVf
1- ηVf
Em ( 2)
where ξ is a shape function, vf is the volume fraction of the microspheres, and
η =
Ep
Em-1
Ep
Em+ξ
( 3)
In (3) Ep and Em denote the microsphere and matrix tensile modulus respectively.
21st International Conference on Composite Materials
Xi’an, 20-25th August 2017
Nielsen modified the Halpin-Tsai model by including a parameter, ψ, to account for the maximum
packing fraction of the inclusion material, such that:
Ec=1+ ξηVf
1- ηVf
Em ( 4)
ψ=1 + 1- ϕmax
ϕmax2 vf
( 5)
where ϕmax
≈ 0.64-0.65 for the random packing of monodisperse spherical particles.
Hashin and Shtrikman developed theoretical upper and lower bounds for the elastic modulus of isotropic composites based on the change in strain energy from a reference state. For a two-phase
material, the upper and lower bulk modulus, Kc, and shear modulus Gc, are
Kcupper
=Kp+ 1-vf
1
Km-Kp +
3vf3Kp+4Gp
, Kclower
=Km+vf
1
Kp-Km +
3(1-vf)
3Km+4Gm
( 6)
Gcupper
=Gp+ 1-Vf
1
Gm-Gp +
6(Kp+2Gp)vf
5Gp(3Kp+4Gp)
, Gcupper
=Gm+Vf
1
Gp-Gm +
6(Km+2Gm)(1-vf)
5Gm(3Km+4Gm)
( 7)
where the matrix and microsphere Young moduli, E, are related to the bulk modulus, K, by
Ki=Ei
3(1-2νi) ( 8)
and i denotes the particle or matrix material. The upper and lower bound for the Young’s modulus can
then be calculated using (9)
Ecj=
9KcjGc
j
3Kcj+Gc
j ( 9)
where j denotes alternately the upper and lower bounds from equations (6-7).
All three of the analytical methods presented so far have been developed for solid particles. Nielsen
recommends a correction for the hollow microspheres by calculating an apparent modulus as if it were
solid. The apparent modulus of a sphere, Eh, should be related to the cubes of the outer radius, a, and inner radius, b, such that
Eh=Es
1-(a
b)3
1+(a
b)3
( 10)
where Es is the Young’s modulus of the solid microspheres and a/b is set at 0.9 in the models presented
in this work. Eh can then be used in place of Ep in equations (3) and (8).
Figure 3 presents the predicted Young’s modulus of the syntactic foam from the numerical model,
alongside the analytical results from Halpin-Tsai, Nielsen, and Hashin-Shtrikman. The modulus of the
syntactic follows the lower bound of Hashin-Shtrikman up to 40% volume fraction, then between 40-60% the modulus shifts closer to the upper bound. The Halpin-Tsai model lies midway between the
upper and lower bounds, whilst Nielsen - which originally incorporated the maximum packing factor
because it tended to under-predict the modulus for high volume fraction fiber composites [29] – exceeds the upper bounds for volume fractions greater than 35%.
Analytical solutions for strength are limited [30] and, what exists, correlates poorly with
experimental results. At best they are empirical equations to match experimental findings with curves, with little physical basis for the models.

A.Mayall. D.Carolan, A.Fergusson, J.P.Dear
Figure 3: Comparison between the Young’s modulus predicted by the numerical model and the
analytical methods: Halpin Tsai (H-T), Nielsen, and the Hashin-Shtrikman bounds (H-S)
3.2 Tensile Stiffness
The Young’s modulus and the specific modulus are plotted in Figure 4. For a syntactic foam with
microspheres that have an apparent stiffness greater than the matrix modulus, as modelled here, the
syntactic foam stiffness is positively correlated with microsphere volume fraction. Furthermore, the microspheres have a lower density than the matrix material and so for the lightest and stiffest syntactic
foam it is desirable to obtain the highest particle packing. At 60% vf the specific modulus is more than
2.5 times the specific modulus at 5% vf. However, it should be noted that whilst the standard deviations are all less than 10%, which is consistent with experimental observations in the literature [31], the scatter
tends to increase with higher volume fractions.
Figure 4: Numerically predicated Young’s modulus and specific modulus
3
4
5
6
7
8
9
0 10 20 30 40 50 60 70
Youn
gs
Modulu
s (G
Pa)
Volume Fraction (%)
Numerical
H-T
Nielsen
H-S Upper
H-S Lower
0
1
2
3
4
5
6
7
8
9
10
0 10 20 30 40 50 60 70
Youngs
Modulu
s (G
Pa)
/ S
pec
ific
Modulu
s (G
Pa/
g c
m-3
)
Volume Fraction (%)
E
E/ρ

21st International Conference on Composite Materials
Xi’an, 20-25th August 2017
3.3 Tensile Strength
The strength and specific strength for the syntactic foam are presented in Figure 5. All the samples
failed elastically and significantly below the tensile yield strength of the matrix resin. It was found that marginally higher strengths were achieved at higher volume fractions, with the maximum at 50%, after
which it starts to decrease again. However, it should be noted that, given the scatter within the predicted
data it would be wrong to conclude that there is any meaningful difference in the average strength
between the different volume fractions. In particular, there is a significant increase in the standard deviation at 60%, as was observed with the stiffness results. Whilst the failure strength may fluctuate
depending on the composition of the syntactic foam, the ductility monotonically decreases when the vf
of microspheres is increased, as shown in Figure 6.
Figure 5: Numerically predicted strength and specific fracture strength
Figure 6: Numerically predicted failure strain
0
10
20
30
40
50
60
70
0 10 20 30 40 50 60 70
Str
ength
(M
Pa)
/
Spec
ific
Str
ength
(M
Pa/
g c
m-3
)
Volume Fraction (%)
σ
σ/ρ
0
0.2
0.4
0.6
0.8
1
1.2
1.4
1.6
0 10 20 30 40 50 60 70
Fai
lure
Str
ain (
%)
Volume Fraction (%)

A.Mayall. D.Carolan, A.Fergusson, J.P.Dear
Given that syntactic foams tend to fail in a brittle manner rather than through plastic deformation, a
Weibull analysis of the strength data is more appropriate than merely calculating an average and standard
deviation. The Weibull distribution has been extensively used in the ceramic community to describe the strength distribution in brittle materials. The theory is based on the weakest link hypothesis, where a
specimen will fail due to its weakest volume element. These weaknesses arise in the material due to
homogeneously distributed flaws. In the numerical model, the weaknesses are accounted for by the
variations in the inter-particle distance between neighbouring particles in the syntactic foam, resulting in a variation in the stress concentrations at the particle-matrix interface under loading. This can be
clearly observed in Figure 7, which shows the progression of the failure for both 5% and 60% vf syntactic
foams. The fringe plots represent the maximum principal stress in each element and the images depict the stress-state (I) immediately before fracture, (II) during fracture and (III) immediately post – fracture.
At low volume fractions there are fewer particles to obstruct the crack propagation and so the predicted
material strength should be more consistent between tests compared to high volume fraction syntactic
foams. For both volume fractions only the resin fractured; the microspheres remained unbroken and the crack travelled around them. This is unsurprising as the iM30k microspheres are a very high strength
material that can be used for load-bearing applications.
I II III
(a) 5% vf syntactic foam
I II III
(b) 60% vf syntactic foam
Figure 7: Crack development through the syntactic foam at timesteps (I) immediately preceding, (II), during, and (III) immediately post fracture for (a) vf = 5% and (b) vf = 60%

21st International Conference on Composite Materials
Xi’an, 20-25th August 2017
Weibull [17] used a statistical approach to calculate the probability of failure for a material, Pf, when
subjected to a uniform stress, σ:
Pf=1-e[-(
σ
σ0)
m
] ( 11)
where σ0 is the characteristic strength and m is the shape parameter for the Weibull distribution, known
as the Weibull modulus. The characteristic strength represents the stress at which the probability of
failure is 63%, and is a more accurate representation of the expected strength of a brittle material
compared to the average strength; the Weibull modulus indicates the degree of scatter in the data. Equation (11) is the two-parameter form of the Weibull model and therefore the most conservative as it
assumes there is no lower limit at which failure can occur. For most brittle materials, the Weibull
modulus is typically around 10 [32]. The Weibull modulus and characteristic strength can be found by using ( 12)
ln (ln (1
1-Pf
)) =m ln σ -m ln σ0 ( 12)
and plotting ln (ln (1
1-Pf
)) against ln (σ), as detailed in ASTM C1239 [33]
In this study, it was found that the Weibull modulus, Figure 8, was between 10-14 for syntactic foams of 10-55% volume fraction. There is a significant decrease in the Weibull modulus at 60% vf,
with m less than 5. In addition, the maximum characteristic strength is reached at about 50% vf, Figure
9. Thus it can be seen that for a syntactic foam to have the least scatter in maximum tensile strength, a
syntactic foam that has a vf about 10-15% lower than the theoretical maximum is optimal. This will optimise both the design strength of the syntactic foam, while also maximising the reduction in weight
of the component.
Figure 8: Numerically predicted Weibull modulus
0
2
4
6
8
10
12
14
16
0 10 20 30 40 50 60 70
Wei
bull
Modulu
s ()
Volume Fraction (%)

A.Mayall. D.Carolan, A.Fergusson, J.P.Dear
Figure 9: Numerically predicted characteristic strength
4 CONCLUSIONS
This paper presents a robust numerical method to virtually evaluate the tensile properties of high
volume fraction syntactic foams. A Python script was developed to automatically preprocess, run, and
post-process a large number of Abaqus finite element models without any user intervention, thereby generating enough sample data to account for the random packing arrangement of microspheres to be
analysed using Weibull statistics.
The results showed submaximal packing of microspheres is optimal for both peak strength and specific strength. The microspheres modelled here are high strength and do not fail in the model. There
is little significant change in strength between the different volume fraction syntactic foams, apart from
at high volume fractions where failure appears to be controlled by the inter-microsphere distance. The current work focuses exclusively on syntactic foams incorporating particles with a length scale
of the order of microns but the numerical framework can easily be extended to investigate the
mechanical behavior of other particulate composite at different scales, e.g. concrete and nano-toughened
polymers, or other particles geometries such as ellipses and disks. Furthermore, other mechanical properties can be virtually tested such as compression, shear, thermal expansion and conductivity,
provided the appropriate material model is specified.
ACKNOWLEDGEMENTS
The authors would like to thank Innovate UK for grant funding related to prior projects that led to
this research.
0
10
20
30
40
50
60
70
0 10 20 30 40 50 60 70
Char
ater
isti
c S
tren
gth
(M
Pa)
Volume Fraction (%)

21st International Conference on Composite Materials
Xi’an, 20-25th August 2017
REFERENCES
[1] P.K. Rohatgi, N. Gupta, B.F. Schultz and D.D. Luong, The synthesis, compressive
properties, and applications of metal matrix syntactic foams, JOM Journal of the Minerals,
Metals & Materials Society, 63 (2), 2011, 30-36
[2] S.E Zeltmann, B. Chen and N. Gupta, “Mechanical properties of epoxy-matrix-borosilicate
glass hollow-particle syntactic foams,” Materials Performance and Characterization, 6 (1),
2017, 11-16
[3] R. Nagorny and N. Gupta, Tensile properties of glass microballoon-epoxy resin syntactic
foams, Journal of Applied Polymer Science, 102(2), 2006, 1254-1261.
[4] E. Zegeye, A.K. Ghamsari, and E. Woldesenbet, Mechanical properties of graphene
platelets reinforced syntactic foams, Composites Part B: Engineering, 60, 2014, 268-273.
[5] E. Rizzi, E. Papa and A. Corigliano, Mechanical behavior of a syntactic foam: experiments
and modelling, International Journal of Solids and Structures, 37(40), 2000, 5773-5794.
[6] L. Wang, J. Zhang, X. Yang, C. Zhang, W. Gong and J. Yu, Flexural properties of epoxy
syntactic foams reinforced by fiberglass mesh and/or short glass fiber, Materials & Design,
55, 2014, 929-936.
[7] P.R. Marur, Estimation of effective elastic properties and interface stress concentrations in
particulate composites by unit cell methods, Acta Materialia, 52(5), 2004, 1263-1270.
[8] G. Nian, Y. Shan, Q. Xu, S. Qu and Q. Yang, Failure analysis of syntactic foams: A
computational model with cohesive law and XFEM, Composites Part B, 89, 2016, 18-26.
[9] F.V Antunes, J.A.M. Ferreira and C. Capela, Numerical modelling of the Young’s modulus
of syntactic foams,” Finite Elements in Analysis and Design, 47(2), 2011, 78-84.
[10] L. Bardella, A. Sfreddo, C. Ventura, M. Porfir and N. Gupta, A critical evaluation of
micromechanical models for syntactic foams, Mechanics of Materials, 50, 2012, 53-69.
[11] M. Yu, P. Zhu and Y. Ma, Experimental study and numerical prediction of tensile strength
properties and failure modes of hollow spheres filled syntactic foams, Computational
Materials Science, 63, 2012, 232-243.
[12] C. Zhang, W.K. Brinienda, R.K. Goldberg and L.W. Kohlmann, Meso-scale modelling of
single layer triaxial braided composite using finite element method, Composites Part A:
Applied Science and Manufacturing, 58, 2014, 36-46.
[13] Q. Meng and Z. Wang, Prediction of interfacial strength and failure mechanisms in particle-
reinforced metal-matrix composites based on a micromechanical model, Engineering
Fracture Mechanics, 142, 2105, 170-183.
[14] S. Banerjee, B.V. Sankar, Mechanical properties of hybrid composites using finite element
method based micromechanics, Composite Part B: Engineering, 58, 2014, 318-327.
[15] F.J. Guild and R.J. Young, A predictive model for particulate filled composite materials.
Part 2: Soft particles, Journal of Materials Science, 24(7), 1989, 2454-2460.
[16] Y. Huang and A.J. Kinloch, Modelling of the toughening mechanisms in rubber-modified
epoxy polymers. 1. Finite-element analysis studies, Journal of Materials Science, 27, 1992,
2753-2762.

A.Mayall. D.Carolan, A.Fergusson, J.P.Dear
[17] W. Weibull, A statistical theory of the strength of materials, Ingenioersvetenskapsakad
Handlingar, 151, 1939, 1-45.
[18] B. Widom, Random sequential addition of hard spheres to a volume, The Journal of
Chemical Physics, 22, 1966, 3888-3894.
[19] J. Segurdo and J. Lorca, A numerical approximation to the elastic properties of sphere-
reinforced composites, Journal of the Mechanics and Physics of Solids, 50, 2002, 2107-
2121.
[20] R.B. Barello and M. Levesque, Comparison between the relaxation spectra obtained from
homogenization models and finite elements simulation for the same composite,
International Journal of Solids and Structures, 2, 2008, 1279-1298.
[21] E. Ghossein and M. Levesque, Random generation of periodic hard ellipsoids based on
molecular dynamics: A computationally-efficient algorithm, Journal of Computational
Physics, 253, 2013, 471-490.
[22] B.D. Lubachevsky and F.H. Stillinger, Geometric properties of random disk packings,
Journal of Statistical Physics, 50, 1990, 561-583.
[23] Abaqus 6.12, 2012, Dassault Systems Simulia Corp, Providence, RI, USA.
[24] “3M Microspheres Selection Guide,” multimedia.3m.com/mws/media/130063O/3mtm-
glass-bubbles-selection-guide.pdf,” Last Accessed 18th May 2017.
[25] J.C. Halpin and J.L. Kardos, The Halpin Tsai Equations: A Review, Polymer Engineering
& Science, 16, 1976, 344-352
[26] L.E. Nielsen, Elastic Modulus of syntactic foams, Journal of Polymer Science: Polymer
Physics Edition, 21, 1983, 1567-1568.
[27] Z. Hashin and S.Shtrikman, A Variational Approach to the Theory of The Elastic Behavior
of Multiphase Materials. Journal of the Mechanics and Physics of Solids, 11, 1963, 127 -
140.
[28] R. Hill, Elastic properties of reinforced solids: Some theoretical principles, Journal of the
Mechanics and Physics of Solids, 11, 1963, 357-372
[29] C. L Tucker III and E. Liang, Stiffness predictions for unidirectional short-fiber composites:
Review and evaluation, Composites Science and Technology, 59, 1999, 655-671
[30] S. Ahmed and F.R. Jones, A review of particulate reinforcement theories for polymer
composites, Journal of Material Science, 25, 1990, 4933-4942
[31] E.M. Wouterson, F.Y.C. Boey, X. Hu and S.C. Wong, Specific properties and fracture
toughness of syntactic foam: Effect of foam microstructures, Composites Science and
Technology, 60, 2005, 1840-1850.
[32] J.B. Watchman, W.R.Cannon, M.J. Matthewson, Mechanical properties of Ceramics, 2nd
Edition,Wiley-Interscience, 1996
[33] ASTM C1239, Standard Practice for Reporting Uniaxial Strength Data and Estimating
Weibull Distribution Parameters for Advanced Ceramics. ASTM Int.; West Conshohocken,
PA, USA: 1995